
Exhibit (C)(8)
Project Prism: Discussion Materials July 2026
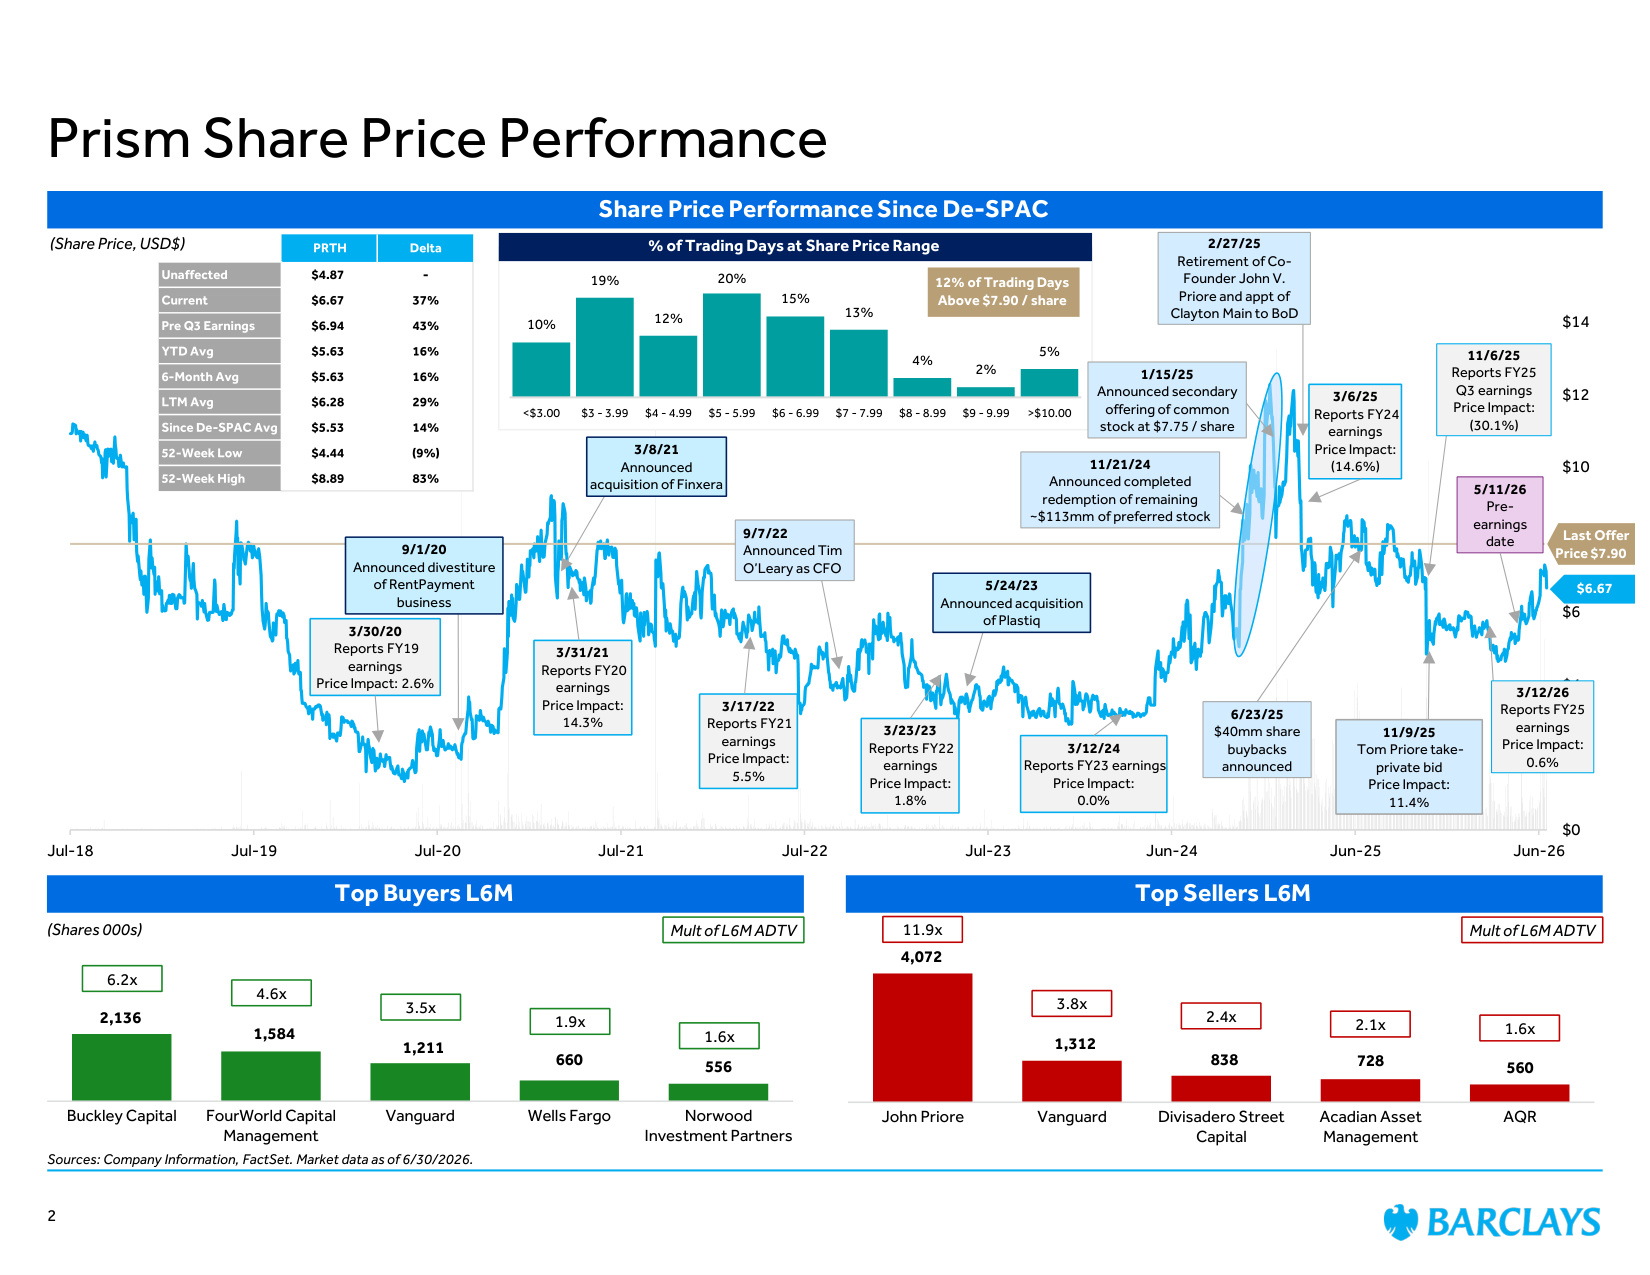
2,136 1,584 1,211 660 556 Buckley Capital FourWorld Capital Management Vanguard Wells Fargo Norwood Investment Partners 4,072 1,312 838 728 560 John Priore Vanguard Divisadero Street Capital Acadian Asset Management AQR Jul-18 Jul-19 Jul-20 Jul-21 Jul-22 Jul-23 Jun-24 Jun-25 Jun-26 $0 $2 $4 $6 $8 $10 $12 $14 Sources: Company Information, FactSet. Market data as of 6/30/2026. Prism Share Price Performance Share Price Performance Since De-SPAC (Share Price, USD$) 2 6/23/25 $40mm share buybacks announced 3/17/22 Reports FY21 earnings Price Impact: 5.5% $6.67 3/23/23 Reports FY22 earnings Price Impact: 1.8% 3/12/24 Reports FY23 earnings Price Impact: 0.0% 2/27/25 Retirement of Co- Founder John V. Priore and appt of Clayton Main to BoD Last Offer Price $7.90 9/7/22 Announced Tim O'Leary as CFO 5/24/23 Announced acquisition of Plastiq 3/31/21 Reports FY20 earnings Price Impact: 14.3% 3/30/20 Reports FY19 earnings Price Impact: 2.6% 9/1/20 Announced divestiture of RentPayment business 10% 19% 12% 20% 15% 13% 4% 2% 5% <$3.00 $3 - 3.99 $4 - 4.99 $5 - 5.99 $6 - 6.99 $7 - 7.99 $8 - 8.99 $9 - 9.99 >$10.00 % of Trading Days at Share Price Range 3/6/25 Reports FY24 earnings Price Impact: (14.6%) PRTH Delta Unaffected $4.87 - Current $6.67 37% Pre Q3 Earnings $6.94 43% YTD Avg $5.63 16% 6-Month Avg $5.63 16% LTM Avg $6.28 29% Since De-SPAC Avg $5.53 14% 52-Week Low $4.44 (9%) 52-Week High $8.89 83% 11/6/25 Reports FY25 Q3 earnings Price Impact: (30.1%) 11/9/25 Tom Priore take- private bid Price Impact: 11.4% 3/12/26 Reports FY25 earnings Price Impact: 0.6% 3/8/21 Announced acquisition of Finxera 1/15/25 Announced secondary offering of common stock at $7.75 / share 11/21/24 Announced completed redemption of remaining ~$113mm of preferred stock 12% of Trading Days Above $7.90 / share Top Buyers L6M Top Sellers L6M 5/11/26 Pre- earnings date (Shares 000s) 6.2x 4.6x 3.5x 1.9x 1.6x Mult of L6M ADTV 11.9x 3.8x 2.4x 2.1x 1.6x Mult of L6M ADTV
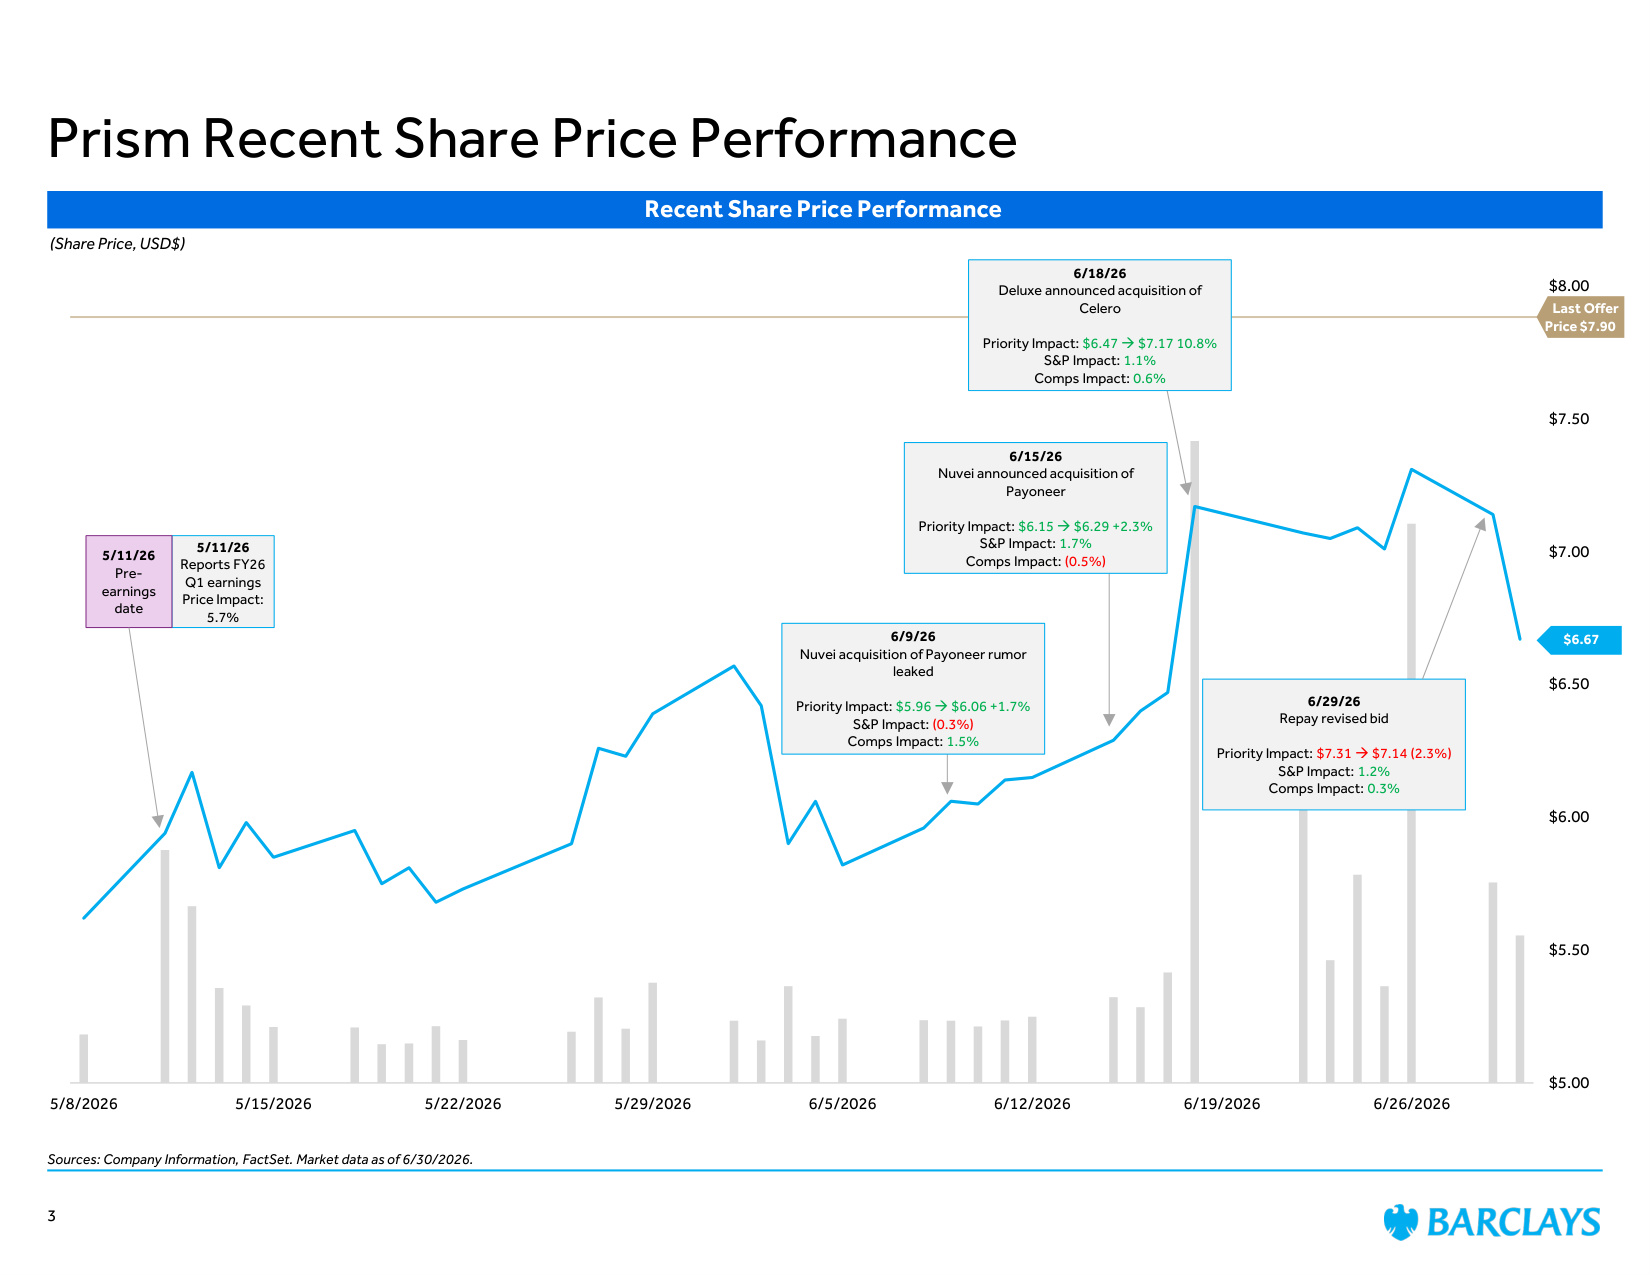
5/8/2026 5/15/2026 5/22/2026 5/29/2026 6/5/2026 6/12/2026 6/19/2026 6/26/2026 $5.00 $5.50 $6.00 $6.50 $7.00 $7.50 $8.00 Sources: Company Information, FactSet. Market data as of 6/30/2026. Prism Recent Share Price Performance Recent Share Price Performance (Share Price, USD$) $6.67 Last Offer Price $7.90 5/11/26 Reports FY26 Q1 earnings Price Impact: 5.7% 5/11/26 Pre- earnings date 3 6/18/26 Deluxe announced acquisition of Celero Priority Impact: $6.47 → $7.17 10.8% S&P Impact: 1.1% Comps Impact: 0.6% 6/15/26 Nuvei announced acquisition of Payoneer Priority Impact: $6.15 → $6.29 +2.3% S&P Impact: 1.7% Comps Impact: (0.5%) 6/9/26 Nuvei acquisition of Payoneer rumor leaked Priority Impact: $5.96 → $6.06 +1.7% S&P Impact: (0.3%) Comps Impact: 1.5% 6/29/26 Repay revised bid Priority Impact: $7.31 → $7.14 (2.3%) S&P Impact: 1.2% Comps Impact: 0.3%
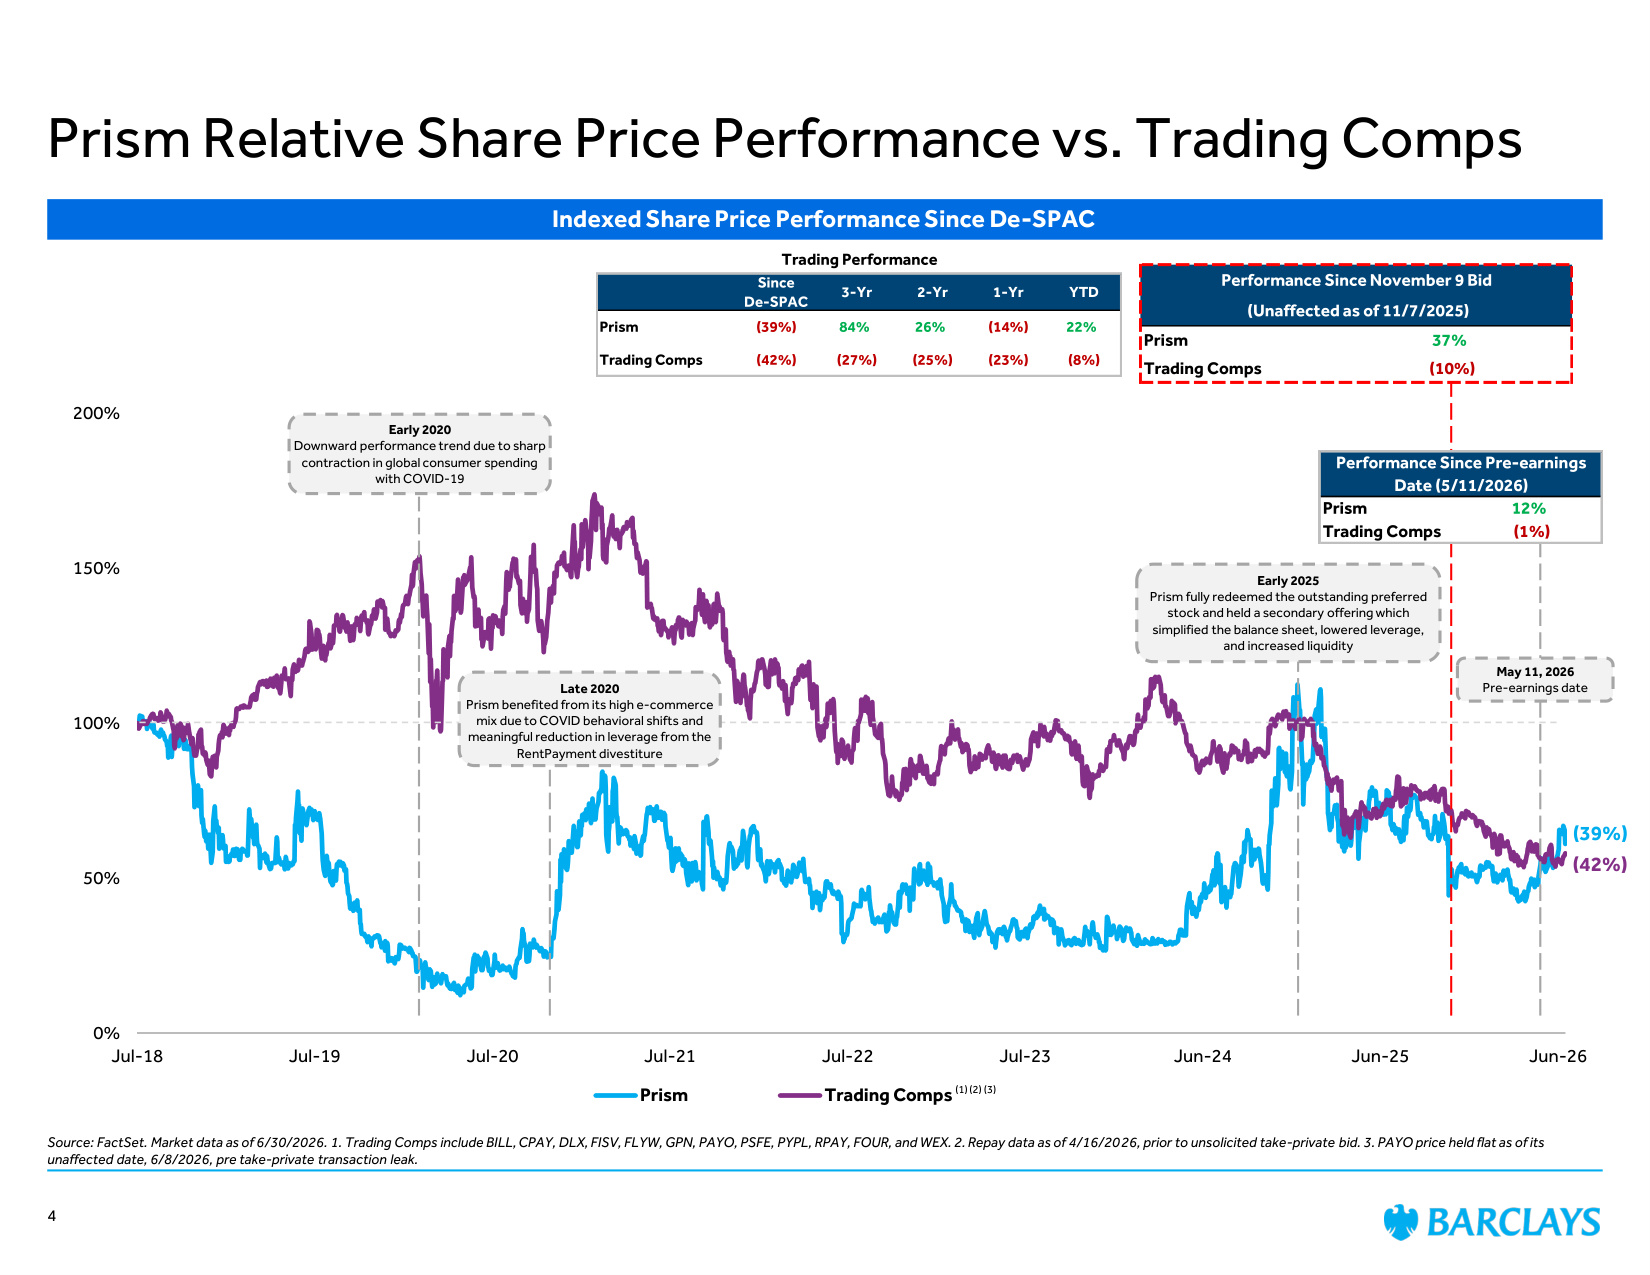
0% 50% 100% 150% 200% Jul-18 Jul-19 Jul-20 Jul-21 Jul-22 Jul-23 Jun-24 Jun-25 Jun-26 Prism Trading Comps Indexed Share Price Performance Since De-SPAC (42%) (39%) (1) Performance Since November 9 Bid (Unaffected as of 11/7/2025) Prism 37% Trading Comps (10%) Trading Performance Since De-SPAC 3-Yr 2-Yr 1-Yr YTD Prism (39%) 84% 26% (14%) 22% Trading Comps (42%) (27%) (25%) (23%) (8%) Prism Relative Share Price Performance vs. Trading Comps Source: FactSet. Market data as of 6/30/2026. 1. Trading Comps include BILL, CPAY, DLX, FISV, FLYW, GPN, PAYO, PSFE, PYPL, RPAY, FOUR, and WEX. 2. Repay data as of 4/16/2026, prior to unsolicited take-private bid. 3. PAYO price held flat as of its unaffected date, 6/8/2026, pre take-private transaction leak. Early 2020 Downward performance trend due to sharp contraction in global consumer spending with COVID-19 Early 2025 Prism fully redeemed the outstanding preferred stock and held a secondary offering which simplified the balance sheet, lowered leverage, and increased liquidity Late 2020 Prism benefited from its high e-commerce mix due to COVID behavioral shifts and meaningful reduction in leverage from the RentPayment divestiture (2) May 11, 2026 Pre-earnings date (3) 4 Performance Since Pre-earnings Date (5/11/2026) Prism 12% Trading Comps (1%)
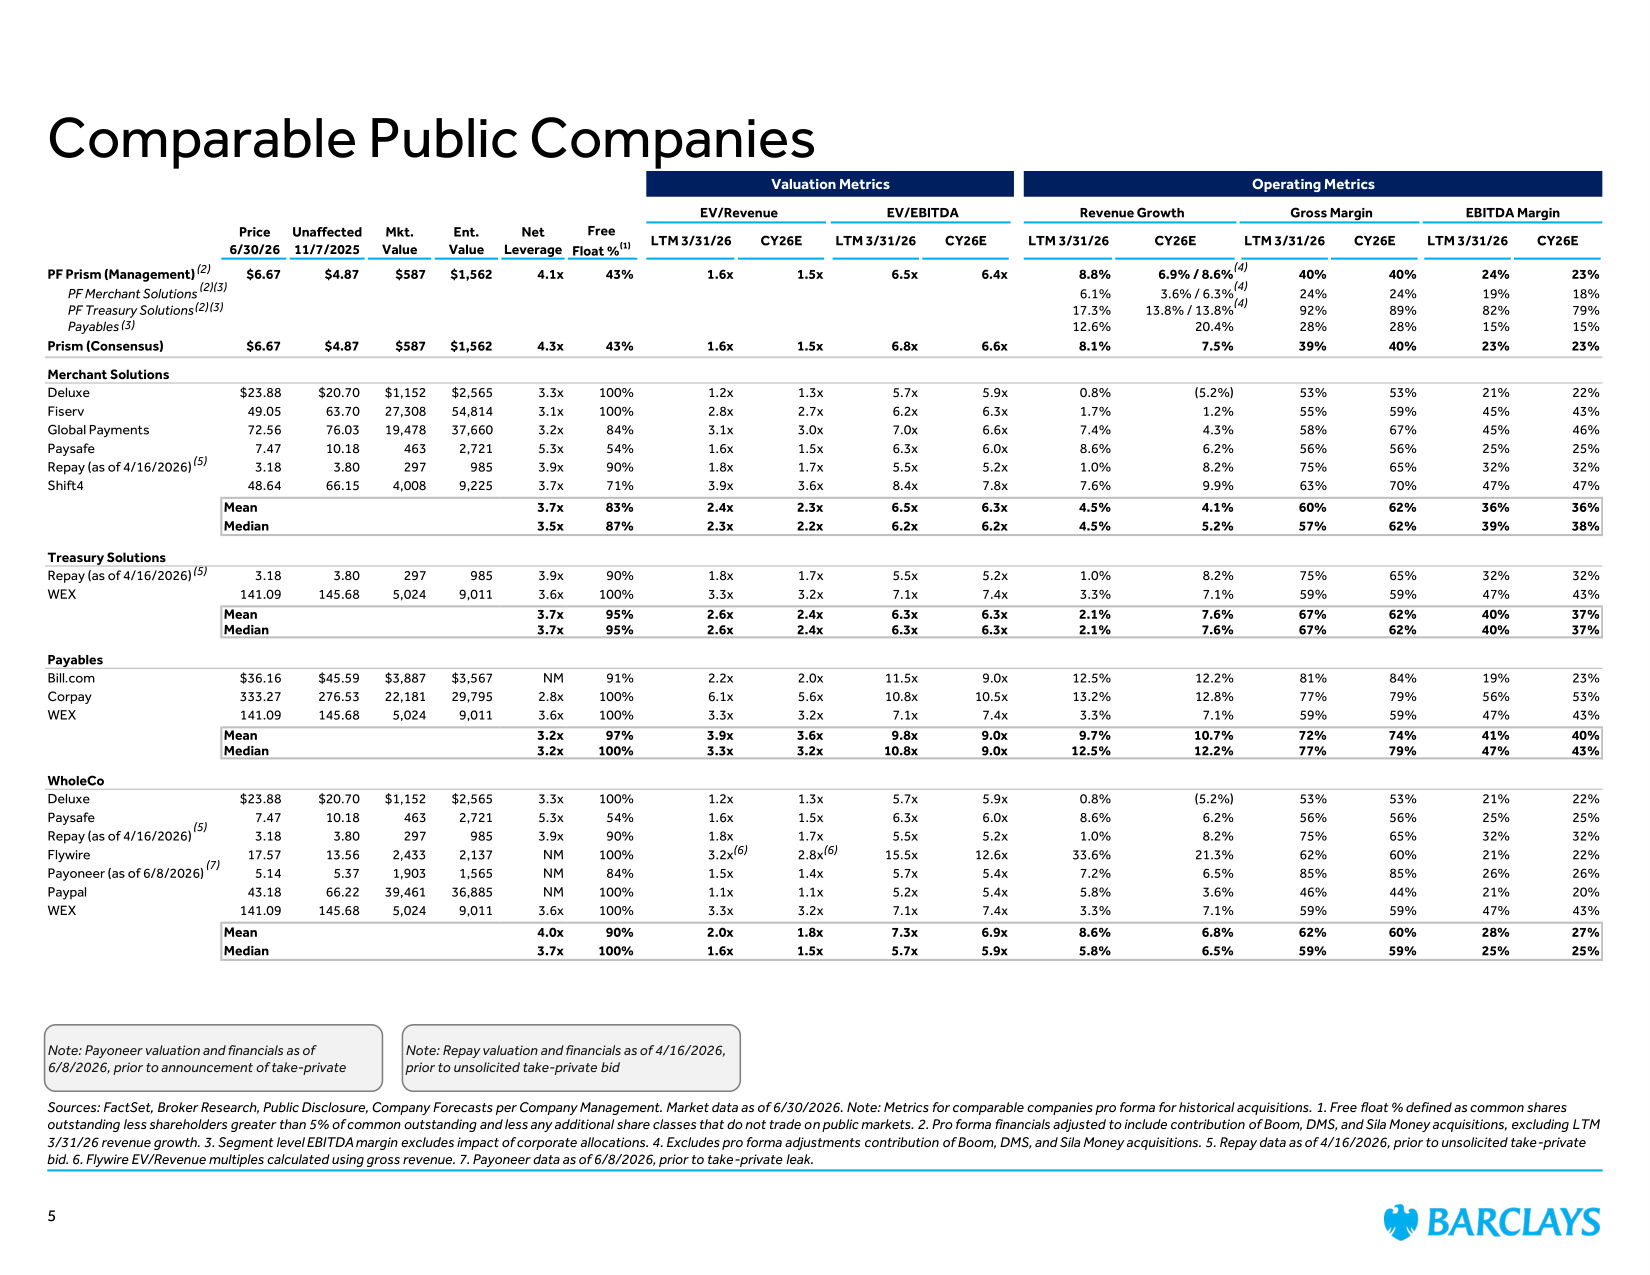
Comparable Public Companies Sources: FactSet, Broker Research, Public Disclosure, Company Forecasts per Company Management. Market data as of 6/30/2026. Note: Metrics for comparable companies pro forma for historical acquisitions. 1. Free float % defined as common shares outstanding less shareholders greater than 5% of common outstanding and less any additional share classes that do not trade on public markets. 2. Pro forma financials adjusted to include contribution of Boom, DMS, and Sila Money acquisitions, excluding LTM 3/31/26 revenue growth. 3. Segment level EBITDA margin excludes impact of corporate allocations. 4. Excludes pro forma adjustments contribution of Boom, DMS, and Sila Money acquisitions. 5. Repay data as of 4/16/2026, prior to unsolicited take-private bid. 6. Flywire EV/Revenue multiples calculated using gross revenue. 7. Payoneer data as of 6/8/2026, prior to take-private leak. (6) (2) (2) (2) (3) (3) (3) (4) (4) (4) (6) 5 (7) (5) (5) (5) Note: Repay valuation and financials as of 4/16/2026, prior to unsolicited take-private bid Note: Payoneer valuation and financials as of 6/8/2026, prior to announcement of take-private Valuation Metrics Operating Metrics EV/Revenue EV/EBITDA Revenue Growth Gross Margin EBITDA Margin Price 6/30/26 Unaffected 11/7/2025 Mkt. Value Ent. Value Net Leverage Free Float %(1) LTM 3/31/26 CY26E LTM 3/31/26 CY26E LTM 3/31/26 CY26E LTM 3/31/26 CY26E LTM 3/31/26 CY26E PF Prism (Management) $6.67 $4.87 $587 $1,562 4.1x 43% 1.6x 1.5x 6.5x 6.4x 8.8% 6.9% / 8.6% 40% 40% 24% 23% PF Merchant Solutions 6.1% 3.6% / 6.3% 24% 24% 19% 18% PF Treasury Solutions 17.3% 13.8% / 13.8% 92% 89% 82% 79% Payables 12.6% 20.4% 28% 28% 15% 15% Prism (Consensus) $6.67 $4.87 $587 $1,562 4.3x 43% 1.6x 1.5x 6.8x 6.6x 8.1% 7.5% 39% 40% 23% 23% Merchant Solutions Deluxe $23.88 $20.70 $1,152 $2,565 3.3x 100% 1.2x 1.3x 5.7x 5.9x 0.8% (5.2%) 53% 53% 21% 22% Fiserv 49.05 63.70 27,308 54,814 3.1x 100% 2.8x 2.7x 6.2x 6.3x 1.7% 1.2% 55% 59% 45% 43% Global Payments 72.56 76.03 19,478 37,660 3.2x 84% 3.1x 3.0x 7.0x 6.6x 7.4% 4.3% 58% 67% 45% 46% Paysafe 7.47 10.18 463 2,721 5.3x 54% 1.6x 1.5x 6.3x 6.0x 8.6% 6.2% 56% 56% 25% 25% Repay (as of 4/16/2026) 3.18 3.80 297 985 3.9x 90% 1.8x 1.7x 5.5x 5.2x 1.0% 8.2% 75% 65% 32% 32% Shift4 48.64 66.15 4,008 9,225 3.7x 71% 3.9x 3.6x 8.4x 7.8x 7.6% 9.9% 63% 70% 47% 47% Mean 3.7x 83% 2.4x 2.3x 6.5x 6.3x 4.5% 4.1% 60% 62% 36% 36% Median 3.5x 87% 2.3x 2.2x 6.2x 6.2x 4.5% 5.2% 57% 62% 39% 38% Treasury Solutions Repay (as of 4/16/2026) 3.18 3.80 297 985 3.9x 90% 1.8x 1.7x 5.5x 5.2x 1.0% 8.2% 75% 65% 32% 32% WEX 141.09 145.68 5,024 9,011 3.6x 100% 3.3x 3.2x 7.1x 7.4x 3.3% 7.1% 59% 59% 47% 43% Mean 3.7x 95% 2.6x 2.4x 6.3x 6.3x 2.1% 7.6% 67% 62% 40% 37% Median 3.7x 95% 2.6x 2.4x 6.3x 6.3x 2.1% 7.6% 67% 62% 40% 37% Payables Bill.com $36.16 $45.59 $3,887 $3,567 NM 91% 2.2x 2.0x 11.5x 9.0x 12.5% 12.2% 81% 84% 19% 23% Corpay 333.27 276.53 22,181 29,795 2.8x 100% 6.1x 5.6x 10.8x 10.5x 13.2% 12.8% 77% 79% 56% 53% WEX 141.09 145.68 5,024 9,011 3.6x 100% 3.3x 3.2x 7.1x 7.4x 3.3% 7.1% 59% 59% 47% 43% Mean 3.2x 97% 3.9x 3.6x 9.8x 9.0x 9.7% 10.7% 72% 74% 41% 40% Median 3.2x 100% 3.3x 3.2x 10.8x 9.0x 12.5% 12.2% 77% 79% 47% 43% WholeCo Deluxe $23.88 $20.70 $1,152 $2,565 3.3x 100% 1.2x 1.3x 5.7x 5.9x 0.8% (5.2%) 53% 53% 21% 22% Paysafe 7.47 10.18 463 2,721 5.3x 54% 1.6x 1.5x 6.3x 6.0x 8.6% 6.2% 56% 56% 25% 25% Repay (as of 4/16/2026) 3.18 3.80 297 985 3.9x 90% 1.8x 1.7x 5.5x 5.2x 1.0% 8.2% 75% 65% 32% 32% Flywire 17.57 13.56 2,433 2,137 NM 100% 3.2x 2.8x 15.5x 12.6x 33.6% 21.3% 62% 60% 21% 22% Payoneer (as of 6/8/2026) 5.14 5.37 1,903 1,565 NM 84% 1.5x 1.4x 5.7x 5.4x 7.2% 6.5% 85% 85% 26% 26% Paypal 43.18 66.22 39,461 36,885 NM 100% 1.1x 1.1x 5.2x 5.4x 5.8% 3.6% 46% 44% 21% 20% WEX 141.09 145.68 5,024 9,011 3.6x 100% 3.3x 3.2x 7.1x 7.4x 3.3% 7.1% 59% 59% 47% 43% Mean 4.0x 90% 2.0x 1.8x 7.3x 6.9x 8.6% 6.8% 62% 60% 28% 27% Median 3.7x 100% 1.6x 1.5x 5.7x 5.9x 5.8% 6.5% 59% 59% 25% 25%
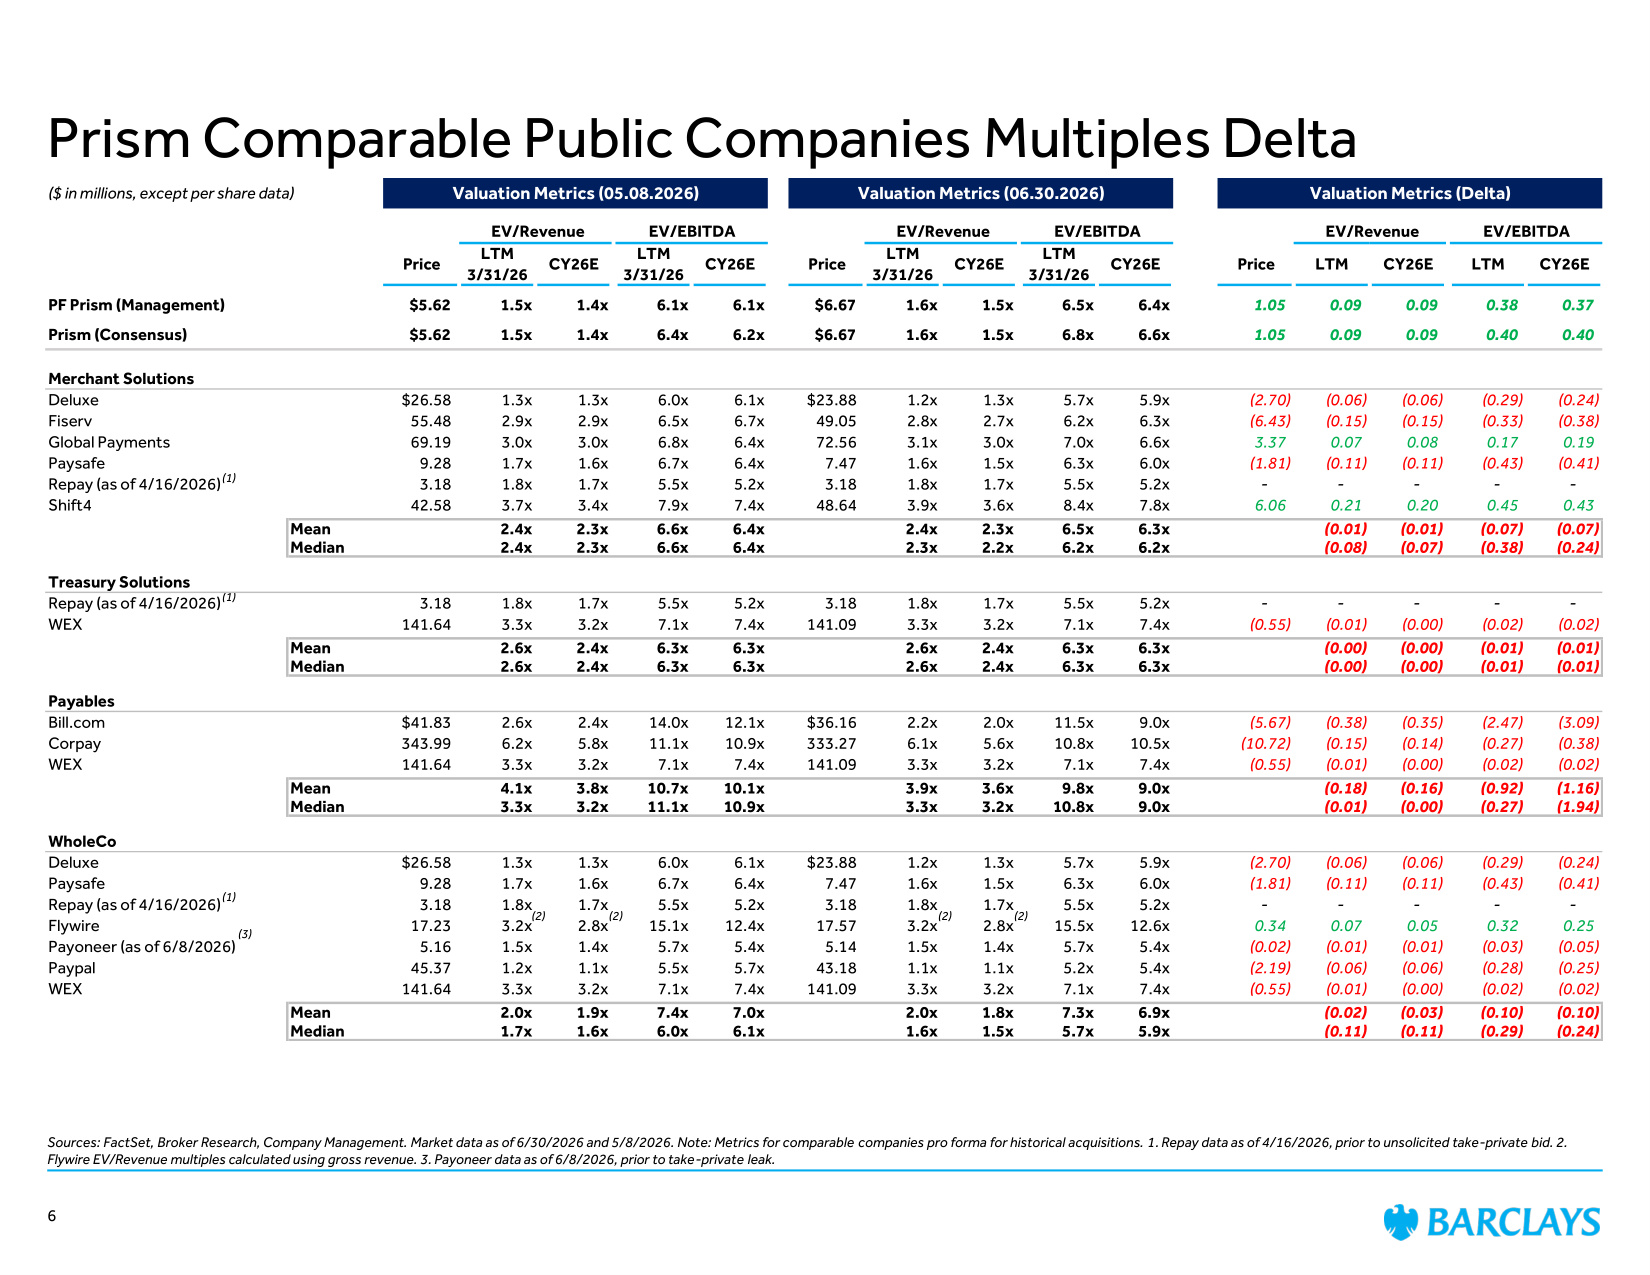
Prism Comparable Public Companies Multiples Delta Sources: FactSet, Broker Research, Company Management. Market data as of 6/30/2026 and 5/8/2026. Note: Metrics for comparable companies pro forma for historical acquisitions. 1. Repay data as of 4/16/2026, prior to unsolicited take-private bid. 2. Flywire EV/Revenue multiples calculated using gross revenue. 3. Payoneer data as of 6/8/2026, prior to take-private leak. (2) (2) (2) (2) (3) 6 (1) (1) (1) ($ in millions, except per share data) Valuation Metrics (05.08.2026) Valuation Metrics (06.30.2026) Valuation Metrics (Delta) EV/Revenue EV/EBITDA EV/Revenue EV/EBITDA EV/Revenue EV/EBITDA Price LTM 3/31/26 CY26E LTM 3/31/26 CY26E Price LTM 3/31/26 CY26E LTM 3/31/26 CY26E Price LTM CY26E LTM CY26E PF Prism (Management) $5.62 1.5x 1.4x 6.1x 6.1x $6.67 1.6x 1.5x 6.5x 6.4x 1.05 0.09 0.09 0.38 0.37 Prism (Consensus) $5.62 1.5x 1.4x 6.4x 6.2x $6.67 1.6x 1.5x 6.8x 6.6x 1.05 0.09 0.09 0.40 0.40 Merchant Solutions Deluxe $26.58 1.3x 1.3x 6.0x 6.1x $23.88 1.2x 1.3x 5.7x 5.9x (2.70) (0.06) (0.06) (0.29) (0.24) Fiserv 55.48 2.9x 2.9x 6.5x 6.7x 49.05 2.8x 2.7x 6.2x 6.3x (6.43) (0.15) (0.15) (0.33) (0.38) Global Payments 69.19 3.0x 3.0x 6.8x 6.4x 72.56 3.1x 3.0x 7.0x 6.6x 3.37 0.07 0.08 0.17 0.19 Paysafe 9.28 1.7x 1.6x 6.7x 6.4x 7.47 1.6x 1.5x 6.3x 6.0x (1.81) (0.11) (0.11) (0.43) (0.41) Repay (as of 4/16/2026) 3.18 1.8x 1.7x 5.5x 5.2x 3.18 1.8x 1.7x 5.5x 5.2x - - - - - Shift4 42.58 3.7x 3.4x 7.9x 7.4x 48.64 3.9x 3.6x 8.4x 7.8x 6.06 0.21 0.20 0.45 0.43 Mean 2.4x 2.3x 6.6x 6.4x 2.4x 2.3x 6.5x 6.3x (0.01) (0.01) (0.07) (0.07) Median 2.4x 2.3x 6.6x 6.4x 2.3x 2.2x 6.2x 6.2x (0.08) (0.07) (0.38) (0.24) Treasury Solutions Repay (as of 4/16/2026) 3.18 1.8x 1.7x 5.5x 5.2x 3.18 1.8x 1.7x 5.5x 5.2x - - - - - WEX 141.64 3.3x 3.2x 7.1x 7.4x 141.09 3.3x 3.2x 7.1x 7.4x (0.55) (0.01) (0.00) (0.02) (0.02) Mean 2.6x 2.4x 6.3x 6.3x 2.6x 2.4x 6.3x 6.3x (0.00) (0.00) (0.01) (0.01) Median 2.6x 2.4x 6.3x 6.3x 2.6x 2.4x 6.3x 6.3x (0.00) (0.00) (0.01) (0.01) Payables Bill.com $41.83 2.6x 2.4x 14.0x 12.1x $36.16 2.2x 2.0x 11.5x 9.0x (5.67) (0.38) (0.35) (2.47) (3.09) Corpay 343.99 6.2x 5.8x 11.1x 10.9x 333.27 6.1x 5.6x 10.8x 10.5x (10.72) (0.15) (0.14) (0.27) (0.38) WEX 141.64 3.3x 3.2x 7.1x 7.4x 141.09 3.3x 3.2x 7.1x 7.4x (0.55) (0.01) (0.00) (0.02) (0.02) Mean 4.1x 3.8x 10.7x 10.1x 3.9x 3.6x 9.8x 9.0x (0.18) (0.16) (0.92) (1.16) Median 3.3x 3.2x 11.1x 10.9x 3.3x 3.2x 10.8x 9.0x (0.01) (0.00) (0.27) (1.94) WholeCo Deluxe $26.58 1.3x 1.3x 6.0x 6.1x $23.88 1.2x 1.3x 5.7x 5.9x (2.70) (0.06) (0.06) (0.29) (0.24) Paysafe 9.28 1.7x 1.6x 6.7x 6.4x 7.47 1.6x 1.5x 6.3x 6.0x (1.81) (0.11) (0.11) (0.43) (0.41) Repay (as of 4/16/2026) 3.18 1.8x 1.7x 5.5x 5.2x 3.18 1.8x 1.7x 5.5x 5.2x - - - - - Flywire 17.23 3.2x 2.8x 15.1x 12.4x 17.57 3.2x 2.8x 15.5x 12.6x 0.34 0.07 0.05 0.32 0.25 Payoneer (as of 6/8/2026) 5.16 1.5x 1.4x 5.7x 5.4x 5.14 1.5x 1.4x 5.7x 5.4x (0.02) (0.01) (0.01) (0.03) (0.05) Paypal 45.37 1.2x 1.1x 5.5x 5.7x 43.18 1.1x 1.1x 5.2x 5.4x (2.19) (0.06) (0.06) (0.28) (0.25) WEX 141.64 3.3x 3.2x 7.1x 7.4x 141.09 3.3x 3.2x 7.1x 7.4x (0.55) (0.01) (0.00) (0.02) (0.02) Mean 2.0x 1.9x 7.4x 7.0x 2.0x 1.8x 7.3x 6.9x (0.02) (0.03) (0.10) (0.10) Median 1.7x 1.6x 6.0x 6.1x 1.6x 1.5x 5.7x 5.9x (0.11) (0.11) (0.29) (0.24)
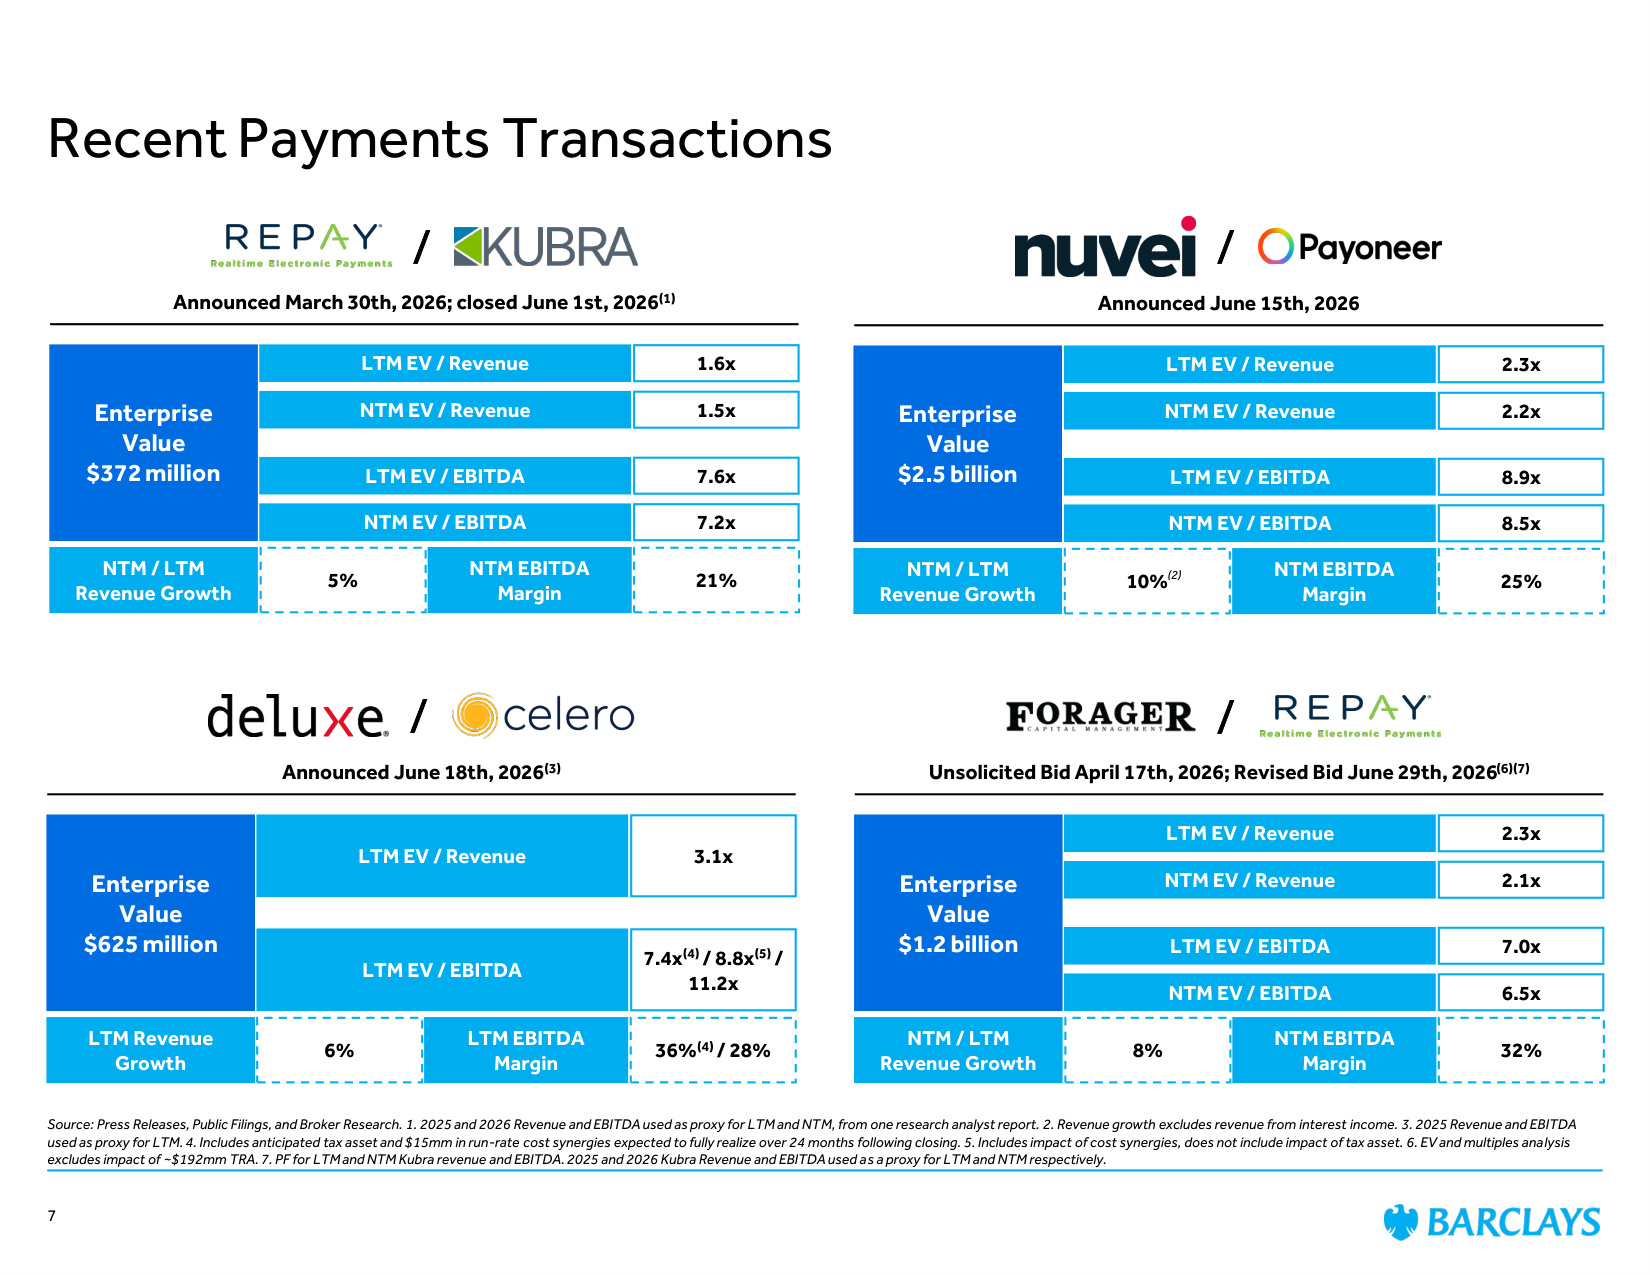
Recent Payments Transactions Source: Press Releases, Public Filings, and Broker Research. 1. 2025 and 2026 Revenue and EBITDA used as proxy for LTM and NTM, from one research analyst report. 2. Revenue growth excludes revenue from interest income. 3. 2025 Revenue and EBITDA used as proxy for LTM. 4. Includes anticipated tax asset and $15mm in run-rate cost synergies expected to fully realize over 24 months following closing. 5. Includes impact of cost synergies, does not include impact of tax asset. 6. EV and multiples analysis excludes impact of ~$192mm TRA. 7. PF for LTM and NTM Kubra revenue and EBITDA. 2025 and 2026 Kubra Revenue and EBITDA used as a proxy for LTM and NTM respectively. 7 / Announced June 18th, 2026(3) Enterprise Value $625 million LTM Revenue Growth LTM EV / Revenue 3.1x LTM EV / EBITDA 7.4x(4) / 8.8x(5) / 11.2x LTM EBITDA Margin 6% 36%(4) / 28% / Announced March 30th, 2026; closed June 1st, 2026(1) Enterprise Value $372 million NTM / LTM Revenue Growth LTM EV / Revenue 1.6x NTM EV / Revenue 1.5x LTM EV / EBITDA 7.6x NTM EV / EBITDA 7.2x NTM EBITDA Margin 5% 21% / Announced June 15th, 2026 Enterprise Value $2.5 billion NTM / LTM Revenue Growth LTM EV / Revenue 2.3x NTM EV / Revenue 2.2x LTM EV / EBITDA 8.9x NTM EV / EBITDA 8.5x NTM EBITDA Margin 10% 25% (2) / Unsolicited Bid April 17th, 2026; Revised Bid June 29th, 2026(6)(7) Enterprise Value $1.2 billion NTM / LTM Revenue Growth LTM EV / Revenue 2.3x NTM EV / Revenue 2.1x LTM EV / EBITDA 7.0x NTM EV / EBITDA 6.5x NTM EBITDA Margin 8% 32% / / / /
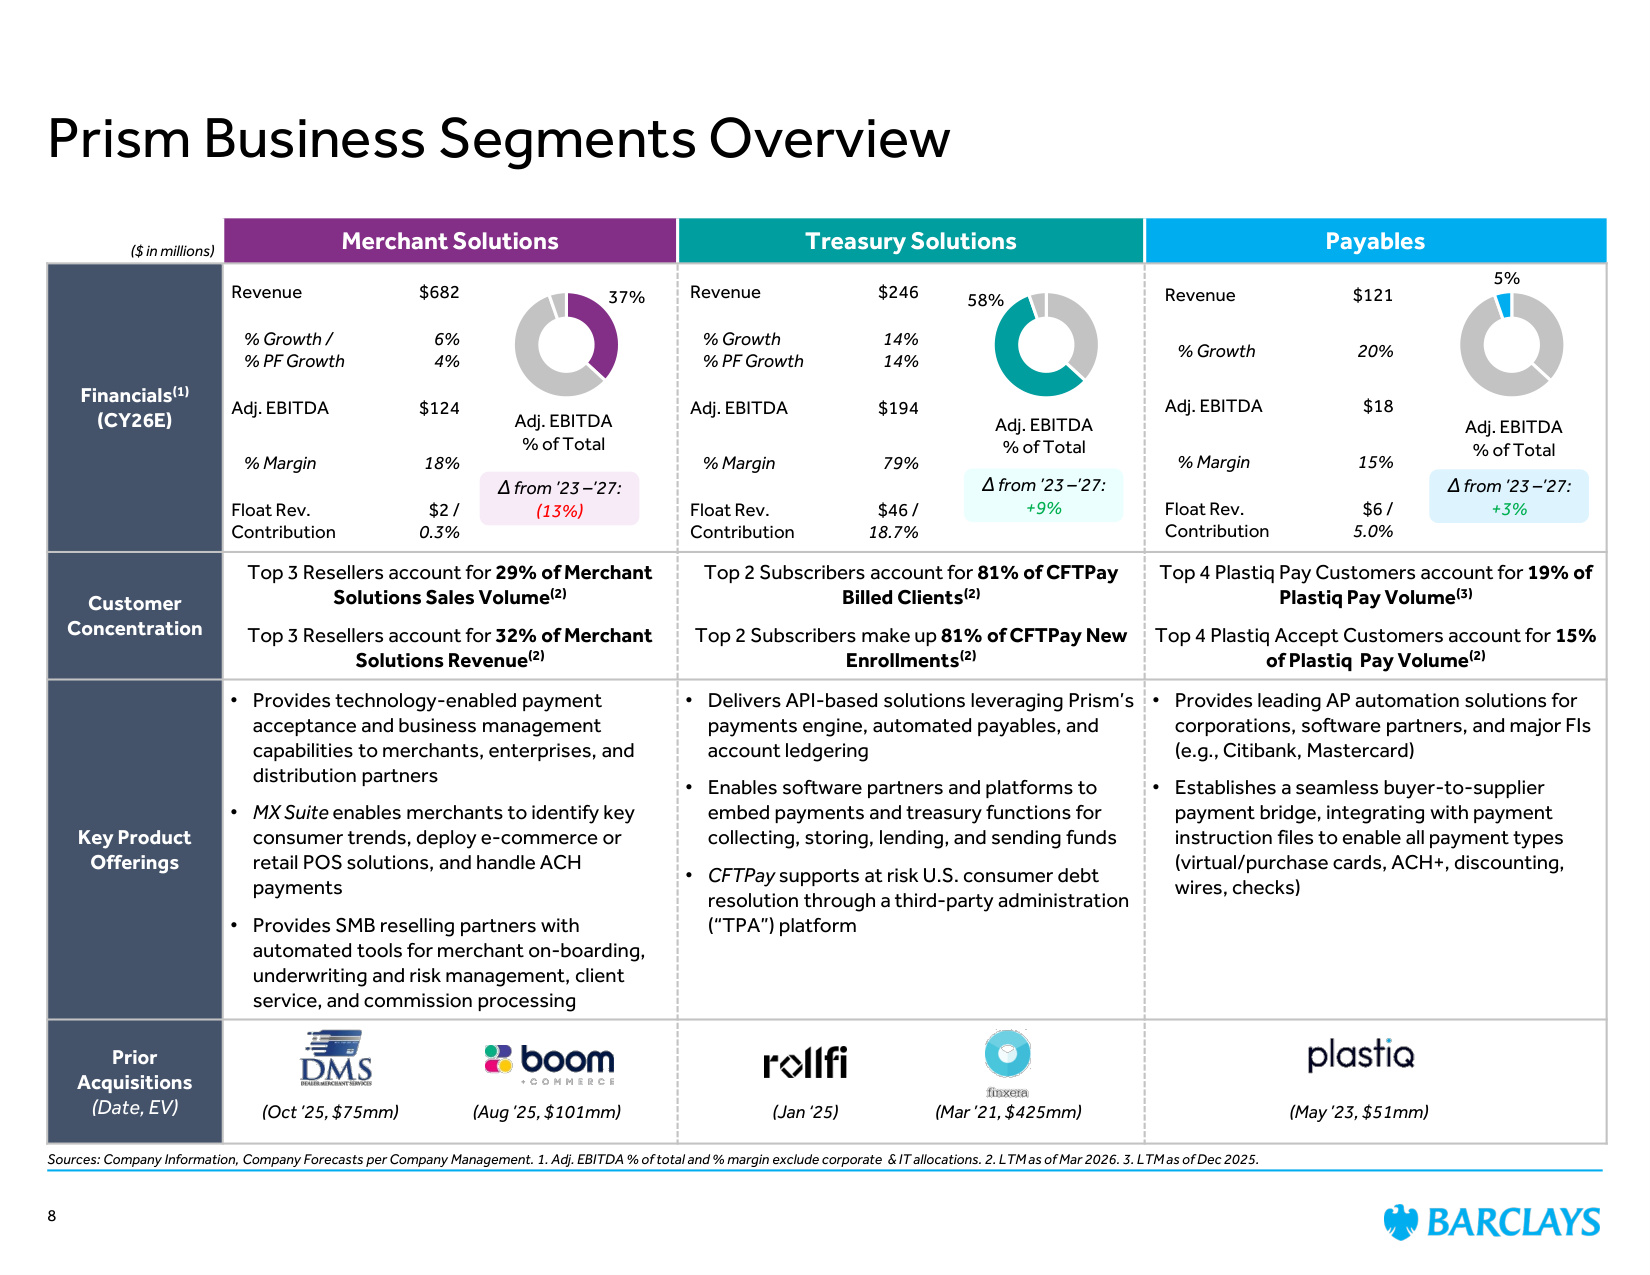
Prism Business Segments Overview Sources: Company Information, Company Forecasts per Company Management. 1. Adj. EBITDA % of total and % margin exclude corporate & IT allocations. 2. LTM as of Mar 2026. 3. LTM as of Dec 2025. Merchant Solutions Treasury Solutions Payables Financials(1) (CY26E) Customer Concentration Top 3 Resellers account for 29% of Merchant Solutions Sales Volume(2) Top 3 Resellers account for 32% of Merchant Solutions Revenue(2) Top 2 Subscribers account for 81% of CFTPay Billed Clients(2) Top 2 Subscribers make up 81% of CFTPay New Enrollments(2) Top 4 Plastiq Pay Customers account for 19% of Plastiq Pay Volume(3) Top 4 Plastiq Accept Customers account for 15% of Plastiq Pay Volume(2) Key Product Offerings • Provides technology-enabled payment acceptance and business management capabilities to merchants, enterprises, and distribution partners • MX Suite enables merchants to identify key consumer trends, deploy e-commerce or retail POS solutions, and handle ACH payments • Provides SMB reselling partners with automated tools for merchant on-boarding, underwriting and risk management, client service, and commission processing • Delivers API-based solutions leveraging Prism's payments engine, automated payables, and account ledgering • Enables software partners and platforms to embed payments and treasury functions for collecting, storing, lending, and sending funds • CFTPay supports at risk U.S. consumer debt resolution through a third-party administration ("TPA") platform • Provides leading AP automation solutions for corporations, software partners, and major FIs (e.g., Citibank, Mastercard) • Establishes a seamless buyer-to-supplier payment bridge, integrating with payment instruction files to enable all payment types (virtual/purchase cards, ACH+, discounting, wires, checks) Prior Acquisitions (Date, EV) ($ in millions) (Oct '25, $75mm) (Aug '25, $101mm) (Jan '25) (Mar '21, $425mm) (May '23, $51mm) 37% 58% 5% Adj. EBITDA % of Total Adj. EBITDA % of Total Adj. EBITDA % of Total Revenue $682 % Growth / % PF Growth 6% 4% Adj. EBITDA $124 % Margin 18% Float Rev. Contribution $2 / 0.3% Revenue $246 % Growth % PF Growth 14% 14% Adj. EBITDA $194 % Margin 79% Float Rev. Contribution $46 / 18.7% Revenue $121 % Growth 20% Adj. EBITDA $18 % Margin 15% Float Rev. Contribution $6 / 5.0% Δ from '23 –'27: (13%) Δ from '23 –'27: +9% Δ from '23 –'27: +3% 8
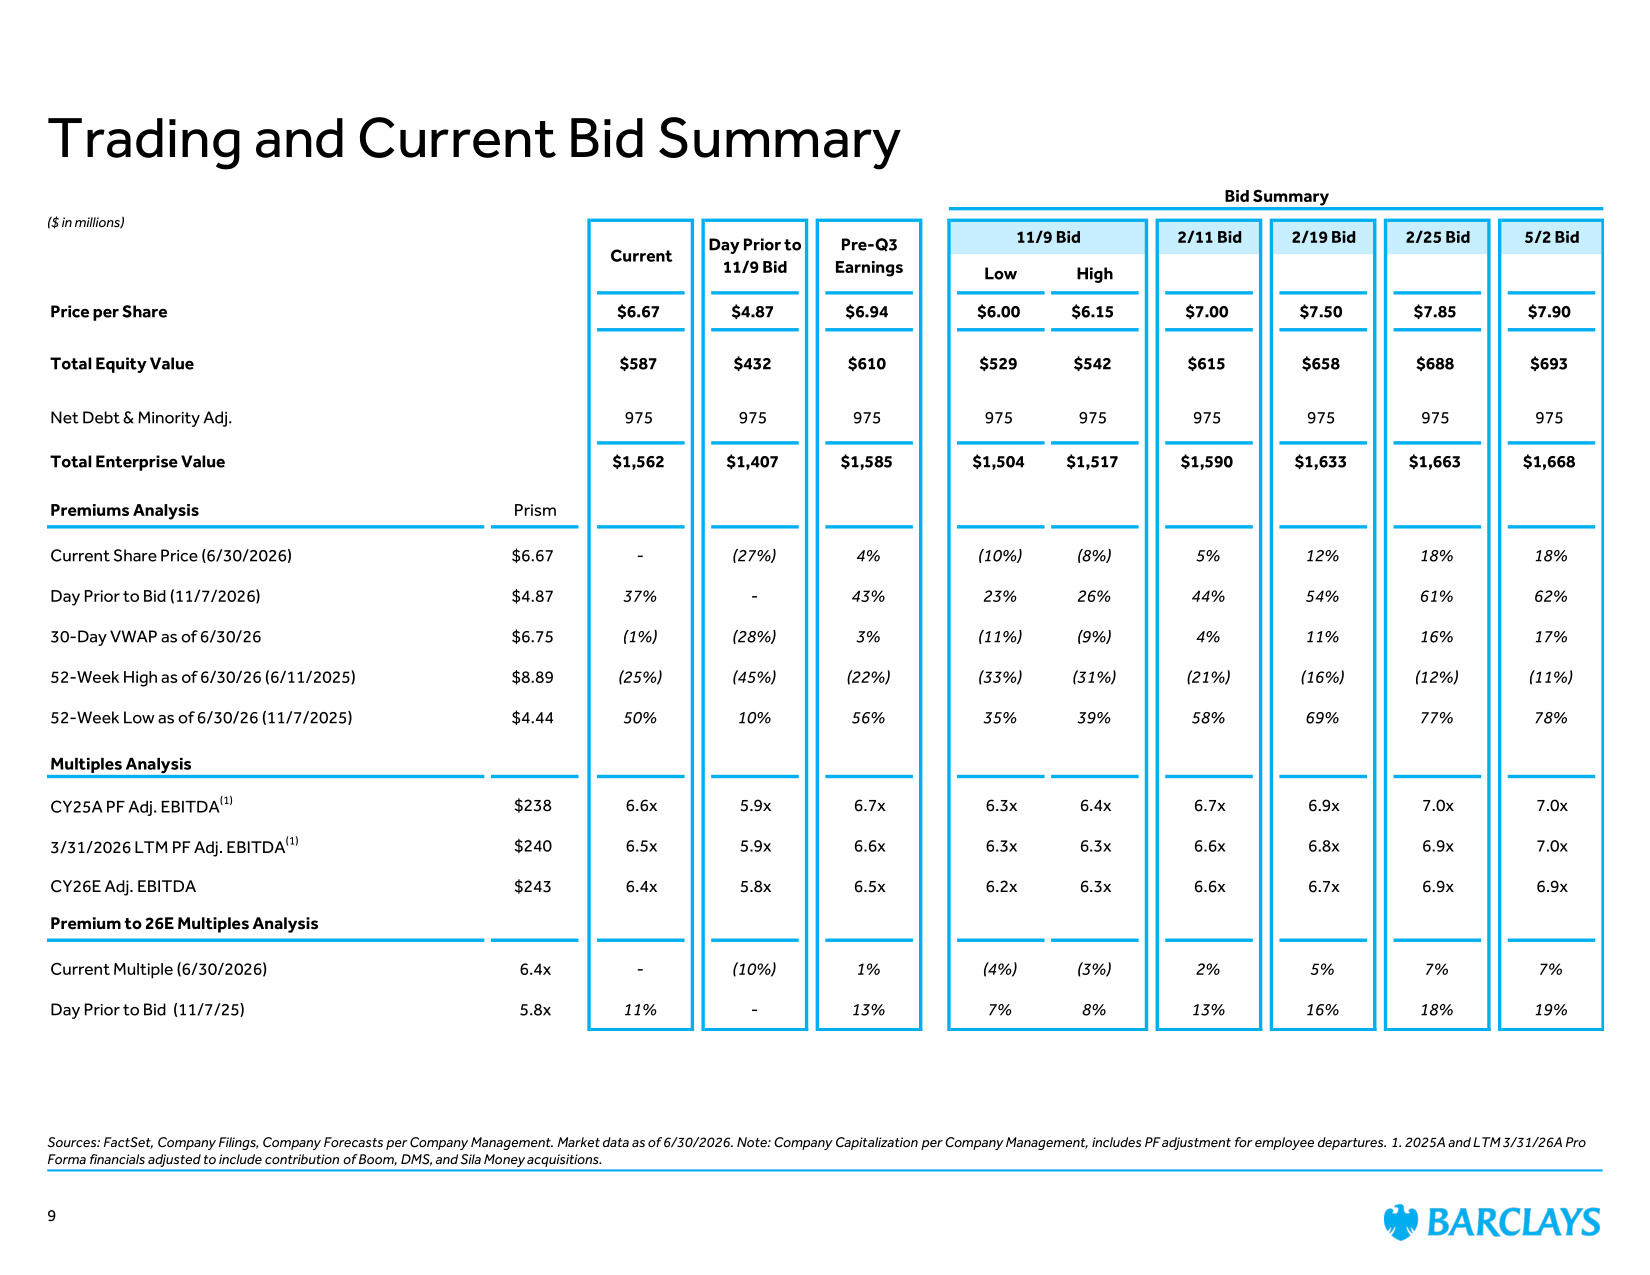
Trading and Current Bid Summary Sources: FactSet, Company Filings, Company Forecasts per Company Management. Market data as of 6/30/2026. Note: Company Capitalization per Company Management, includes PF adjustment for employee departures. 1. 2025A and LTM 3/31/26A Pro Forma financials adjusted to include contribution of Boom, DMS, and Sila Money acquisitions. Bid Summary 11/9 Bid 2/11 Bid 2/19 Bid 2/25 Bid 5/2 Bid Low High Price per Share $6.67 $4.87 $6.94 $6.00 $6.15 $7.00 $7.50 $7.85 $7.90 Total Equity Value $587 $432 $610 $529 $542 $615 $658 $688 $693 Net Debt & Minority Adj. 975 975 975 975 975 975 975 975 975 Total Enterprise Value $1,562 $1,407 $1,585 $1,504 $1,517 $1,590 $1,633 $1,663 $1,668 Premiums Analysis Prism Current Share Price (6/30/2026) $6.67 - (27%) 4% (10%) (8%) 5% 12% 18% 18% Day Prior to Bid (11/7/2026) $4.87 37% - 43% 23% 26% 44% 54% 61% 62% 30-Day VWAP as of 6/30/26 $6.75 (1%) (28%) 3% (11%) (9%) 4% 11% 16% 17% 52-Week High as of 6/30/26 (6/11/2025) $8.89 (25%) (45%) (22%) (33%) (31%) (21%) (16%) (12%) (11%) 52-Week Low as of 6/30/26 (11/7/2025) $4.44 50% 10% 56% 35% 39% 58% 69% 77% 78% Multiples Analysis CY25A PF Adj. EBITDA(1) $238 6.6x 5.9x 6.7x 6.3x 6.4x 6.7x 6.9x 7.0x 7.0x 3/31/2026 LTM PF Adj. EBITDA(1) $240 6.5x 5.9x 6.6x 6.3x 6.3x 6.6x 6.8x 6.9x 7.0x CY26E Adj. EBITDA $243 6.4x 5.8x 6.5x 6.2x 6.3x 6.6x 6.7x 6.9x 6.9x Premium to 26E Multiples Analysis Current Multiple (6/30/2026) 6.4x - (10%) 1% (4%) (3%) 2% 5% 7% 7% Day Prior to Bid (11/7/25) 5.8x 11% - 13% 7% 8% 13% 16% 18% 19% Current Day Prior to 11/9 Bid Pre-Q3 Earnings ($ in millions) 9
Disclaimer 10 This document has been prepared by Barclays Capital Inc. ("Barclays") for information purposes only. This document is confidential and for the sole and exclusive benefit and internal use of the Recipient in connection with the matter or possible transaction to which this document relates, and no part of it may be reproduced, distributed or transmitted without the prior written permission of Barclays. This document is an indicative summary of the terms and conditions of the transaction described herein and may be amended, superseded or replaced by subsequent summaries. The final terms and conditions of the transaction will be set out in full in the applicable binding transaction document(s). This document is incomplete without reference to, and should be assessed solely in conjunction with, the oral briefing provided by Barclays. Neither Barclays nor any of its subsidiaries or affiliates shall be obliged by having made this document available to you to provide any financial advisory services (whether in relation to the matter or possible transaction to which this document relates or otherwise) or to sell, acquire, place or underwrite any securities or to lend moneys or to provide any other commitment, facility, product, risk management solution or service, nor does Barclays represent by providing this document to the Recipient that it will be possible for Barclays to provide, arrange or undertake any of the aforementioned services, activities, products or solutions. Any commitment by Barclays to provide, arrange or undertake any of the aforementioned services, activities, products or solutions would be subject to Barclays signing appropriate documentation, obtaining all necessary internal approvals and completing due diligence, in each case in a manner satisfactory to Barclays. This document was prepared on the basis of information and data, obtained from publicly available sources and, where applicable, from the Recipient and/or any other entity that may be involved in any transaction or matter contemplated by this document (and/or any of the Recipient's or the aforementioned entities' affiliates), in each case prior to or on the date hereof. Barclays makes no warranty or representation, express or implied, as to the accuracy or completeness of information which is contained in this document and which is stated to have been obtained from or is based upon trade and statistical services or other third party sources. The information in this document has not been independently verified by Barclays and Barclays does not assume any liability for any such information. Any data on past performance, modeling or back-testing contained herein is no indication as to future performance. No representation is made as to the reasonableness of the assumptions made within or the accuracy or completeness of any modeling or back-testing or any other information contained herein. All opinions and estimates are given as of the date hereof and are subject to change and Barclays assumes no obligation to update this document to reflect any such changes. The value of any investment may fluctuate as a result of market changes. The information herein is not intended to predict actual results and no assurances are given with respect thereto. Nothing herein shall be deemed to constitute investment, legal, tax, financial, accounting or other advice. The Recipient is responsible for making its own independent investigation and appraisal of the risks, benefits, appropriateness and suitability of any transaction or matter contemplated by this document and Barclays is not making any recommendation (personal or otherwise) or giving any investment advice and will have no liability with respect thereto. The decision to proceed with any transaction or action contemplated by this document must be made by the Recipient in the light of its own commercial assessments and Barclays will not be responsible for such assessments. Neither Barclays nor any of its subsidiaries or affiliates, nor any of their respective directors, officers, employees, advisors or other representatives (Barclays together with such persons being the "Barclays Group") accepts any liability whatsoever for any direct, indirect or consequential losses (in contract, tort or otherwise) arising from the use of this document or its contents or any reliance on the information contained herein. Barclays Group is not responsible for any specialized advice (including financial, tax, legal and accounting, among other advice). This document does not constitute nor does it form part of an offer to sell or purchase, or the solicitation of an offer to sell or purchase, any securities or any of the businesses or assets described herein or an offer or recommendation to enter into any transaction described herein nor does this document constitute an offer or commitment to provide, arrange or underwrite any financing. Members of the Barclays Group are involved in a wide range of commercial banking, investment banking and other activities out of which conflicting interests or duties may arise. In the ordinary course of its business, the Barclays Group may provide services to any other entity or person whether or not a member of the same group as the Recipient (a "Third Party"), engage in any transaction (whether on its own account, on behalf of any Third Party or otherwise, and including any transaction or matter contemplated by this document), notwithstanding that such services, transactions or actions may be adverse to the Recipient or any member of the Recipient's group, and the Barclays Group may retain for its own benefit any related remuneration or profit. The Barclays Group operates in accordance with a conflicts of interest policy which identifies conflicts of interest it faces in the ordinary course of its business, and establishes organisational and procedural measures to manage those conflicts where it is reasonably able to do so. Neither Barclays nor any other part of the Barclays Group shall have any duty to disclose to the Recipient or utilise for the Recipient's benefit any non-public information acquired in the course of providing services to any other person, engaging in any transaction (on its own account or otherwise) or otherwise carrying on its business.`The Barclays Group's research analysts and research departments are independent from its banking business and are subject to certain regulations and internal policies. The Barclays Group's research analysts may hold opinions and make statements or investment recommendations and/or publish research reports with respect to any company referred to herein, the transactions contemplated herein or any person or entity involved therein or related thereto that differ from or are inconsistent with the views or advice communicated by the Barclays Group's banking business. Barclays is a full service securities firm and as such from time to time may effect transactions for its own account or the account of its clients and hold long or short positions in debt, equity or other securities of the companies referred to herein or in other financial products and instruments. Unless otherwise expressly agreed or provided for in other applicable Barclays disclosures governing such transactions or required by law or regulation, Barclays conducts these activities as principal and executes its principal transactions as an arm's length counterparty. Barclays does not act as a fiduciary in relation to these transactions. THIS DOCUMENT DOES NOT DISCLOSE ALL THE RISKS AND OTHER SIGNIFICANT ISSUES RELATED TO AN INVESTMENT IN THE SECURITIES, FINANCIAL INSTRUMENTS OR TRANSACTIONS DESCRIBED HEREIN. PRIOR TO TRANSACTING, YOU SHOULD ENSURE THAT YOU FULLY UNDERSTAND THE TERMS OF THE TRANSACTION AND ANY APPLICABLE RISKS. THE INFORMATION CONTAINED HEREIN IS NOT INTENDED TO BE DISTRIBUTED TO ANY PROSPECTIVE OR ACTUAL INVESTORS AND, ACCORDINGLY, MAY NOT BE SHOWN OR GIVEN TO ANY PERSON OTHER THAN THE RECIPIENT, AND IS NOT TO BE FORWARDED TO ANY OTHER PERSON (INCLUDING ANY RETAIL INVESTOR OR CUSTOMER), COPIED OR OTHERWISE REPRODUCED OR DISTRIBUTED TO ANY SUCH PERSON IN ANY MANNER WHATSOEVER. FAILURE TO COMPLY WITH THIS DIRECTIVE CAN RESULT IN A VIOLATION OF THE SECURITIES ACT OF 1933, AS AMENDED. These materials have not been produced by the Barclays Group's research department and do not constitute investment research or a research recommendation for the purposes of the Financial Conduct Authority rules or a research report under applicable U.S. law. Barclays Capital Inc. is the United States investment bank of Barclays Bank PLC. Barclays Bank PLC is authorised by the Prudential Regulation Authority and regulated by the Financial Conduct Authority and the Prudential Regulation Authority (Financial Services Register No. 122702). Registered in England. Registered No. 1026167. Registered office: 1 Churchill Place, London E14 5HP. Copyright Barclays Bank PLC, 2026 (all rights reserved).