Exhibit (C)(7)
Project Prism Update May 2026
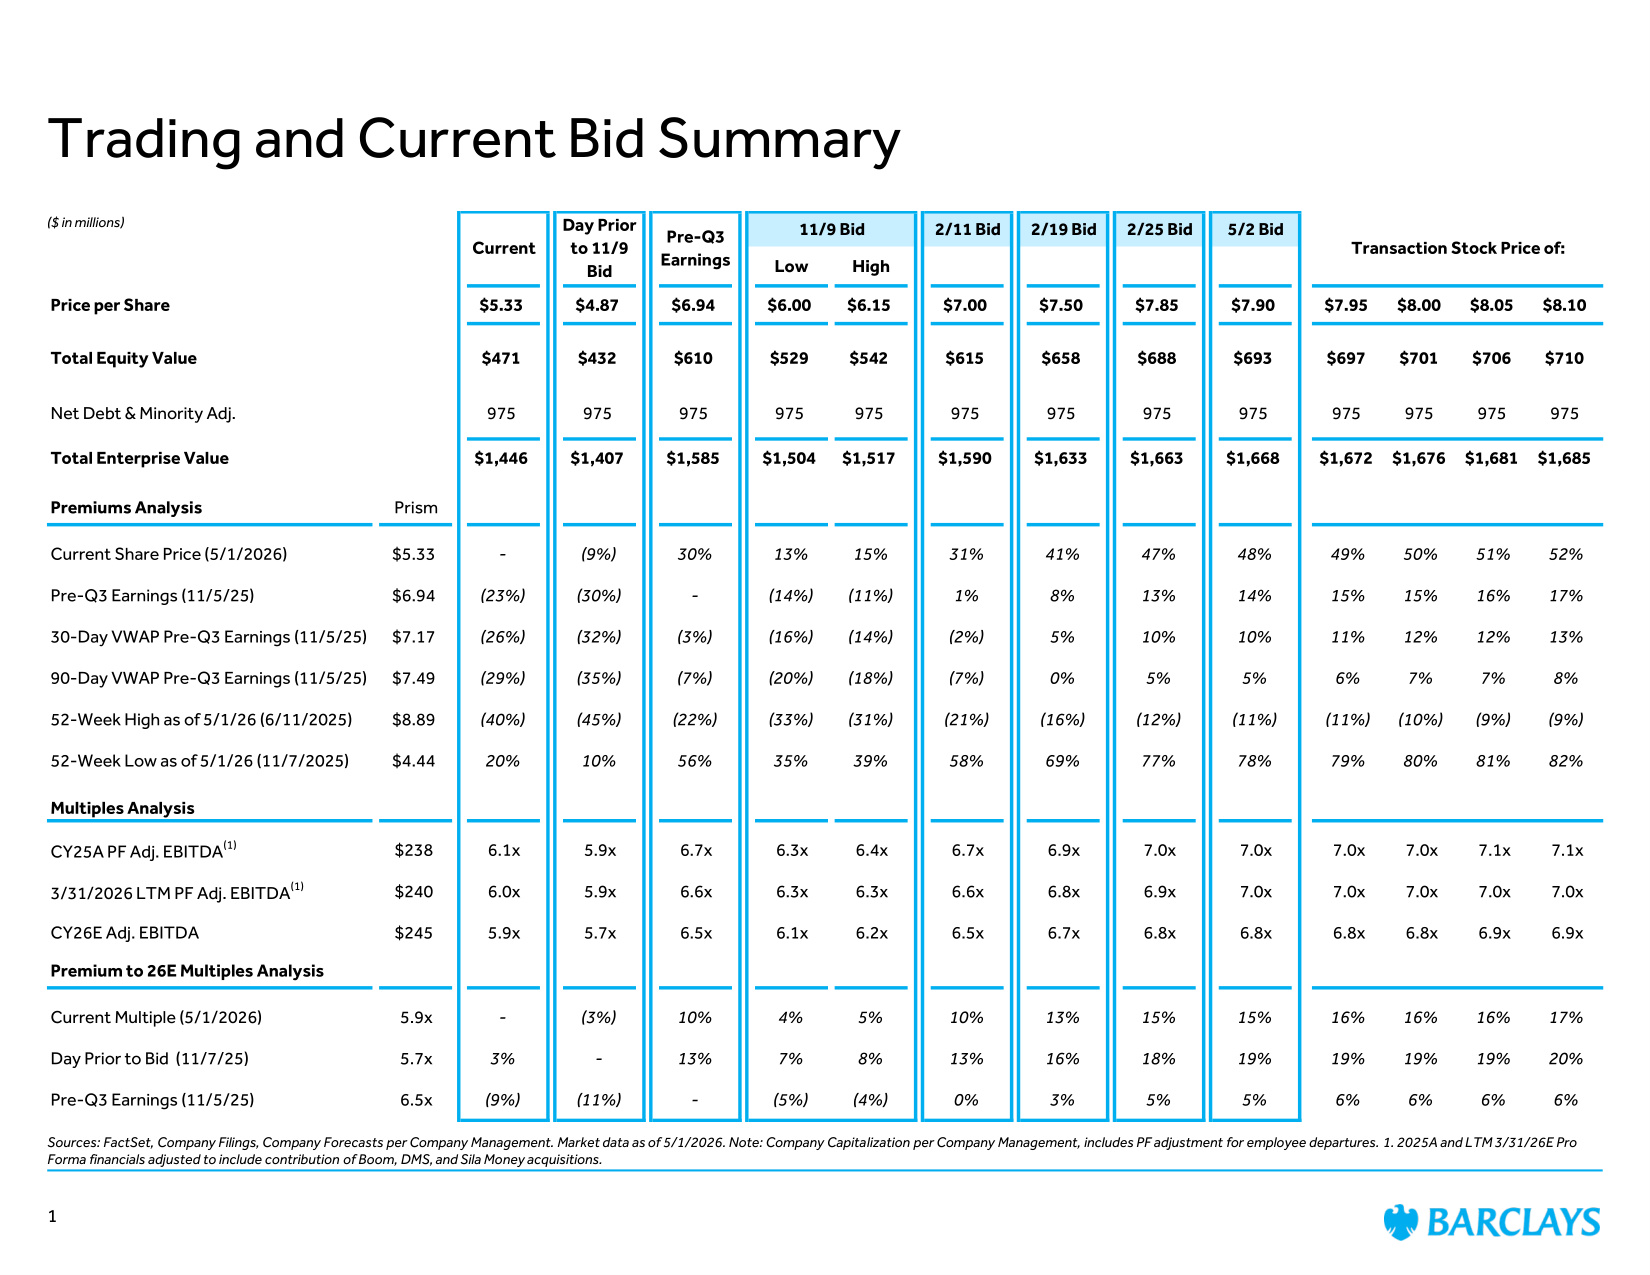
Trading and Current Bid Summary Sources: FactSet, Company Filings, Company Forecasts per Company Management. Market data as of 5/1/2026. Note: Company Capitalization per Company Management, includes PF adjustment for employee departures. 1. 2025A and LTM 3/31/26E Pro Forma financials adjusted to include contribution of Boom, DMS, and Sila Money acquisitions. 11/9 Bid 2/11 Bid 2/19 Bid 2/25 Bid 5/2 Bid Low High Price per Share $5.33 $4.87 $6.94 $6.00 $6.15 $7.00 $7.50 $7.85 $7.90 $7.95 $8.00 $8.05 $8.10 Total Equity Value $471 $432 $610 $529 $542 $615 $658 $688 $693 $697 $701 $706 $710 Net Debt & Minority Adj. 975 975 975 975 975 975 975 975 975 975 975 975 975 Total Enterprise Value $1,446 $1,407 $1,585 $1,504 $1,517 $1,590 $1,633 $1,663 $1,668 $1,672 $1,676 $1,681 $1,685 Premiums Analysis Prism Current Share Price (5/1/2026) $5.33 - (9%) 30% 13% 15% 31% 41% 47% 48% 49% 50% 51% 52% Pre-Q3 Earnings (11/5/25) $6.94 (23%) (30%) - (14%) (11%) 1% 8% 13% 14% 15% 15% 16% 17% 30-Day VWAP Pre-Q3 Earnings (11/5/25) $7.17 (26%) (32%) (3%) (16%) (14%) (2%) 5% 10% 10% 11% 12% 12% 13% 90-Day VWAP Pre-Q3 Earnings (11/5/25) $7.49 (29%) (35%) (7%) (20%) (18%) (7%) 0% 5% 5% 6% 7% 7% 8% 52-Week High as of 5/1/26 (6/11/2025) $8.89 (40%) (45%) (22%) (33%) (31%) (21%) (16%) (12%) (11%) (11%) (10%) (9%) (9%) 52-Week Low as of 5/1/26 (11/7/2025) $4.44 20% 10% 56% 35% 39% 58% 69% 77% 78% 79% 80% 81% 82% Multiples Analysis CY25A PF Adj. EBITDA(1) $238 6.1x 5.9x 6.7x 6.3x 6.4x 6.7x 6.9x 7.0x 7.0x 7.0x 7.0x 7.1x 7.1x 3/31/2026 LTM PF Adj. EBITDA(1) $240 6.0x 5.9x 6.6x 6.3x 6.3x 6.6x 6.8x 6.9x 7.0x 7.0x 7.0x 7.0x 7.0x CY26E Adj. EBITDA $245 5.9x 5.7x 6.5x 6.1x 6.2x 6.5x 6.7x 6.8x 6.8x 6.8x 6.8x 6.9x 6.9x Premium to 26E Multiples Analysis Current Multiple (5/1/2026) 5.9x - (3%) 10% 4% 5% 10% 13% 15% 15% 16% 16% 16% 17% Day Prior to Bid (11/7/25) 5.7x 3% - 13% 7% 8% 13% 16% 18% 19% 19% 19% 19% 20% Pre-Q3 Earnings (11/5/25) 6.5x (9%) (11%) - (5%) (4%) 0% 3% 5% 5% 6% 6% 6% 6% Transaction Stock Price of: Current Day Prior to 11/9 Bid Pre-Q3 Earnings ($ in millions) 1
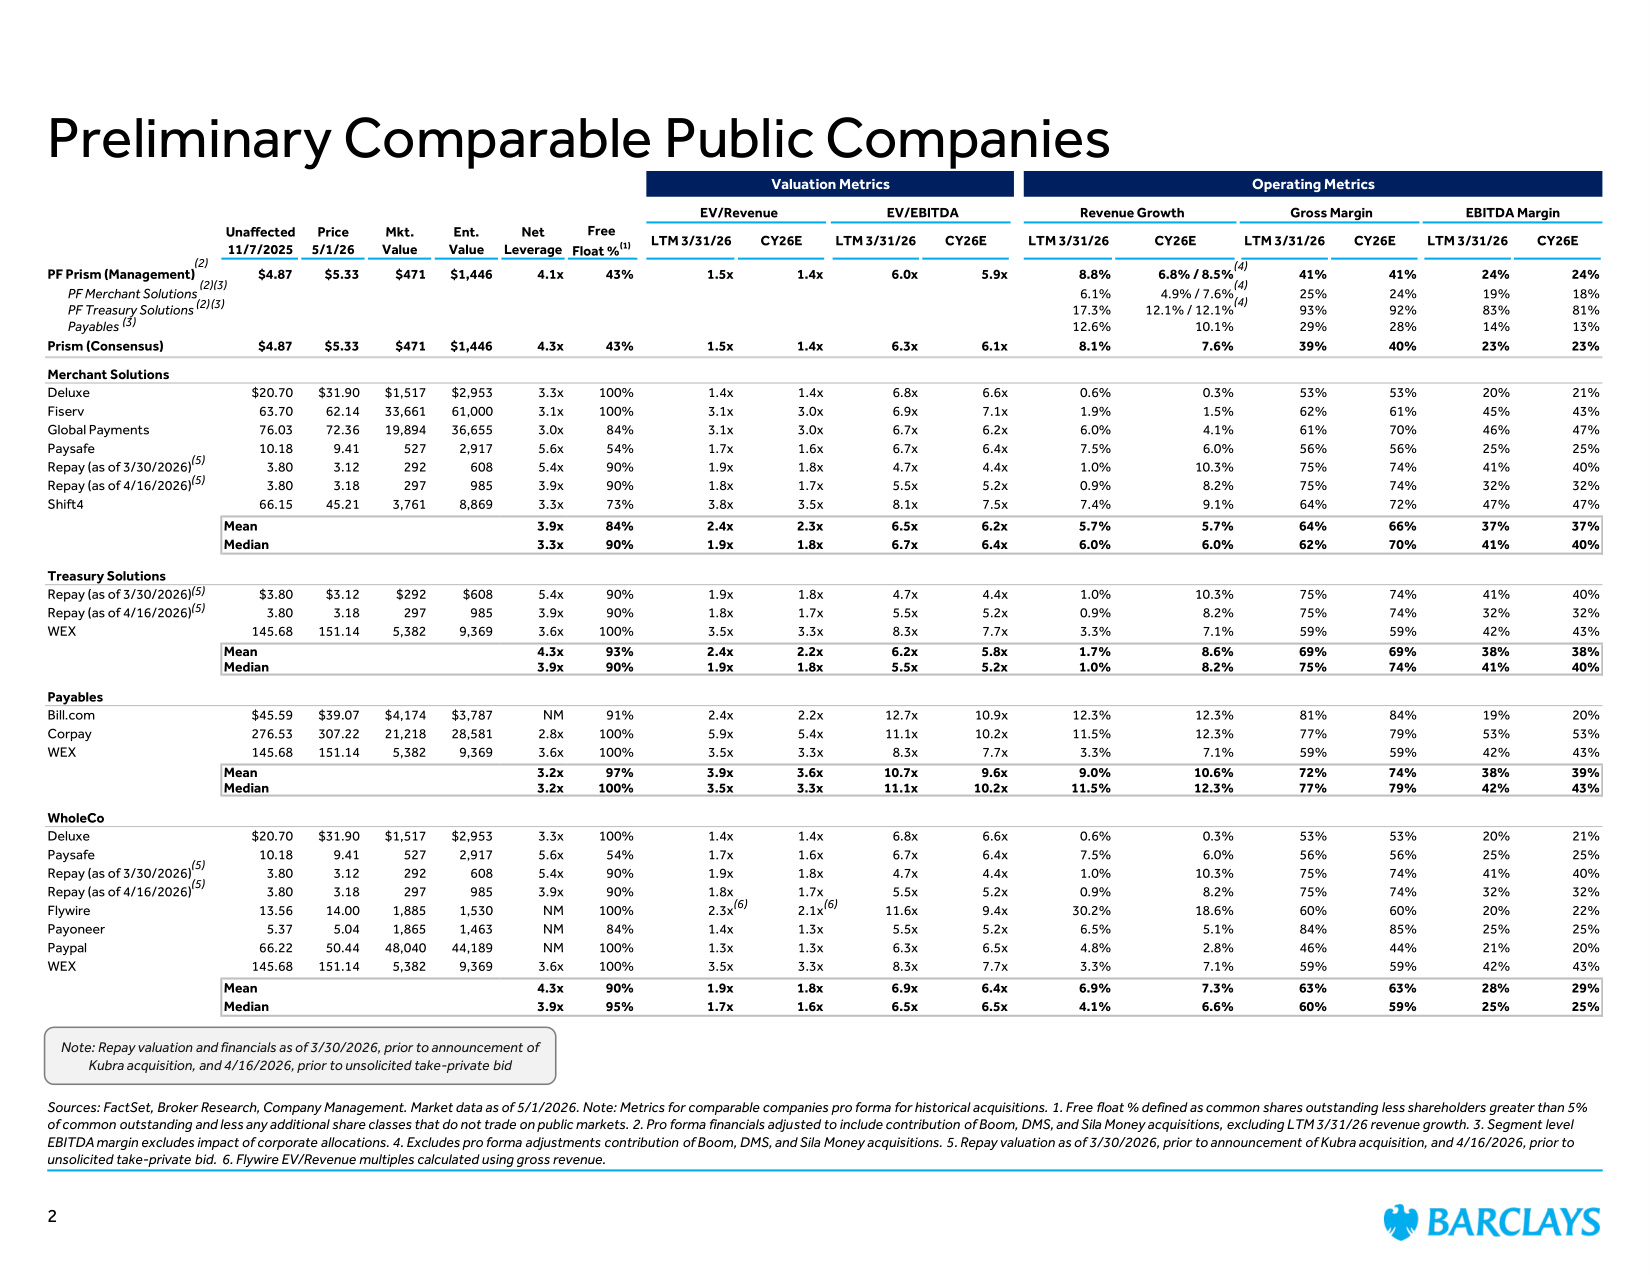
Valuation Metrics Operating Metrics EV/Revenue EV/EBITDA Revenue Growth Gross Margin EBITDA Margin Unaffected 11/7/2025 Price 5/1/26 Mkt. Value Ent. Value Net Leverage Free Float %(1) LTM 3/31/26 CY26E LTM 3/31/26 CY26E LTM 3/31/26 CY26E LTM 3/31/26 CY26E LTM 3/31/26 CY26E PF Prism (Management) $4.87 $5.33 $471 $1,446 4.1x 43% 1.5x 1.4x 6.0x 5.9x 8.8% 6.8% / 8.5% 41% 41% 24% 24% PF Merchant Solutions 6.1% 4.9% / 7.6% 25% 24% 19% 18% PF Treasury Solutions 17.3% 12.1% / 12.1% 93% 92% 83% 81% Payables 12.6% 10.1% 29% 28% 14% 13% Prism (Consensus) $4.87 $5.33 $471 $1,446 4.3x 43% 1.5x 1.4x 6.3x 6.1x 8.1% 7.6% 39% 40% 23% 23% Merchant Solutions Deluxe $20.70 $31.90 $1,517 $2,953 3.3x 100% 1.4x 1.4x 6.8x 6.6x 0.6% 0.3% 53% 53% 20% 21% Fiserv 63.70 62.14 33,661 61,000 3.1x 100% 3.1x 3.0x 6.9x 7.1x 1.9% 1.5% 62% 61% 45% 43% Global Payments 76.03 72.36 19,894 36,655 3.0x 84% 3.1x 3.0x 6.7x 6.2x 6.0% 4.1% 61% 70% 46% 47% Paysafe 10.18 9.41 527 2,917 5.6x 54% 1.7x 1.6x 6.7x 6.4x 7.5% 6.0% 56% 56% 25% 25% Repay (as of 3/30/2026) 3.80 3.12 292 608 5.4x 90% 1.9x 1.8x 4.7x 4.4x 1.0% 10.3% 75% 74% 41% 40% Repay (as of 4/16/2026) 3.80 3.18 297 985 3.9x 90% 1.8x 1.7x 5.5x 5.2x 0.9% 8.2% 75% 74% 32% 32% Shift4 66.15 45.21 3,761 8,869 3.3x 73% 3.8x 3.5x 8.1x 7.5x 7.4% 9.1% 64% 72% 47% 47% Mean 3.9x 84% 2.4x 2.3x 6.5x 6.2x 5.7% 5.7% 64% 66% 37% 37% Median 3.3x 90% 1.9x 1.8x 6.7x 6.4x 6.0% 6.0% 62% 70% 41% 40% Treasury Solutions Repay (as of 3/30/2026) $3.80 $3.12 $292 $608 5.4x 90% 1.9x 1.8x 4.7x 4.4x 1.0% 10.3% 75% 74% 41% 40% Repay (as of 4/16/2026) 3.80 3.18 297 985 3.9x 90% 1.8x 1.7x 5.5x 5.2x 0.9% 8.2% 75% 74% 32% 32% WEX 145.68 151.14 5,382 9,369 3.6x 100% 3.5x 3.3x 8.3x 7.7x 3.3% 7.1% 59% 59% 42% 43% Mean 4.3x 93% 2.4x 2.2x 6.2x 5.8x 1.7% 8.6% 69% 69% 38% 38% Median 3.9x 90% 1.9x 1.8x 5.5x 5.2x 1.0% 8.2% 75% 74% 41% 40% Payables Bill.com $45.59 $39.07 $4,174 $3,787 NM 91% 2.4x 2.2x 12.7x 10.9x 12.3% 12.3% 81% 84% 19% 20% Corpay 276.53 307.22 21,218 28,581 2.8x 100% 5.9x 5.4x 11.1x 10.2x 11.5% 12.3% 77% 79% 53% 53% WEX 145.68 151.14 5,382 9,369 3.6x 100% 3.5x 3.3x 8.3x 7.7x 3.3% 7.1% 59% 59% 42% 43% Mean 3.2x 97% 3.9x 3.6x 10.7x 9.6x 9.0% 10.6% 72% 74% 38% 39% Median 3.2x 100% 3.5x 3.3x 11.1x 10.2x 11.5% 12.3% 77% 79% 42% 43% WholeCo Deluxe $20.70 $31.90 $1,517 $2,953 3.3x 100% 1.4x 1.4x 6.8x 6.6x 0.6% 0.3% 53% 53% 20% 21% Paysafe 10.18 9.41 527 2,917 5.6x 54% 1.7x 1.6x 6.7x 6.4x 7.5% 6.0% 56% 56% 25% 25% Repay (as of 3/30/2026) 3.80 3.12 292 608 5.4x 90% 1.9x 1.8x 4.7x 4.4x 1.0% 10.3% 75% 74% 41% 40% Repay (as of 4/16/2026) 3.80 3.18 297 985 3.9x 90% 1.8x 1.7x 5.5x 5.2x 0.9% 8.2% 75% 74% 32% 32% Flywire 13.56 14.00 1,885 1,530 NM 100% 2.3x 2.1x 11.6x 9.4x 30.2% 18.6% 60% 60% 20% 22% Payoneer 5.37 5.04 1,865 1,463 NM 84% 1.4x 1.3x 5.5x 5.2x 6.5% 5.1% 84% 85% 25% 25% Paypal 66.22 50.44 48,040 44,189 NM 100% 1.3x 1.3x 6.3x 6.5x 4.8% 2.8% 46% 44% 21% 20% WEX 145.68 151.14 5,382 9,369 3.6x 100% 3.5x 3.3x 8.3x 7.7x 3.3% 7.1% 59% 59% 42% 43% Mean 4.3x 90% 1.9x 1.8x 6.9x 6.4x 6.9% 7.3% 63% 63% 28% 29% Median 3.9x 95% 1.7x 1.6x 6.5x 6.5x 4.1% 6.6% 60% 59% 25% 25% Preliminary Comparable Public Companies Sources: FactSet, Broker Research, Company Management. Market data as of 5/1/2026. Note: Metrics for comparable companies pro forma for historical acquisitions. 1. Free float % defined as common shares outstanding less shareholders greater than 5% of common outstanding and less any additional share classes that do not trade on public markets. 2. Pro forma financials adjusted to include contribution of Boom, DMS, and Sila Money acquisitions, excluding LTM 3/31/26 revenue growth. 3. Segment level EBITDA margin excludes impact of corporate allocations. 4. Excludes pro forma adjustments contribution of Boom, DMS, and Sila Money acquisitions. 5. Repay valuation as of 3/30/2026, prior to announcement of Kubra acquisition, and 4/16/2026, prior to unsolicited take-private bid. 6. Flywire EV/Revenue multiples calculated using gross revenue. (6) (2) (2) (2) (3) (3) (3) (4) (4) (4) 2 (6) (5) (5) (5) Note: Repay valuation and financials as of 3/30/2026, prior to announcement of Kubra acquisition, and 4/16/2026, prior to unsolicited take-private bid (5) (5) (5)
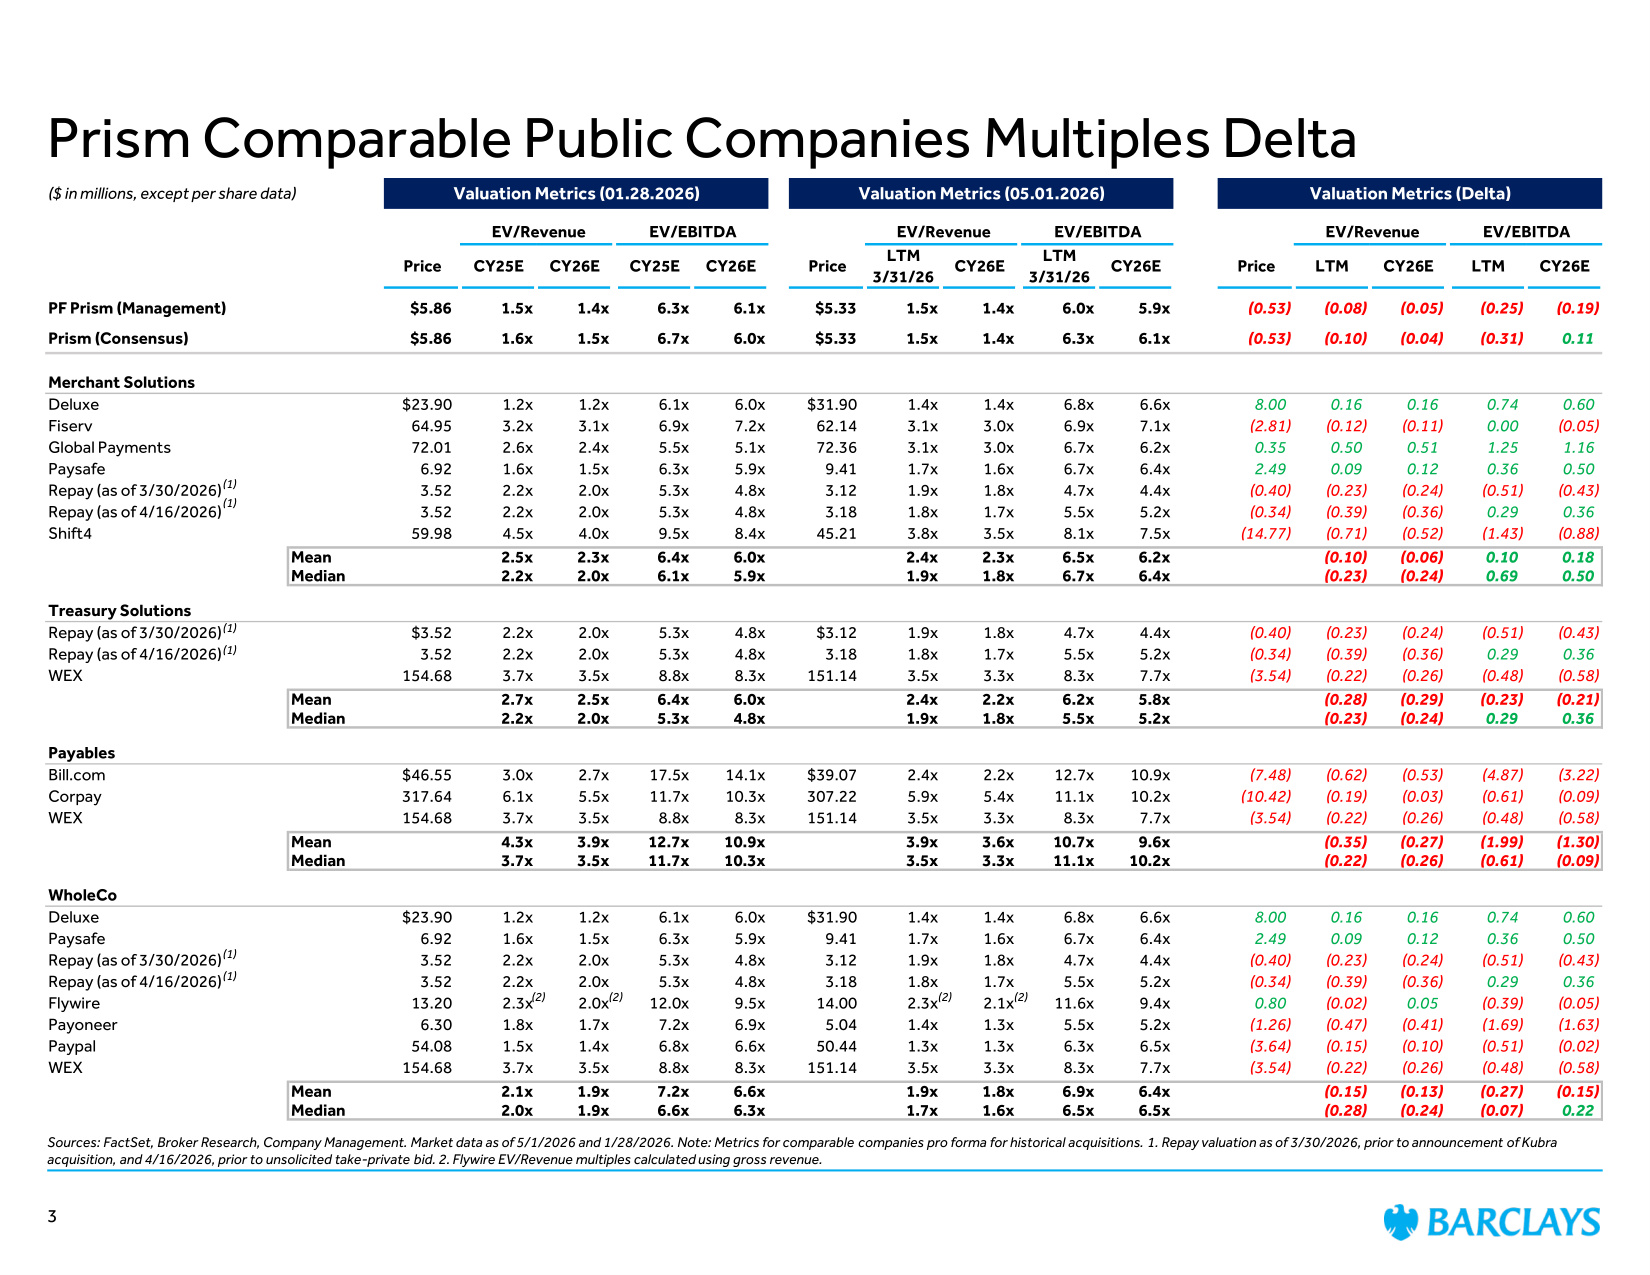
($ in millions, except per share data) Valuation Metrics (01.28.2026) Valuation Metrics (05.01.2026) Valuation Metrics (Delta) EV/Revenue EV/EBITDA EV/Revenue EV/EBITDA EV/Revenue EV/EBITDA Price CY25E CY26E CY25E CY26E Price LTM 3/31/26 CY26E LTM 3/31/26 CY26E Price LTM CY26E LTM CY26E PF Prism (Management) $5.86 1.5x 1.4x 6.3x 6.1x $5.33 1.5x 1.4x 6.0x 5.9x (0.53) (0.08) (0.05) (0.25) (0.19) Prism (Consensus) $5.86 1.6x 1.5x 6.7x 6.0x $5.33 1.5x 1.4x 6.3x 6.1x (0.53) (0.10) (0.04) (0.31) 0.11 Merchant Solutions Deluxe $23.90 1.2x 1.2x 6.1x 6.0x $31.90 1.4x 1.4x 6.8x 6.6x 8.00 0.16 0.16 0.74 0.60 Fiserv 64.95 3.2x 3.1x 6.9x 7.2x 62.14 3.1x 3.0x 6.9x 7.1x (2.81) (0.12) (0.11) 0.00 (0.05) Global Payments 72.01 2.6x 2.4x 5.5x 5.1x 72.36 3.1x 3.0x 6.7x 6.2x 0.35 0.50 0.51 1.25 1.16 Paysafe 6.92 1.6x 1.5x 6.3x 5.9x 9.41 1.7x 1.6x 6.7x 6.4x 2.49 0.09 0.12 0.36 0.50 Repay (as of 3/30/2026) 3.52 2.2x 2.0x 5.3x 4.8x 3.12 1.9x 1.8x 4.7x 4.4x (0.40) (0.23) (0.24) (0.51) (0.43) Repay (as of 4/16/2026) 3.52 2.2x 2.0x 5.3x 4.8x 3.18 1.8x 1.7x 5.5x 5.2x (0.34) (0.39) (0.36) 0.29 0.36 Shift4 59.98 4.5x 4.0x 9.5x 8.4x 45.21 3.8x 3.5x 8.1x 7.5x (14.77) (0.71) (0.52) (1.43) (0.88) Mean 2.5x 2.3x 6.4x 6.0x 2.4x 2.3x 6.5x 6.2x (0.10) (0.06) 0.10 0.18 Median 2.2x 2.0x 6.1x 5.9x 1.9x 1.8x 6.7x 6.4x (0.23) (0.24) 0.69 0.50 Treasury Solutions Repay (as of 3/30/2026) $3.52 2.2x 2.0x 5.3x 4.8x $3.12 1.9x 1.8x 4.7x 4.4x (0.40) (0.23) (0.24) (0.51) (0.43) Repay (as of 4/16/2026) 3.52 2.2x 2.0x 5.3x 4.8x 3.18 1.8x 1.7x 5.5x 5.2x (0.34) (0.39) (0.36) 0.29 0.36 WEX 154.68 3.7x 3.5x 8.8x 8.3x 151.14 3.5x 3.3x 8.3x 7.7x (3.54) (0.22) (0.26) (0.48) (0.58) Mean 2.7x 2.5x 6.4x 6.0x 2.4x 2.2x 6.2x 5.8x (0.28) (0.29) (0.23) (0.21) Median 2.2x 2.0x 5.3x 4.8x 1.9x 1.8x 5.5x 5.2x (0.23) (0.24) 0.29 0.36 Payables Bill.com $46.55 3.0x 2.7x 17.5x 14.1x $39.07 2.4x 2.2x 12.7x 10.9x (7.48) (0.62) (0.53) (4.87) (3.22) Corpay 317.64 6.1x 5.5x 11.7x 10.3x 307.22 5.9x 5.4x 11.1x 10.2x (10.42) (0.19) (0.03) (0.61) (0.09) WEX 154.68 3.7x 3.5x 8.8x 8.3x 151.14 3.5x 3.3x 8.3x 7.7x (3.54) (0.22) (0.26) (0.48) (0.58) Mean 4.3x 3.9x 12.7x 10.9x 3.9x 3.6x 10.7x 9.6x (0.35) (0.27) (1.99) (1.30) Median 3.7x 3.5x 11.7x 10.3x 3.5x 3.3x 11.1x 10.2x (0.22) (0.26) (0.61) (0.09) WholeCo Deluxe $23.90 1.2x 1.2x 6.1x 6.0x $31.90 1.4x 1.4x 6.8x 6.6x 8.00 0.16 0.16 0.74 0.60 Paysafe 6.92 1.6x 1.5x 6.3x 5.9x 9.41 1.7x 1.6x 6.7x 6.4x 2.49 0.09 0.12 0.36 0.50 Repay (as of 3/30/2026) 3.52 2.2x 2.0x 5.3x 4.8x 3.12 1.9x 1.8x 4.7x 4.4x (0.40) (0.23) (0.24) (0.51) (0.43) Repay (as of 4/16/2026) 3.52 2.2x 2.0x 5.3x 4.8x 3.18 1.8x 1.7x 5.5x 5.2x (0.34) (0.39) (0.36) 0.29 0.36 Flywire 13.20 2.3x 2.0x 12.0x 9.5x 14.00 2.3x 2.1x 11.6x 9.4x 0.80 (0.02) 0.05 (0.39) (0.05) Payoneer 6.30 1.8x 1.7x 7.2x 6.9x 5.04 1.4x 1.3x 5.5x 5.2x (1.26) (0.47) (0.41) (1.69) (1.63) Paypal 54.08 1.5x 1.4x 6.8x 6.6x 50.44 1.3x 1.3x 6.3x 6.5x (3.64) (0.15) (0.10) (0.51) (0.02) WEX 154.68 3.7x 3.5x 8.8x 8.3x 151.14 3.5x 3.3x 8.3x 7.7x (3.54) (0.22) (0.26) (0.48) (0.58) Mean 2.1x 1.9x 7.2x 6.6x 1.9x 1.8x 6.9x 6.4x (0.15) (0.13) (0.27) (0.15) Median 2.0x 1.9x 6.6x 6.3x 1.7x 1.6x 6.5x 6.5x (0.28) (0.24) (0.07) 0.22 Prism Comparable Public Companies Multiples Delta Sources: FactSet, Broker Research, Company Management. Market data as of 5/1/2026 and 1/28/2026. Note: Metrics for comparable companies pro forma for historical acquisitions. 1. Repay valuation as of 3/30/2026, prior to announcement of Kubra acquisition, and 4/16/2026, prior to unsolicited take-private bid. 2. Flywire EV/Revenue multiples calculated using gross revenue. (2) (2) (2) (2) 3 (1) (1) (1) (1) (1) (1)
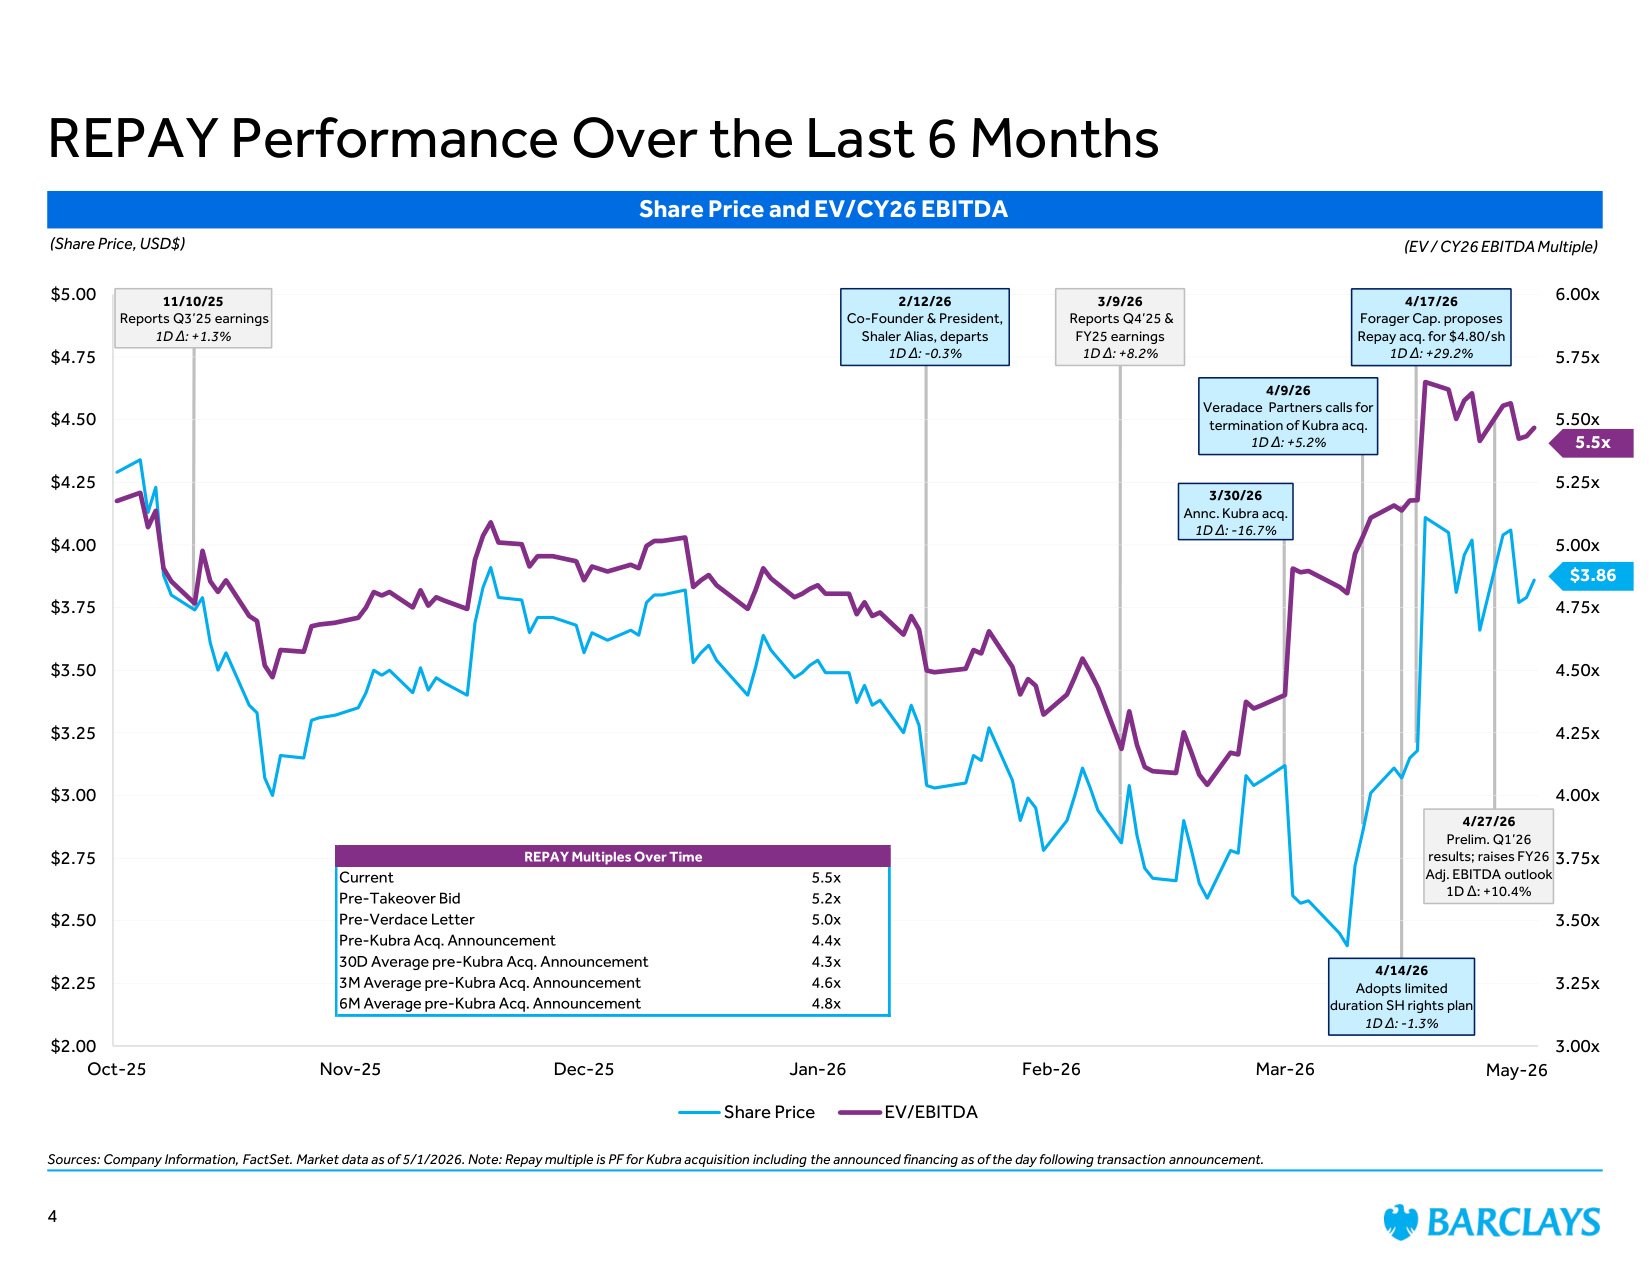
Sources: Company Information, FactSet. Market data as of 5/1/2026. Note: Repay multiple is PF for Kubra acquisition including the announced financing as of the day following transaction announcement. REPAY Performance Over the Last 6 Months Share Price and EV/CY26 EBITDA (Share Price, USD$) 4 (EV / CY26 EBITDA Multiple) 3.00x 3.25x 3.50x 3.75x 4.00x 4.25x 4.50x 4.75x 5.00x 5.25x 5.50x 5.75x 6.00x $2.00 $2.25 $2.50 $2.75 $3.00 $3.25 $3.50 $3.75 $4.00 $4.25 $4.50 $4.75 $5.00 Oct-25 Nov-25 Dec-25 Jan-26 Feb-26 Mar-26 Apr-26 Share Price EV/EBITDA REPAY Multiples Over Time Current 5.5x Pre-Takeover Bid 5.2x Pre-Verdace Letter 5.0x Pre-Kubra Acq. Announcement 4.4x 30D Average pre-Kubra Acq. Announcement 4.3x 3M Average pre-Kubra Acq. Announcement 4.6x 6M Average pre-Kubra Acq. Announcement 4.8x $3.86 5.5x 4/27/26 Prelim. Q1'26 results; raises FY26 Adj. EBITDA outlook 1D Δ: +10.4% 2/12/26 Co-Founder & President, Shaler Alias, departs 1D Δ: -0.3% 3/9/26 Reports Q4'25 & FY25 earnings 1D Δ: +8.2% 3/30/26 Annc. Kubra acq. 1D Δ: -16.7% 4/9/26 Veradace Partners calls for termination of Kubra acq. 1D Δ: +5.2% 4/17/26 Forager Cap. proposes Repay acq. for $4.80/sh 1D Δ: +29.2% 11/10/25 Reports Q3'25 earnings 1D Δ: +1.3% 4/14/26 Adopts limited duration SH rights plan 1D Δ: -1.3% May-26
The following pages contain material that was provided to the Board of Directors (the "Board") of Prism (the "Company") by Barclays Capital Inc. ("Barclays"). The accompanying material and any Barclays presentation related to the material was compiled or prepared on a confidential basis solely for consideration by the Board and no part of it may be reproduced, distributed or transmitted without the prior written consent of Barclays. The information contained in this material was obtained from the Company and/or publicly available sources, and Barclays has relied upon such information without independent verification thereof and does not assume any liability for any such information. These materials are being provided in connection with an actual corporate engagement and may not be used or relied upon for any purpose other than as specifically contemplated by a written agreement with Barclays. Moreover, any information provided herein was not prepared for or intended for use by any individual for personal, family or household purposes. Any estimates, historical financial information, projections and other information contained herein have been prepared by management of the Company or were obtained from publicly available sources (approved for Barclays' use by the Company) or are based upon such estimates and projections. With respect to such estimates and projections, Barclays has assumed that they have been reasonably prepared on a basis reflecting the best currently available estimates, projections and judgment of the management of the Company. The projections contained herein may or may not be achieved and differences between projected results and those actually achieved may be material. No representation or warranty, expressed or implied, is made as to the accuracy or completeness of such information and nothing contained herein is, or shall be relied upon as, a promise or representation, whether as to the past or the future. The analysis contained herein is based on current market conditions which are subject to change and Barclays assumes no obligation to update or otherwise revise these materials. Nothing in these materials shall be deemed to constitute a recommendation or investment, legal, tax, financial, accounting or other advice. Because these materials were prepared for use in the context of a presentation to the Board, these materials are incomplete without reference to, and should be assessed solely in conjunction with, the oral briefing provided by Barclays to the Board (in their capacity as directors and not in any individual capacity and is not for the benefit of any individual, including any individual officer, director, shareholder or any other person). These materials were not prepared for or intended for use by any individual for personal, family or household purposes nor were they prepared to comply with the disclosure standards under state and federal securities laws or any other applicable laws and, to the extent the material may be considered by readers not as familiar with the business and affairs of the Company as the Board, none of the Company, Barclays, their respective affiliates or any of their respective legal or financial advisors or accountants takes any responsibility for the accuracy or completeness of any of the material if used by persons other than the Board. These materials are not intended to provide the sole basis for evaluation of the proposed corporate transaction and do not purport to contain all information that may be required and should not be considered a recommendation with respect to the proposed corporate transaction. Barclays has not made or obtained any evaluations or appraisals of the assets or liabilities of the Company or any other party to any corporate transaction or any of their respective affiliates and has no obligation to evaluate the solvency of the Company or any other party to any transaction under any state or federal laws relating to bankruptcy, insolvency or similar matters. The analyses contained herein do not purport to be appraisals nor do they necessarily reflect the prices at which businesses or securities actually may be sold or purchased. Barclays' role in any due diligence review is limited solely to performing such a review as it shall deem necessary to support its own advice and analysis and shall not be on behalf of the Company, the Board or any individual officer, director, shareholder or any other person. Barclays, its subsidiaries and affiliates engage in a wide range of businesses from investment and commercial banking, lending, asset management and other financial and non-financial services. In the ordinary course of its business, Barclays and its affiliates may actively trade and effect transactions in the equity, debt and/or other securities (and any derivatives thereof) and financial instruments (including loans and other obligations) of the Company for its own account and for the accounts of its customers and, accordingly, may at any time hold long or short positions and investments in such securities and financial instruments or in other financial products and instruments. Unless otherwise expressly agreed or provided for in other applicable Barclays disclosures governing such corporate transactions or required by law or regulation, Barclays conducts these activities as principal and executes its principal transactions as an arm's length counterparty. Barclays does not act as a fiduciary in relation to these corporate transactions. These materials do not constitute investment advice nor do they form part of an offer to sell or purchase, or the solicitation of an offer to sell or purchase, any securities or any of the businesses or assets described herein or an offer of financing or an offer or recommendation to enter into any corporate transaction described herein. Barclays Capital Inc. is the United States investment bank of Barclays Bank PLC. Barclays Bank PLC is authorised by the Prudential Regulation Authority and regulated by the Financial Conduct Authority and the Prudential Regulation Authority (Financial Services Register No. 122702). Registered in England. Registered No. 1026167. Registered office: 1 Churchill Place, London E14 5HP. Neither Barclays Bank PLC, New York Branch nor Barclays Bank Delaware is responsible for the obligations of its affiliates. Copyright Barclays Bank PLC, 2026 (all rights reserved). Disclaimer 5