Exhibit (C)(10)
Project Prism: Valuation Analysis September 2026
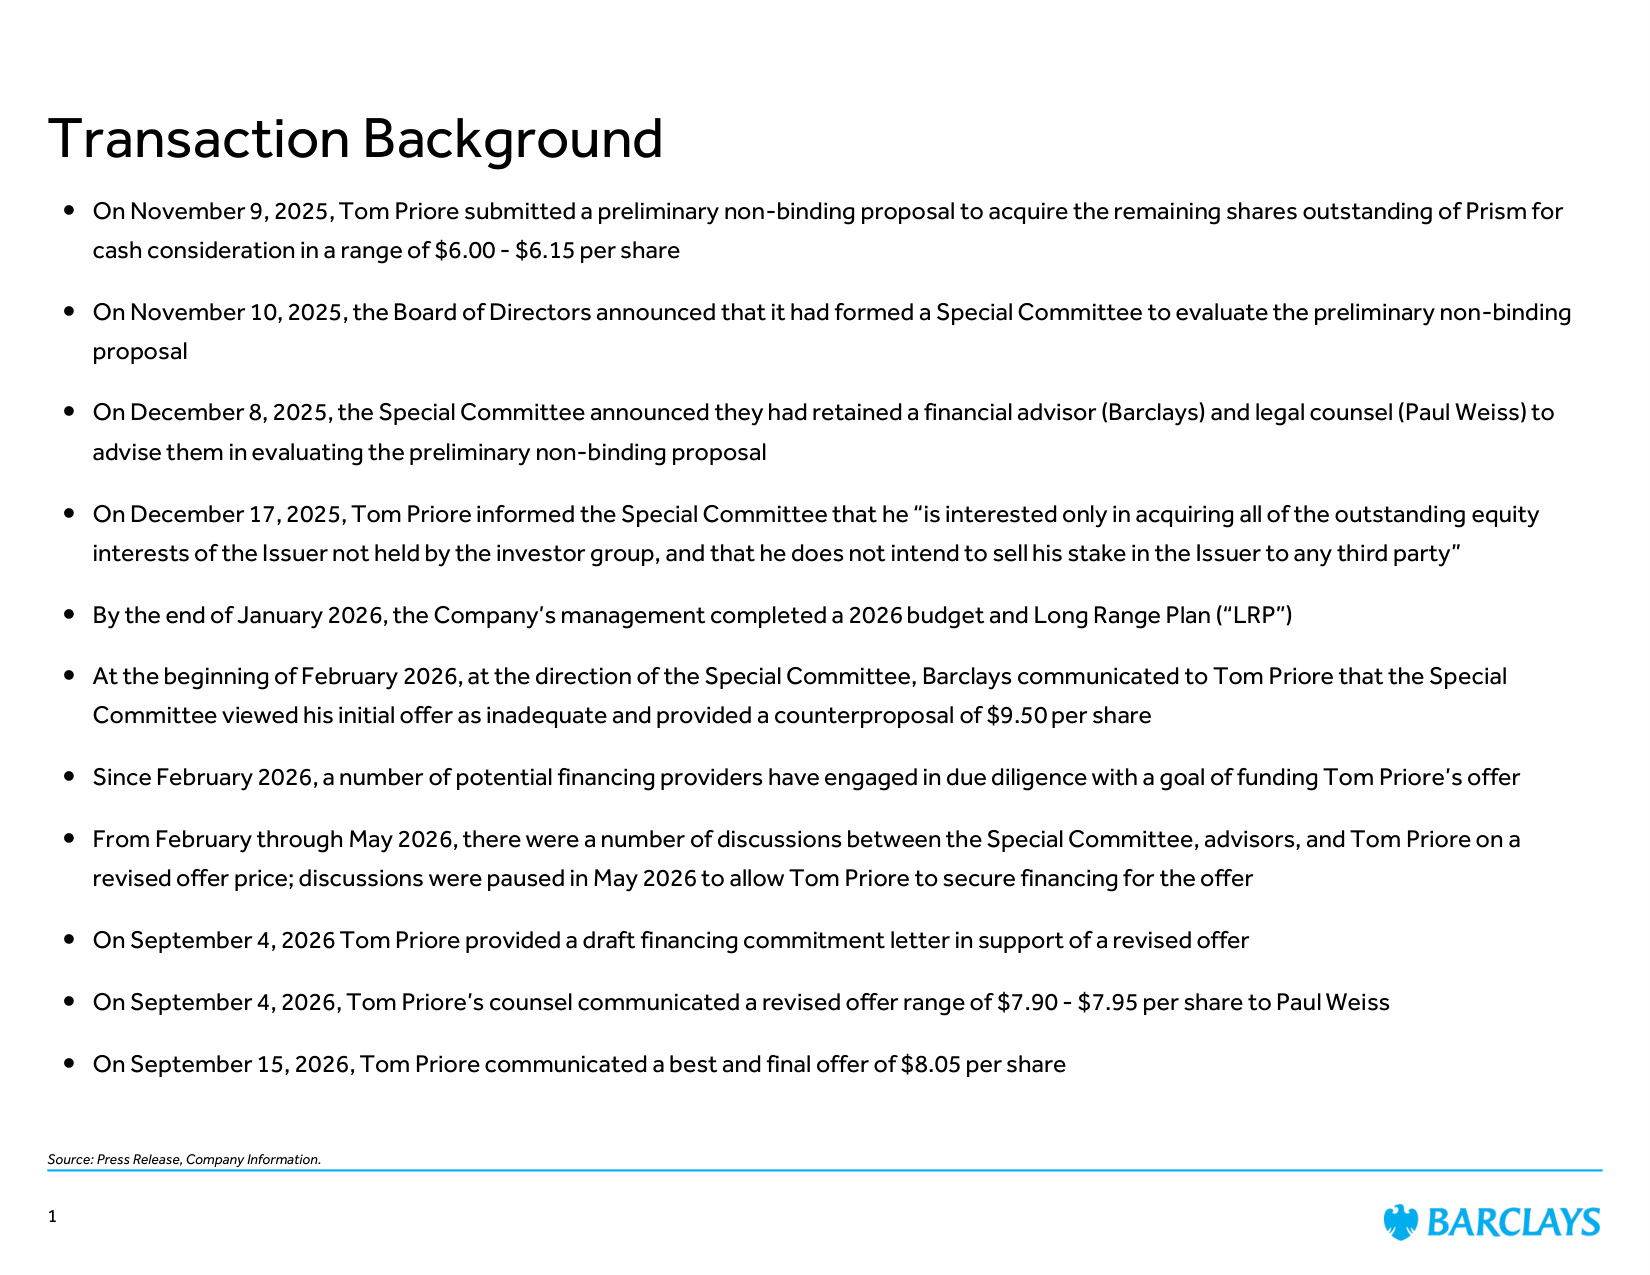
Source: Press Release, Company Information. Transaction Background On November 9, 2025, Tom Priore submitted a preliminary non-binding proposal to acquire the remaining shares outstanding of Prism for cash consideration in a range of $6.00 - $6.15 per share On November 10, 2025, the Board of Directors announced that it had formed a Special Committee to evaluate the preliminary non-binding proposal On December 8, 2025, the Special Committee announced they had retained a financial advisor (Barclays) and legal counsel (Paul Weiss) to advise them in evaluating the preliminary non-binding proposal On December 17, 2025, Tom Priore informed the Special Committee that he "is interested only in acquiring all of the outstanding equity interests of the Issuer not held by the investor group, and that he does not intend to sell his stake in the Issuer to any third party" By the end of January 2026, the Company's management completed a 2026 budget and Long Range Plan ("LRP") At the beginning of February 2026, at the direction of the Special Committee, Barclays communicated to Tom Priore that the Special Committee viewed his initial offer as inadequate and provided a counterproposal of $9.50 per share Since February 2026, a number of potential financing providers have engaged in due diligence with a goal of funding Tom Priore's offer From February through May 2026, there were a number of discussions between the Special Committee, advisors, and Tom Priore on a revised offer price; discussions were paused in May 2026 to allow Tom Priore to secure financing for the offer On September 4, 2026 Tom Priore provided a draft financing commitment letter in support of a revised offer On September 4, 2026, Tom Priore's counsel communicated a revised offer range of $7.90 - $7.95 per share to Paul Weiss On September 15, 2026, Tom Priore communicated a best and final offer of $8.05 per share 1

Contents 1. Market Backdrop and Trading Performance 2. Review of Company Financials & Forecasts 3. Valuation Perspectives 4. Appendix
Market Backdrop and Trading Performance
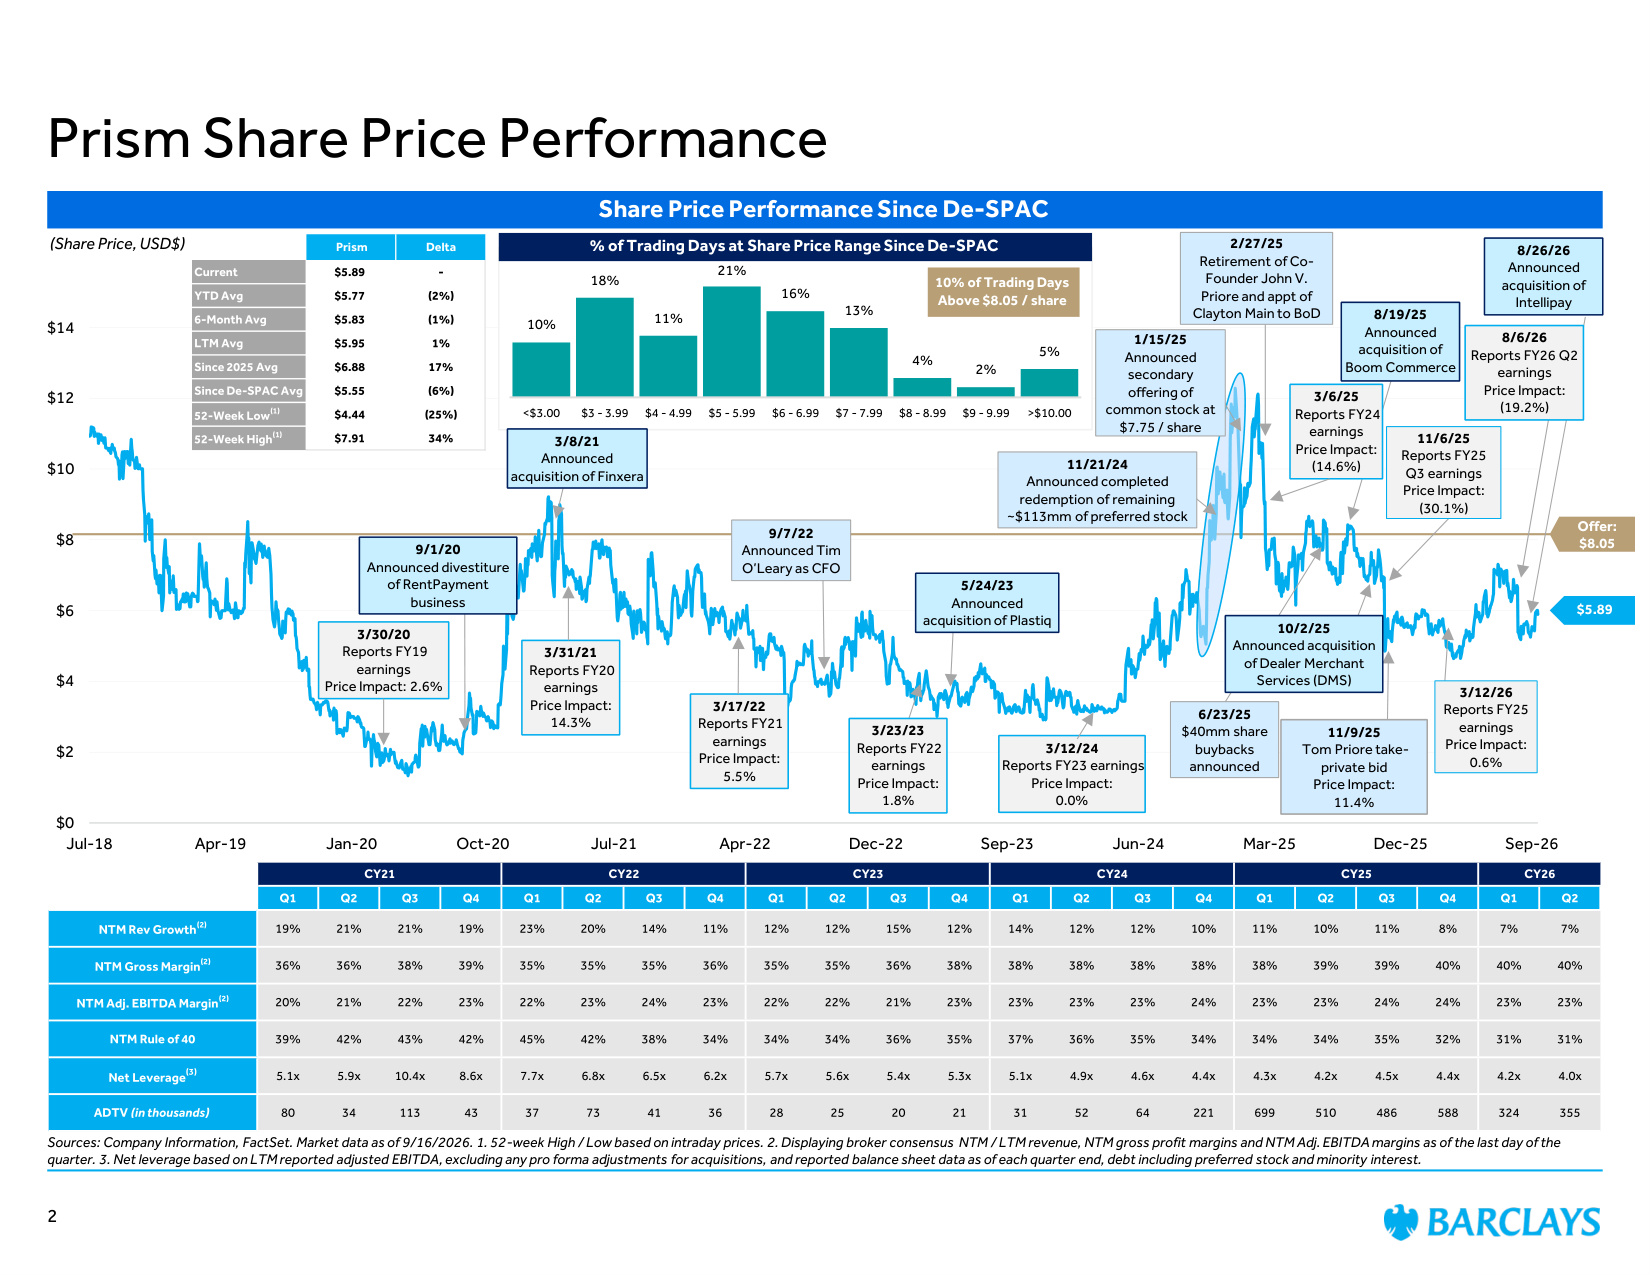
Offer: $8.05 $0 $2 $4 $6 $8 $10 $12 $14 Jul-18 Apr-19 Jan-20 Oct-20 Jul-21 Apr-22 Dec-22 Sep-23 Jun-24 Mar-25 Dec-25 Sep-26 Sources: Company Information, FactSet. Market data as of 9/16/2026. 1. 52-week High / Low based on intraday prices. 2. Displaying broker consensus NTM / LTM revenue, NTM gross profit margins and NTM Adj. EBITDA margins as of the last day of the quarter. 3. Net leverage based on LTM reported adjusted EBITDA, excluding any pro forma adjustments for acquisitions, and reported balance sheet data as of each quarter end, debt including preferred stock and minority interest. Prism Share Price Performance Share Price Performance Since De-SPAC (Share Price, USD$) 6/23/25 $40mm share buybacks announced 3/17/22 Reports FY21 earnings Price Impact: 5.5% $5.89 3/12/24 Reports FY23 earnings Price Impact: 0.0% 2/27/25 Retirement of Co- Founder John V. Priore and appt of Clayton Main to BoD 2 9/7/22 Announced Tim O'Leary as CFO 5/24/23 Announced acquisition of Plastiq 8/19/25 Announced acquisition of Boom Commerce 10/2/25 Announced acquisition of Dealer Merchant Services (DMS) 3/31/21 Reports FY20 earnings Price Impact: 14.3% CY21 CY22 CY23 CY24 CY25 CY26 Q1 Q2 Q3 Q4 Q1 Q2 Q3 Q4 Q1 Q2 Q3 Q4 Q1 Q2 Q3 Q4 Q1 Q2 Q3 Q4 Q1 Q2 NTM Rev Growth(2) 19% 21% 21% 19% 23% 20% 14% 11% 12% 12% 15% 12% 14% 12% 12% 10% 11% 10% 11% 8% 7% 7% NTM Gross Margin(2) 36% 36% 38% 39% 35% 35% 35% 36% 35% 35% 36% 38% 38% 38% 38% 38% 38% 39% 39% 40% 40% 40% NTM Adj. EBITDA Margin(2) 20% 21% 22% 23% 22% 23% 24% 23% 22% 22% 21% 23% 23% 23% 23% 24% 23% 23% 24% 24% 23% 23% NTM Rule of 40 39% 42% 43% 42% 45% 42% 38% 34% 34% 34% 36% 35% 37% 36% 35% 34% 34% 34% 35% 32% 31% 31% Net Leverage(3) 5.1x 5.9x 10.4x 8.6x 7.7x 6.8x 6.5x 6.2x 5.7x 5.6x 5.4x 5.3x 5.1x 4.9x 4.6x 4.4x 4.3x 4.2x 4.5x 4.4x 4.2x 4.0x ADTV (in thousands) 80 34 113 43 37 73 41 36 28 25 20 21 31 52 64 221 699 510 486 588 324 355 Prism Delta Current $5.89 - YTD Avg $5.77 (2%) 6-Month Avg $5.83 (1%) LTM Avg $5.95 1% Since 2025 Avg $6.88 17% Since De-SPAC Avg $5.55 (6%) 52-Week Low(1) $4.44 (25%) 52-Week High(1) $7.91 34% 3/30/20 Reports FY19 earnings Price Impact: 2.6% 9/1/20 Announced divestiture of RentPayment business 10% 18% 11% 21% 16% 13% 4% 2% 5% <$3.00 $3 - 3.99 $4 - 4.99 $5 - 5.99 $6 - 6.99 $7 - 7.99 $8 - 8.99 $9 - 9.99 >$10.00 % of Trading Days at Share Price Range Since De-SPAC 3/6/25 Reports FY24 earnings Price Impact: (14.6%) 11/6/25 Reports FY25 Q3 earnings Price Impact: (30.1%) 11/9/25 Tom Priore take- private bid Price Impact: 11.4% 3/12/26 Reports FY25 earnings Price Impact: 0.6% 3/8/21 Announced acquisition of Finxera 1/15/25 Announced secondary offering of common stock at $7.75 / share 11/21/24 Announced completed redemption of remaining ~$113mm of preferred stock 10% of Trading Days Above $8.05 / share 8/26/26 Announced acquisition of Intellipay 8/6/26 Reports FY26 Q2 earnings Price Impact: (19.2%) 3/23/23 Reports FY22 earnings Price Impact: 1.8%
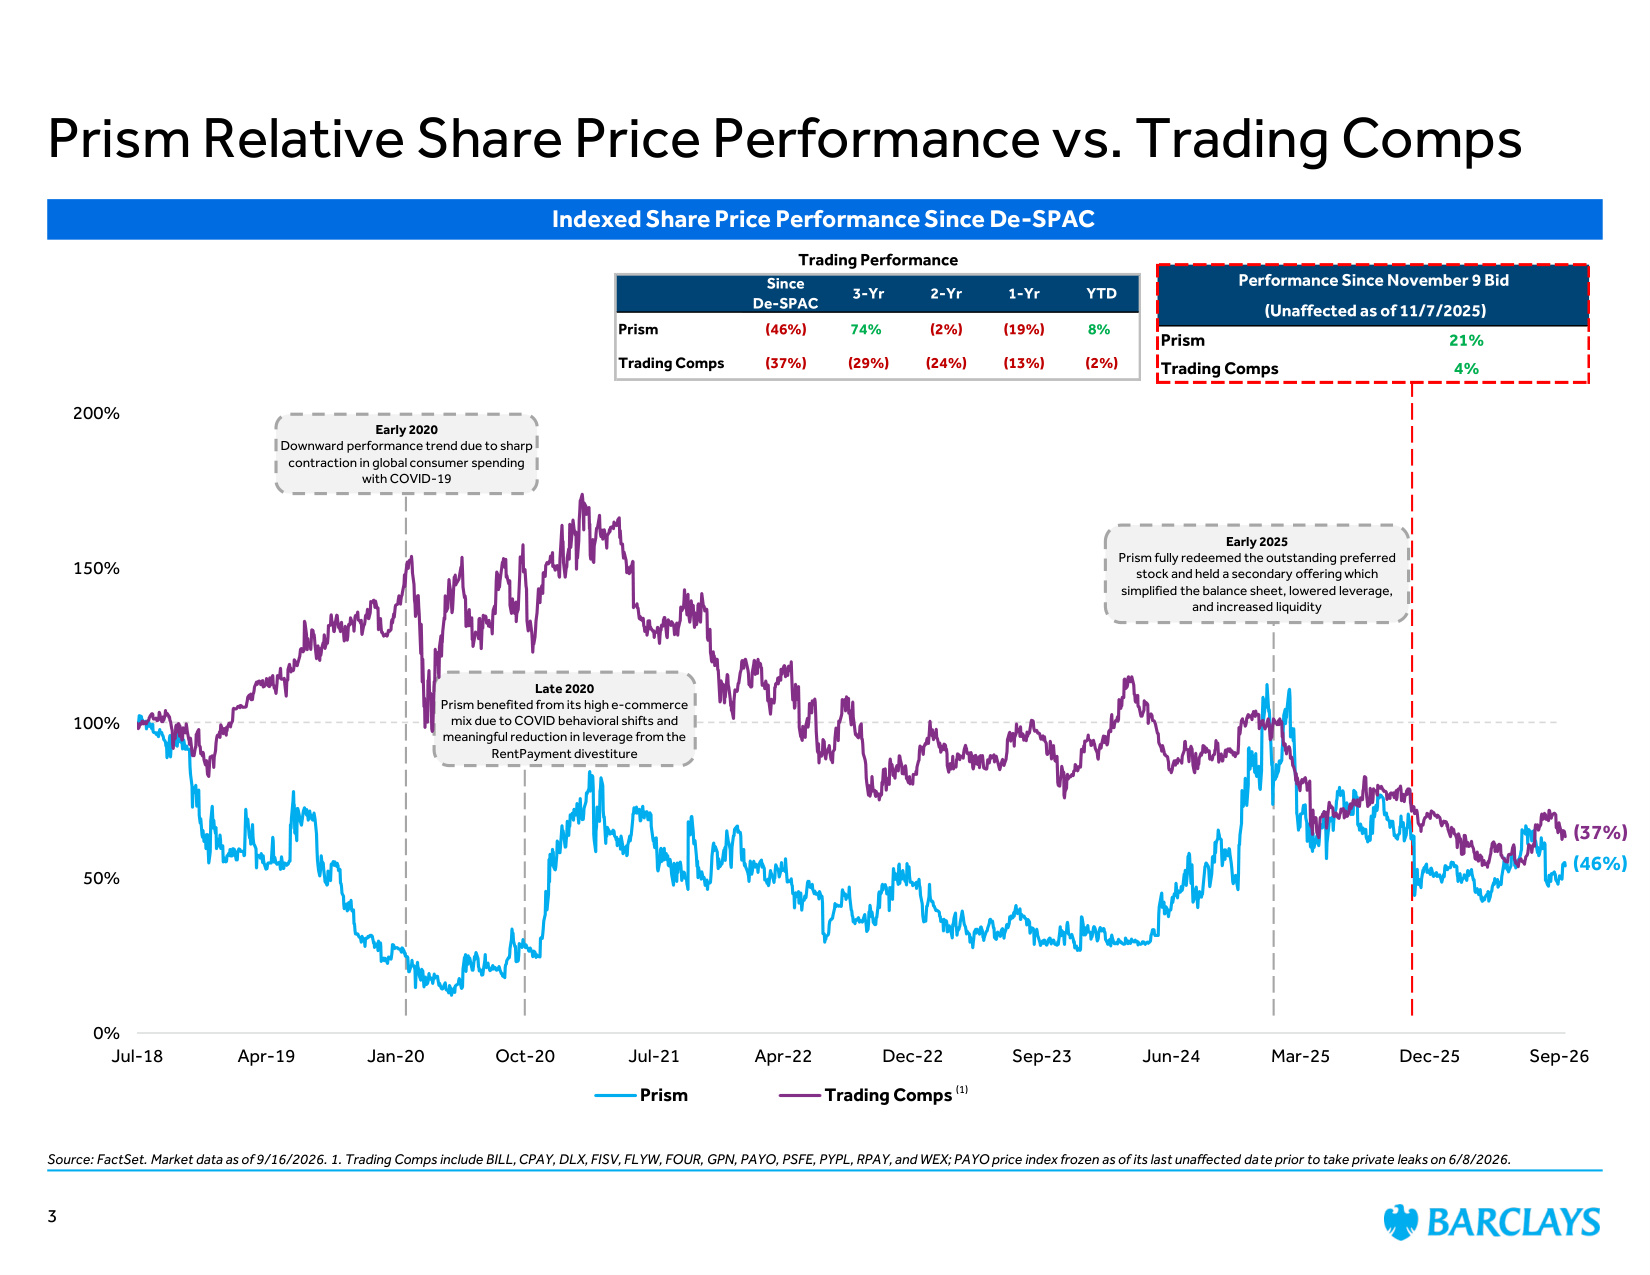
Indexed Share Price Performance Since De-SPAC (37%) (46%) (1) Performance Since November 9 Bid (Unaffected as of 11/7/2025) Prism 21% Trading Comps 4% Trading Performance Since De-SPAC 3-Yr 2-Yr 1-Yr YTD Prism (46%) 74% (2%) (19%) 8% Trading Comps (37%) (29%) (24%) (13%) (2%) Prism Relative Share Price Performance vs. Trading Comps Source: FactSet. Market data as of 9/16/2026. 1. Trading Comps include BILL, CPAY, DLX, FISV, FLYW, FOUR, GPN, PAYO, PSFE, PYPL, RPAY, and WEX; PAYO price index frozen as of its last unaffected date prior to take private leaks on 6/8/2026. Early 2020 Downward performance trend due to sharp contraction in global consumer spending with COVID-19 Early 2025 Prism fully redeemed the outstanding preferred stock and held a secondary offering which simplified the balance sheet, lowered leverage, and increased liquidity Late 2020 Prism benefited from its high e-commerce mix due to COVID behavioral shifts and meaningful reduction in leverage from the RentPayment divestiture 0% 50% 100% 150% 200% Jul-18 Apr-19 Jan-20 Oct-20 Jul-21 Apr-22 Dec-22 Sep-23 Jun-24 Mar-25 Dec-25 Sep-26 Prism Trading Comps 3
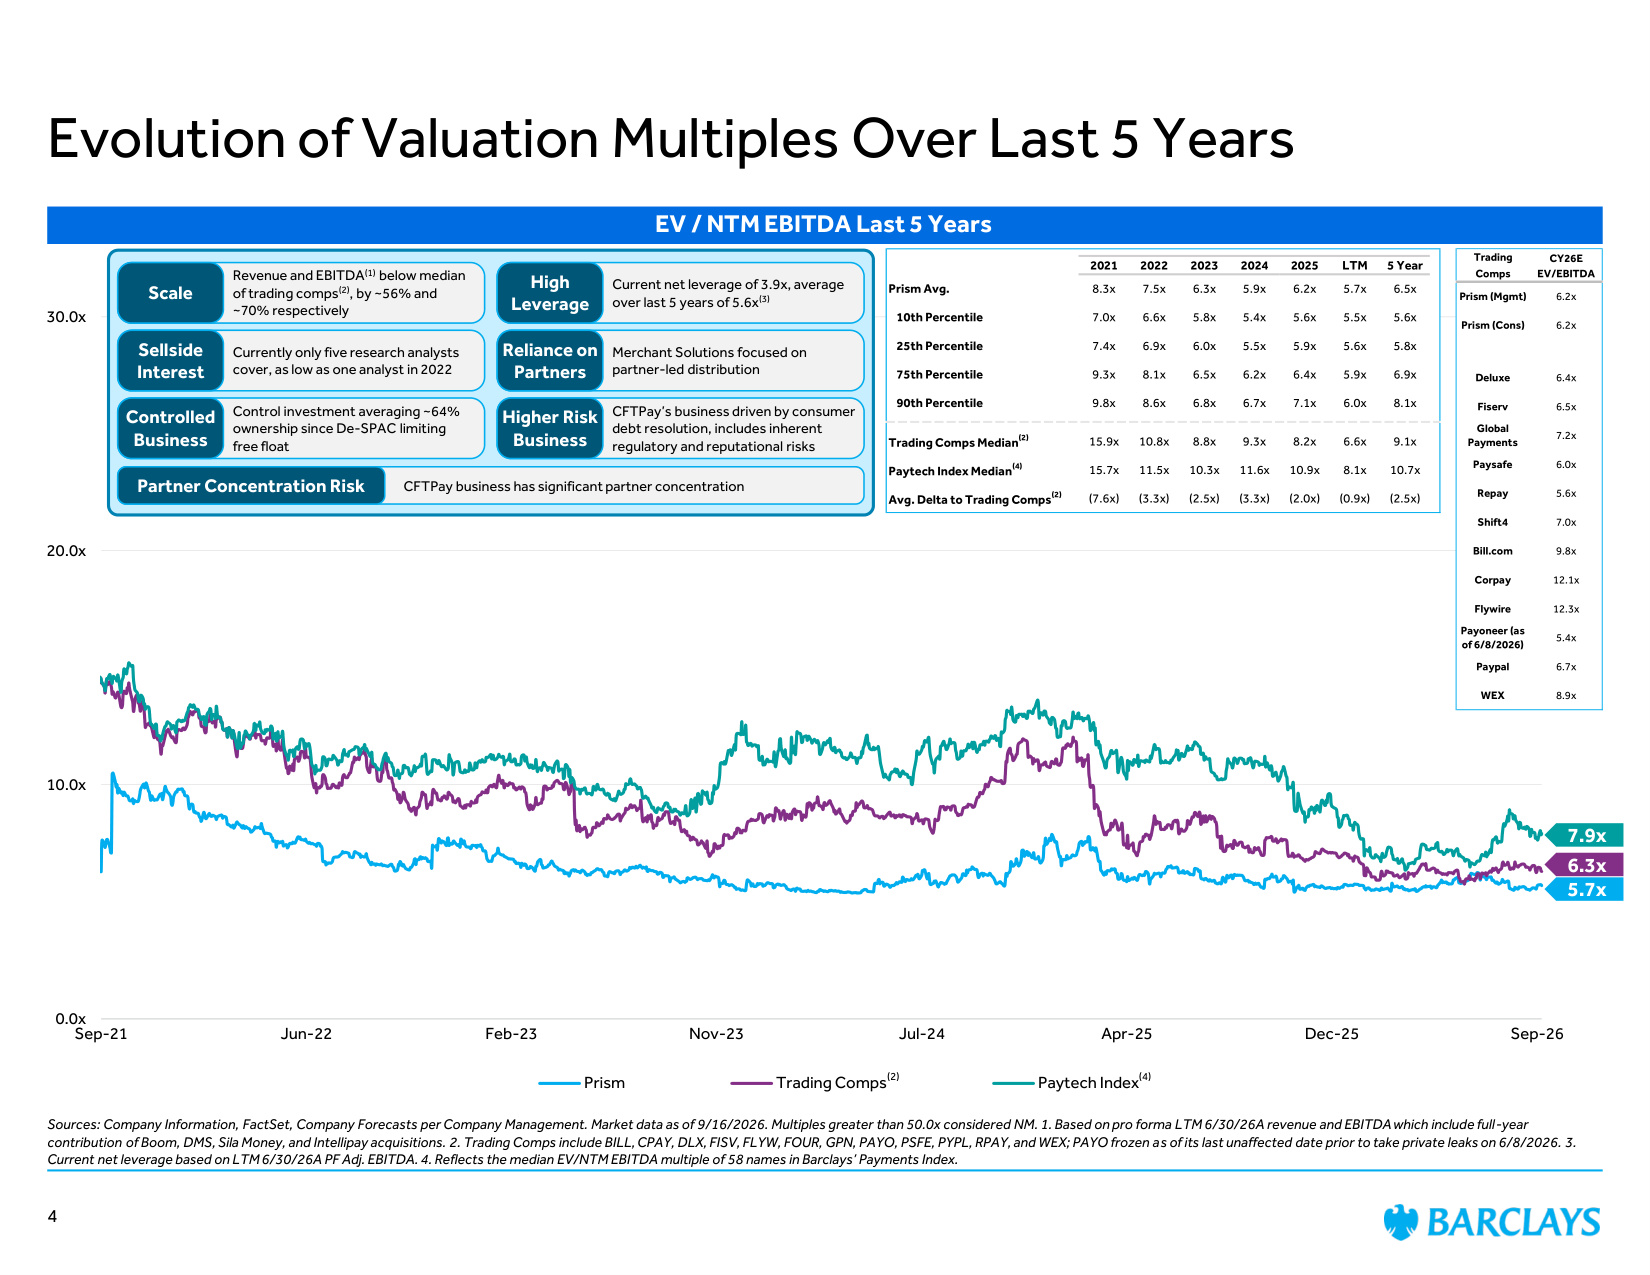
Sources: Company Information, FactSet, Company Forecasts per Company Management. Market data as of 9/16/2026. Multiples greater than 50.0x considered NM. 1. Based on pro forma LTM 6/30/26A revenue and EBITDA which include full-year contribution of Boom, DMS, Sila Money, and Intellipay acquisitions. 2. Trading Comps include BILL, CPAY, DLX, FISV, FLYW, FOUR, GPN, PAYO, PSFE, PYPL, RPAY, and WEX; PAYO frozen as of its last unaffected date prior to take private leaks on 6/8/2026. 3. Current net leverage based on LTM 6/30/26A PF Adj. EBITDA. 4. Reflects the median EV/NTM EBITDA multiple of 58 names in Barclays' Payments Index. Evolution of Valuation Multiples Over Last 5 Years 5.7x (2) 6.3x 7.9x (4) 0.0x 10.0x 20.0x 30.0x Sep-21 Jun-22 Feb-23 Nov-23 Jul-24 Apr-25 Dec-25 Sep-26 Prism Trading Comps Paytech Index EV / NTM EBITDA Last 5 Years 2021 2022 2023 2024 2025 LTM 5 Year Prism Avg. 8.3x 7.5x 6.3x 5.9x 6.2x 5.7x 6.5x 10th Percentile 7.0x 6.6x 5.8x 5.4x 5.6x 5.5x 5.6x 25th Percentile 7.4x 6.9x 6.0x 5.5x 5.9x 5.6x 5.8x 75th Percentile 9.3x 8.1x 6.5x 6.2x 6.4x 5.9x 6.9x 90th Percentile 9.8x 8.6x 6.8x 6.7x 7.1x 6.0x 8.1x Trading Comps Median(2) 15.9x 10.8x 8.8x 9.3x 8.2x 6.6x 9.1x Paytech Index Median(4) 15.7x 11.5x 10.3x 11.6x 10.9x 8.1x 10.7x Avg. Delta to Trading Comps(2) (7.6x) (3.3x) (2.5x) (3.3x) (2.0x) (0.9x) (2.5x) Control investment averaging ~64% ownership since De-SPAC limiting free float Controlled Business Current net leverage of 3.9x, average over last 5 years of 5.6x(3) High Leverage Currently only five research analysts cover, as low as one analyst in 2022 Sellside Interest Merchant Solutions focused on partner-led distribution Reliance on Partners Revenue and EBITDA(1) below median of trading comps(2), by ~56% and ~70% respectively Scale CFTPay's business driven by consumer debt resolution, includes inherent regulatory and reputational risks Higher Risk Business CFTPay business has significant partner concentration Partner Concentration Risk Trading CY26E Comps EV/EBITDA Prism (Mgmt) 6.2x Prism (Cons) 6.2x Deluxe 6.4x Fiserv 6.5x Global Payments 7.2x Paysafe 6.0x Repay 5.6x Shift4 7.0x Bill.com 9.8x Corpay 12.1x Flywire 12.3x Payoneer (as of 6/8/2026) 5.4x Paypal 6.7x WEX 8.9x 4

Review of Company Financials & Forecasts
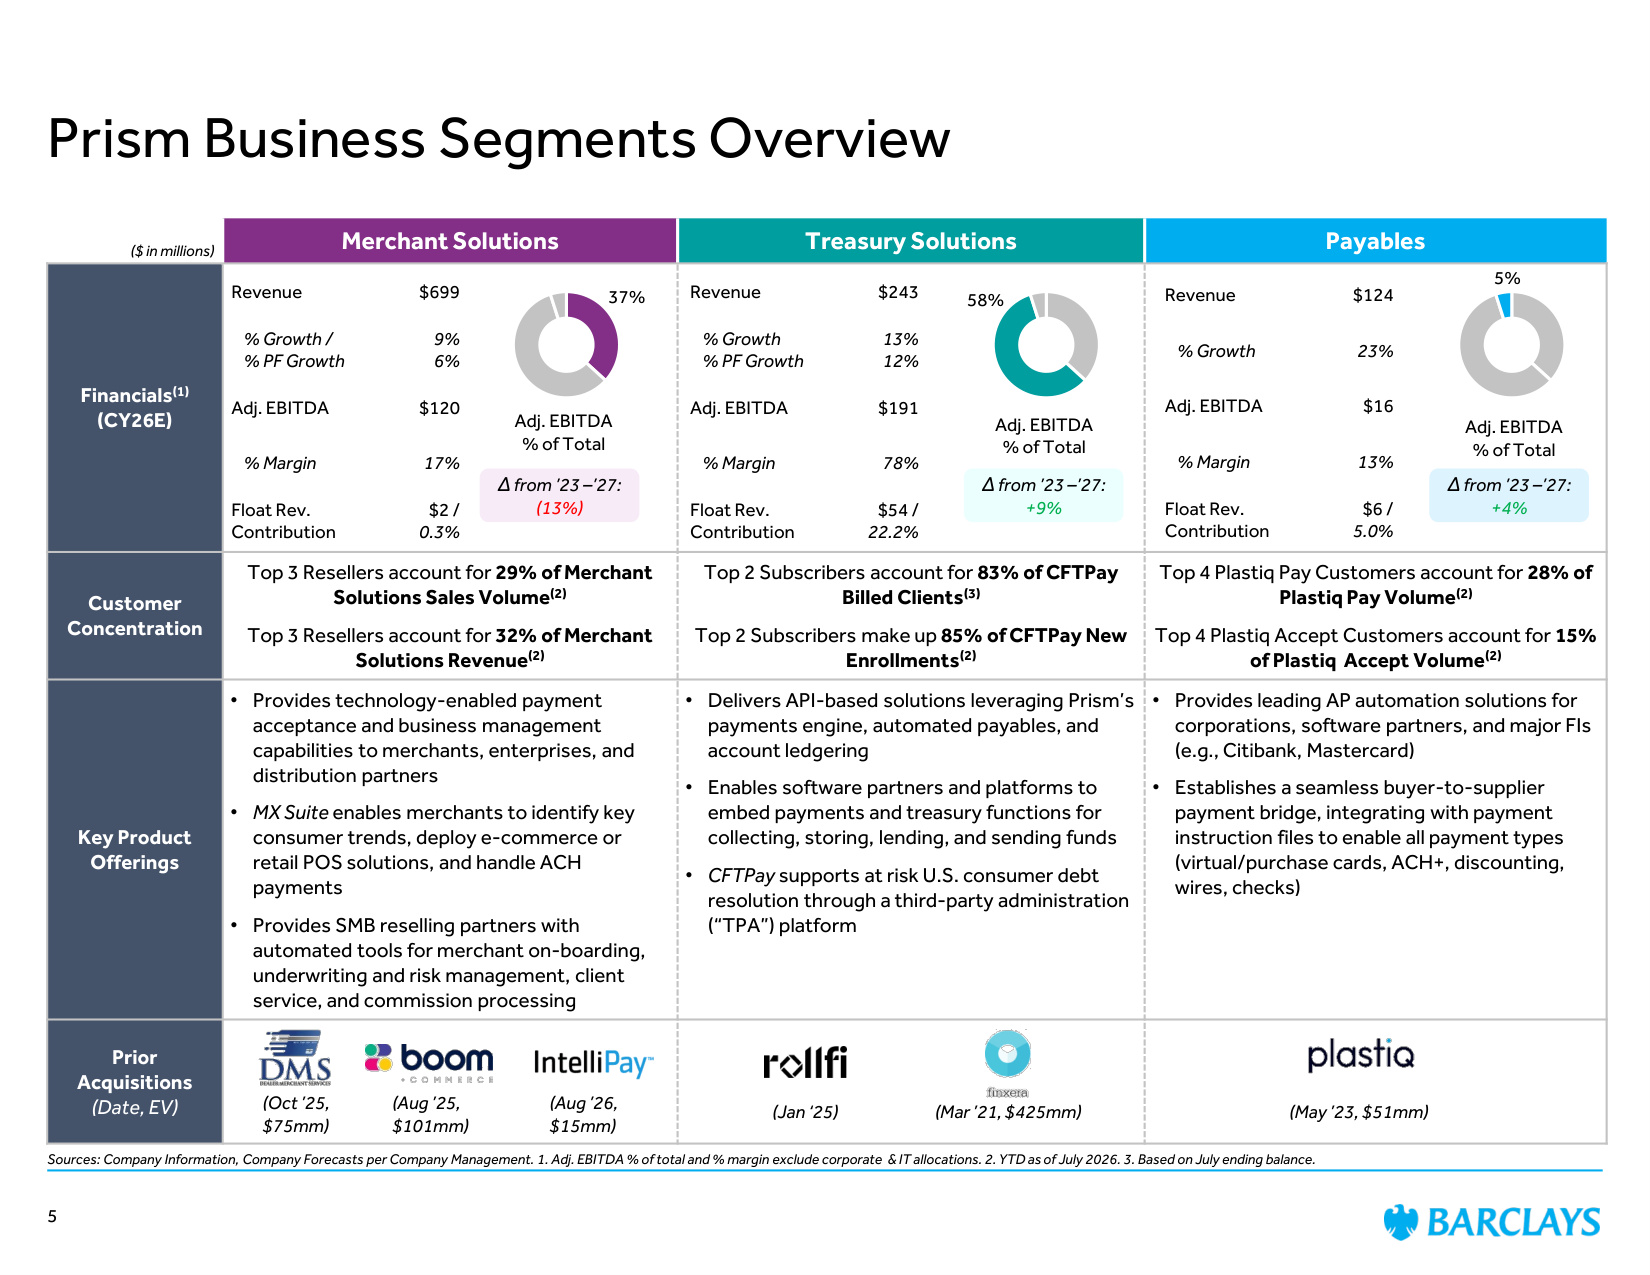
Prism Business Segments Overview Sources: Company Information, Company Forecasts per Company Management. 1. Adj. EBITDA % of total and % margin exclude corporate & IT allocations. 2. YTD as of July 2026. 3. Based on July ending balance. Merchant Solutions Treasury Solutions Payables Financials(1) (CY26E) Customer Concentration Top 3 Resellers account for 29% of Merchant Solutions Sales Volume(2) Top 3 Resellers account for 32% of Merchant Solutions Revenue(2) Top 2 Subscribers account for 83% of CFTPay Billed Clients(3) Top 2 Subscribers make up 85% of CFTPay New Enrollments(2) Top 4 Plastiq Pay Customers account for 28% of Plastiq Pay Volume(2) Top 4 Plastiq Accept Customers account for 15% of Plastiq Accept Volume(2) Key Product Offerings • Provides technology-enabled payment acceptance and business management capabilities to merchants, enterprises, and distribution partners • MX Suite enables merchants to identify key consumer trends, deploy e-commerce or retail POS solutions, and handle ACH payments • Provides SMB reselling partners with automated tools for merchant on-boarding, underwriting and risk management, client service, and commission processing • Delivers API-based solutions leveraging Prism's payments engine, automated payables, and account ledgering • Enables software partners and platforms to embed payments and treasury functions for collecting, storing, lending, and sending funds • CFTPay supports at risk U.S. consumer debt resolution through a third-party administration ("TPA") platform • Provides leading AP automation solutions for corporations, software partners, and major FIs (e.g., Citibank, Mastercard) • Establishes a seamless buyer-to-supplier payment bridge, integrating with payment instruction files to enable all payment types (virtual/purchase cards, ACH+, discounting, wires, checks) Prior Acquisitions (Date, EV) ($ in millions) 5 (Oct '25, $75mm) (Aug '25, $101mm) (Jan '25) (Mar '21, $425mm) (May '23, $51mm) 37% 58% 5% Adj. EBITDA % of Total Adj. EBITDA % of Total Adj. EBITDA % of Total Revenue $699 % Growth / % PF Growth 9% 6% Adj. EBITDA $120 % Margin 17% Float Rev. Contribution $2 / 0.3% Revenue $243 % Growth % PF Growth 13% 12% Adj. EBITDA $191 % Margin 78% Float Rev. Contribution $54 / 22.2% Revenue $124 % Growth 23% Adj. EBITDA $16 % Margin 13% Float Rev. Contribution $6 / 5.0% Δ from '23 –'27: (13%) Δ from '23 –'27: +9% Δ from '23 –'27: +4% (Aug '26, $15mm)
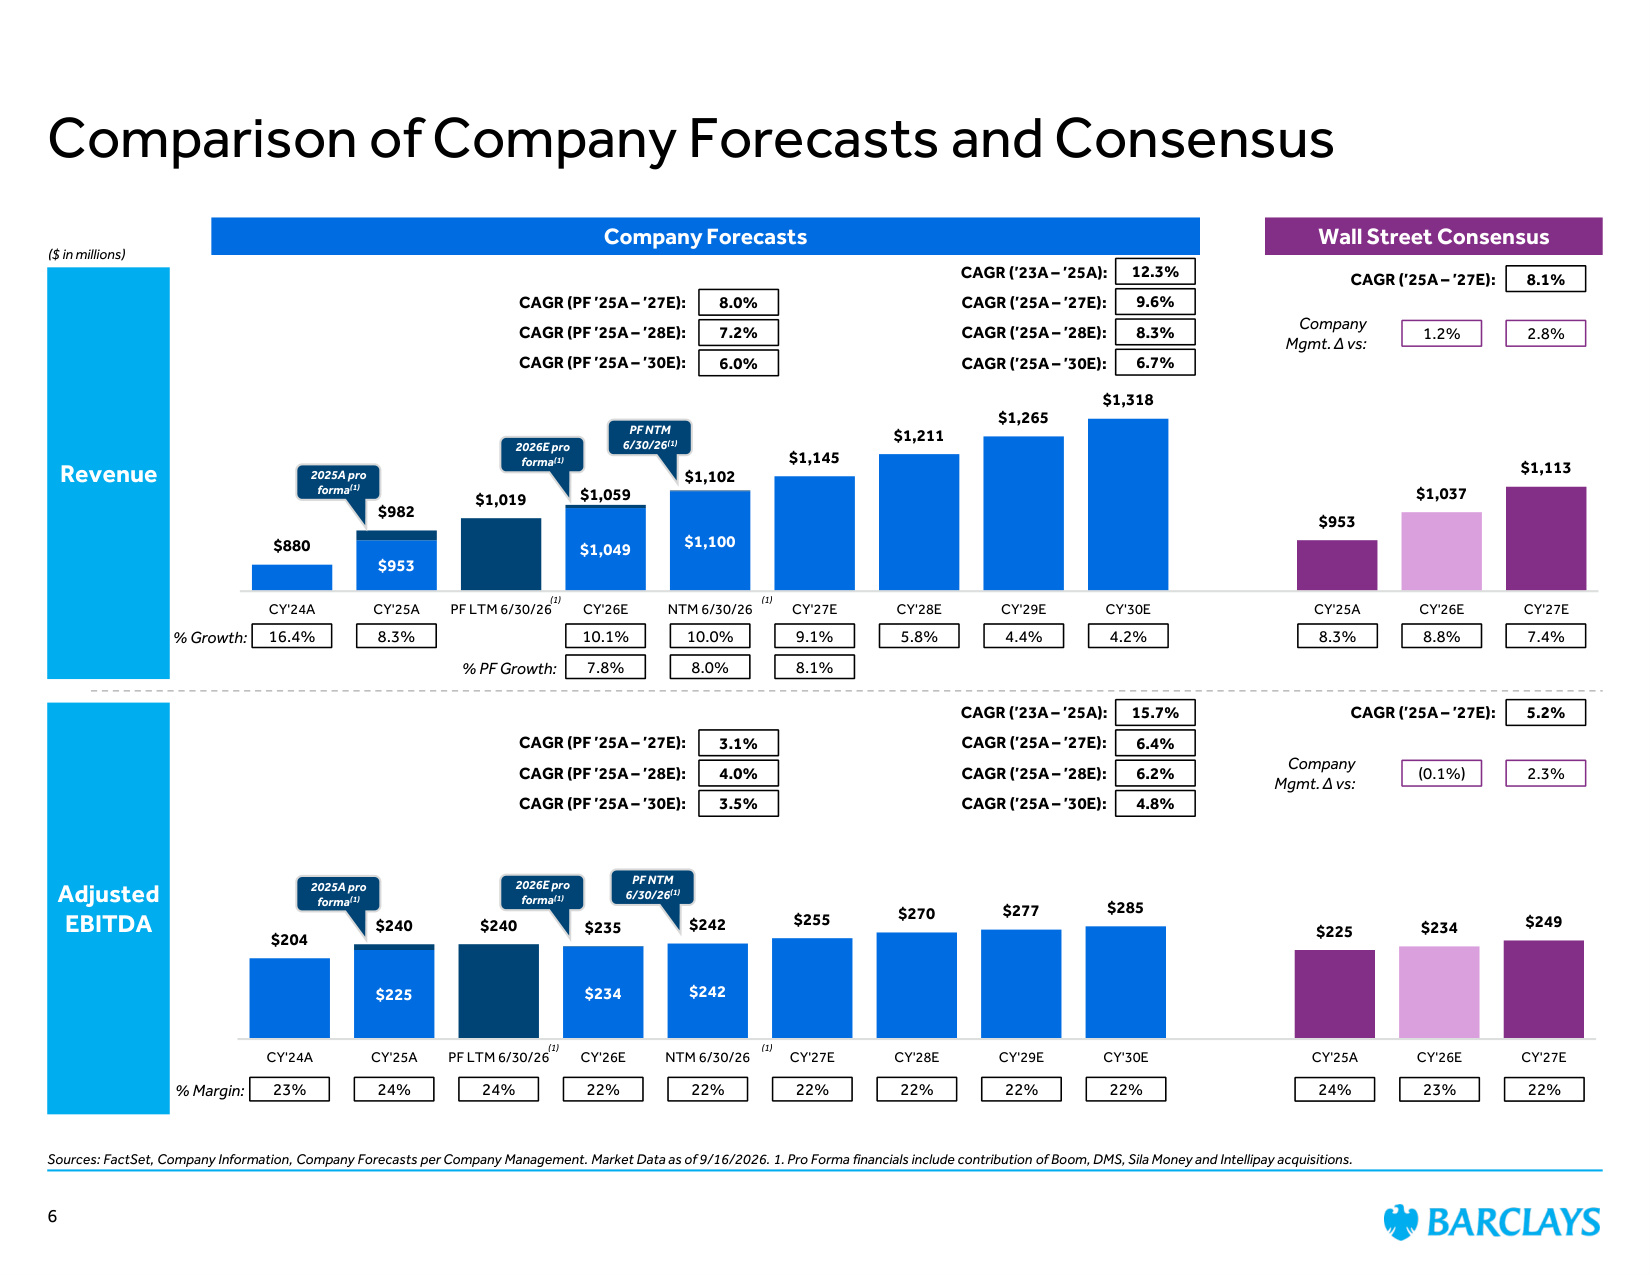
$225 $234 $242 $204 $240 $242 $255 $270 $277 $285 $225 $234 $249 $240 $235 CY'24A CY'25A PF LTM 6/30/26 CY'26E NTM 6/30/26 CY'27E CY'28E CY'29E CY'30E CY'25A CY'26E CY'27E $953 $1,049 $1,100 $880 $1,019 $1,145 $1,211 $1,265 $1,318 $953 $1,037 $1,113 $982 $1,059 $1,102 CY'24A CY'25A PF LTM 6/30/26 CY'26E NTM 6/30/26 CY'27E CY'28E CY'29E CY'30E CY'25A CY'26E CY'27E Revenue ($ in millions) Adjusted EBITDA % Growth: % Margin: 4.2% 24% 22% 23% 9.1% 5.8% 22% 22% 22% Company Forecasts Wall Street Consensus 8.1% CAGR ('25A – '27E): 22% 8.8% 7.4% 8.3% 10.1% 5.2% CAGR ('25A – '27E): 8.3% 23% 4.4% 22% Comparison of Company Forecasts and Consensus Sources: FactSet, Company Information, Company Forecasts per Company Management. Market Data as of 9/16/2026. 1. Pro Forma financials include contribution of Boom, DMS, Sila Money and Intellipay acquisitions. 16.4% 24% 12.3% 9.6% 8.3% 6.7% 15.7% 6.4% CAGR ('23A – '25A): CAGR ('25A – '27E): CAGR ('25A – '28E): CAGR ('25A – '30E): 6.2% 4.8% 1.2% 2.8% (0.1%) 2.3% Company Mgmt. Δ vs: 2025A pro forma(1) % PF Growth: 7.8% 8.0% CAGR (PF '25A – '27E): CAGR (PF '25A – '28E): CAGR (PF '25A – '30E): 7.2% 6.0% 3.1% CAGR (PF '25A – '27E): CAGR (PF '25A – '28E): CAGR (PF '25A – '30E): 4.0% 3.5% 2025A pro forma(1) CAGR ('23A – '25A): CAGR ('25A – '27E): CAGR ('25A – '28E): CAGR ('25A – '30E): 6 10.0% 8.0% Company Mgmt. Δ vs: 24% 22% (1) (1) 2026E pro forma(1) 8.1% 2026E pro forma(1) PF NTM 6/30/26(1) PF NTM 6/30/26(1) (1) (1)
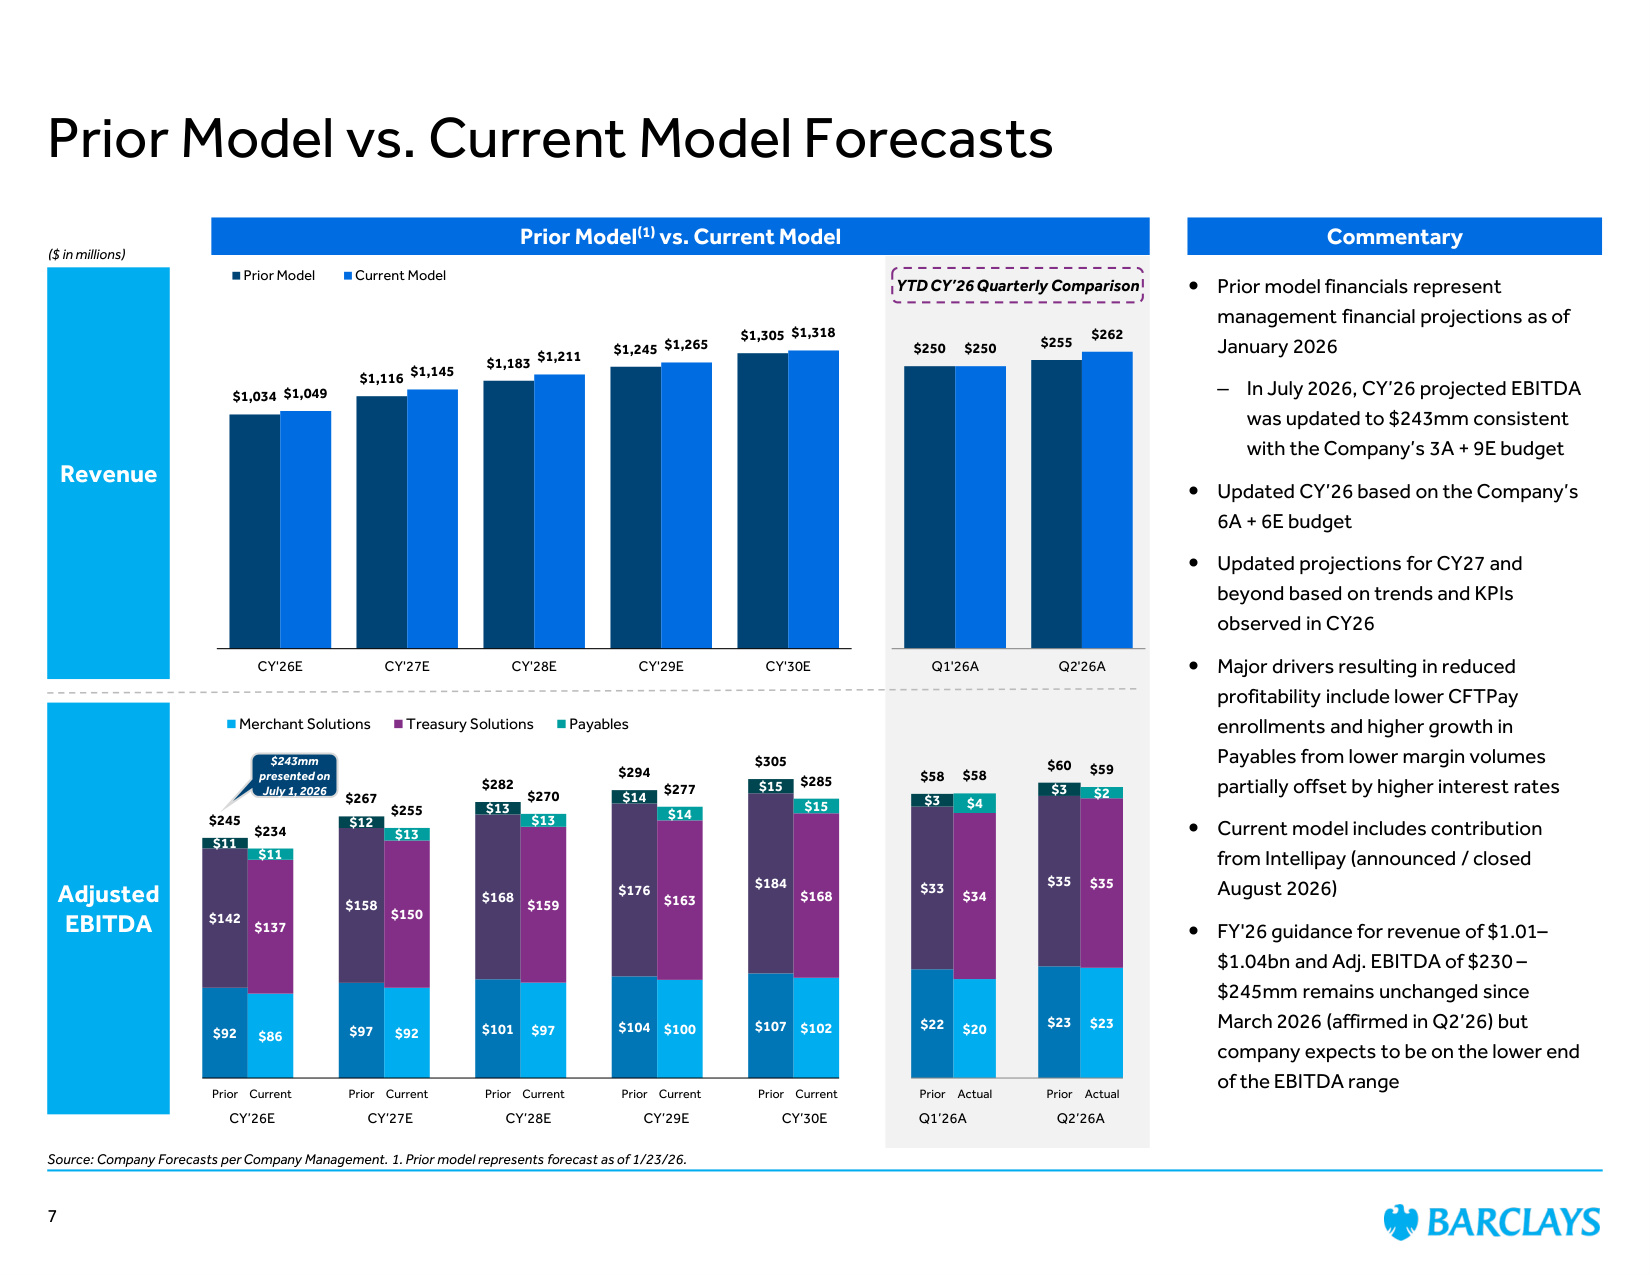
Prior Model(1) vs. Current Model Revenue Adjusted EBITDA Prior Model vs. Current Model Forecasts Commentary Prior model financials represent management financial projections as of January 2026 – In July 2026, CY'26 projected EBITDA was updated to $243mm consistent with the Company's 3A + 9E budget Updated CY'26 based on the Company's 6A + 6E budget Updated projections for CY27 and beyond based on trends and KPIs observed in CY26 Major drivers resulting in reduced profitability include lower CFTPay enrollments and higher growth in Payables from lower margin volumes partially offset by higher interest rates Current model includes contribution from Intellipay (announced / closed August 2026) FY'26 guidance for revenue of $1.01– $1.04bn and Adj. EBITDA of $230 – $245mm remains unchanged since March 2026 (affirmed in Q2'26) but company expects to be on the lower end of the EBITDA range $1,034 $1,116 $1,183 $1,245 $1,305 $1,049 $1,145 $1,211 $1,265 $1,318 CY'26E CY'27E CY'28E CY'29E CY'30E Prior Model Current Model $92 $86 $97 $92 $101 $97 $104 $100 $107 $102 $142 $137 $158 $150 $168 $159 $176 $163 $184 $168 $11 $11 $12 $13 $13 $13 $14 $14 $15 $15 $245 $234 $267 $255 $282 $270 $294 $277 $305 $285 Prior Current Prior Current Prior Current Prior Current Prior Current Merchant Solutions Treasury Solutions Payables YTD CY'26 Quarterly Comparison CY'26E CY'27E CY'28E CY'29E CY'30E Q1'26A Q2'26A $243mm presented on July 1, 2026 ($ in millions) $250 $255 $250 $262 Q1'26A Q2'26A $22 $20 $23 $23 $33 $34 $35 $35 $3 $4 $3 $2 $58 $58 $60 $59 Prior Actual Prior Actual 7 Source: Company Forecasts per Company Management. 1. Prior model represents forecast as of 1/23/26.

Valuation Perspectives
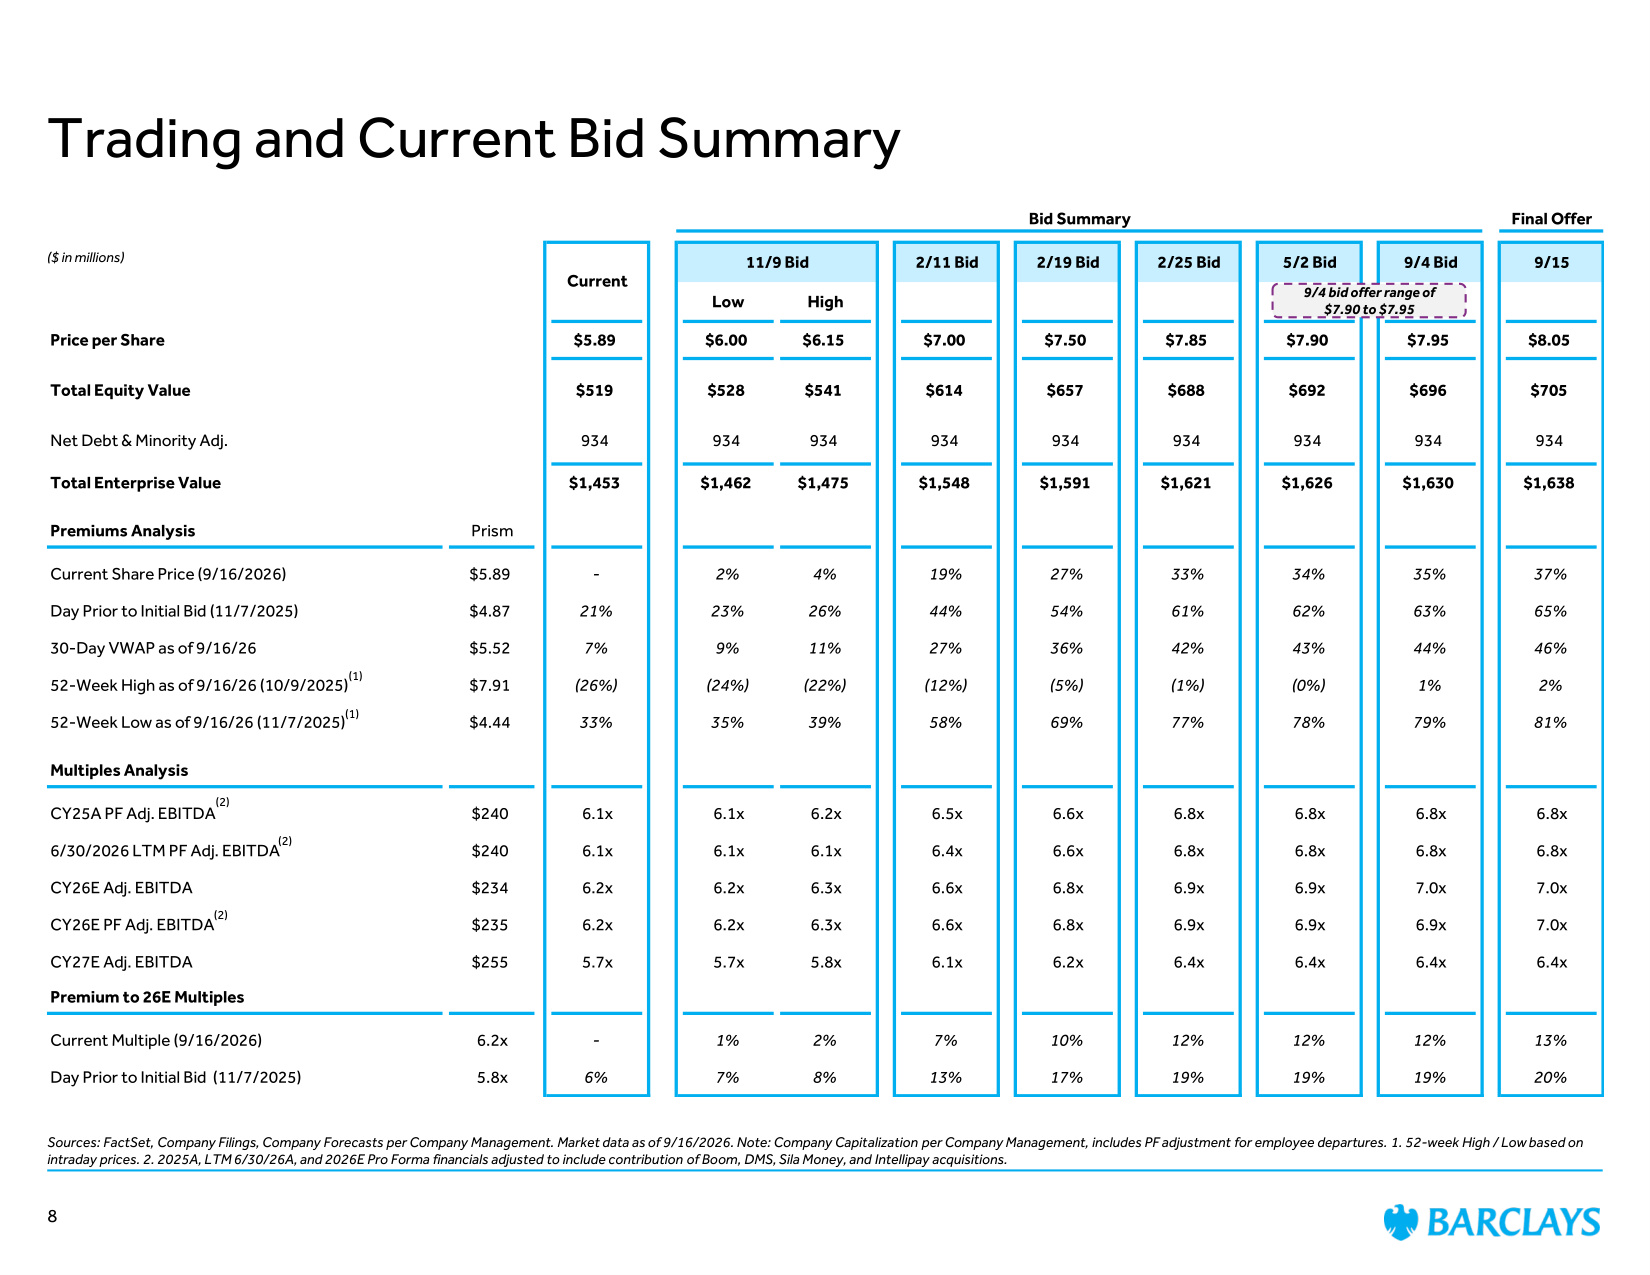
Bid Summary Final Offer 11/9 Bid 2/11 Bid 2/19 Bid 2/25 Bid 5/2 Bid 9/4 Bid 9/15 Low High Price per Share $5.89 $6.00 $6.15 $7.00 $7.50 $7.85 $7.90 $7.95 $8.05 Total Equity Value $519 $528 $541 $614 $657 $688 $692 $696 $705 Net Debt & Minority Adj. 934 934 934 934 934 934 934 934 934 Total Enterprise Value $1,453 $1,462 $1,475 $1,548 $1,591 $1,621 $1,626 $1,630 $1,638 Premiums Analysis Prism Current Share Price (9/16/2026) $5.89 - 2% 4% 19% 27% 33% 34% 35% 37% Day Prior to Initial Bid (11/7/2025) $4.87 21% 23% 26% 44% 54% 61% 62% 63% 65% 30-Day VWAP as of 9/16/26 $5.52 7% 9% 11% 27% 36% 42% 43% 44% 46% 52-Week High as of 9/16/26 (10/9/2025) $7.91 (26%) (24%) (22%) (12%) (5%) (1%) (0%) 1% 2% 52-Week Low as of 9/16/26 (11/7/2025) $4.44 33% 35% 39% 58% 69% 77% 78% 79% 81% Multiples Analysis CY25A PF Adj. EBITDA $240 6.1x 6.1x 6.2x 6.5x 6.6x 6.8x 6.8x 6.8x 6.8x 6/30/2026 LTM PF Adj. EBITDA $240 6.1x 6.1x 6.1x 6.4x 6.6x 6.8x 6.8x 6.8x 6.8x CY26E Adj. EBITDA $234 6.2x 6.2x 6.3x 6.6x 6.8x 6.9x 6.9x 7.0x 7.0x CY26E PF Adj. EBITDA $235 6.2x 6.2x 6.3x 6.6x 6.8x 6.9x 6.9x 6.9x 7.0x CY27E Adj. EBITDA $255 5.7x 5.7x 5.8x 6.1x 6.2x 6.4x 6.4x 6.4x 6.4x Premium to 26E Multiples Current Multiple (9/16/2026) 6.2x - 1% 2% 7% 10% 12% 12% 12% 13% Day Prior to Initial Bid (11/7/2025) 5.8x 6% 7% 8% 13% 17% 19% 19% 19% 20% Current Trading and Current Bid Summary Sources: FactSet, Company Filings, Company Forecasts per Company Management. Market data as of 9/16/2026. Note: Company Capitalization per Company Management, includes PF adjustment for employee departures. 1. 52-week High / Low based on intraday prices. 2. 2025A, LTM 6/30/26A, and 2026E Pro Forma financials adjusted to include contribution of Boom, DMS, Sila Money, and Intellipay acquisitions. ($ in millions) 8 9/4 bid offer range of $7.90 to $7.95 (2) (1) (2) (2) (1)
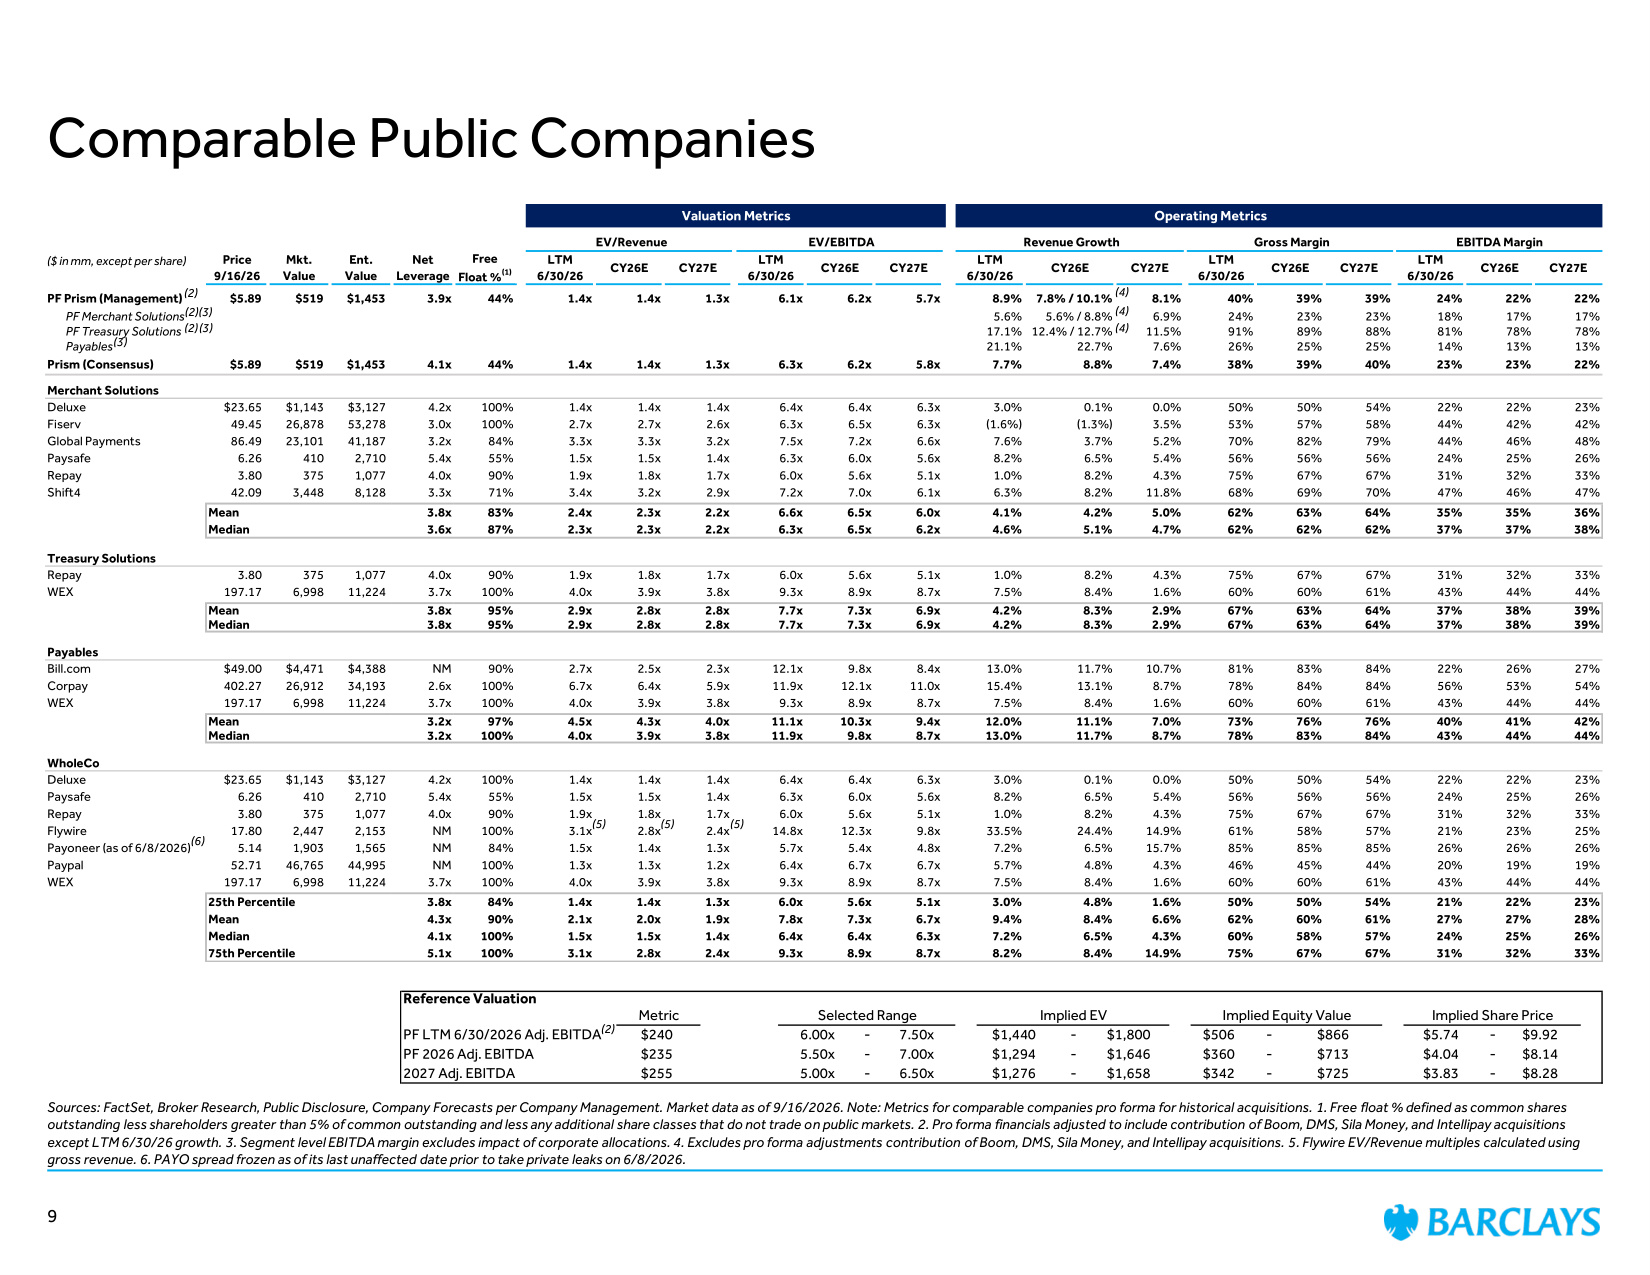
Comparable Public Companies Sources: FactSet, Broker Research, Public Disclosure, Company Forecasts per Company Management. Market data as of 9/16/2026. Note: Metrics for comparable companies pro forma for historical acquisitions. 1. Free float % defined as common shares outstanding less shareholders greater than 5% of common outstanding and less any additional share classes that do not trade on public markets. 2. Pro forma financials adjusted to include contribution of Boom, DMS, Sila Money, and Intellipay acquisitions except LTM 6/30/26 growth. 3. Segment level EBITDA margin excludes impact of corporate allocations. 4. Excludes pro forma adjustments contribution of Boom, DMS, Sila Money, and Intellipay acquisitions. 5. Flywire EV/Revenue multiples calculated using gross revenue. 6. PAYO spread frozen as of its last unaffected date prior to take private leaks on 6/8/2026. (5) (2) (2) (2) (3) (3) (3) (4) (4) (4) (5) (2) Valuation Metrics Operating Metrics EV/Revenue EV/EBITDA Revenue Growth Gross Margin EBITDA Margin Price 9/16/26 Mkt. Value Ent. Value Net Leverage Free Float %(1) LTM 6/30/26 CY26E CY27E LTM 6/30/26 CY26E CY27E LTM 6/30/26 CY26E CY27E LTM 6/30/26 CY26E CY27E LTM 6/30/26 CY26E CY27E PF Prism (Management) $5.89 $519 $1,453 3.9x 44% 1.4x 1.4x 1.3x 6.1x 6.2x 5.7x 8.9% 7.8% / 10.1% 8.1% 40% 39% 39% 24% 22% 22% PF Merchant Solutions 5.6% 5.6% / 8.8% 6.9% 24% 23% 23% 18% 17% 17% PF Treasury Solutions 17.1% 12.4% / 12.7% 11.5% 91% 89% 88% 81% 78% 78% Payables 21.1% 22.7% 7.6% 26% 25% 25% 14% 13% 13% Prism (Consensus) $5.89 $519 $1,453 4.1x 44% 1.4x 1.4x 1.3x 6.3x 6.2x 5.8x 7.7% 8.8% 7.4% 38% 39% 40% 23% 23% 22% Merchant Solutions Deluxe $23.65 $1,143 $3,127 4.2x 100% 1.4x 1.4x 1.4x 6.4x 6.4x 6.3x 3.0% 0.1% 0.0% 50% 50% 54% 22% 22% 23% Fiserv 49.45 26,878 53,278 3.0x 100% 2.7x 2.7x 2.6x 6.3x 6.5x 6.3x (1.6%) (1.3%) 3.5% 53% 57% 58% 44% 42% 42% Global Payments 86.49 23,101 41,187 3.2x 84% 3.3x 3.3x 3.2x 7.5x 7.2x 6.6x 7.6% 3.7% 5.2% 70% 82% 79% 44% 46% 48% Paysafe 6.26 410 2,710 5.4x 55% 1.5x 1.5x 1.4x 6.3x 6.0x 5.6x 8.2% 6.5% 5.4% 56% 56% 56% 24% 25% 26% Repay 3.80 375 1,077 4.0x 90% 1.9x 1.8x 1.7x 6.0x 5.6x 5.1x 1.0% 8.2% 4.3% 75% 67% 67% 31% 32% 33% Shift4 42.09 3,448 8,128 3.3x 71% 3.4x 3.2x 2.9x 7.2x 7.0x 6.1x 6.3% 8.2% 11.8% 68% 69% 70% 47% 46% 47% Mean 3.8x 83% 2.4x 2.3x 2.2x 6.6x 6.5x 6.0x 4.1% 4.2% 5.0% 62% 63% 64% 35% 35% 36% Median 3.6x 87% 2.3x 2.3x 2.2x 6.3x 6.5x 6.2x 4.6% 5.1% 4.7% 62% 62% 62% 37% 37% 38% Treasury Solutions Repay 3.80 375 1,077 4.0x 90% 1.9x 1.8x 1.7x 6.0x 5.6x 5.1x 1.0% 8.2% 4.3% 75% 67% 67% 31% 32% 33% WEX 197.17 6,998 11,224 3.7x 100% 4.0x 3.9x 3.8x 9.3x 8.9x 8.7x 7.5% 8.4% 1.6% 60% 60% 61% 43% 44% 44% Mean 3.8x 95% 2.9x 2.8x 2.8x 7.7x 7.3x 6.9x 4.2% 8.3% 2.9% 67% 63% 64% 37% 38% 39% Median 3.8x 95% 2.9x 2.8x 2.8x 7.7x 7.3x 6.9x 4.2% 8.3% 2.9% 67% 63% 64% 37% 38% 39% Payables Bill.com $49.00 $4,471 $4,388 NM 90% 2.7x 2.5x 2.3x 12.1x 9.8x 8.4x 13.0% 11.7% 10.7% 81% 83% 84% 22% 26% 27% Corpay 402.27 26,912 34,193 2.6x 100% 6.7x 6.4x 5.9x 11.9x 12.1x 11.0x 15.4% 13.1% 8.7% 78% 84% 84% 56% 53% 54% WEX 197.17 6,998 11,224 3.7x 100% 4.0x 3.9x 3.8x 9.3x 8.9x 8.7x 7.5% 8.4% 1.6% 60% 60% 61% 43% 44% 44% Mean 3.2x 97% 4.5x 4.3x 4.0x 11.1x 10.3x 9.4x 12.0% 11.1% 7.0% 73% 76% 76% 40% 41% 42% Median 3.2x 100% 4.0x 3.9x 3.8x 11.9x 9.8x 8.7x 13.0% 11.7% 8.7% 78% 83% 84% 43% 44% 44% WholeCo Deluxe $23.65 $1,143 $3,127 4.2x 100% 1.4x 1.4x 1.4x 6.4x 6.4x 6.3x 3.0% 0.1% 0.0% 50% 50% 54% 22% 22% 23% Paysafe 6.26 410 2,710 5.4x 55% 1.5x 1.5x 1.4x 6.3x 6.0x 5.6x 8.2% 6.5% 5.4% 56% 56% 56% 24% 25% 26% Repay 3.80 375 1,077 4.0x 90% 1.9x 1.8x 1.7x 6.0x 5.6x 5.1x 1.0% 8.2% 4.3% 75% 67% 67% 31% 32% 33% Flywire 17.80 2,447 2,153 NM 100% 3.1x 2.8x 2.4x 14.8x 12.3x 9.8x 33.5% 24.4% 14.9% 61% 58% 57% 21% 23% 25% Payoneer (as of 6/8/2026) 5.14 1,903 1,565 NM 84% 1.5x 1.4x 1.3x 5.7x 5.4x 4.8x 7.2% 6.5% 15.7% 85% 85% 85% 26% 26% 26% Paypal 52.71 46,765 44,995 NM 100% 1.3x 1.3x 1.2x 6.4x 6.7x 6.7x 5.7% 4.8% 4.3% 46% 45% 44% 20% 19% 19% WEX 197.17 6,998 11,224 3.7x 100% 4.0x 3.9x 3.8x 9.3x 8.9x 8.7x 7.5% 8.4% 1.6% 60% 60% 61% 43% 44% 44% 25th Percentile 3.8x 84% 1.4x 1.4x 1.3x 6.0x 5.6x 5.1x 3.0% 4.8% 1.6% 50% 50% 54% 21% 22% 23% Mean 4.3x 90% 2.1x 2.0x 1.9x 7.8x 7.3x 6.7x 9.4% 8.4% 6.6% 62% 60% 61% 27% 27% 28% Median 4.1x 100% 1.5x 1.5x 1.4x 6.4x 6.4x 6.3x 7.2% 6.5% 4.3% 60% 58% 57% 24% 25% 26% 75th Percentile 5.1x 100% 3.1x 2.8x 2.4x 9.3x 8.9x 8.7x 8.2% 8.4% 14.9% 75% 67% 67% 31% 32% 33% Reference Valuation Metric Selected Range Implied EV Implied Equity Value Implied Share Price PF LTM 6/30/2026 Adj. EBITDA $240 6.00x - 7.50x $1,440 - $1,800 $506 - $866 $5.74 - $9.92 PF 2026 Adj. EBITDA $235 5.50x - 7.00x $1,294 - $1,646 $360 - $713 $4.04 - $8.14 2027 Adj. EBITDA $255 5.00x - 6.50x $1,276 - $1,658 $342 - $725 $3.83 - $8.28 (6) (5) 9 ($ in mm, except per share)
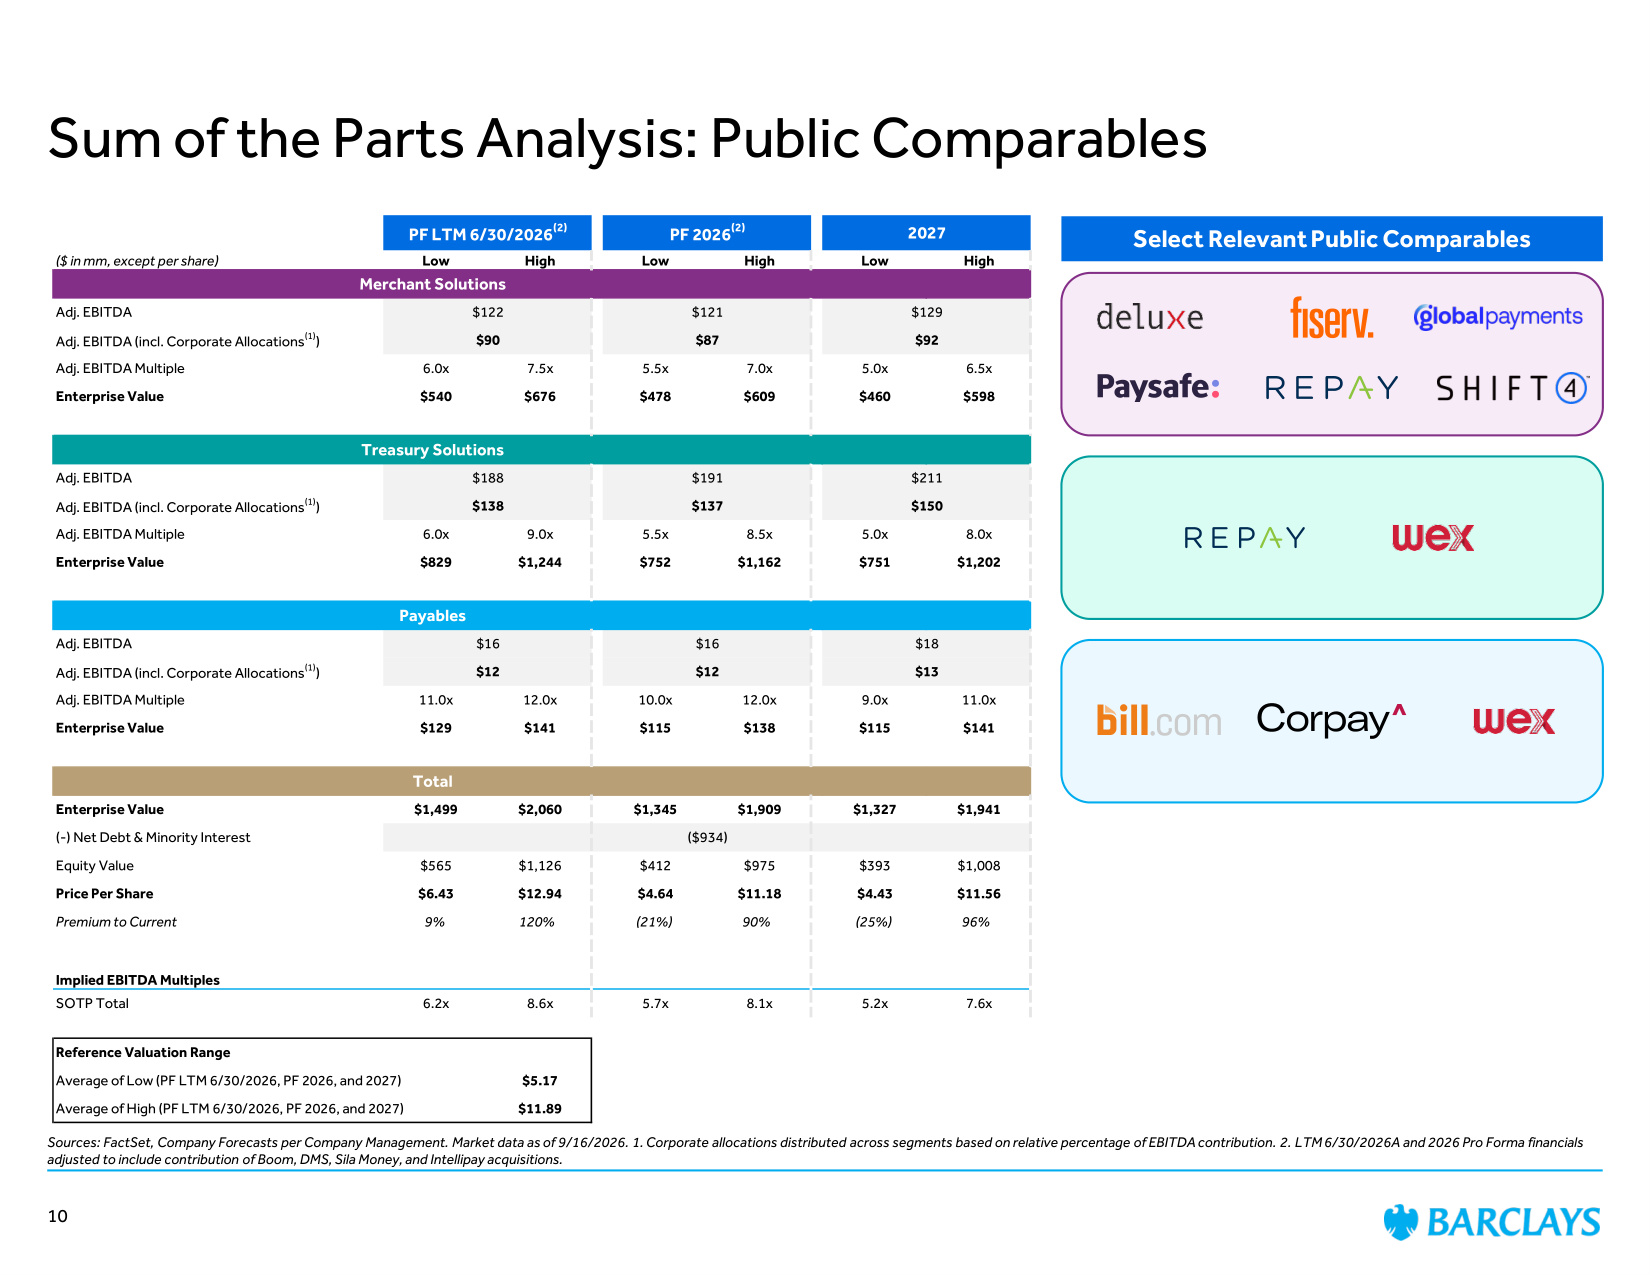
Sum of the Parts Analysis: Public Comparables Sources: FactSet, Company Forecasts per Company Management. Market data as of 9/16/2026. 1. Corporate allocations distributed across segments based on relative percentage of EBITDA contribution. 2. LTM 6/30/2026A and 2026 Pro Forma financials adjusted to include contribution of Boom, DMS, Sila Money, and Intellipay acquisitions. Select Relevant Public Comparables PF LTM 6/30/2026(2) PF 2026(2) 2027 ($ in mm, except per share) Low High Low High Low High Merchant Solutions Adj. EBITDA $122 $121 $129 Adj. EBITDA (incl. Corporate Allocations(1)) $90 $87 $92 Adj. EBITDA Multiple 6.0x 7.5x 5.5x 7.0x 5.0x 6.5x Enterprise Value $540 $676 $478 $609 $460 $598 Treasury Solutions Adj. EBITDA $188 $191 $211 Adj. EBITDA (incl. Corporate Allocations(1)) $138 $137 $150 Adj. EBITDA Multiple 6.0x 9.0x 5.5x 8.5x 5.0x 8.0x Enterprise Value $829 $1,244 $752 $1,162 $751 $1,202 Payables Adj. EBITDA $16 $16 $18 Adj. EBITDA (incl. Corporate Allocations(1)) $12 $12 $13 Adj. EBITDA Multiple 11.0x 12.0x 10.0x 12.0x 9.0x 11.0x Enterprise Value $129 $141 $115 $138 $115 $141 Total Enterprise Value $1,499 $2,060 $1,345 $1,909 $1,327 $1,941 (-) Net Debt & Minority Interest ($934) Equity Value $565 $1,126 $412 $975 $393 $1,008 Price Per Share $6.43 $12.94 $4.64 $11.18 $4.43 $11.56 Premium to Current 9% 120% (21%) 90% (25%) 96% Implied EBITDA Multiples SOTP Total 6.2x 8.6x 5.7x 8.1x 5.2x 7.6x Reference Valuation Range Average of Low (PF LTM 6/30/2026, PF 2026, and 2027) $5.17 Average of High (PF LTM 6/30/2026, PF 2026, and 2027) $11.89 10
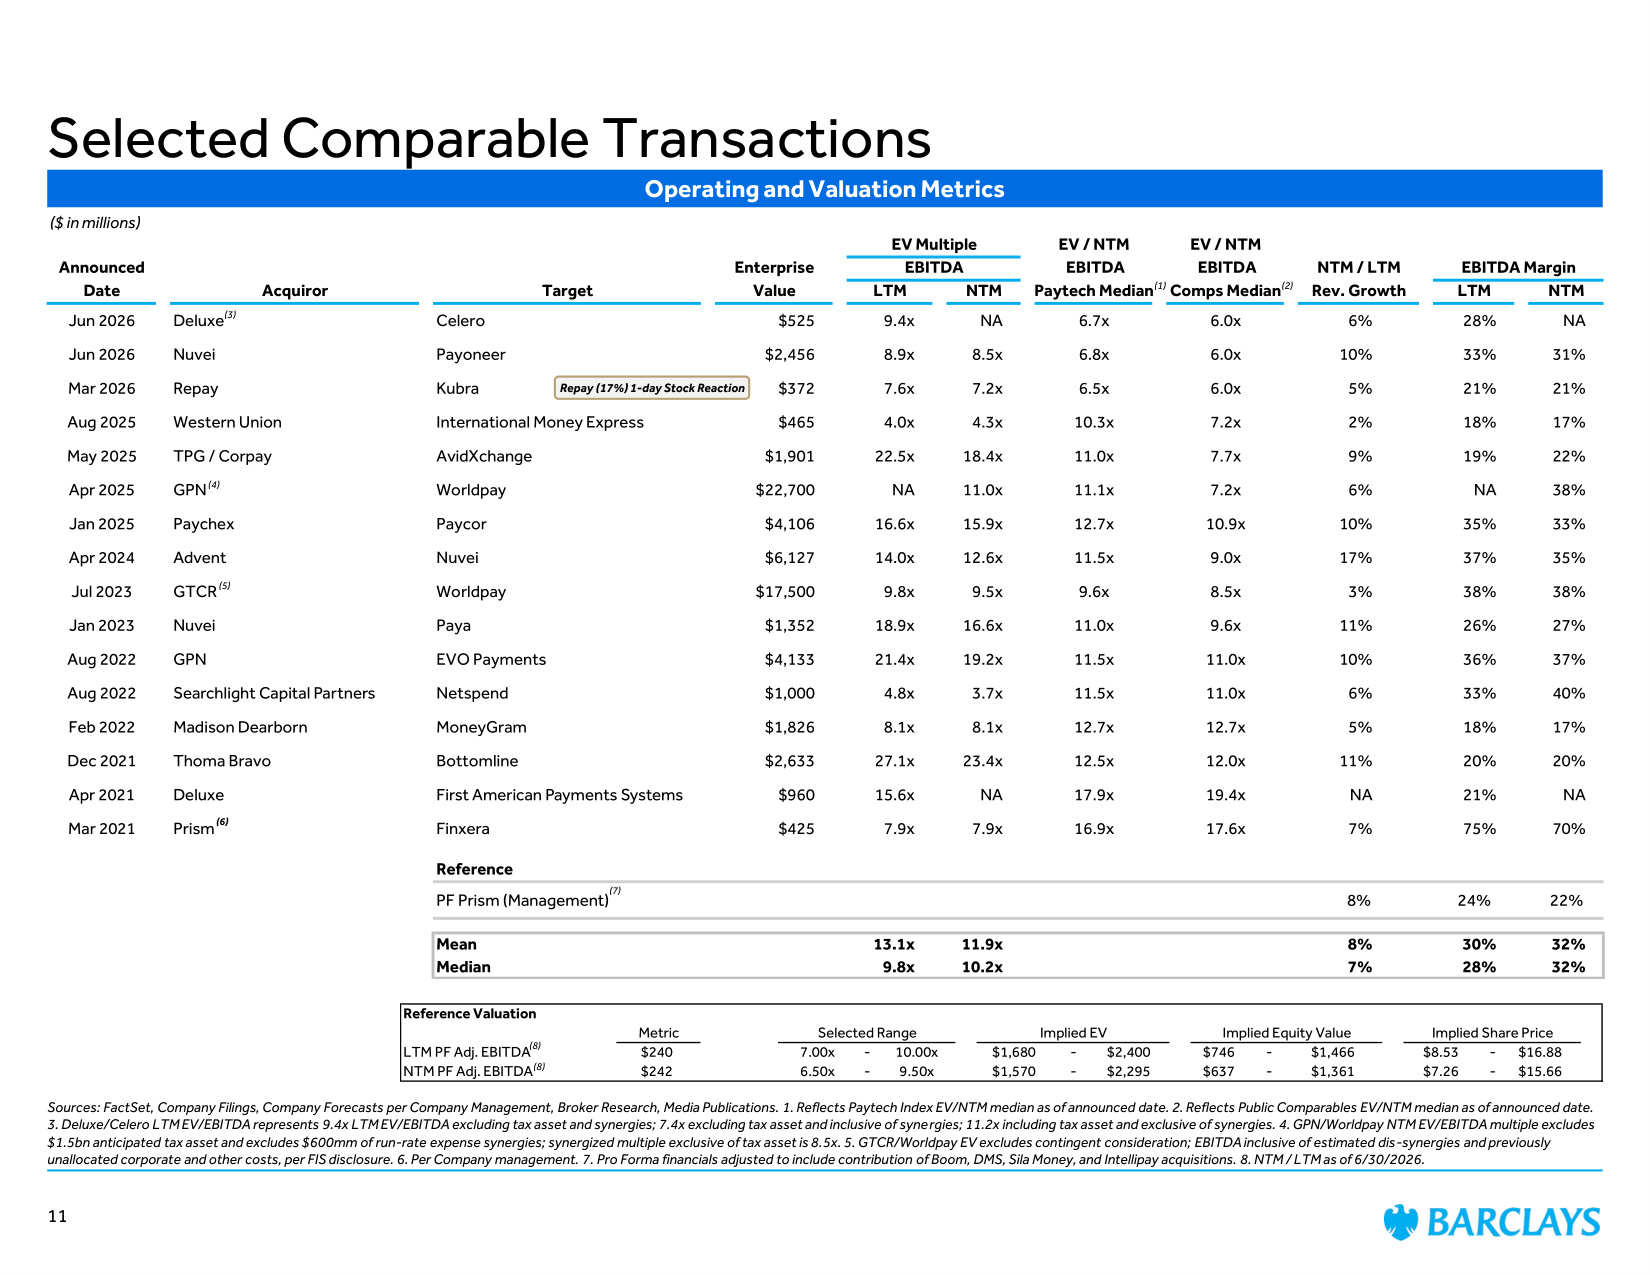
Selected Comparable Transactions Sources: FactSet, Company Filings, Company Forecasts per Company Management, Broker Research, Media Publications. 1. Reflects Paytech Index EV/NTM median as of announced date. 2. Reflects Public Comparables EV/NTM median as of announced date. 3. Deluxe/Celero LTM EV/EBITDA represents 9.4x LTM EV/EBITDA excluding tax asset and synergies; 7.4x excluding tax asset and inclusive of synergies; 11.2x including tax asset and exclusive of synergies. 4. GPN/Worldpay NTM EV/EBITDA multiple excludes $1.5bn anticipated tax asset and excludes $600mm of run-rate expense synergies; synergized multiple exclusive of tax asset is 8.5x. 5. GTCR/Worldpay EV excludes contingent consideration; EBITDA inclusive of estimated dis-synergies and previously unallocated corporate and other costs, per FIS disclosure. 6. Per Company management. 7. Pro Forma financials adjusted to include contribution of Boom, DMS, Sila Money, and Intellipay acquisitions. 8. NTM / LTM as of 6/30/2026. ($ in millions) EV Multiple EV / NTM EV / NTM Announced Enterprise EBITDA EBITDA EBITDA NTM / LTM EBITDA Margin Date Acquiror Target Value LTM NTM Paytech Median Comps Median Rev. Growth LTM NTM Jun 2026 Deluxe Celero $525 9.4x NA 6.7x 6.0x 6% 28% NA Jun 2026 Nuvei Payoneer $2,456 8.9x 8.5x 6.8x 6.0x 10% 33% 31% Mar 2026 Repay Kubra $372 7.6x 7.2x 6.5x 6.0x 5% 21% 21% Aug 2025 Western Union International Money Express $465 4.0x 4.3x 10.3x 7.2x 2% 18% 17% May 2025 TPG / Corpay AvidXchange $1,901 22.5x 18.4x 11.0x 7.7x 9% 19% 22% Apr 2025 GPN Worldpay $22,700 NA 11.0x 11.1x 7.2x 6% NA 38% Jan 2025 Paychex Paycor $4,106 16.6x 15.9x 12.7x 10.9x 10% 35% 33% Apr 2024 Advent Nuvei $6,127 14.0x 12.6x 11.5x 9.0x 17% 37% 35% Jul 2023 GTCR Worldpay $17,500 9.8x 9.5x 9.6x 8.5x 3% 38% 38% Jan 2023 Nuvei Paya $1,352 18.9x 16.6x 11.0x 9.6x 11% 26% 27% Aug 2022 GPN EVO Payments $4,133 21.4x 19.2x 11.5x 11.0x 10% 36% 37% Aug 2022 Searchlight Capital Partners Netspend $1,000 4.8x 3.7x 11.5x 11.0x 6% 33% 40% Feb 2022 Madison Dearborn MoneyGram $1,826 8.1x 8.1x 12.7x 12.7x 5% 18% 17% Dec 2021 Thoma Bravo Bottomline $2,633 27.1x 23.4x 12.5x 12.0x 11% 20% 20% Apr 2021 Deluxe First American Payments Systems $960 15.6x NA 17.9x 19.4x NA 21% NA Mar 2021 Prism Finxera $425 7.9x 7.9x 16.9x 17.6x 7% 75% 70% Reference PF Prism (Management) 8% 24% 22% Mean 13.1x 11.9x 8% 30% 32% Median 9.8x 10.2x 7% 28% 32% Operating and Valuation Metrics 11 (5) (6) (1) (7) Reference Valuation Metric Selected Range Implied EV Implied Equity Value Implied Share Price LTM PF Adj. EBITDA $240 7.00x - 10.00x $1,680 - $2,400 $746 - $1,466 $8.53 - $16.88 NTM PF Adj. EBITDA $242 6.50x - 9.50x $1,570 - $2,295 $637 - $1,361 $7.26 - $15.66 (2) (4) (8) (8) Repay (17%) 1-day Stock Reaction (3)
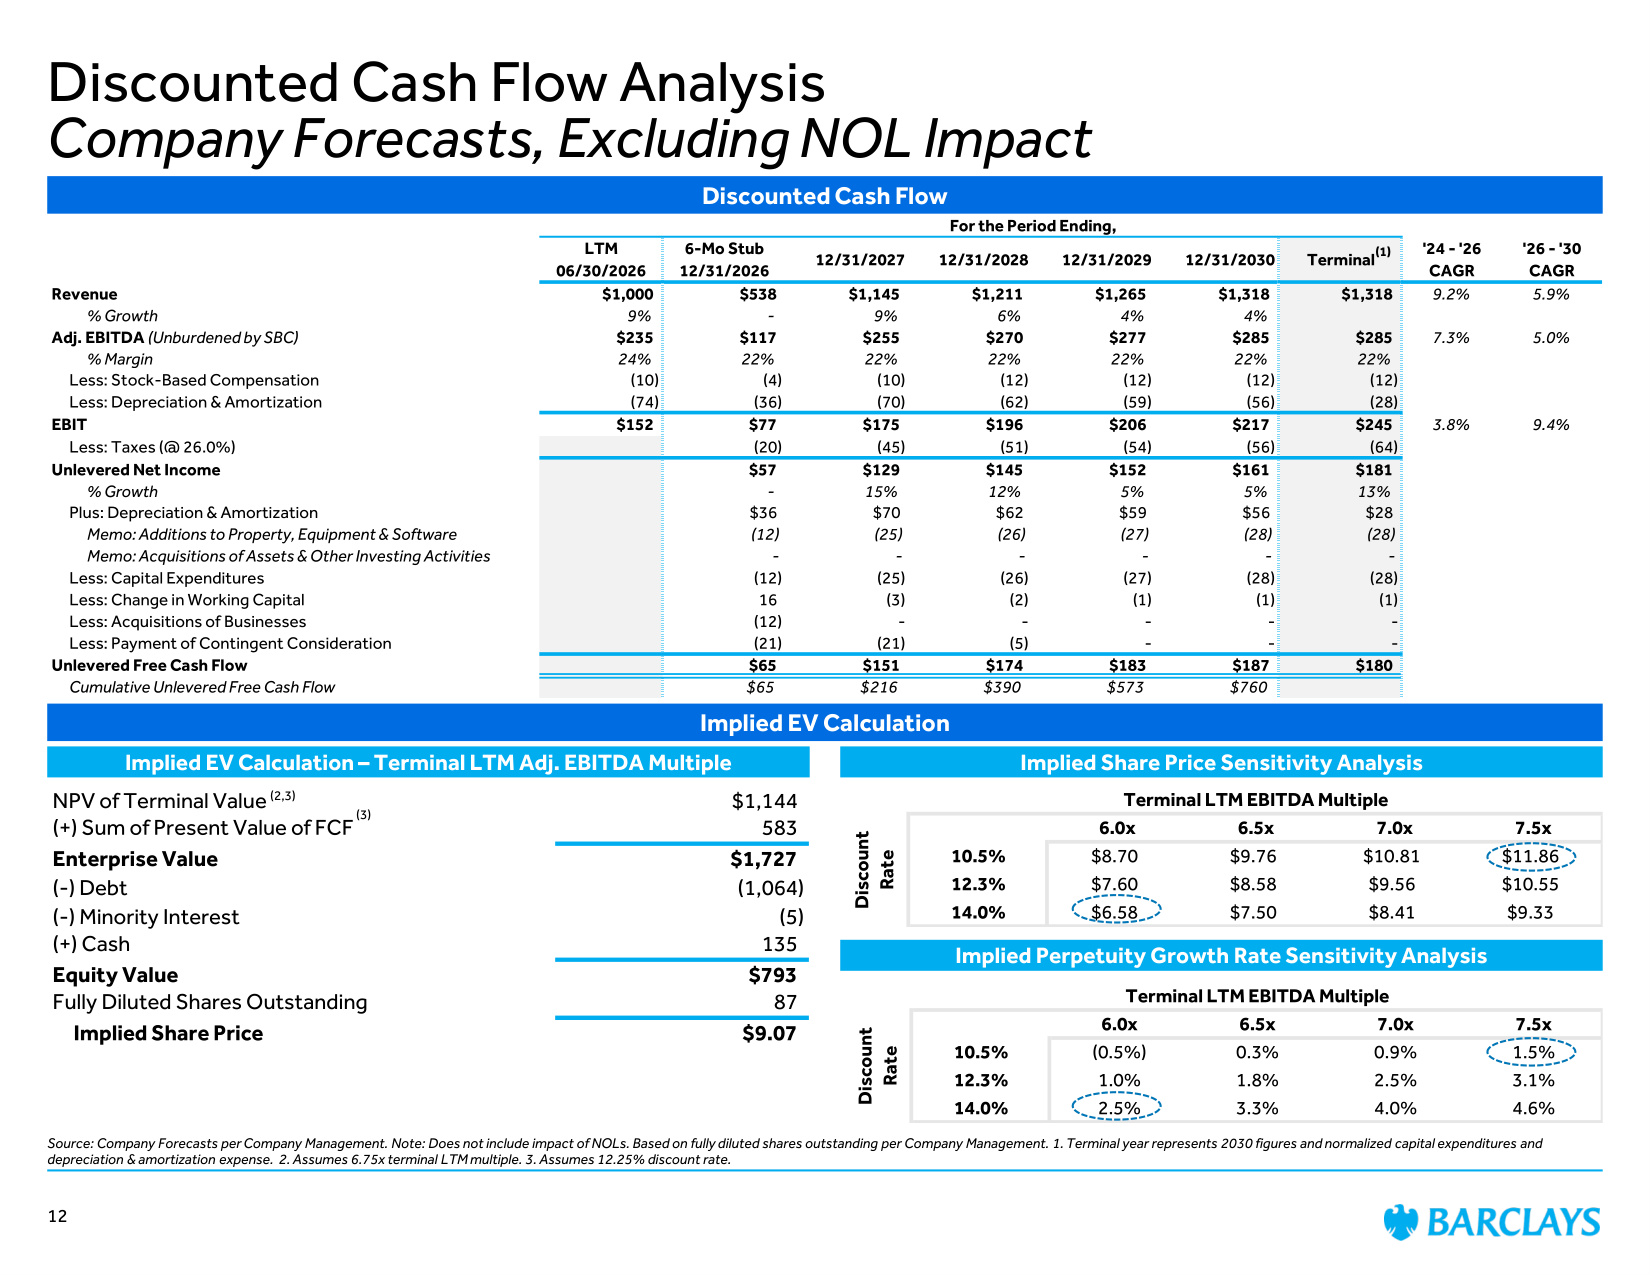
For the Period Ending, LTM 06/30/2026 6-Mo Stub 12/31/2026 12/31/2027 12/31/2028 12/31/2029 12/31/2030 Terminal '24 - '26 CAGR '26 - '30 CAGR Revenue $1,000 $538 $1,145 $1,211 $1,265 $1,318 $1,318 9.2% 5.9% % Growth 9% - 9% 6% 4% 4% Adj. EBITDA (Unburdened by SBC) $235 $117 $255 $270 $277 $285 $285 7.3% 5.0% % Margin 24% 22% 22% 22% 22% 22% 22% Less: Stock-Based Compensation (10) (4) (10) (12) (12) (12) (12) Less: Depreciation & Amortization (74) (36) (70) (62) (59) (56) (28) EBIT $152 $77 $175 $196 $206 $217 $245 3.8% 9.4% Less: Taxes (@ 26.0%) (20) (45) (51) (54) (56) (64) Unlevered Net Income $57 $129 $145 $152 $161 $181 % Growth - 15% 12% 5% 5% 13% Plus: Depreciation & Amortization $36 $70 $62 $59 $56 $28 Memo: Additions to Property, Equipment & Software (12) (25) (26) (27) (28) (28) Memo: Acquisitions of Assets & Other Investing Activities - - - - - - Less: Capital Expenditures (12) (25) (26) (27) (28) (28) Less: Change in Working Capital 16 (3) (2) (1) (1) (1) Less: Acquisitions of Businesses (12) - - - - - Less: Payment of Contingent Consideration (21) (21) (5) - - - Unlevered Free Cash Flow $65 $151 $174 $183 $187 $180 Cumulative Unlevered Free Cash Flow $65 $216 $390 $573 $760 Implied EV Calculation Implied EV Calculation – Terminal LTM Adj. EBITDA Multiple Implied Share Price Sensitivity Analysis Implied Perpetuity Growth Rate Sensitivity Analysis Discounted Cash Flow Terminal LTM EBITDA Multiple 6.0x 6.5x 7.0x 7.5x 10.5% $8.70 $9.76 $10.81 $11.86 12.3% $7.60 $8.58 $9.56 $10.55 14.0% $6.58 $7.50 $8.41 $9.33 Discount Rate Discounted Cash Flow Analysis Company Forecasts, Excluding NOL Impact Source: Company Forecasts per Company Management. Note: Does not include impact of NOLs. Based on fully diluted shares outstanding per Company Management. 1. Terminal year represents 2030 figures and normalized capital expenditures and depreciation & amortization expense. 2. Assumes 6.75x terminal LTM multiple. 3. Assumes 12.25% discount rate. (1) Terminal LTM EBITDA Multiple 6.0x 6.5x 7.0x 7.5x 10.5% (0.5%) 0.3% 0.9% 1.5% 12.3% 1.0% 1.8% 2.5% 3.1% 14.0% 2.5% 3.3% 4.0% 4.6% Discount Rate (2,3) (3) 12 NPV of Terminal Value $1,144 (+) Sum of Present Value of FCF 583 Enterprise Value $1,727 (-) Debt (1,064) (-) Minority Interest (5) (+) Cash 135 Equity Value $793 Fully Diluted Shares Outstanding 87 Implied Share Price $9.07
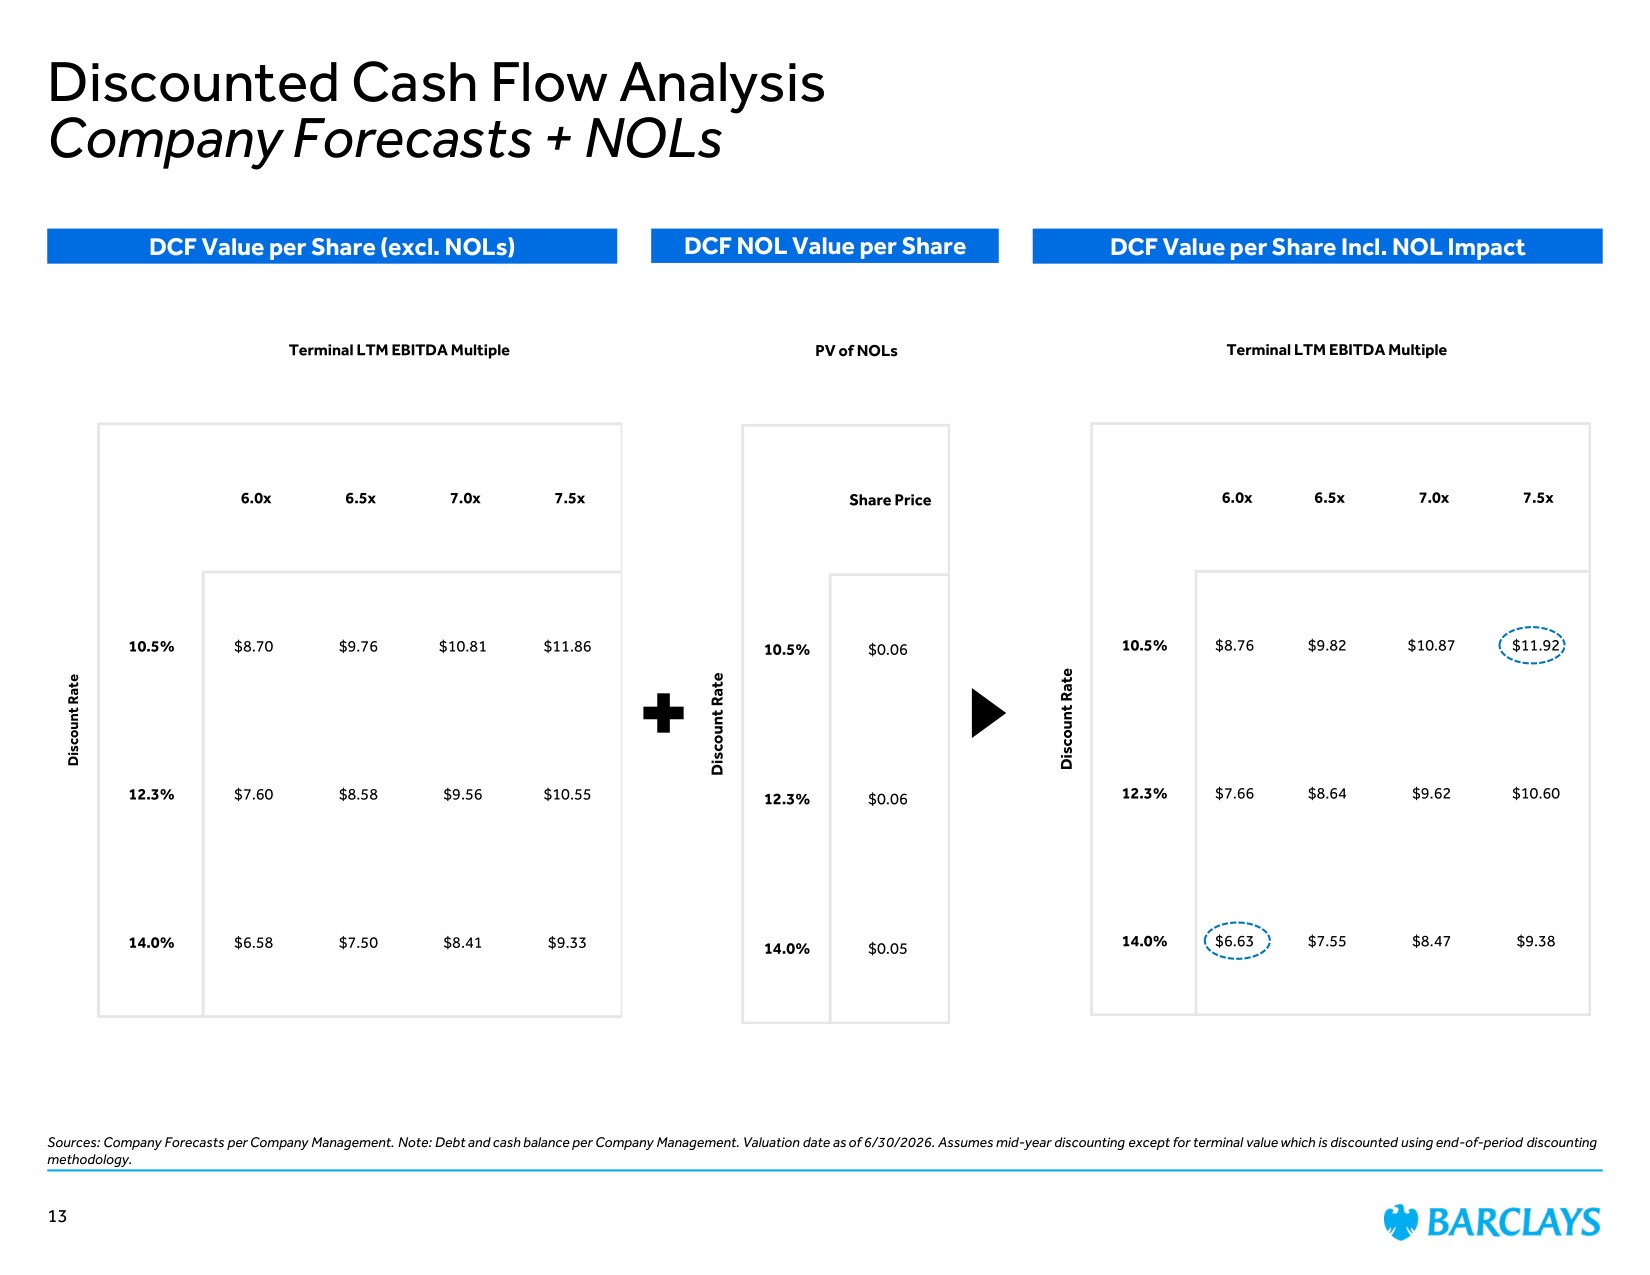
Terminal LTM EBITDA Multiple 6.0x 6.5x 7.0x 7.5x 10.5% $8.76 $9.82 $10.87 $11.92 12.3% $7.66 $8.64 $9.62 $10.60 14.0% $6.63 $7.55 $8.47 $9.38 Discount Rate Discounted Cash Flow Analysis Company Forecasts + NOLs Sources: Company Forecasts per Company Management. Note: Debt and cash balance per Company Management. Valuation date as of 6/30/2026. Assumes mid-year discounting except for terminal value which is discounted using end-of-period discounting methodology. DCF Value per Share (excl. NOLs) DCF NOL Value per Share DCF Value per Share Incl. NOL Impact Terminal LTM EBITDA Multiple 6.0x 6.5x 7.0x 7.5x 10.5% $8.70 $9.76 $10.81 $11.86 12.3% $7.60 $8.58 $9.56 $10.55 14.0% $6.58 $7.50 $8.41 $9.33 Discount Rate PV of NOLs Share Price 10.5% $0.06 12.3% $0.06 14.0% $0.05 Discount Rate 13
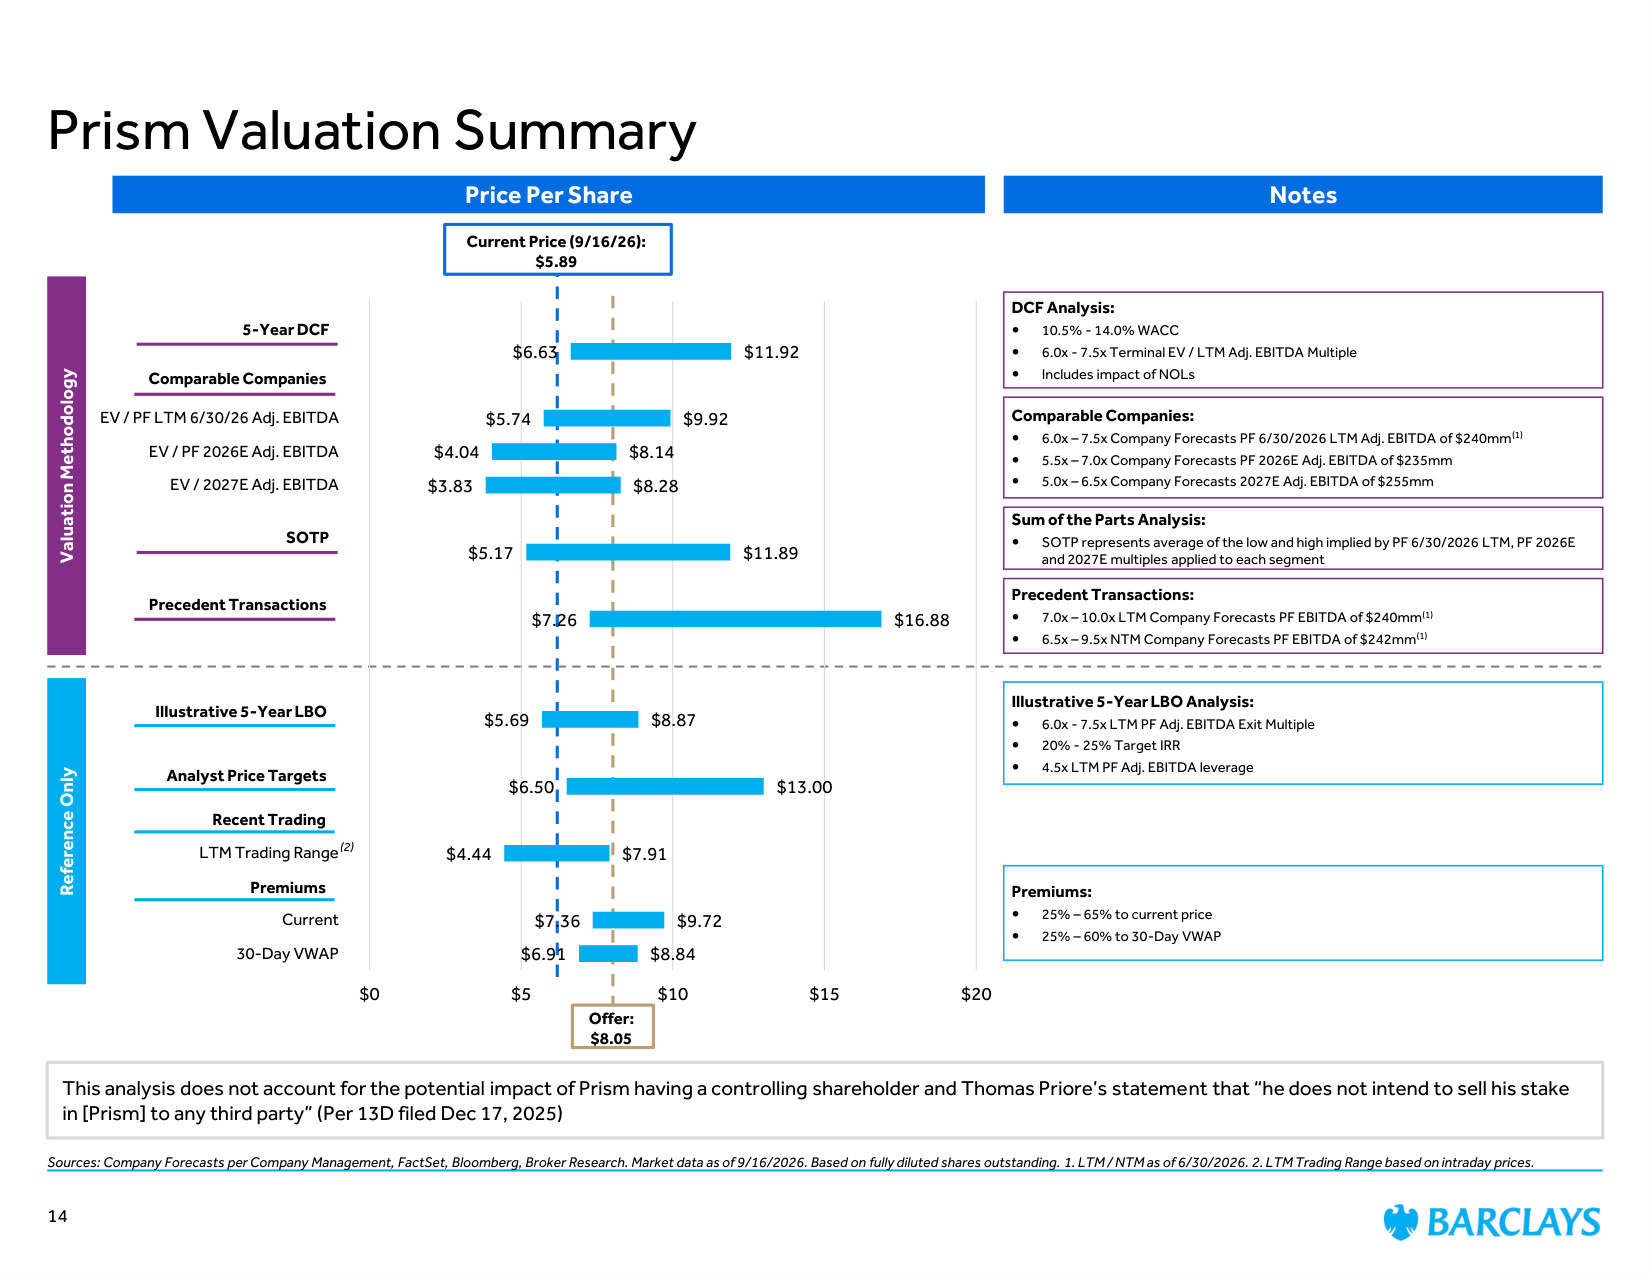
Price Per Share Notes Comparable Companies: 6.0x – 7.5x Company Forecasts PF 6/30/2026 LTM Adj. EBITDA of $240mm(1) 5.5x – 7.0x Company Forecasts PF 2026E Adj. EBITDA of $235mm 5.0x – 6.5x Company Forecasts 2027E Adj. EBITDA of $255mm Premiums: 25% – 65% to current price 25% – 60% to 30-Day VWAP Precedent Transactions: 7.0x – 10.0x LTM Company Forecasts PF EBITDA of $240mm(1) 6.5x – 9.5x NTM Company Forecasts PF EBITDA of $242mm(1) Valuation Methodology Reference Only Prism Valuation Summary DCF Analysis: 10.5% - 14.0% WACC 6.0x - 7.5x Terminal EV / LTM Adj. EBITDA Multiple Includes impact of NOLs Premiums Recent Trading Precedent Transactions Comparable Companies Sources: Company Forecasts per Company Management, FactSet, Bloomberg, Broker Research. Market data as of 9/16/2026. Based on fully diluted shares outstanding. 1. LTM / NTM as of 6/30/2026. 2. LTM Trading Range based on intraday prices. Illustrative 5-Year LBO Analysis: 6.0x - 7.5x LTM PF Adj. EBITDA Exit Multiple 20% - 25% Target IRR 4.5x LTM PF Adj. EBITDA leverage Illustrative 5-Year LBO Current Price (9/16/26): $5.89 5-Year DCF Analyst Price Targets $6.63 $5.74 $4.04 $3.83 $5.17 $7.26 $5.69 $6.50 $4.44 $7.36 $6.91 $11.92 $9.92 $8.14 $8.28 $11.89 $16.88 $8.87 $13.00 $7.91 $9.72 $8.84 $0 $5 $10 $15 $20 EV / PF LTM 6/30/26 Adj. EBITDA EV / PF 2026E Adj. EBITDA EV / 2027E Adj. EBITDA LTM Trading Range Current 30-Day VWAP This analysis does not account for the potential impact of Prism having a controlling shareholder and Thomas Priore's statement that "he does not intend to sell his stake in [Prism] to any third party" (Per 13D filed Dec 17, 2025) SOTP Sum of the Parts Analysis: SOTP represents average of the low and high implied by PF 6/30/2026 LTM, PF 2026E and 2027E multiples applied to each segment Offer: $8.05 14 (2)
Appendix
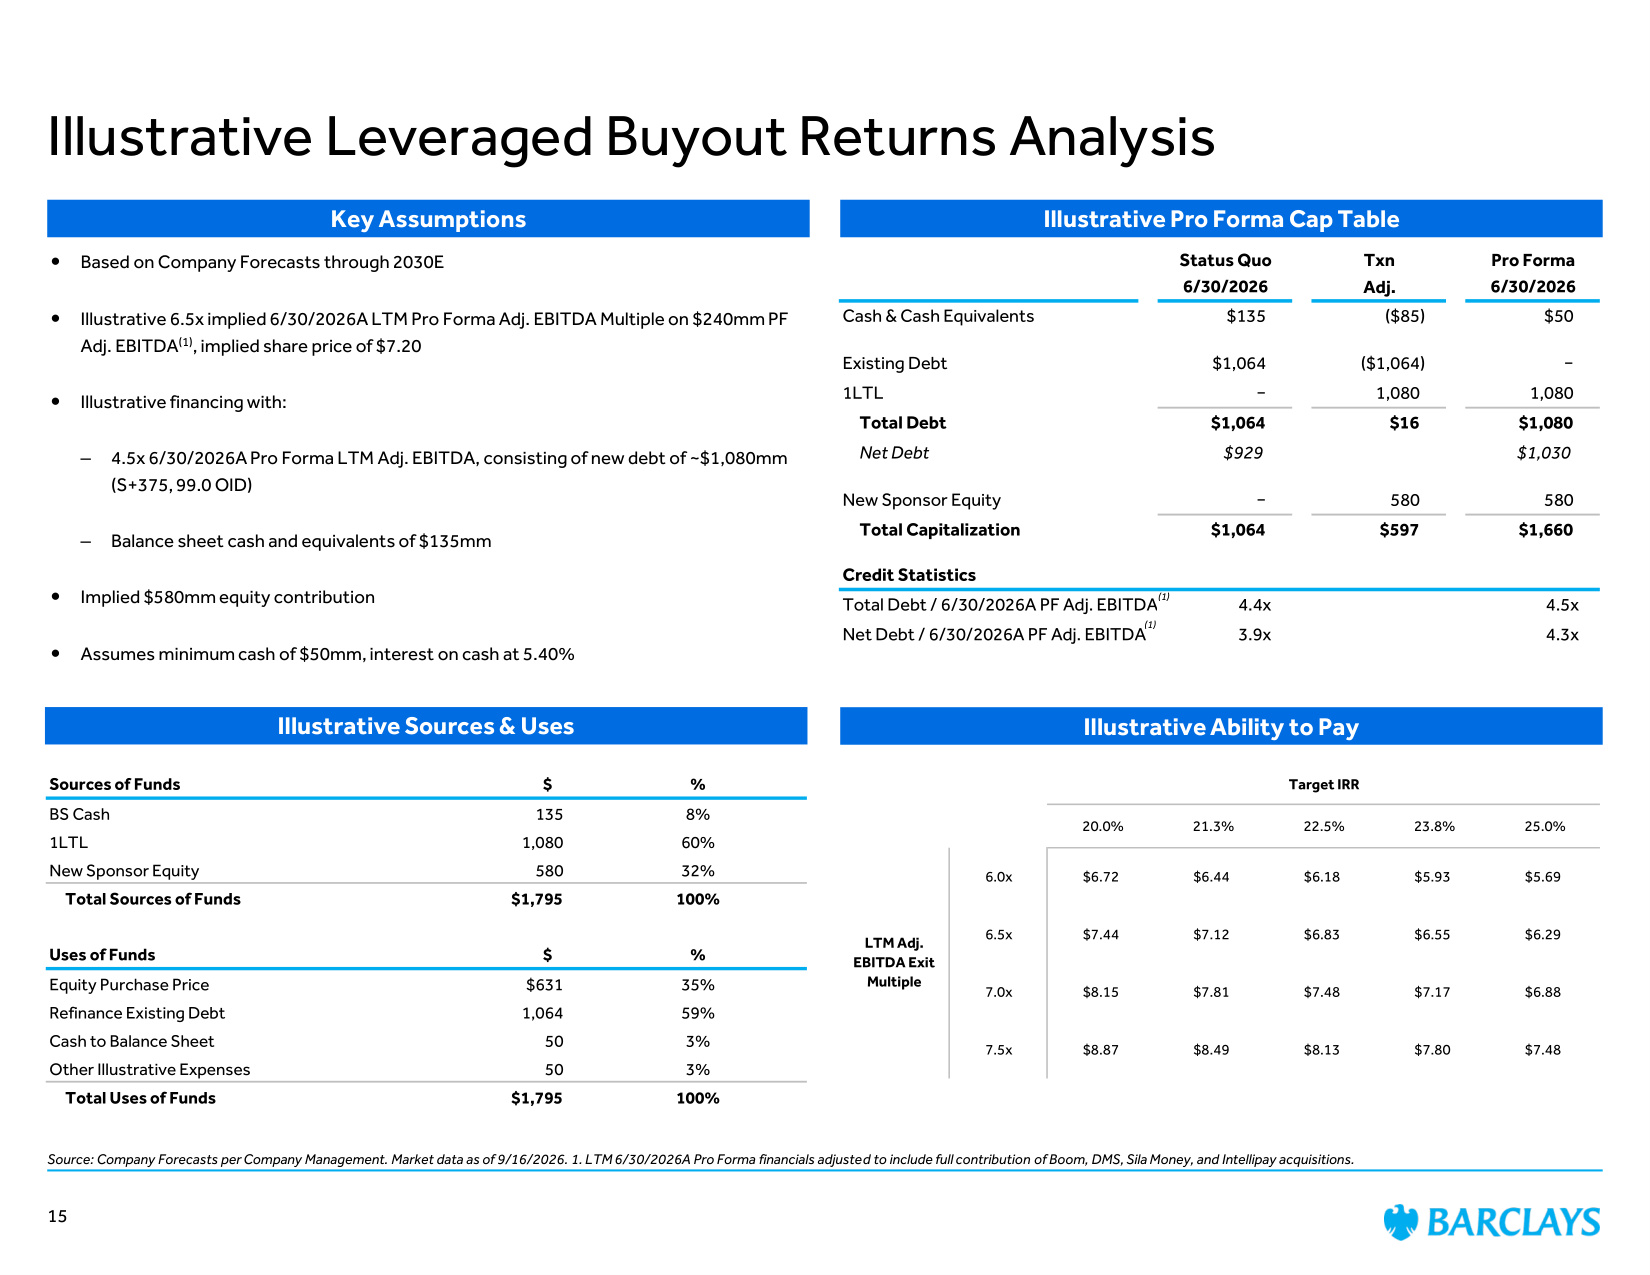
Illustrative Pro Forma Cap Table Illustrative Ability to Pay Key Assumptions Sources of Funds $ % BS Cash 135 8% 1LTL 1,080 60% New Sponsor Equity 580 32% Total Sources of Funds $1,795 100% Uses of Funds $ % Equity Purchase Price $631 35% Refinance Existing Debt 1,064 59% Cash to Balance Sheet 50 3% Other Illustrative Expenses 50 3% Total Uses of Funds $1,795 100% Status Quo Txn Pro Forma 6/30/2026 Adj. 6/30/2026 Cash & Cash Equivalents $135 ($85) $50 Existing Debt $1,064 ($1,064) − 1LTL − 1,080 1,080 Total Debt $1,064 $16 $1,080 Net Debt $929 $1,030 New Sponsor Equity − 580 580 Total Capitalization $1,064 $597 $1,660 Credit Statistics Total Debt / 6/30/2026A PF Adj. EBITDA 4.4x 4.5x Net Debt / 6/30/2026A PF Adj. EBITDA 3.9x 4.3x Target IRR 20.0% 21.3% 22.5% 23.8% 25.0% 6.0x $6.72 $6.44 $6.18 $5.93 $5.69 6.5x $7.44 $7.12 $6.83 $6.55 $6.29 7.0x $8.15 $7.81 $7.48 $7.17 $6.88 7.5x $8.87 $8.49 $8.13 $7.80 $7.48 LTM Adj. EBITDA Exit Multiple Illustrative Sources & Uses Based on Company Forecasts through 2030E Illustrative 6.5x implied 6/30/2026A LTM Pro Forma Adj. EBITDA Multiple on $240mm PF Adj. EBITDA(1), implied share price of $7.20 Illustrative financing with: – 4.5x 6/30/2026A Pro Forma LTM Adj. EBITDA, consisting of new debt of ~$1,080mm (S+375, 99.0 OID) – Balance sheet cash and equivalents of $135mm Implied $580mm equity contribution Assumes minimum cash of $50mm, interest on cash at 5.40% Illustrative Leveraged Buyout Returns Analysis Source: Company Forecasts per Company Management. Market data as of 9/16/2026. 1. LTM 6/30/2026A Pro Forma financials adjusted to include full contribution of Boom, DMS, Sila Money, and Intellipay acquisitions. (1) (1) 15
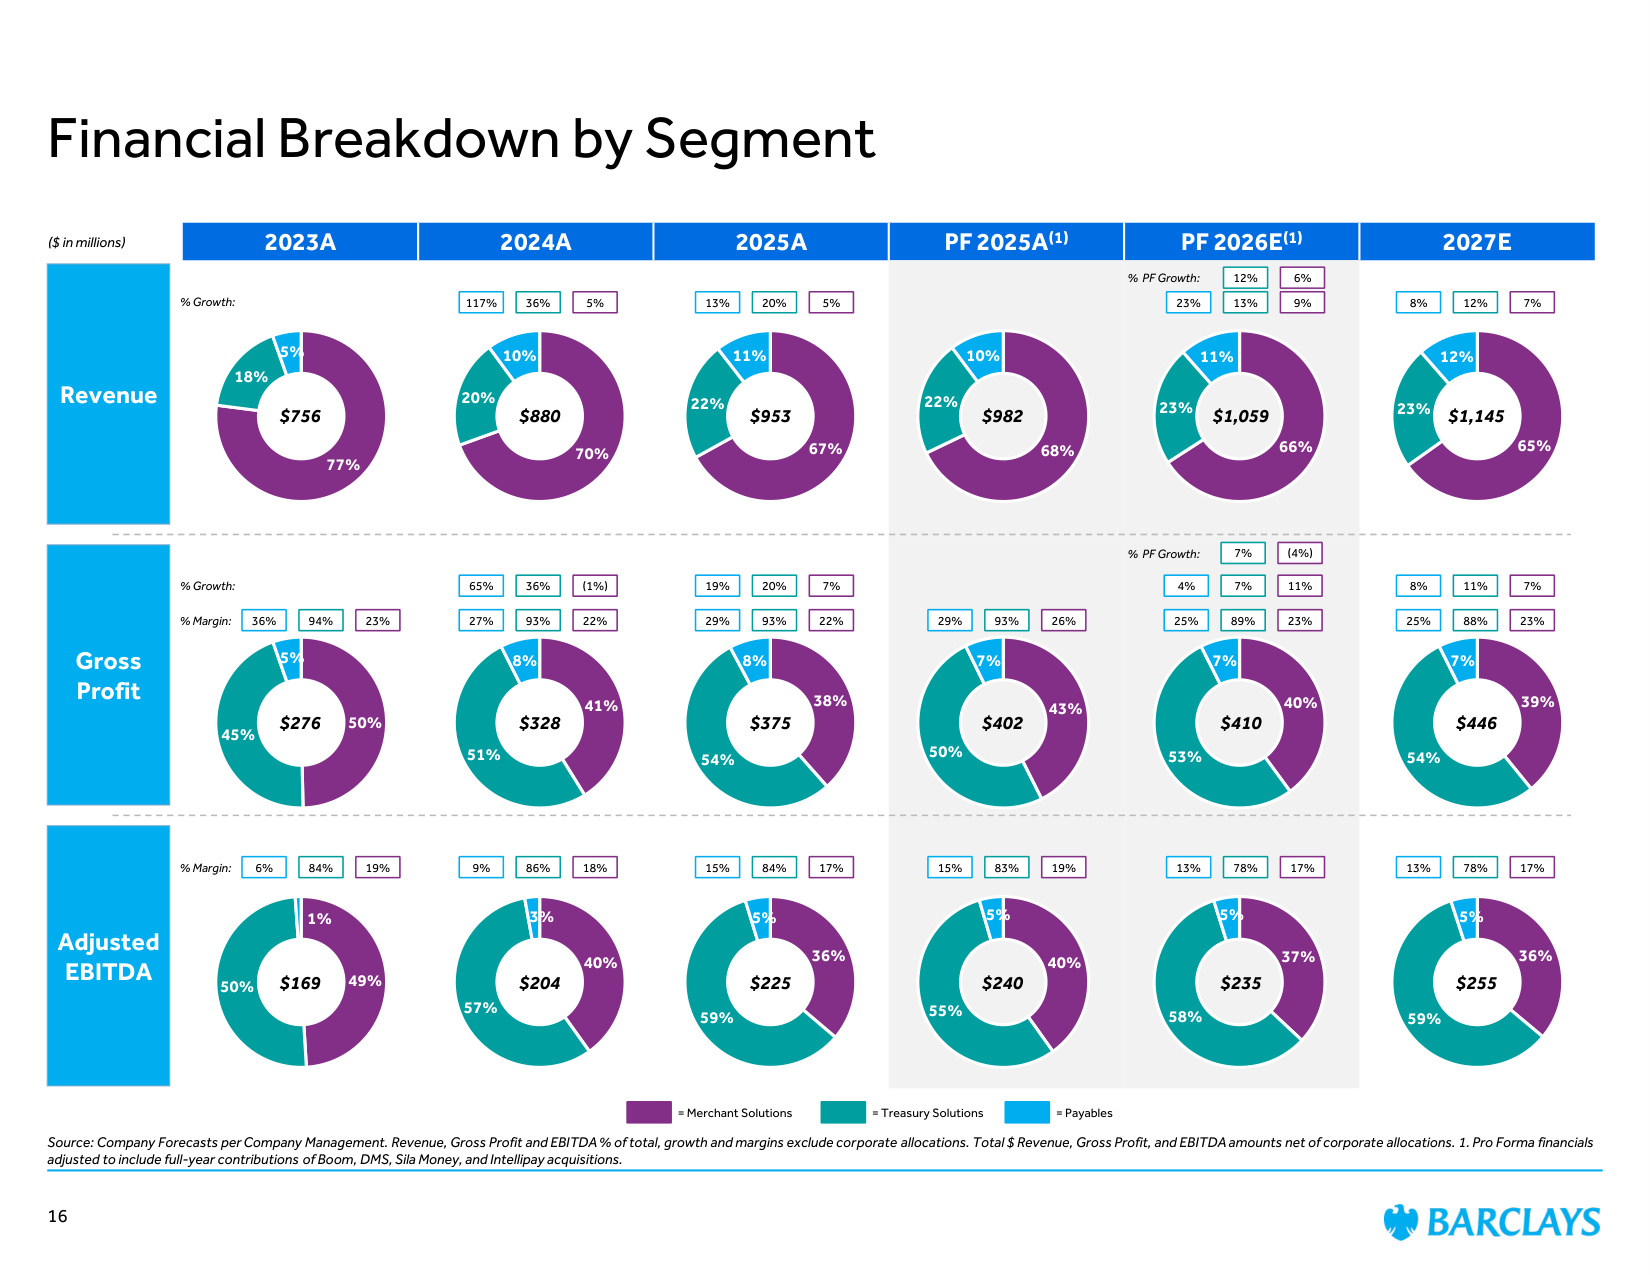
2023A 2024A 2025A PF 2025A(1) PF 2026E(1) 2027E Source: Company Forecasts per Company Management. Revenue, Gross Profit and EBITDA % of total, growth and margins exclude corporate allocations. Total $ Revenue, Gross Profit, and EBITDA amounts net of corporate allocations. 1. Pro Forma financials adjusted to include full-year contributions of Boom, DMS, Sila Money, and Intellipay acquisitions. Financial Breakdown by Segment Revenue ($ in millions) Adjusted EBITDA 16 Gross Profit 77% 18% 5% 70% 20% 10% 67% 22% 11% 68% 22% 10% 66% 23% 11% 50% 45% 5% 41% 51% 8% 38% 54% 8% 43% 50% 7% 40% 53% 7% 49% 50% 1% 40% 57% 3% 36% 59% 5% 40% 55% 5% 37% 58% 5% % Margin: % Margin: % Growth: 5% 117% 36% 5% 13% 20% 9% 23% 13% 22% 27% 93% 22% 29% 93% 26% 29% 93% 23% 25% 88% 18% 9% 86% 17% 15% 84% 19% 15% 83% 17% 13% 78% 23% 36% 94% 19% 6% 84% $953 $982 $1,059 $756 $880 $375 $402 $410 $276 $328 $225 $240 $235 $169 $204 = Merchant Solutions = Payables = Treasury Solutions % Growth: (1%) 65% 36% 7% 19% 20% 7% 8% 11% 23% 25% 89% 11% 4% 7% 36% 59% 5% $1,145 $446 $255 17% 13% 78% 6% 12% % PF Growth: (4%) 7% % PF Growth: 8% 12% 39% 54% 7% 7% 65% 23% 12%
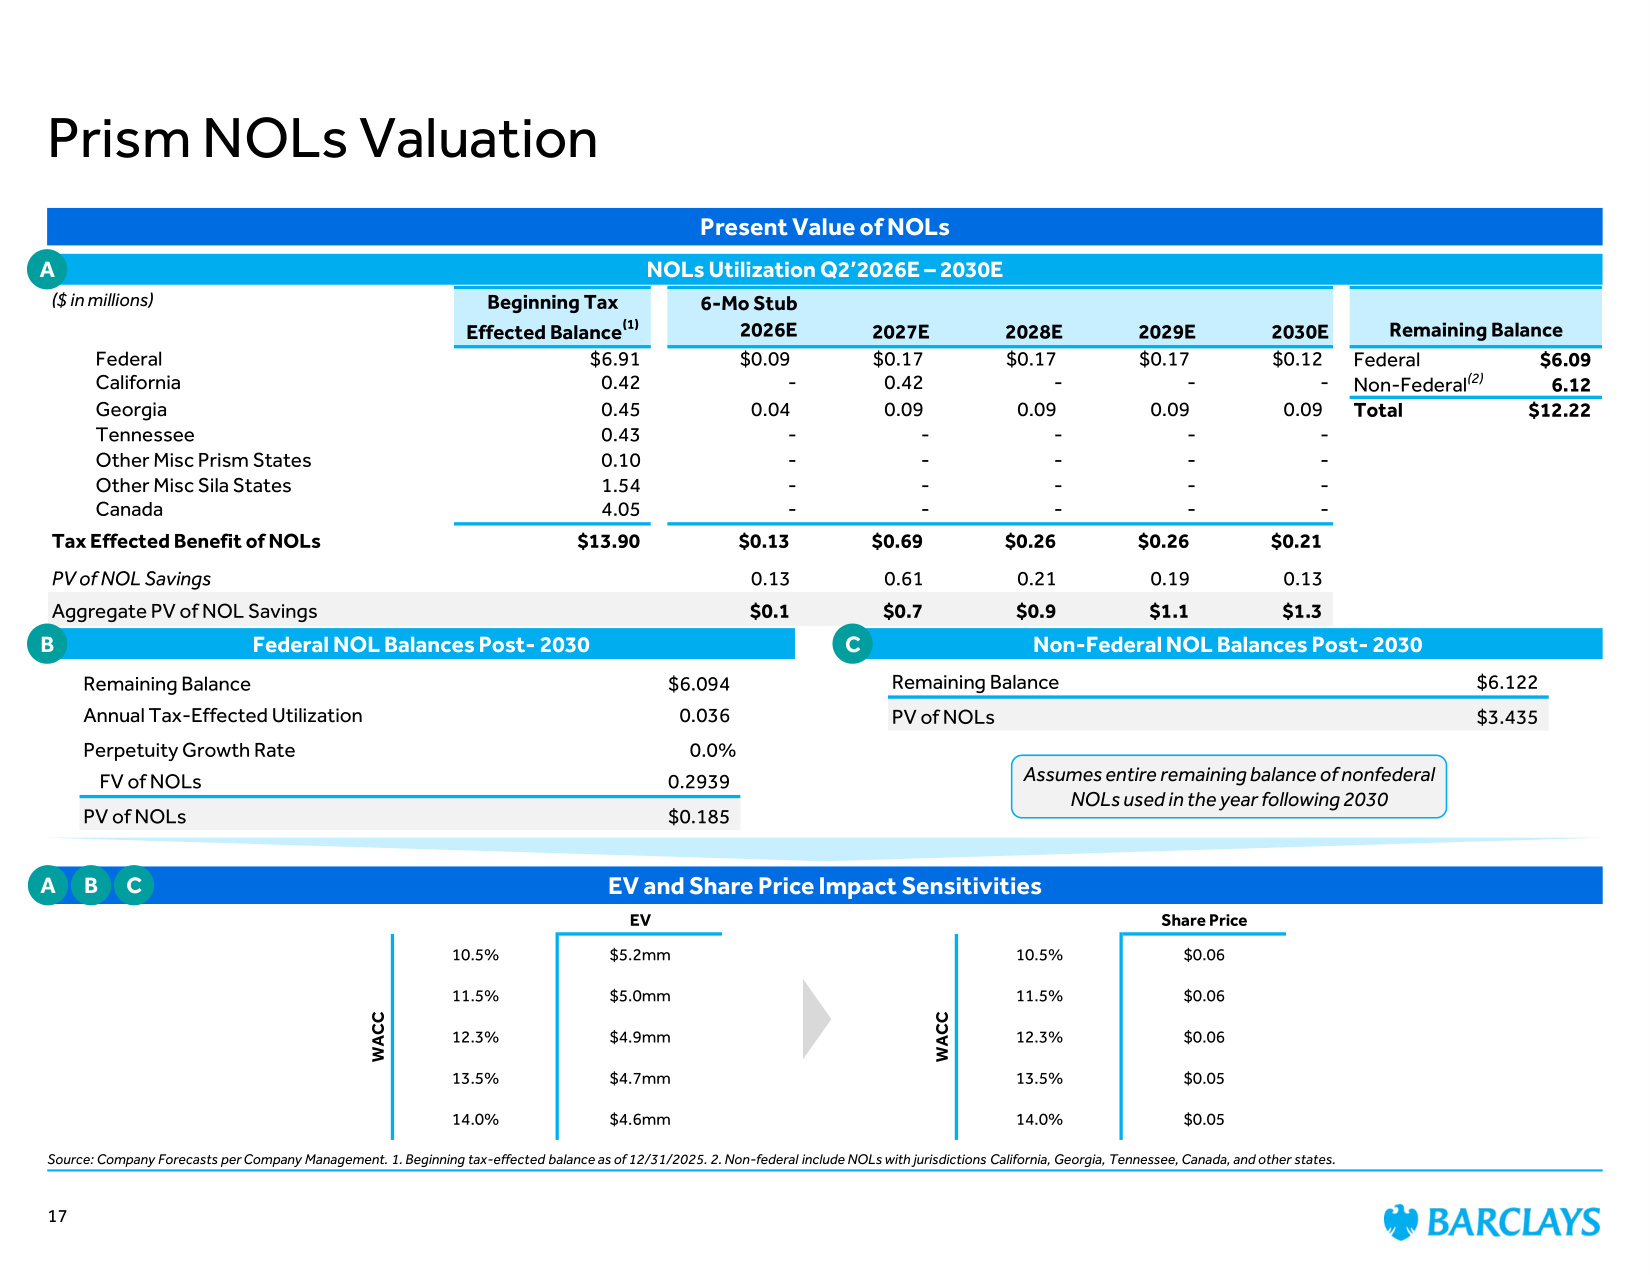
Present Value of NOLs ($ in millions) Beginning Tax Effected Balance(1) 6-Mo Stub 2026E 2027E 2028E 2029E 2030E Remaining Balance Federal $6.91 $0.09 $0.17 $0.17 $0.17 $0.12 Federal $6.09 California 0.42 - 0.42 - - - Non-Federal 6.12 Georgia 0.45 0.04 0.09 0.09 0.09 0.09 Total $12.22 Tennessee 0.43 - - - - - Other Misc Prism States 0.10 - - - - - Other Misc Sila States 1.54 - - - - - Canada 4.05 - - - - - Tax Effected Benefit of NOLs $13.90 $0.13 $0.69 $0.26 $0.26 $0.21 PV of NOL Savings 0.13 0.61 0.21 0.19 0.13 Aggregate PV of NOL Savings $0.1 $0.7 $0.9 $1.1 $1.3 EV and Share Price Impact Sensitivities Prism NOLs Valuation Source: Company Forecasts per Company Management. 1. Beginning tax-effected balance as of 12/31/2025. 2. Non-federal include NOLs with jurisdictions California, Georgia, Tennessee, Canada, and other states. Remaining Balance $6.094 Annual Tax-Effected Utilization 0.036 Perpetuity Growth Rate 0.0% FV of NOLs 0.2939 PV of NOLs $0.185 NOLs Utilization Q2'2026E – 2030E Federal NOL Balances Post- 2030 Non-Federal NOL Balances Post- 2030 Remaining Balance $6.122 PV of NOLs $3.435 EV Share Price 10.5% $5.2mm 10.5% $0.06 11.5% $5.0mm 11.5% $0.06 12.3% $4.9mm 12.3% $0.06 13.5% $4.7mm 13.5% $0.05 14.0% $4.6mm 14.0% $0.05 WACC WACC Assumes entire remaining balance of nonfederal NOLs used in the year following 2030 A B C A B C (2) 17
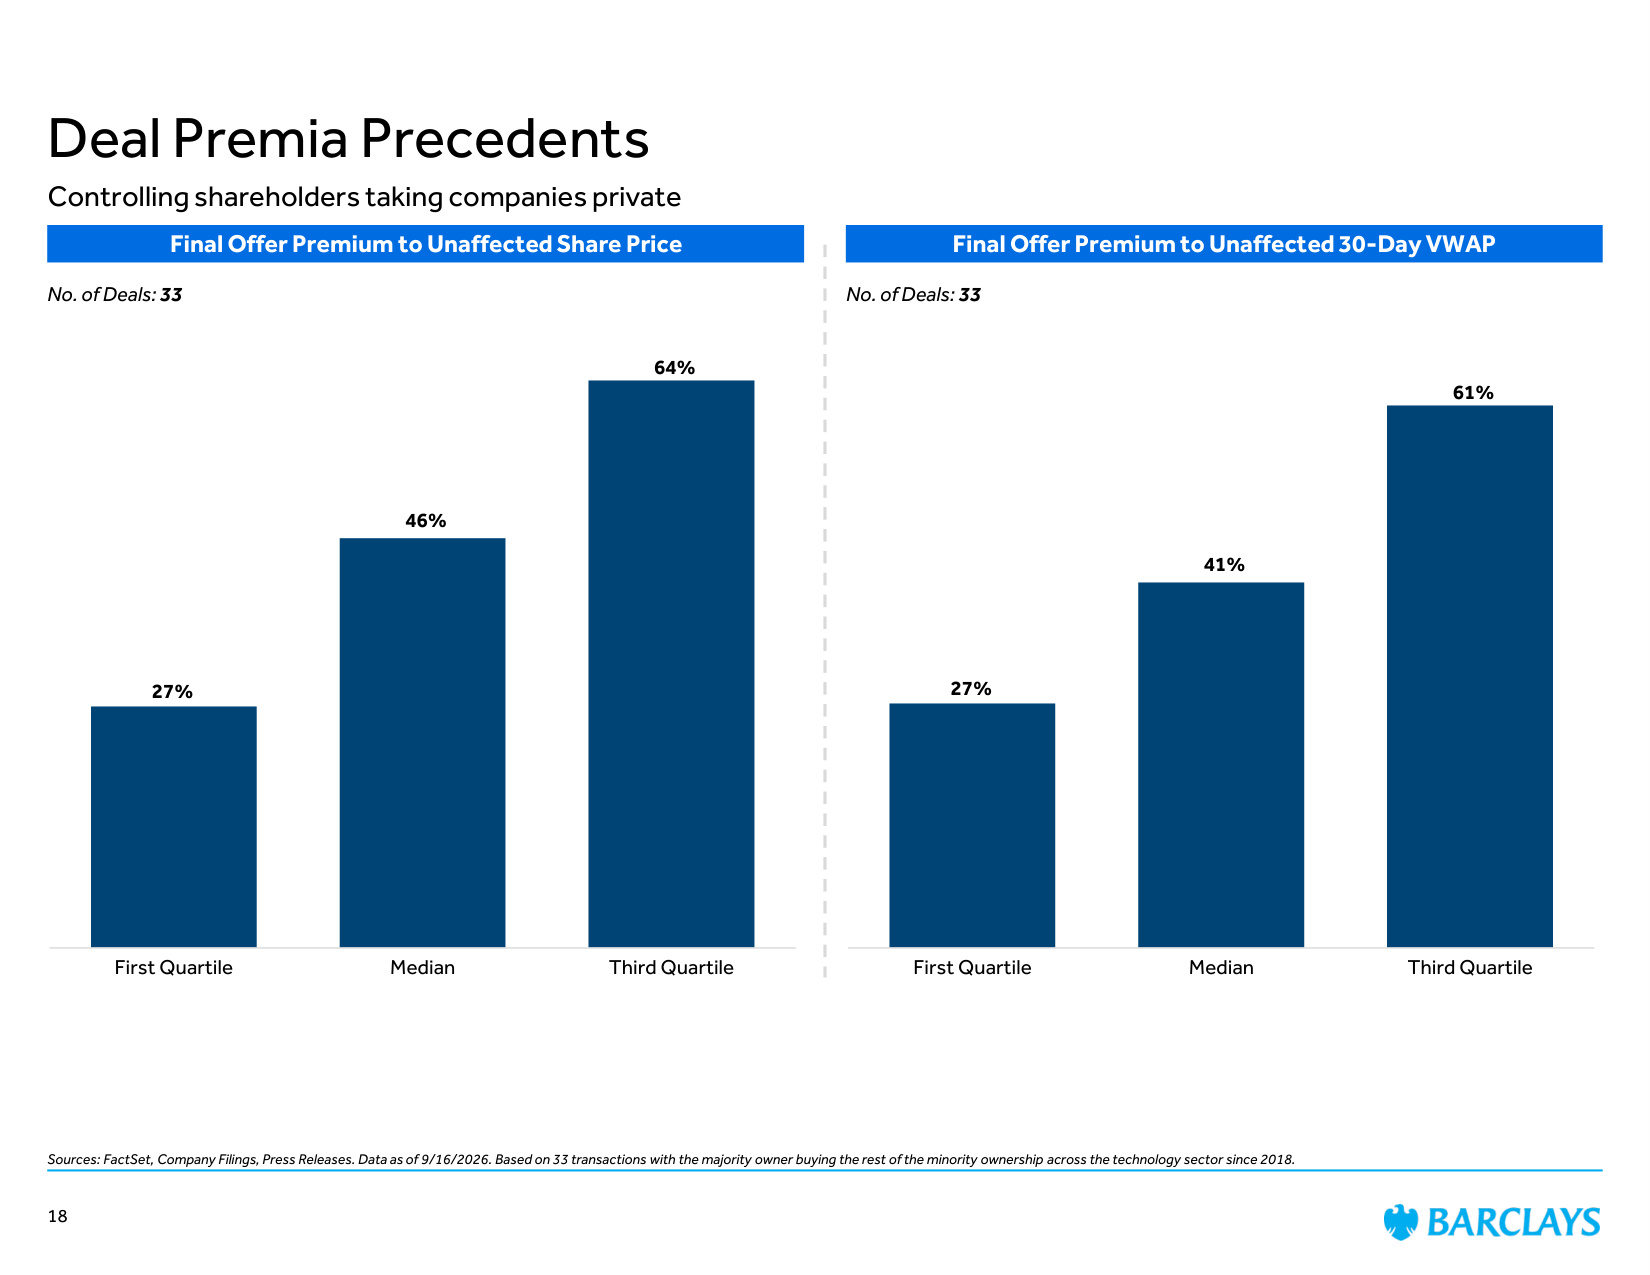
Sources: FactSet, Company Filings, Press Releases. Data as of 9/16/2026. Based on 33 transactions with the majority owner buying the rest of the minority ownership across the technology sector since 2018. Controlling shareholders taking companies private 18 Deal Premia Precedents 27% 46% 64% First Quartile Median Third Quartile Final Offer Premium to Unaffected Share Price No. of Deals: 33 Final Offer Premium to Unaffected 30-Day VWAP 27% 41% 61% First Quartile Median Third Quartile No. of Deals: 33
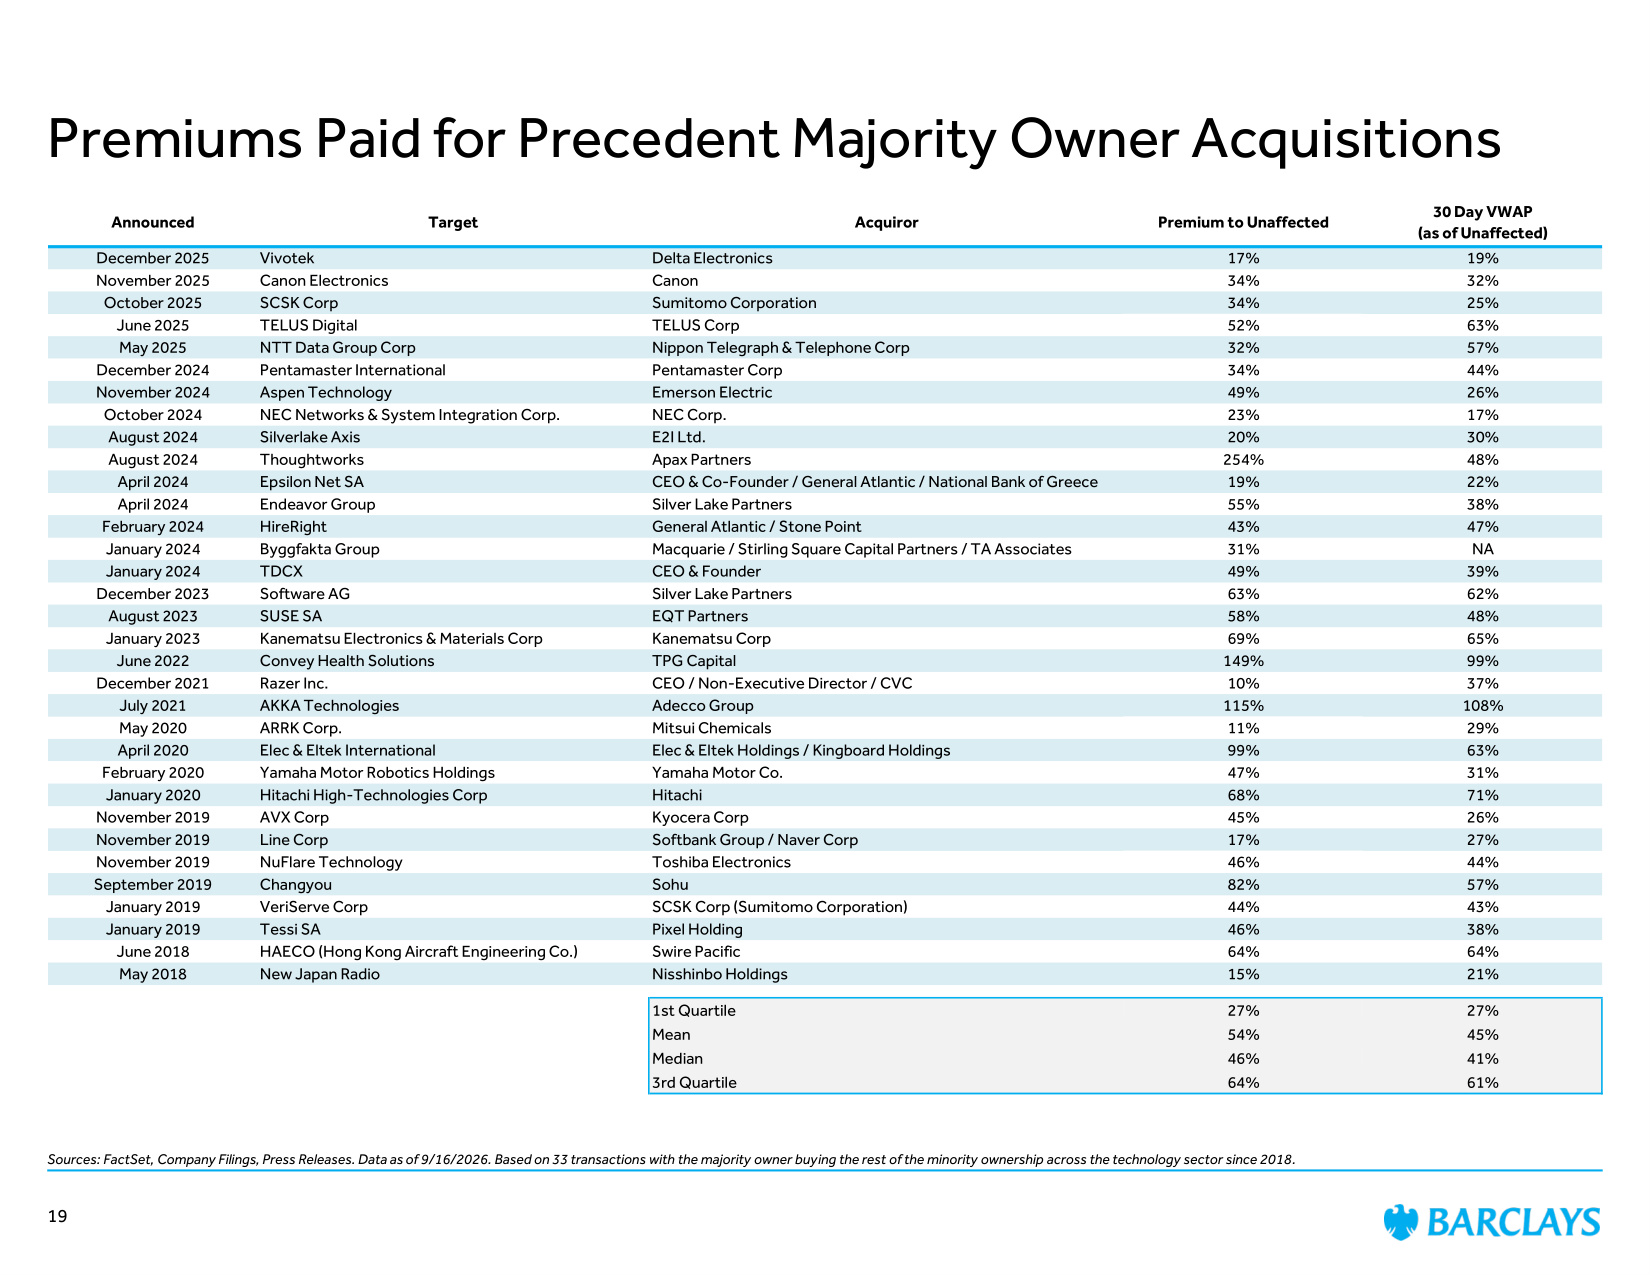
Sources: FactSet, Company Filings, Press Releases. Data as of 9/16/2026. Based on 33 transactions with the majority owner buying the rest of the minority ownership across the technology sector since 2018. Premiums Paid for Precedent Majority Owner Acquisitions 19 Announced Target Acquiror Premium to Unaffected 30 Day VWAP (as of Unaffected) December 2025 Vivotek Delta Electronics 17% 19% November 2025 Canon Electronics Canon 34% 32% October 2025 SCSK Corp Sumitomo Corporation 34% 25% June 2025 TELUS Digital TELUS Corp 52% 63% May 2025 NTT Data Group Corp Nippon Telegraph & Telephone Corp 32% 57% December 2024 Pentamaster International Pentamaster Corp 34% 44% November 2024 Aspen Technology Emerson Electric 49% 26% October 2024 NEC Networks & System Integration Corp. NEC Corp. 23% 17% August 2024 Silverlake Axis E2I Ltd. 20% 30% August 2024 Thoughtworks Apax Partners 254% 48% April 2024 Epsilon Net SA CEO & Co-Founder / General Atlantic / National Bank of Greece 19% 22% April 2024 Endeavor Group Silver Lake Partners 55% 38% February 2024 HireRight General Atlantic / Stone Point 43% 47% January 2024 Byggfakta Group Macquarie / Stirling Square Capital Partners / TA Associates 31% NA January 2024 TDCX CEO & Founder 49% 39% December 2023 Software AG Silver Lake Partners 63% 62% August 2023 SUSE SA EQT Partners 58% 48% January 2023 Kanematsu Electronics & Materials Corp Kanematsu Corp 69% 65% June 2022 Convey Health Solutions TPG Capital 149% 99% December 2021 Razer Inc. CEO / Non-Executive Director / CVC 10% 37% July 2021 AKKA Technologies Adecco Group 115% 108% May 2020 ARRK Corp. Mitsui Chemicals 11% 29% April 2020 Elec & Eltek International Elec & Eltek Holdings / Kingboard Holdings 99% 63% February 2020 Yamaha Motor Robotics Holdings Yamaha Motor Co. 47% 31% January 2020 Hitachi High-Technologies Corp Hitachi 68% 71% November 2019 AVX Corp Kyocera Corp 45% 26% November 2019 Line Corp Softbank Group / Naver Corp 17% 27% November 2019 NuFlare Technology Toshiba Electronics 46% 44% September 2019 Changyou Sohu 82% 57% January 2019 VeriServe Corp SCSK Corp (Sumitomo Corporation) 44% 43% January 2019 Tessi SA Pixel Holding 46% 38% June 2018 HAECO (Hong Kong Aircraft Engineering Co.) Swire Pacific 64% 64% May 2018 New Japan Radio Nisshinbo Holdings 15% 21% 1st Quartile 27% 27% Mean 54% 45% Median 46% 41% 3rd Quartile 64% 61%
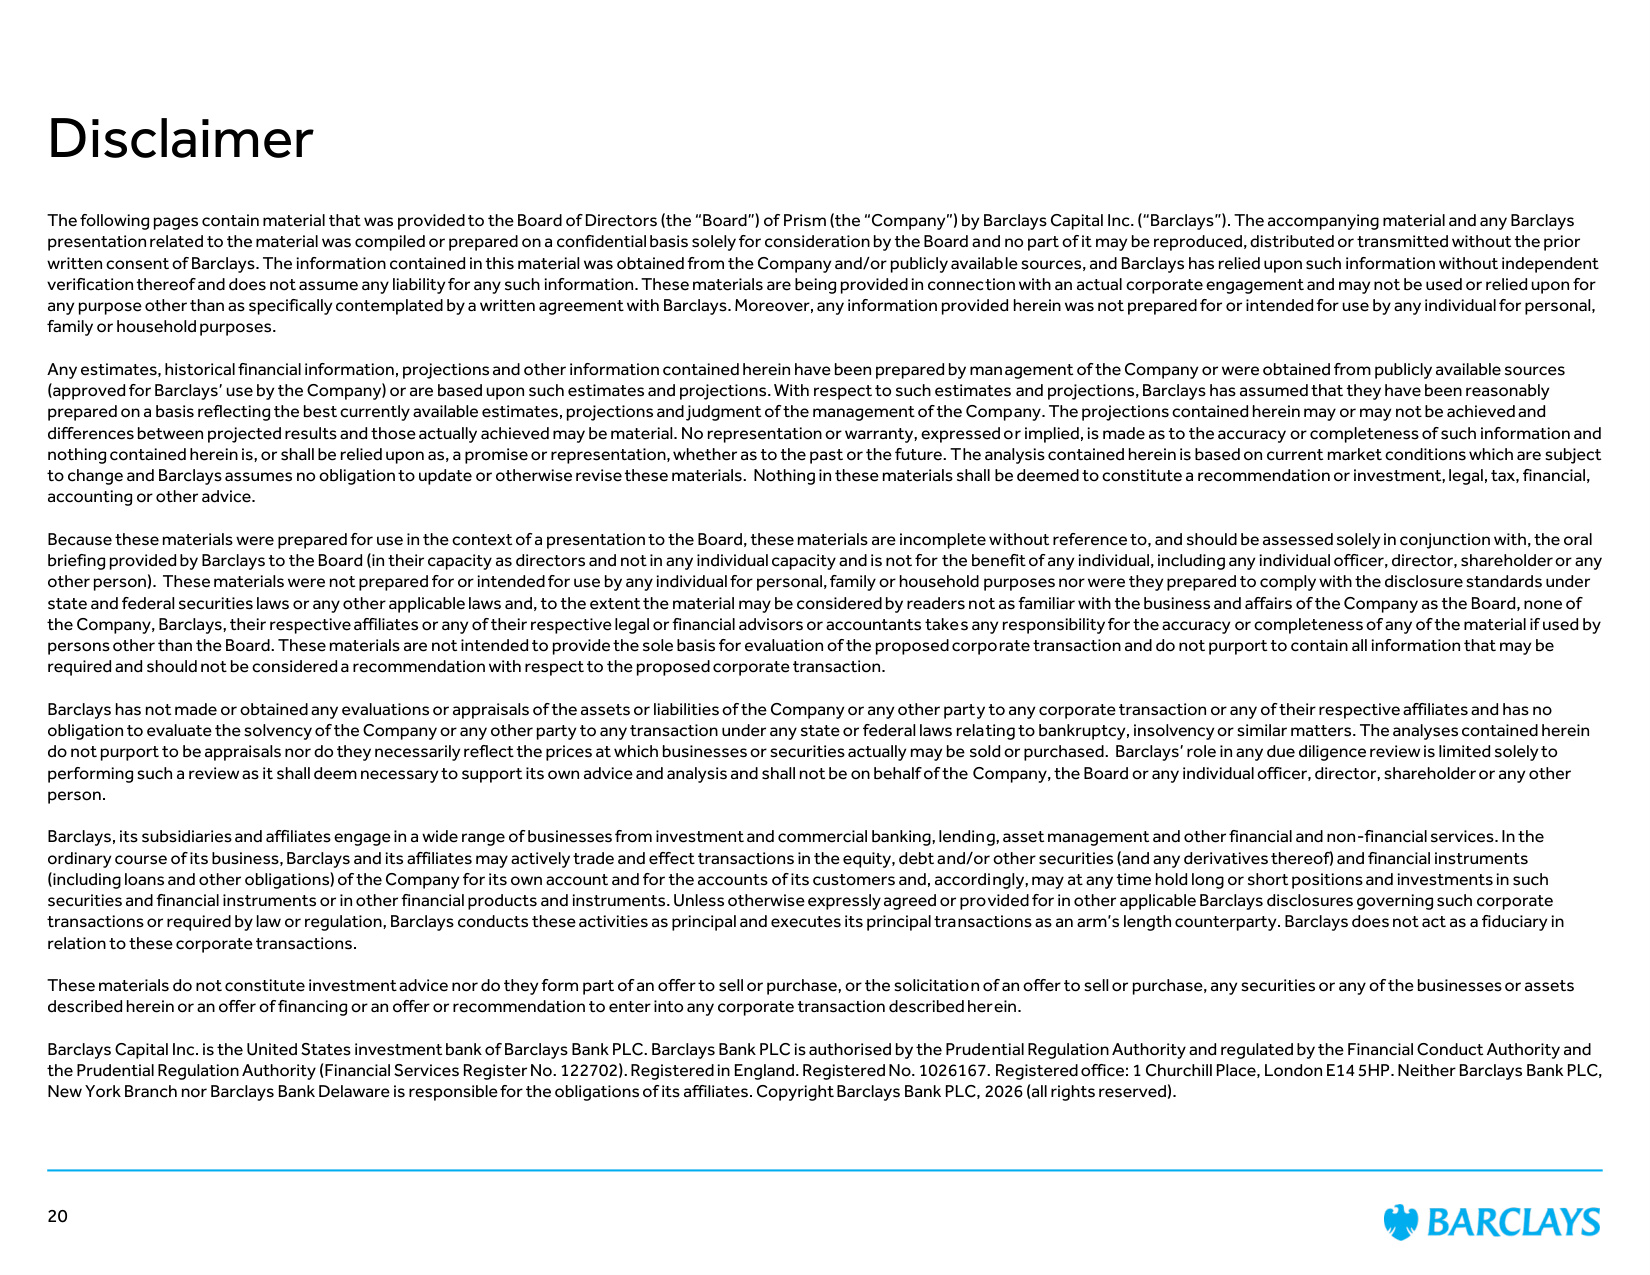
The following pages contain material that was provided to the Board of Directors (the "Board") of Prism (the "Company") by Barclays Capital Inc. ("Barclays"). The accompanying material and any Barclays presentation related to the material was compiled or prepared on a confidential basis solely for consideration by the Board and no part of it may be reproduced, distributed or transmitted without the prior written consent of Barclays. The information contained in this material was obtained from the Company and/or publicly available sources, and Barclays has relied upon such information without independent verification thereof and does not assume any liability for any such information. These materials are being provided in connection with an actual corporate engagement and may not be used or relied upon for any purpose other than as specifically contemplated by a written agreement with Barclays. Moreover, any information provided herein was not prepared for or intended for use by any individual for personal, family or household purposes. Any estimates, historical financial information, projections and other information contained herein have been prepared by management of the Company or were obtained from publicly available sources (approved for Barclays' use by the Company) or are based upon such estimates and projections. With respect to such estimates and projections, Barclays has assumed that they have been reasonably prepared on a basis reflecting the best currently available estimates, projections and judgment of the management of the Company. The projections contained herein may or may not be achieved and differences between projected results and those actually achieved may be material. No representation or warranty, expressed or implied, is made as to the accuracy or completeness of such information and nothing contained herein is, or shall be relied upon as, a promise or representation, whether as to the past or the future. The analysis contained herein is based on current market conditions which are subject to change and Barclays assumes no obligation to update or otherwise revise these materials. Nothing in these materials shall be deemed to constitute a recommendation or investment, legal, tax, financial, accounting or other advice. Because these materials were prepared for use in the context of a presentation to the Board, these materials are incomplete without reference to, and should be assessed solely in conjunction with, the oral briefing provided by Barclays to the Board (in their capacity as directors and not in any individual capacity and is not for the benefit of any individual, including any individual officer, director, shareholder or any other person). These materials were not prepared for or intended for use by any individual for personal, family or household purposes nor were they prepared to comply with the disclosure standards under state and federal securities laws or any other applicable laws and, to the extent the material may be considered by readers not as familiar with the business and affairs of the Company as the Board, none of the Company, Barclays, their respective affiliates or any of their respective legal or financial advisors or accountants takes any responsibility for the accuracy or completeness of any of the material if used by persons other than the Board. These materials are not intended to provide the sole basis for evaluation of the proposed corporate transaction and do not purport to contain all information that may be required and should not be considered a recommendation with respect to the proposed corporate transaction. Barclays has not made or obtained any evaluations or appraisals of the assets or liabilities of the Company or any other party to any corporate transaction or any of their respective affiliates and has no obligation to evaluate the solvency of the Company or any other party to any transaction under any state or federal laws relating to bankruptcy, insolvency or similar matters. The analyses contained herein do not purport to be appraisals nor do they necessarily reflect the prices at which businesses or securities actually may be sold or purchased. Barclays' role in any due diligence review is limited solely to performing such a review as it shall deem necessary to support its own advice and analysis and shall not be on behalf of the Company, the Board or any individual officer, director, shareholder or any other person. Barclays, its subsidiaries and affiliates engage in a wide range of businesses from investment and commercial banking, lending, asset management and other financial and non-financial services. In the ordinary course of its business, Barclays and its affiliates may actively trade and effect transactions in the equity, debt and/or other securities (and any derivatives thereof) and financial instruments (including loans and other obligations) of the Company for its own account and for the accounts of its customers and, accordingly, may at any time hold long or short positions and investments in such securities and financial instruments or in other financial products and instruments. Unless otherwise expressly agreed or provided for in other applicable Barclays disclosures governing such corporate transactions or required by law or regulation, Barclays conducts these activities as principal and executes its principal transactions as an arm's length counterparty. Barclays does not act as a fiduciary in relation to these corporate transactions. These materials do not constitute investment advice nor do they form part of an offer to sell or purchase, or the solicitation of an offer to sell or purchase, any securities or any of the businesses or assets described herein or an offer of financing or an offer or recommendation to enter into any corporate transaction described herein. Barclays Capital Inc. is the United States investment bank of Barclays Bank PLC. Barclays Bank PLC is authorised by the Prudential Regulation Authority and regulated by the Financial Conduct Authority and the Prudential Regulation Authority (Financial Services Register No. 122702). Registered in England. Registered No. 1026167. Registered office: 1 Churchill Place, London E14 5HP. Neither Barclays Bank PLC, New York Branch nor Barclays Bank Delaware is responsible for the obligations of its affiliates. Copyright Barclays Bank PLC, 2026 (all rights reserved). Disclaimer 20