Shareholder Report
Aug. 31, 2026
USD ($)
Holding
What were the fund costs for the last year? (based on a hypothetical $10,000 investment)
Share class | Costs of a $10,000 investment | Costs paid as a percentage of a $10,000 investment |
| Class A | $ 63 | 0.59 % |
Management's discussion of fund performance
The fund’s Class A shares gained 14.80% for the year ended August 31, 2026. That result compares with a 20.38% gain for the S&P 500 Index. For information on returns for additional periods, including the fund lifetime, please refer to capitalgroup.com/mutual-fund-returns-A.
What factors influenced results
U.S. equities posted strong gains during the fund’s fiscal year, driving the S&P 500 Index to record highs. Markets were supported by higher oil prices amid tensions in the Middle East and continued investment in artificial intelligence infrastructure. The U.S. economy remained resilient, underpinned by steady consumer spending, while signs of a moderating labor market prompted the Federal Reserve to implement three 25-basis-point rate cuts during the period.
Within the fund, most sectors contributed positively to returns, with information technology being particularly impactful. The healthcare, industrials and materials sectors also generated solid gains. Although it represented a relatively small portion of the portfolio, the energy sector delivered especially strong results and contributed meaningfully to fund returns.
In contrast, the financials and consumer discretionary sectors posted negative returns and weighed on overall fund results.
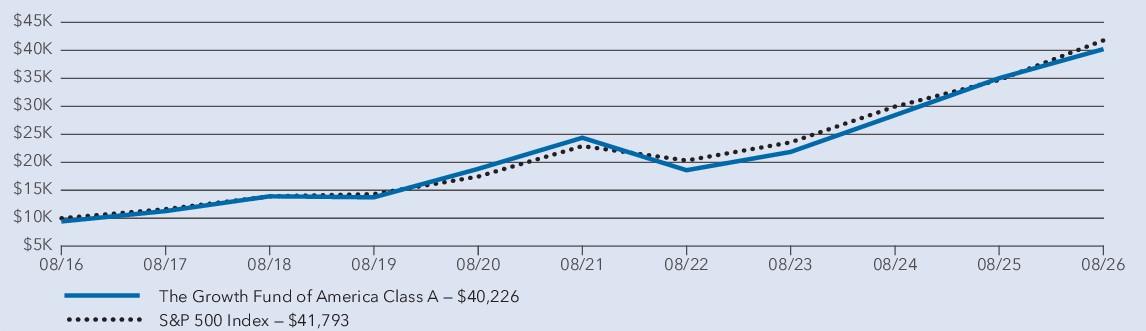
Average annual total returns
1 year | 5 years | 10 years | |
| The Growth Fund of America — Class A (with sales charge) * | 8.20 % | 9.23 % | 14.93 % |
| The Growth Fund of America — Class A (without sales charge) * | 14.80 % | 10.53 % | 15.62 % |
| S&P 500 Index † | 20.38 % | 12.79 % | 15.37 % |
*
Investment results assume all distributions are reinvested and reflect applicable fees and expenses. When applicable, results reflect fee waivers and/or expense reimbursements, without which they would have been lower.†
Results assume all distributions are reinvested. Any market index shown is unmanaged, and therefore, has no expenses. Investors cannot invest directly in an index. Source(s): S&P Dow Jones Indices LLC.Key fund statistics
| Fund net assets (in millions) | $ 353,072 |
| Total number of portfolio holdings | 316 |
| Total advisory fees paid (in millions) | $ 848 |
| Portfolio turnover rate | 39 % |
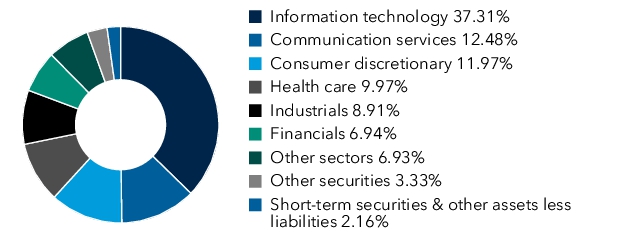
Portfolio holdings by sector (percent of net assets)
What were the fund costs for the last year? (based on a hypothetical $10,000 investment)
| Share class | Costs of a $10,000 investment | Costs paid as a percentage of a $10,000 investment |
| Class C | $143 | 1.34% |
Management's discussion of fund performance
The fund’s Class C shares gained 13.95% for the year ended August 31, 2026. That result compares with a 20.38% gain for the S&P 500 Index. For information on returns for additional periods, including the fund lifetime, please refer to capitalgroup.com/mutual-fund-returns-C.
What factors influenced results
U.S. equities posted strong gains during the fund’s fiscal year, driving the S&P 500 Index to record highs. Markets were supported by higher oil prices amid tensions in the Middle East and continued investment in artificial intelligence infrastructure. The U.S. economy remained resilient, underpinned by steady consumer spending, while signs of a moderating labor market prompted the Federal Reserve to implement three 25-basis-point rate cuts during the period.
Within the fund, most sectors contributed positively to returns, with information technology being particularly impactful. The healthcare, industrials and materials sectors also generated solid gains. Although it represented a relatively small portion of the portfolio, the energy sector delivered especially strong results and contributed meaningfully to fund returns.
In contrast, the financials and consumer discretionary sectors posted negative returns and weighed on overall fund results.
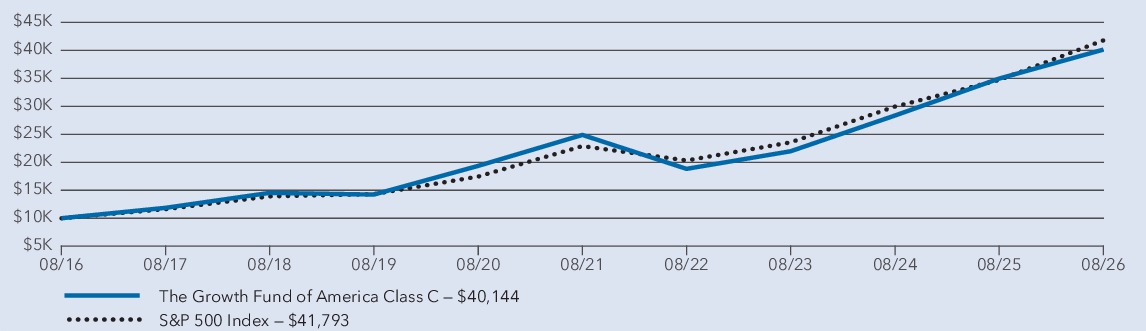
Average annual total returns
1 year | 5 years | 10 years | |
| The Growth Fund of America — Class C (with sales charge) * | 12.95 % | 9.70 % | 14.91 % |
| The Growth Fund of America — Class C (without sales charge) * | 13.95 % | 9.70 % | 14.91 % |
| S&P 500 Index † | 20.38 % | 12.79 % | 15.37 % |
*
Investment results assume all distributions are reinvested and reflect applicable fees and expenses. When applicable, results reflect fee waivers and/or expense reimbursements, without which they would have been lower.†
Results assume all distributions are reinvested. Any market index shown is unmanaged, and therefore, has no expenses. Investors cannot invest directly in an index. Source(s): S&P Dow Jones Indices LLC.Key fund statistics
| Fund net assets (in millions) | $ 353,072 |
| Total number of portfolio holdings | 316 |
| Total advisory fees paid (in millions) | $ 848 |
| Portfolio turnover rate | 39 % |
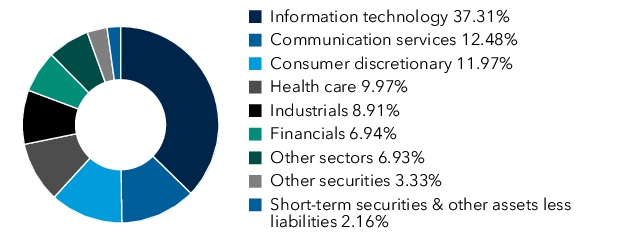
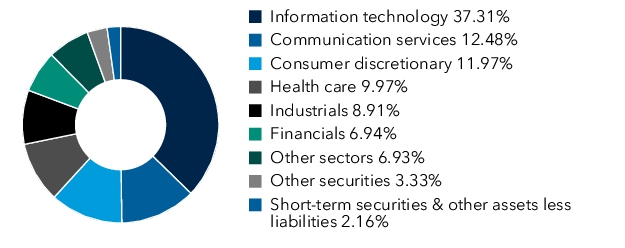
Portfolio holdings by sector
What were the fund costs for the last year? (based on a hypothetical $10,000 investment)
| Share class | Costs of a $10,000 investment | Costs paid as a percentage of a $10,000 investment |
| Class F-1 | $70 | 0.65% |
Management's discussion of fund performance
The fund’s Class F-1 shares gained 14.74% for the year ended August 31, 2026. That result compares with a 20.38% gain for the S&P 500 Index. For information on returns for additional periods, including the fund lifetime, please refer to capitalgroup.com/mutual-fund-returns-F1.
What factors influenced results
U.S. equities posted strong gains during the fund’s fiscal year, driving the S&P 500 Index to record highs. Markets were supported by higher oil prices amid tensions in the Middle East and continued investment in artificial intelligence infrastructure. The U.S. economy remained resilient, underpinned by steady consumer spending, while signs of a moderating labor market prompted the Federal Reserve to implement three 25-basis-point rate cuts during the period.
Within the fund, most sectors contributed positively to returns, with information technology being particularly impactful. The healthcare, industrials and materials sectors also generated solid gains. Although it represented a relatively small portion of the portfolio, the energy sector delivered especially strong results and contributed meaningfully to fund returns.
In contrast, the financials and consumer discretionary sectors posted negative returns and weighed on overall fund results.
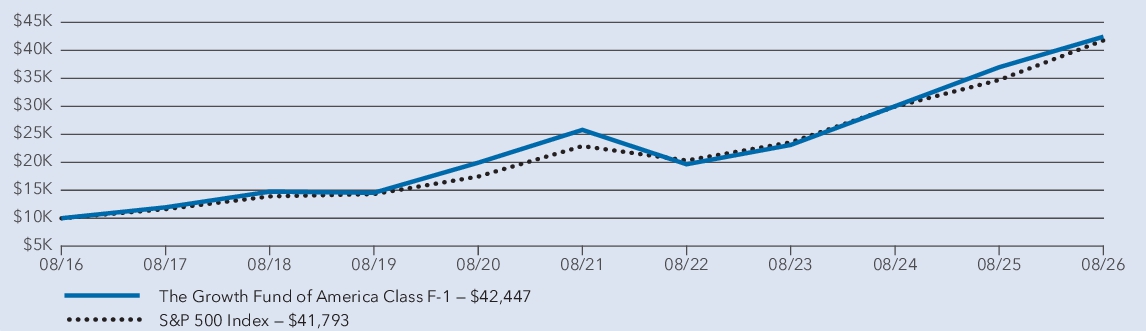
Average annual total returns
1 year | 5 years | 10 years | |
| The Growth Fund of America — Class F-1 * | 14.74 % | 10.48 % | 15.55 % |
| S&P 500 Index † | 20.38 % | 12.79 % | 15.37 % |
*
Investment results assume all distributions are reinvested and reflect applicable fees and expenses. When applicable, results reflect fee waivers and/or expense reimbursements, without which they would have been lower.†
Results assume all distributions are reinvested. Any market index shown is unmanaged, and therefore, has no expenses. Investors cannot invest directly in an index. Source(s): S&P Dow Jones Indices LLC.Key fund statistics
| Fund net assets (in millions) | $ 353,072 |
| Total number of portfolio holdings | 316 |
| Total advisory fees paid (in millions) | $ 848 |
| Portfolio turnover rate | 39 % |
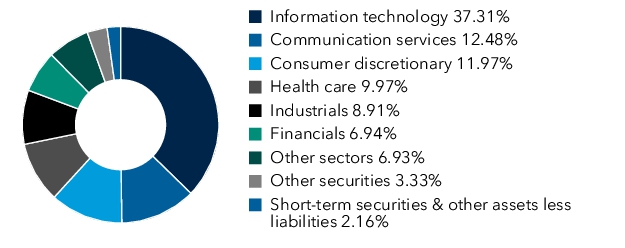
Portfolio holdings by sector (percent of net assets)
What were the fund costs for the last year? (based on a hypothetical $10,000 investment)
| Share class | Costs of a $10,000 investment | Costs paid as a percentage of a $10,000 investment |
| Class F-2 | $43 | 0.40% |
Management's discussion of fund performance
The fund’s Class F-2 shares gained 15.02% for the year ended August 31, 2026. That result compares with a 20.38% gain for the S&P 500 Index. For information on returns for additional periods, including the fund lifetime, please refer to capitalgroup.com/mutual-fund-returns-F2.
What factors influenced results
U.S. equities posted strong gains during the fund’s fiscal year, driving the S&P 500 Index to record highs. Markets were supported by higher oil prices amid tensions in the Middle East and continued investment in artificial intelligence infrastructure. The U.S. economy remained resilient, underpinned by steady consumer spending, while signs of a moderating labor market prompted the Federal Reserve to implement three 25-basis-point rate cuts during the period.
Within the fund, most sectors contributed positively to returns, with information technology being particularly impactful. The healthcare, industrials and materials sectors also generated solid gains. Although it represented a relatively small portion of the portfolio, the energy sector delivered especially strong results and contributed meaningfully to fund returns.
In contrast, the financials and consumer discretionary sectors posted negative returns and weighed on overall fund results.
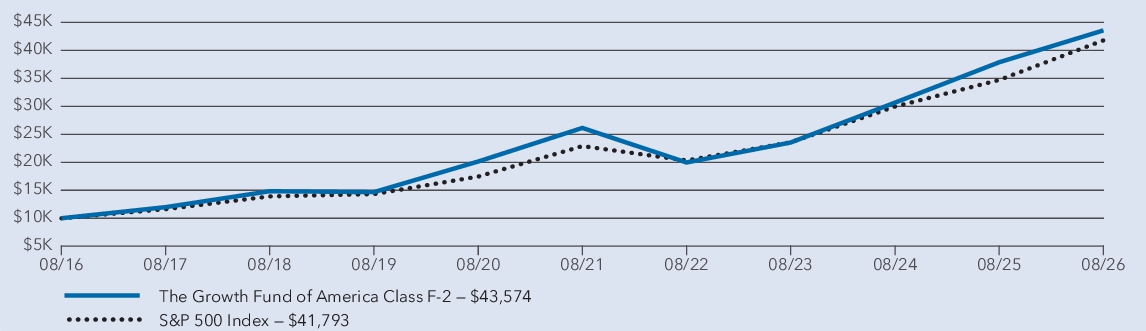
Average annual total returns
1 year | 5 years | 10 years | |
| The Growth Fund of America — Class F-2 * | 15.02 % | 10.76 % | 15.86 % |
| S&P 500 Index † | 20.38 % | 12.79 % | 15.37 % |
*
Investment results assume all distributions are reinvested and reflect applicable fees and expenses. When applicable, results reflect fee waivers and/or expense reimbursements, without which they would have been lower.†
Results assume all distributions are reinvested. Any market index shown is unmanaged, and therefore, has no expenses. Investors cannot invest directly in an index. Source(s): S&P Dow Jones Indices LLC.Key fund statistics
| Fund net assets (in millions) | $ 353,072 |
| Total number of portfolio holdings | 316 |
| Total advisory fees paid (in millions) | $ 848 |
| Portfolio turnover rate | 39 % |
Portfolio holdings by sector (percent of net assets)
What were the fund costs for the last year? (based on a hypothetical $10,000 investment)
| Share class | Costs of a $10,000 investment | Costs paid as a percentage of a $10,000 investment |
| Class F-3 | $31 | 0.29% |
Management's discussion of fund performance
The fund’s Class F-3 shares gained 15.15% for the year ended August 31, 2026. That result compares with a 20.38% gain for the S&P 500 Index. For information on returns for additional periods, including the fund lifetime, please refer to capitalgroup.com/mutual-fund-returns-F3.
What factors influenced results
U.S. equities posted strong gains during the fund’s fiscal year, driving the S&P 500 Index to record highs. Markets were supported by higher oil prices amid tensions in the Middle East and continued investment in artificial intelligence infrastructure. The U.S. economy remained resilient, underpinned by steady consumer spending, while signs of a moderating labor market prompted the Federal Reserve to implement three 25-basis-point rate cuts during the period.
Within the fund, most sectors contributed positively to returns, with information technology being particularly impactful. The healthcare, industrials and materials sectors also generated solid gains. Although it represented a relatively small portion of the portfolio, the energy sector delivered especially strong results and contributed meaningfully to fund returns.
In contrast, the financials and consumer discretionary sectors posted negative returns and weighed on overall fund results.
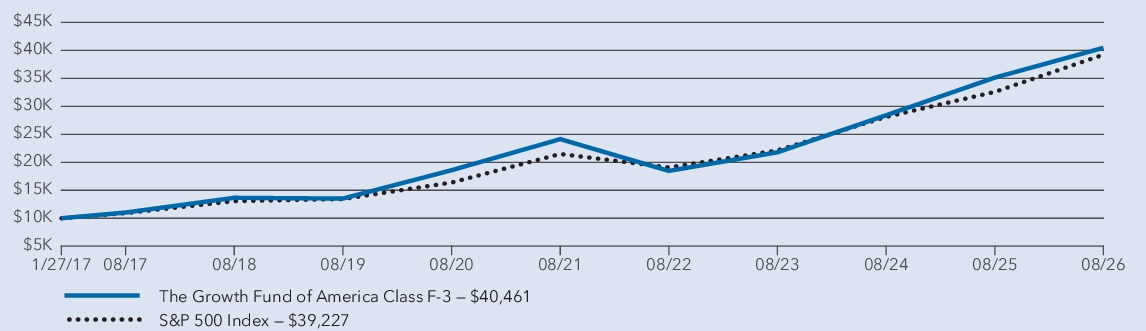
Average annual total returns
1 year | 5 years | Since inception 1 | |
| The Growth Fund of America — Class F-3 2 | 15.15 % | 10.88 % | 15.68 % |
| S&P 500 Index 3 | 20.38 % | 12.79 % | 15.31 % |
1
Class F-3 shares were first offered on January 27, 2017.2
Investment results assume all distributions are reinvested and reflect applicable fees and expenses. When applicable, results reflect fee waivers and/or expense reimbursements, without which they would have been lower.3
Results assume all distributions are reinvested. Any market index shown is unmanaged, and therefore, has no expenses. Investors cannot invest directly in an index. Source(s): S&P Dow Jones Indices LLC.Key fund statistics
| Fund net assets (in millions) | $ 353,072 |
| Total number of portfolio holdings | 316 |
| Total advisory fees paid (in millions) | $ 848 |
| Portfolio turnover rate | 39 % |
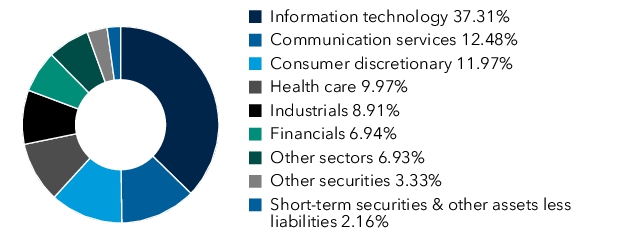
Portfolio holdings by sector (percent of net assets)
What were the fund costs for the last year? (based on a hypothetical $10,000 investment)
| Share class | Costs of a $10,000 investment | Costs paid as a percentage of a $10,000 investment |
| Class 529-A | $67 | 0.62% |
Management's discussion of fund performance
The fund’s Class 529-A shares gained 14.77% for the year ended August 31, 2026. That result compares with a 20.38% gain for the S&P 500 Index. For information on returns for additional periods, including the fund lifetime, please refer to capitalgroup.com/mutual-fund-returns-529A.
What factors influenced results
U.S. equities posted strong gains during the fund’s fiscal year, driving the S&P 500 Index to record highs. Markets were supported by higher oil prices amid tensions in the Middle East and continued investment in artificial intelligence infrastructure. The U.S. economy remained resilient, underpinned by steady consumer spending, while signs of a moderating labor market prompted the Federal Reserve to implement three 25-basis-point rate cuts during the period.
Within the fund, most sectors contributed positively to returns, with information technology being particularly impactful. The healthcare, industrials and materials sectors also generated solid gains. Although it represented a relatively small portion of the portfolio, the energy sector delivered especially strong results and contributed meaningfully to fund returns.
In contrast, the financials and consumer discretionary sectors posted negative returns and weighed on overall fund results.
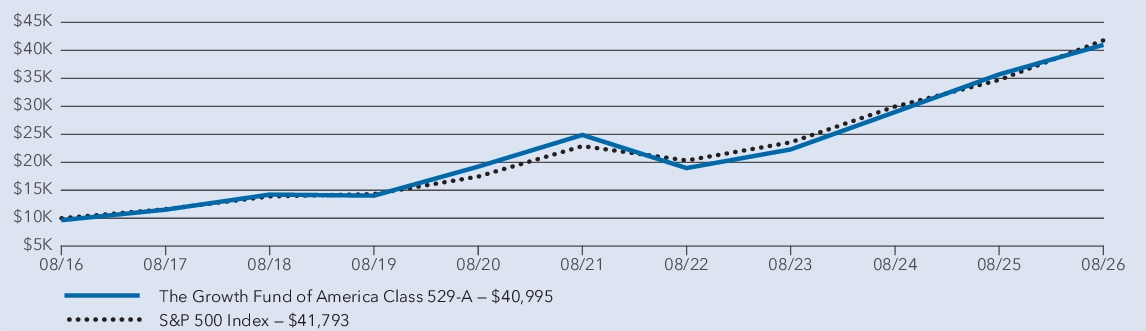
Average annual total returns
1 year | 5 years | 10 years | |
| The Growth Fund of America — Class 529-A (with sales charge) * | 10.75 % | 9.71 % | 15.15 % |
| The Growth Fund of America — Class 529-A (without sales charge) * | 14.77 % | 10.50 % | 15.56 % |
| S&P 500 Index † | 20.38 % | 12.79 % | 15.37 % |
*
Investment results assume all distributions are reinvested and reflect applicable fees and expenses. When applicable, results reflect fee waivers and/or expense reimbursements, without which they would have been lower.†
Results assume all distributions are reinvested. Any market index shown is unmanaged, and therefore, has no expenses. Investors cannot invest directly in an index. Source(s): S&P Dow Jones Indices LLC.Key fund statistics
| Fund net assets (in millions) | $ 353,072 |
| Total number of portfolio holdings | 316 |
| Total advisory fees paid (in millions) | $ 848 |
| Portfolio turnover rate | 39 % |
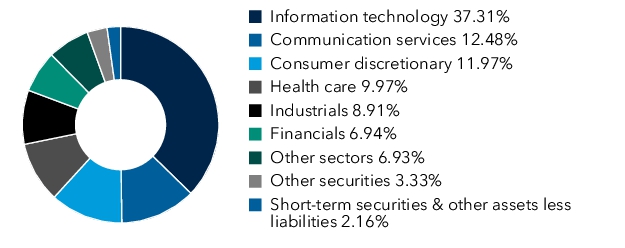
Portfolio holdings by sector (percent of net assets)
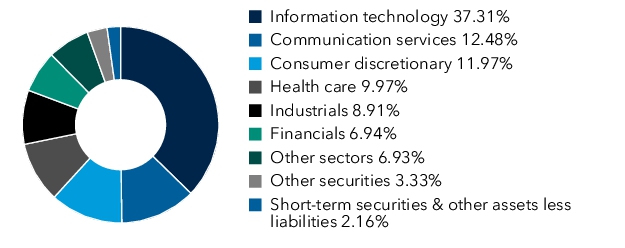
What were the fund costs for the last year? (based on a hypothetical $10,000 investment)
| Share class | Costs of a $10,000 investment | Costs paid as a percentage of a $10,000 investment |
| Class 529-C | $149 | 1.39% |
Management's discussion of fund performance
The fund’s Class 529-C shares gained 13.88% for the year ended August 31, 2026. That result compares with a 20.38% gain for the S&P 500 Index. For information on returns for additional periods, including the fund lifetime, please refer to capitalgroup.com/mutual-fund-returns-529C.
What factors influenced results
U.S. equities posted strong gains during the fund’s fiscal year, driving the S&P 500 Index to record highs. Markets were supported by higher oil prices amid tensions in the Middle East and continued investment in artificial intelligence infrastructure. The U.S. economy remained resilient, underpinned by steady consumer spending, while signs of a moderating labor market prompted the Federal Reserve to implement three 25-basis-point rate cuts during the period.
Within the fund, most sectors contributed positively to returns, with information technology being particularly impactful. The healthcare, industrials and materials sectors also generated solid gains. Although it represented a relatively small portion of the portfolio, the energy sector delivered especially strong results and contributed meaningfully to fund returns.
In contrast, the financials and consumer discretionary sectors posted negative returns and weighed on overall fund results.
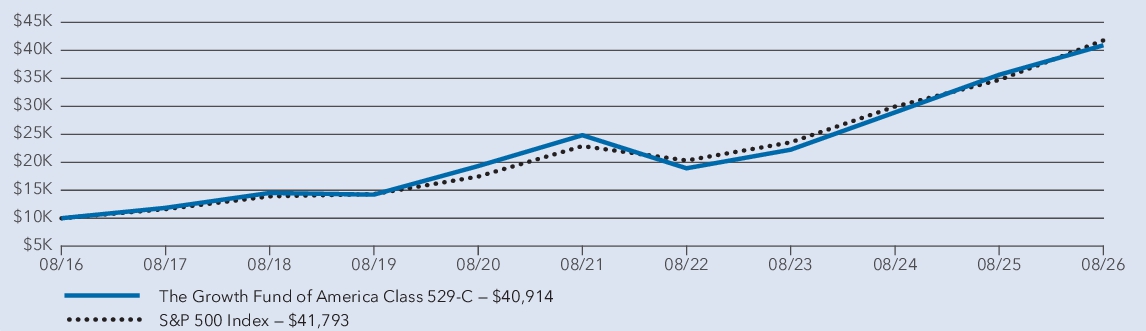
Average annual total returns
1 year | 5 years | 10 years | |
| The Growth Fund of America — Class 529-C (with sales charge) * | 12.88 % | 9.65 % | 15.13 % |
| The Growth Fund of America — Class 529-C (without sales charge) * | 13.88 % | 9.65 % | 15.13 % |
| S&P 500 Index † | 20.38 % | 12.79 % | 15.37 % |
*
Investment results assume all distributions are reinvested and reflect applicable fees and expenses. When applicable, results reflect fee waivers and/or expense reimbursements, without which they would have been lower.†
Results assume all distributions are reinvested. Any market index shown is unmanaged, and therefore, has no expenses. Investors cannot invest directly in an index. Source(s): S&P Dow Jones Indices LLC.Key fund statistics
| Fund net assets (in millions) | $ 353,072 |
| Total number of portfolio holdings | 316 |
| Total advisory fees paid (in millions) | $ 848 |
| Portfolio turnover rate | 39 % |
Portfolio holdings by sector (percent of net assets)
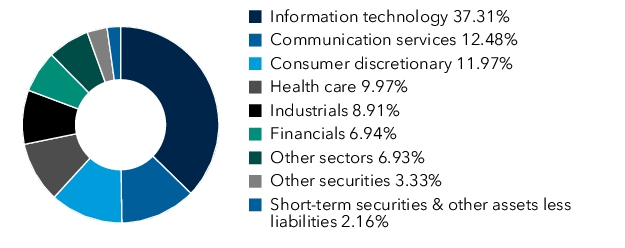
What were the fund costs for the last year? (based on a hypothetical $10,000 investment)
| Share class | Costs of a $10,000 investment | Costs paid as a percentage of a $10,000 investment |
| Class 529-E | $93 | 0.87% |
Management's discussion of fund performance
The fund’s Class 529-E shares gained 14.46% for the year ended August 31, 2026. That result compares with a 20.38% gain for the S&P 500 Index. For information on returns for additional periods, including the fund lifetime, please refer to capitalgroup.com/mutual-fund-returns-529E.
What factors influenced results
U.S. equities posted strong gains during the fund’s fiscal year, driving the S&P 500 Index to record highs. Markets were supported by higher oil prices amid tensions in the Middle East and continued investment in artificial intelligence infrastructure. The U.S. economy remained resilient, underpinned by steady consumer spending, while signs of a moderating labor market prompted the Federal Reserve to implement three 25-basis-point rate cuts during the period.
Within the fund, most sectors contributed positively to returns, with information technology being particularly impactful. The healthcare, industrials and materials sectors also generated solid gains. Although it represented a relatively small portion of the portfolio, the energy sector delivered especially strong results and contributed meaningfully to fund returns.
In contrast, the financials and consumer discretionary sectors posted negative returns and weighed on overall fund results.
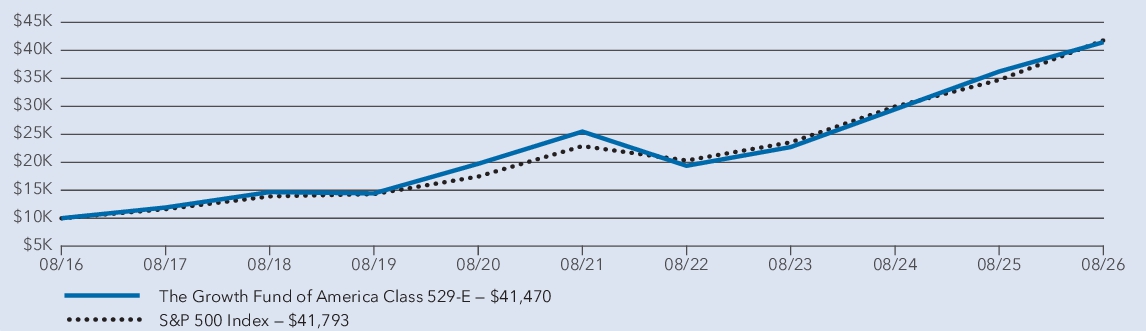
Average annual total returns
1 year | 5 years | 10 years | |
| The Growth Fund of America — Class 529-E * | 14.46 % | 10.22 % | 15.29 % |
| S&P 500 Index † | 20.38 % | 12.79 % | 15.37 % |
*
Investment results assume all distributions are reinvested and reflect applicable fees and expenses. When applicable, results reflect fee waivers and/or expense reimbursements, without which they would have been lower.†
Results assume all distributions are reinvested. Any market index shown is unmanaged, and therefore, has no expenses. Investors cannot invest directly in an index. Source(s): S&P Dow Jones Indices LLC.Key fund statistics
| Fund net assets (in millions) | $ 353,072 |
| Total number of portfolio holdings | 316 |
| Total advisory fees paid (in millions) | $ 848 |
| Portfolio turnover rate | 39 % |
Portfolio holdings by sector (percent of net assets)
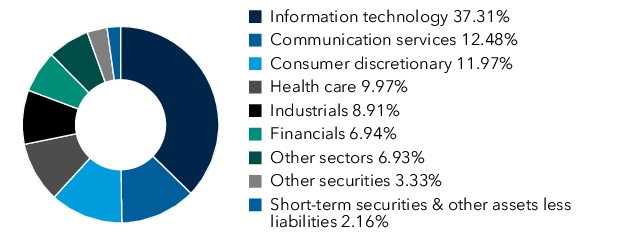
What were the fund costs for the last year? (based on a hypothetical $10,000 investment)
| Share class | Costs of a $10,000 investment | Costs paid as a percentage of a $10,000 investment |
| Class 529-F-2 | $41 | 0.38% |
Management's discussion of fund performance
The fund’s Class 529-F-2 shares gained 15.04% for the year ended August 31, 2026. That result compares with a 20.38% gain for the S&P 500 Index. For information on returns for additional periods, including the fund lifetime, please refer to capitalgroup.com/mutual-fund-returns-529F2.
What factors influenced results
U.S. equities posted strong gains during the fund’s fiscal year, driving the S&P 500 Index to record highs. Markets were supported by higher oil prices amid tensions in the Middle East and continued investment in artificial intelligence infrastructure. The U.S. economy remained resilient, underpinned by steady consumer spending, while signs of a moderating labor market prompted the Federal Reserve to implement three 25-basis-point rate cuts during the period.
Within the fund, most sectors contributed positively to returns, with information technology being particularly impactful. The healthcare, industrials and materials sectors also generated solid gains. Although it represented a relatively small portion of the portfolio, the energy sector delivered especially strong results and contributed meaningfully to fund returns.
In contrast, the financials and consumer discretionary sectors posted negative returns and weighed on overall fund results.
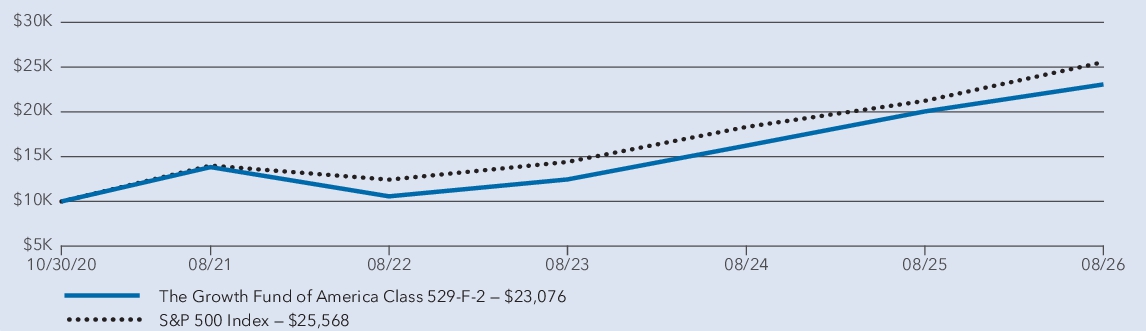
Average annual total returns
1 year | 5 years | Since inception 1 | |
| The Growth Fund of America — Class 529-F-2 2 | 15.04 % | 10.77 % | 15.40 % |
| S&P 500 Index 3 | 20.38 % | 12.79 % | 17.44 % |
1
Class 529-F-2 shares were first offered on October 30, 2020.2
Investment results assume all distributions are reinvested and reflect applicable fees and expenses. When applicable, results reflect fee waivers and/or expense reimbursements, without which they would have been lower.3
Results assume all distributions are reinvested. Any market index shown is unmanaged, and therefore, has no expenses. Investors cannot invest directly in an index. Source(s): S&P Dow Jones Indices LLC.Key fund statistics
| Fund net assets (in millions) | $ 353,072 |
| Total number of portfolio holdings | 316 |
| Total advisory fees paid (in millions) | $ 848 |
| Portfolio turnover rate | 39 % |
Portfolio holdings by sector (percent of net assets)
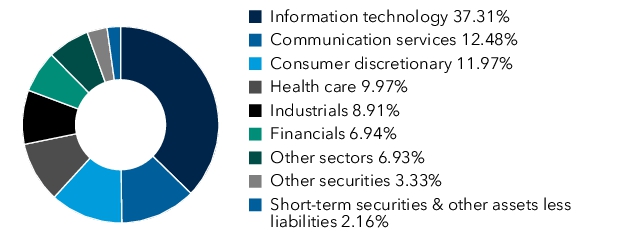
What were the fund costs for the last year? (based on a hypothetical $10,000 investment)
| Share class | Costs of a $10,000 investment | Costs paid as a percentage of a $10,000 investment |
| Class 529-F-3 | $37 | 0.34% |
Management's discussion of fund performance
The fund’s Class 529-F-3 shares gained 15.08% for the year ended August 31, 2026. That result compares with a 20.38% gain for the S&P 500 Index. For information on returns for additional periods, including the fund lifetime, please refer to capitalgroup.com/mutual-fund-returns-529F3.
What factors influenced results
U.S. equities posted strong gains during the fund’s fiscal year, driving the S&P 500 Index to record highs. Markets were supported by higher oil prices amid tensions in the Middle East and continued investment in artificial intelligence infrastructure. The U.S. economy remained resilient, underpinned by steady consumer spending, while signs of a moderating labor market prompted the Federal Reserve to implement three 25-basis-point rate cuts during the period.
Within the fund, most sectors contributed positively to returns, with information technology being particularly impactful. The healthcare, industrials and materials sectors also generated solid gains. Although it represented a relatively small portion of the portfolio, the energy sector delivered especially strong results and contributed meaningfully to fund returns.
In contrast, the financials and consumer discretionary sectors posted negative returns and weighed on overall fund results.
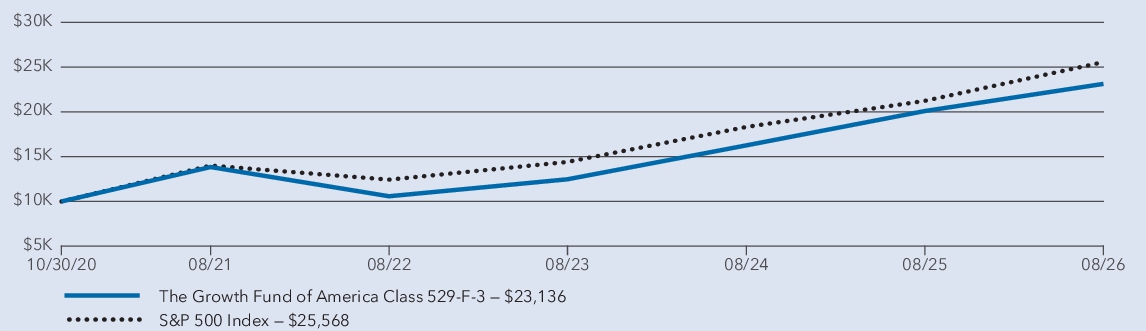
Average annual total returns
1 year | 5 years | Since inception 1 | |
| The Growth Fund of America — Class 529-F-3 2 | 15.08 % | 10.82 % | 15.45 % |
| S&P 500 Index 3 | 20.38 % | 12.79 % | 17.44 % |
1
Class 529-F-3 shares were first offered on October 30, 2020.2
Investment results assume all distributions are reinvested and reflect applicable fees and expenses. When applicable, results reflect fee waivers and/or expense reimbursements, without which they would have been lower.3
Results assume all distributions are reinvested. Any market index shown is unmanaged, and therefore, has no expenses. Investors cannot invest directly in an index. Source(s): S&P Dow Jones Indices LLC.Key fund statistics
| Fund net assets (in millions) | $ 353,072 |
| Total number of portfolio holdings | 316 |
| Total advisory fees paid (in millions) | $ 848 |
| Portfolio turnover rate | 39 % |
Portfolio holdings by sector (percent of net assets)
What were the fund costs for the last year? (based on a hypothetical $10,000 investment)
| Share class | Costs of a $10,000 investment | Costs paid as a percentage of a $10,000 investment |
| Class R-1 | $147 | 1.37% |
Management's discussion of fund performance
The fund’s Class R-1 shares gained 13.91% for the year ended August 31, 2026. That result compares with a 20.38% gain for the S&P 500 Index. For information on returns for additional periods, including the fund lifetime, please refer to capitalgroup.com/mutual-fund-returns-R1.
What factors influenced results
U.S. equities posted strong gains during the fund’s fiscal year, driving the S&P 500 Index to record highs. Markets were supported by higher oil prices amid tensions in the Middle East and continued investment in artificial intelligence infrastructure. The U.S. economy remained resilient, underpinned by steady consumer spending, while signs of a moderating labor market prompted the Federal Reserve to implement three 25-basis-point rate cuts during the period.
Within the fund, most sectors contributed positively to returns, with information technology being particularly impactful. The healthcare, industrials and materials sectors also generated solid gains. Although it represented a relatively small portion of the portfolio, the energy sector delivered especially strong results and contributed meaningfully to fund returns.
In contrast, the financials and consumer discretionary sectors posted negative returns and weighed on overall fund results.
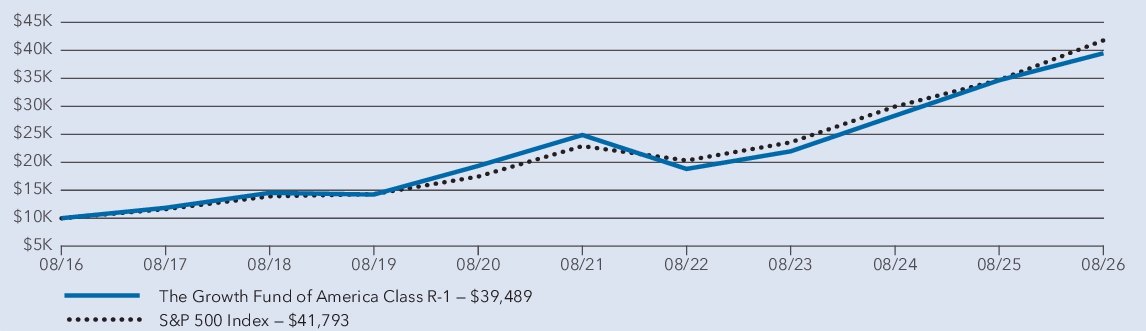
Average annual total returns
1 year | 5 years | 10 years | |
| The Growth Fund of America — Class R-1 * | 13.91 % | 9.68 % | 14.72 % |
| S&P 500 Index † | 20.38 % | 12.79 % | 15.37 % |
*
Investment results assume all distributions are reinvested and reflect applicable fees and expenses. When applicable, results reflect fee waivers and/or expense reimbursements, without which they would have been lower.†
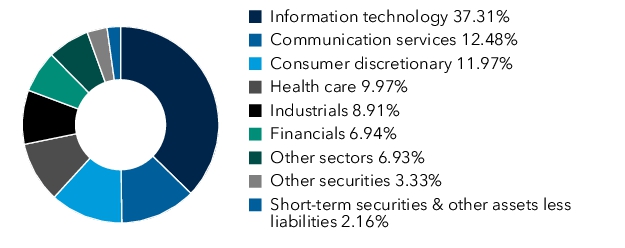
Results assume all distributions are reinvested. Any market index shown is unmanaged, and therefore, has no expenses. Investors cannot invest directly in an index. Source(s): S&P Dow Jones Indices LLC.Key fund statistics
| Fund net assets (in millions) | $ 353,072 |
| Total number of portfolio holdings | 316 |
| Total advisory fees paid (in millions) | $ 848 |
| Portfolio turnover rate | 39 % |
Portfolio holdings by sector (percent of net assets)
What were the fund costs for the last year? (based on a hypothetical $10,000 investment)
| Share class | Costs of a $10,000 investment | Costs paid as a percentage of a $10,000 investment |
| Class R-2 | $148 | 1.38% |
Management's discussion of fund performance
The fund’s Class R-2 shares gained 13.89% for the year ended August 31, 2026. That result compares with a 20.38% gain for the S&P 500 Index. For information on returns for additional periods, including the fund lifetime, please refer to capitalgroup.com/mutual-fund-returns-R2.
What factors influenced results
U.S. equities posted strong gains during the fund’s fiscal year, driving the S&P 500 Index to record highs. Markets were supported by higher oil prices amid tensions in the Middle East and continued investment in artificial intelligence infrastructure. The U.S. economy remained resilient, underpinned by steady consumer spending, while signs of a moderating labor market prompted the Federal Reserve to implement three 25-basis-point rate cuts during the period.
Within the fund, most sectors contributed positively to returns, with information technology being particularly impactful. The healthcare, industrials and materials sectors also generated solid gains. Although it represented a relatively small portion of the portfolio, the energy sector delivered especially strong results and contributed meaningfully to fund returns.
In contrast, the financials and consumer discretionary sectors posted negative returns and weighed on overall fund results.
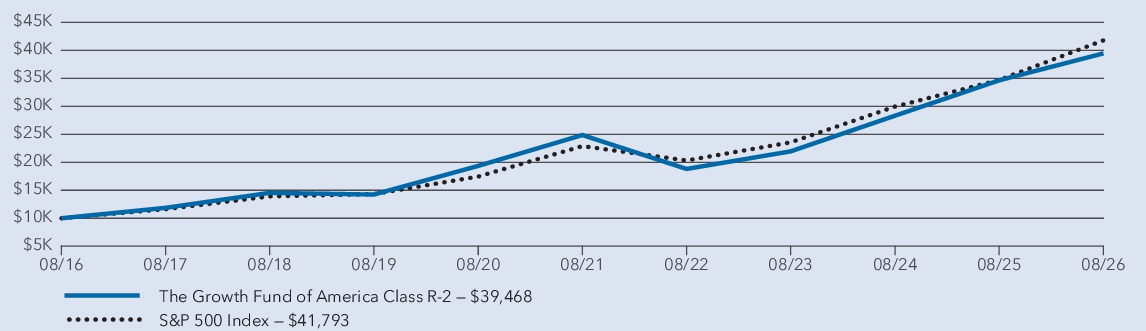
Average annual total returns
1 year | 5 years | 10 years | |
| The Growth Fund of America — Class R-2 * | 13.89 % | 9.67 % | 14.72 % |
| S&P 500 Index † | 20.38 % | 12.79 % | 15.37 % |
*
Investment results assume all distributions are reinvested and reflect applicable fees and expenses. When applicable, results reflect fee waivers and/or expense reimbursements, without which they would have been lower.†
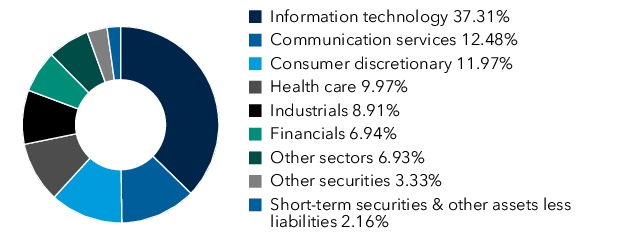
Results assume all distributions are reinvested. Any market index shown is unmanaged, and therefore, has no expenses. Investors cannot invest directly in an index. Source(s): S&P Dow Jones Indices LLC.Key fund statistics
| Fund net assets (in millions) | $ 353,072 |
| Total number of portfolio holdings | 316 |
| Total advisory fees paid (in millions) | $ 848 |
| Portfolio turnover rate | 39 % |
Portfolio holdings by sector (percent of net assets)
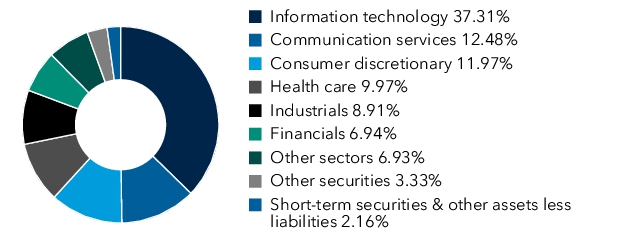
What were the fund costs for the last year? (based on a hypothetical $10,000 investment)
| Share class | Costs of a $10,000 investment | Costs paid as a percentage of a $10,000 investment |
| Class R-2E | $116 | 1.08% |
Management's discussion of fund performance
The fund’s Class R-2E shares gained 14.24% for the year ended August 31, 2026. That result compares with a 20.38% gain for the S&P 500 Index. For information on returns for additional periods, including the fund lifetime, please refer to capitalgroup.com/mutual-fund-returns-R2E.
What factors influenced results
U.S. equities posted strong gains during the fund’s fiscal year, driving the S&P 500 Index to record highs. Markets were supported by higher oil prices amid tensions in the Middle East and continued investment in artificial intelligence infrastructure. The U.S. economy remained resilient, underpinned by steady consumer spending, while signs of a moderating labor market prompted the Federal Reserve to implement three 25-basis-point rate cuts during the period.
Within the fund, most sectors contributed positively to returns, with information technology being particularly impactful. The healthcare, industrials and materials sectors also generated solid gains. Although it represented a relatively small portion of the portfolio, the energy sector delivered especially strong results and contributed meaningfully to fund returns.
In contrast, the financials and consumer discretionary sectors posted negative returns and weighed on overall fund results.
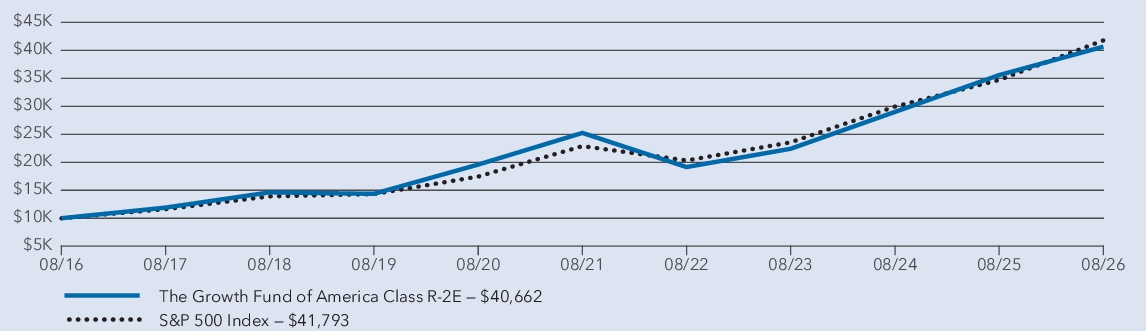
Average annual total returns
1 year | 5 years | 10 years | |
| The Growth Fund of America — Class R-2E * | 14.24 % | 10.00 % | 15.06 % |
| S&P 500 Index † | 20.38 % | 12.79 % | 15.37 % |
*
Investment results assume all distributions are reinvested and reflect applicable fees and expenses. When applicable, results reflect fee waivers and/or expense reimbursements, without which they would have been lower.†
Results assume all distributions are reinvested. Any market index shown is unmanaged, and therefore, has no expenses. Investors cannot invest directly in an index. Source(s): S&P Dow Jones Indices LLC.Key fund statistics
| Fund net assets (in millions) | $ 353,072 |
| Total number of portfolio holdings | 316 |
| Total advisory fees paid (in millions) | $ 848 |
| Portfolio turnover rate | 39 % |
Portfolio holdings by sector (percent of net assets)
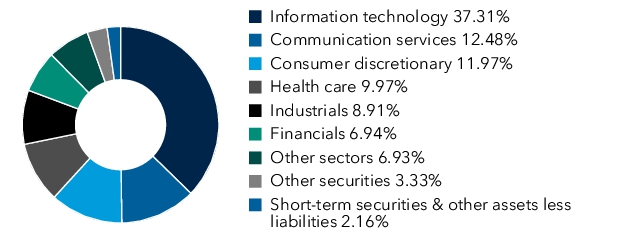
What were the fund costs for the last year? (based on a hypothetical $10,000 investment)
| Share class | Costs of a $10,000 investment | Costs paid as a percentage of a $10,000 investment |
| Class R-3 | $100 | 0.93% |
Management's discussion of fund performance
The fund’s Class R-3 shares gained 14.41% for the year ended August 31, 2026. That result compares with a 20.38% gain for the S&P 500 Index. For information on returns for additional periods, including the fund lifetime, please refer to capitalgroup.com/mutual-fund-returns-R3.
What factors influenced results
U.S. equities posted strong gains during the fund’s fiscal year, driving the S&P 500 Index to record highs. Markets were supported by higher oil prices amid tensions in the Middle East and continued investment in artificial intelligence infrastructure. The U.S. economy remained resilient, underpinned by steady consumer spending, while signs of a moderating labor market prompted the Federal Reserve to implement three 25-basis-point rate cuts during the period.
Within the fund, most sectors contributed positively to returns, with information technology being particularly impactful. The healthcare, industrials and materials sectors also generated solid gains. Although it represented a relatively small portion of the portfolio, the energy sector delivered especially strong results and contributed meaningfully to fund returns.
In contrast, the financials and consumer discretionary sectors posted negative returns and weighed on overall fund results.
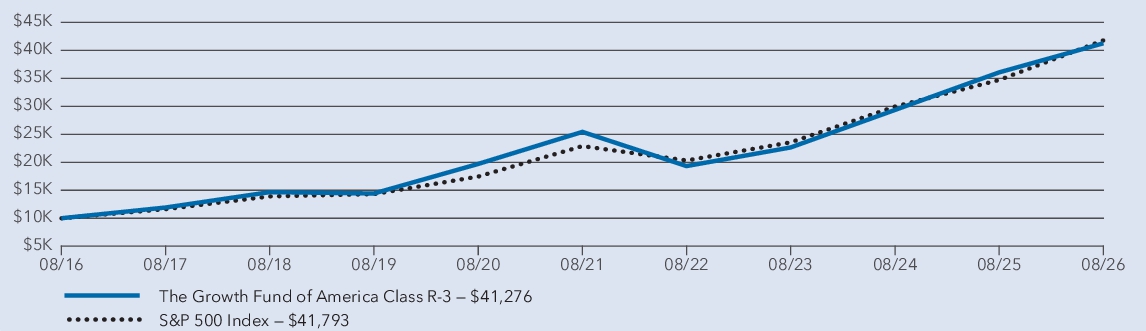
Average annual total returns
1 year | 5 years | 10 years | |
| The Growth Fund of America — Class R-3 * | 14.41 % | 10.17 % | 15.23 % |
| S&P 500 Index † | 20.38 % | 12.79 % | 15.37 % |
*
Investment results assume all distributions are reinvested and reflect applicable fees and expenses. When applicable, results reflect fee waivers and/or expense reimbursements, without which they would have been lower.†
Results assume all distributions are reinvested. Any market index shown is unmanaged, and therefore, has no expenses. Investors cannot invest directly in an index. Source(s): S&P Dow Jones Indices LLC.Key fund statistics
| Fund net assets (in millions) | $ 353,072 |
| Total number of portfolio holdings | 316 |
| Total advisory fees paid (in millions) | $ 848 |
| Portfolio turnover rate | 39 % |
Portfolio holdings by sector (percent of net assets)
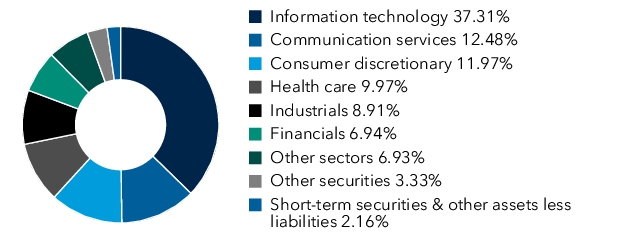
What were the fund costs for the last year? (based on a hypothetical $10,000 investment)
| Share class | Costs of a $10,000 investment | Costs paid as a percentage of a $10,000 investment |
| Class R-4 | $68 | 0.63% |
Management's discussion of fund performance
The fund’s Class R-4 shares gained 14.75% for the year ended August 31, 2026. That result compares with a 20.38% gain for the S&P 500 Index. For information on returns for additional periods, including the fund lifetime, please refer to capitalgroup.com/mutual-fund-returns-R4.
What factors influenced results
U.S. equities posted strong gains during the fund’s fiscal year, driving the S&P 500 Index to record highs. Markets were supported by higher oil prices amid tensions in the Middle East and continued investment in artificial intelligence infrastructure. The U.S. economy remained resilient, underpinned by steady consumer spending, while signs of a moderating labor market prompted the Federal Reserve to implement three 25-basis-point rate cuts during the period.
Within the fund, most sectors contributed positively to returns, with information technology being particularly impactful. The healthcare, industrials and materials sectors also generated solid gains. Although it represented a relatively small portion of the portfolio, the energy sector delivered especially strong results and contributed meaningfully to fund returns.
In contrast, the financials and consumer discretionary sectors posted negative returns and weighed on overall fund results.
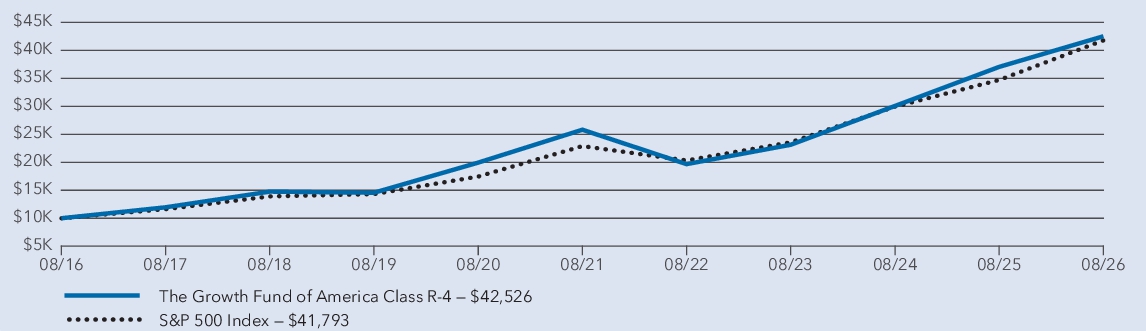
Average annual total returns
1 year | 5 years | 10 years | |
| The Growth Fund of America — Class R-4 * | 14.75 % | 10.49 % | 15.58 % |
| S&P 500 Index † | 20.38 % | 12.79 % | 15.37 % |
*
Investment results assume all distributions are reinvested and reflect applicable fees and expenses. When applicable, results reflect fee waivers and/or expense reimbursements, without which they would have been lower.†
Results assume all distributions are reinvested. Any market index shown is unmanaged, and therefore, has no expenses. Investors cannot invest directly in an index. Source(s): S&P Dow Jones Indices LLC.Key fund statistics
| Fund net assets (in millions) | $ 353,072 |
| Total number of portfolio holdings | 316 |
| Total advisory fees paid (in millions) | $ 848 |
| Portfolio turnover rate | 39 % |
Portfolio holdings by sector (percent of net assets)
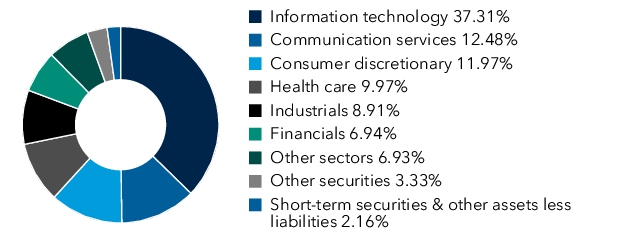
What were the fund costs for the last year? (based on a hypothetical $10,000 investment)
| Share class | Costs of a $10,000 investment | Costs paid as a percentage of a $10,000 investment |
| Class R-5E | $46 | 0.43% |
Management's discussion of fund performance
The fund’s Class R-5E shares gained 14.97% for the year ended August 31, 2026. That result compares with a 20.38% gain for the S&P 500 Index. For information on returns for additional periods, including the fund lifetime, please refer to capitalgroup.com/mutual-fund-returns-R5E.
What factors influenced results
U.S. equities posted strong gains during the fund’s fiscal year, driving the S&P 500 Index to record highs. Markets were supported by higher oil prices amid tensions in the Middle East and continued investment in artificial intelligence infrastructure. The U.S. economy remained resilient, underpinned by steady consumer spending, while signs of a moderating labor market prompted the Federal Reserve to implement three 25-basis-point rate cuts during the period.
Within the fund, most sectors contributed positively to returns, with information technology being particularly impactful. The healthcare, industrials and materials sectors also generated solid gains. Although it represented a relatively small portion of the portfolio, the energy sector delivered especially strong results and contributed meaningfully to fund returns.
In contrast, the financials and consumer discretionary sectors posted negative returns and weighed on overall fund results.
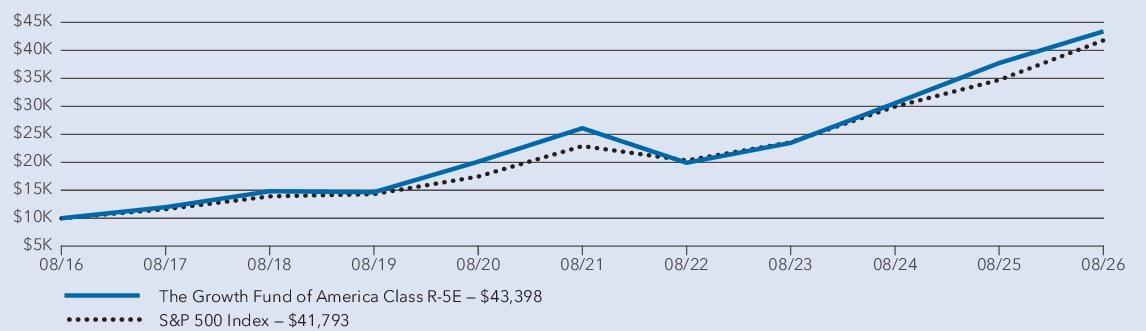
Average annual total returns
1 year | 5 years | 10 years | |
| The Growth Fund of America — Class R-5E * | 14.97 % | 10.71 % | 15.81 % |
| S&P 500 Index † | 20.38 % | 12.79 % | 15.37 % |
*
Investment results assume all distributions are reinvested and reflect applicable fees and expenses. When applicable, results reflect fee waivers and/or expense reimbursements, without which they would have been lower.†
Results assume all distributions are reinvested. Any market index shown is unmanaged, and therefore, has no expenses. Investors cannot invest directly in an index. Source(s): S&P Dow Jones Indices LLC.Key fund statistics
| Fund net assets (in millions) | $ 353,072 |
| Total number of portfolio holdings | 316 |
| Total advisory fees paid (in millions) | $ 848 |
| Portfolio turnover rate | 39 % |
Portfolio holdings by sector (percent of net assets)
What were the fund costs for the last year? (based on a hypothetical $10,000 investment)
| Share class | Costs of a $10,000 investment | Costs paid as a percentage of a $10,000 investment |
| Class R-5 | $37 | 0.34% |
Management's discussion of fund performance
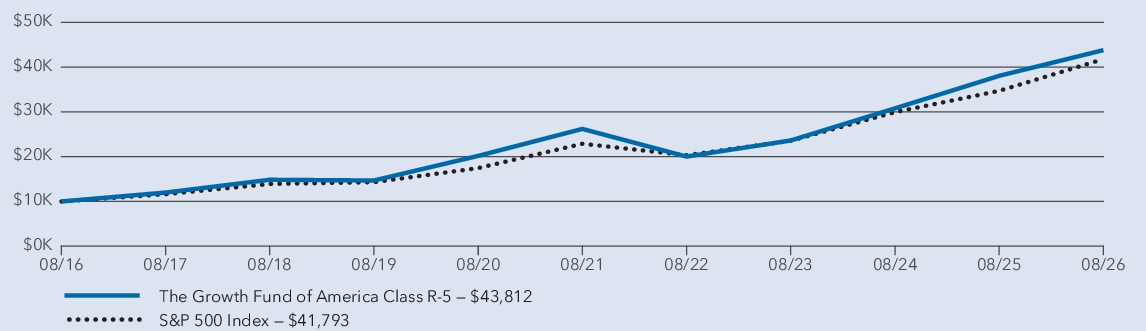
The fund’s Class R-5 shares gained 15.08% for the year ended August 31, 2026. That result compares with a 20.38% gain for the S&P 500 Index. For information on returns for additional periods, including the fund lifetime, please refer to capitalgroup.com/mutual-fund-returns-R5.
What factors influenced results
U.S. equities posted strong gains during the fund’s fiscal year, driving the S&P 500 Index to record highs. Markets were supported by higher oil prices amid tensions in the Middle East and continued investment in artificial intelligence infrastructure. The U.S. economy remained resilient, underpinned by steady consumer spending, while signs of a moderating labor market prompted the Federal Reserve to implement three 25-basis-point rate cuts during the period.
Within the fund, most sectors contributed positively to returns, with information technology being particularly impactful. The healthcare, industrials and materials sectors also generated solid gains. Although it represented a relatively small portion of the portfolio, the energy sector delivered especially strong results and contributed meaningfully to fund returns.
In contrast, the financials and consumer discretionary sectors posted negative returns and weighed on overall fund results.
Average annual total returns
1 year | 5 years | 10 years | |
| The Growth Fund of America — Class R-5 * | 15.08 % | 10.82 % | 15.92 % |
| S&P 500 Index † | 20.38 % | 12.79 % | 15.37 % |
*
Investment results assume all distributions are reinvested and reflect applicable fees and expenses. When applicable, results reflect fee waivers and/or expense reimbursements, without which they would have been lower.†
Results assume all distributions are reinvested. Any market index shown is unmanaged, and therefore, has no expenses. Investors cannot invest directly in an index. Source(s): S&P Dow Jones Indices LLC.Key fund statistics
| Fund net assets (in millions) | $ 353,072 |
| Total number of portfolio holdings | 316 |
| Total advisory fees paid (in millions) | $ 848 |
| Portfolio turnover rate | 39 % |
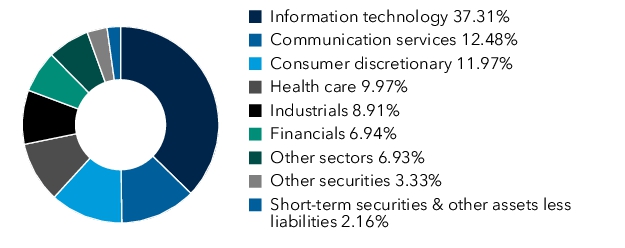
Portfolio holdings by sector (percent of net assets)
What were the fund costs for the last year? (based on a hypothetical $10,000 investment)
Share class | Costs of a $10,000 investment | Costs paid as a percentage of a $10,000 investment |
| Class R-6 | $ 31 | 0.29 % |
Management's discussion of fund performance
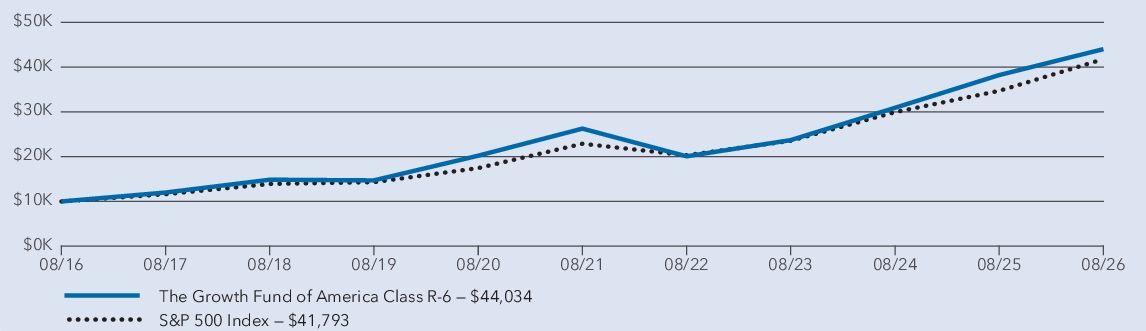
The fund’s Class R-6 shares gained 15.13% for the year ended August 31, 2026. That result compares with a 20.38% gain for the S&P 500 Index. For information on returns for additional periods, including the fund lifetime, please refer to capitalgroup.com/mutual-fund-returns-R6.
What factors influenced results
U.S. equities posted strong gains during the fund’s fiscal year, driving the S&P 500 Index to record highs. Markets were supported by higher oil prices amid tensions in the Middle East and continued investment in artificial intelligence infrastructure. The U.S. economy remained resilient, underpinned by steady consumer spending, while signs of a moderating labor market prompted the Federal Reserve to implement three 25-basis-point rate cuts during the period.
Within the fund, most sectors contributed positively to returns, with information technology being particularly impactful. The healthcare, industrials and materials sectors also generated solid gains. Although it represented a relatively small portion of the portfolio, the energy sector delivered especially strong results and contributed meaningfully to fund returns.
In contrast, the financials and consumer discretionary sectors posted negative returns and weighed on overall fund results.
Average annual total returns
1 year | 5 years | 10 years | |
| The Growth Fund of America — Class R-6 * | 15.13 % | 10.88 % | 15.98 % |
| S&P 500 Index † | 20.38 % | 12.79 % | 15.37 % |
*
Investment results assume all distributions are reinvested and reflect applicable fees and expenses. When applicable, results reflect fee waivers and/or expense reimbursements, without which they would have been lower.†
Results assume all distributions are reinvested. Any market index shown is unmanaged, and therefore, has no expenses. Investors cannot invest directly in an index. Source(s): S&P Dow Jones Indices LLC.Key fund statistics
| Fund net assets (in millions) | $ 353,072 |
| Total number of portfolio holdings | 316 |
| Total advisory fees paid (in millions) | $ 848 |
| Portfolio turnover rate | 39 % |
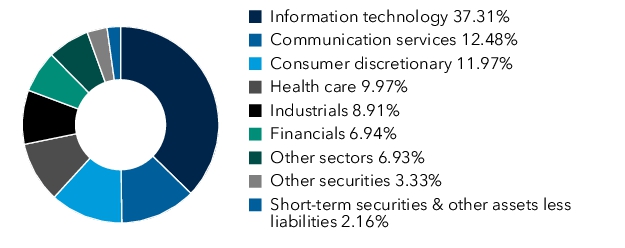
Portfolio holdings by sector (percent of net assets)