
Supplemental Financial Information 3Q 2026
2 R 41 G 41 B 41 R 255 G 255 B 255 R 207 G 182 B 103 R 163 G 131 B 56 R 31 G 73 B 125 R 144 G 124 B 75 R 79 G 129 B 189 R 235 G 235 B 237 R 128 G 100 B 162 R 199 G 198 B 215 This presentation includes “forward-looking statements” within the meaning of Section 27A of the Securities Act of 1933, as amended, and Section 21E of the Securities Exchange Act of 1934, as amended. Statements preceded by, followed by or that otherwise include the words "believes," "expects," "anticipates," "intends," "projects," "estimates," "plans," "may increase," "may fluctuate," and similar expressions or future or conditional verbs such as "will," "should," "would," "may" and "could" are generally forward-looking in nature and not historical facts. Such forward-looking statements are inherently subject to risks, uncertainties and assumptions, including the following: • our partners' ability to successfully complete construction of various casino projects currently under development for which we have agreed to provide construction development funding, including Bally’s Chicago, and the ability and willingness of our partners to obtain timely the requisite regulatory approvals and meet and/or perform their respective obligations under the applicable construction financing and/or development documents; • the impact that United States ("U.S.") government, economic, monetary or trade policies and stimulus packages could have on inflation rates, interest rates, economic growth and discretionary consumer spending, including the casino operations of our tenants; • geopolitical events, including recent conflicts in the Middle East, and their potential impact on U.S. Treasury yields and inflation rates; • the ability of our tenants to comply with laws, rules and regulations in the operation of our properties, to deliver high quality services, to attract and retain qualified personnel, to attract customers and to maintain the financial strength and liquidity necessary to satisfy their respective obligations and liabilities to us and third parties; • the availability of and the ability to identify and consummate suitable and attractive acquisition and development opportunities on favorable terms; • the degree and nature of our competition; • the impact of weather or climate events or conditions, natural disasters, acts of terrorism and other international hostilities, war, political instability or a new pandemic or similar national health crisis on the ability or desire of people to gather in large groups (including in casinos), which could impact our financial results, prospects, liquidity, and stock price; • the ability of our tenants and borrowers to meet or perform their obligations under their leases and financing arrangements with us; • our ability to generate sufficient cash flows to service and comply with financial covenants under our outstanding indebtedness and maintain or improve our credit ratings, and our ability to access capital through debt and equity markets in amounts and at rates and costs acceptable to GLPI; • with respect to our tenant funding commitments, the amounts drawn and the timing of these draws may be different than what the Company assumed; • the availability of qualified personnel and our ability to retain our key management personnel; • changes in accounting standards or the U.S. tax law and other federal, state or local laws, whether or not specific to real estate, REITs or the gaming, lodging or hospitality industries and our ability to meet the applicable asset, income, organizational, distribution, shareholder ownership and other requirements to maintain the Company’s REIT status; • other risks inherent in the real estate business, including potential liability relating to environmental matters and illiquidity of real estate investments; and • other factors described in GLPI’s Annual Report on Form 10-K for the year ended December 31, 2025, Quarterly Reports on Form 10-Q and Current Reports on Form 8-K, each as filed with the SEC. Other unknown or unpredictable factors may also cause actual results to differ materially from those projected by the forward-looking statements. Most of these factors are difficult to anticipate and are generally beyond the Company’s control. Given these uncertainties, you should not place undue reliance on these forward-looking statements. You should consider the areas of risk described above in connection with considering any forward-looking statements that may be made by the Company generally and any forward-looking statements that are contained in this presentation specifically. The Company undertakes no obligation to release publicly any revisions to any forward-looking statements, to report events or to report the occurrence of unanticipated events unless required to do so by law. Forward Looking Statements
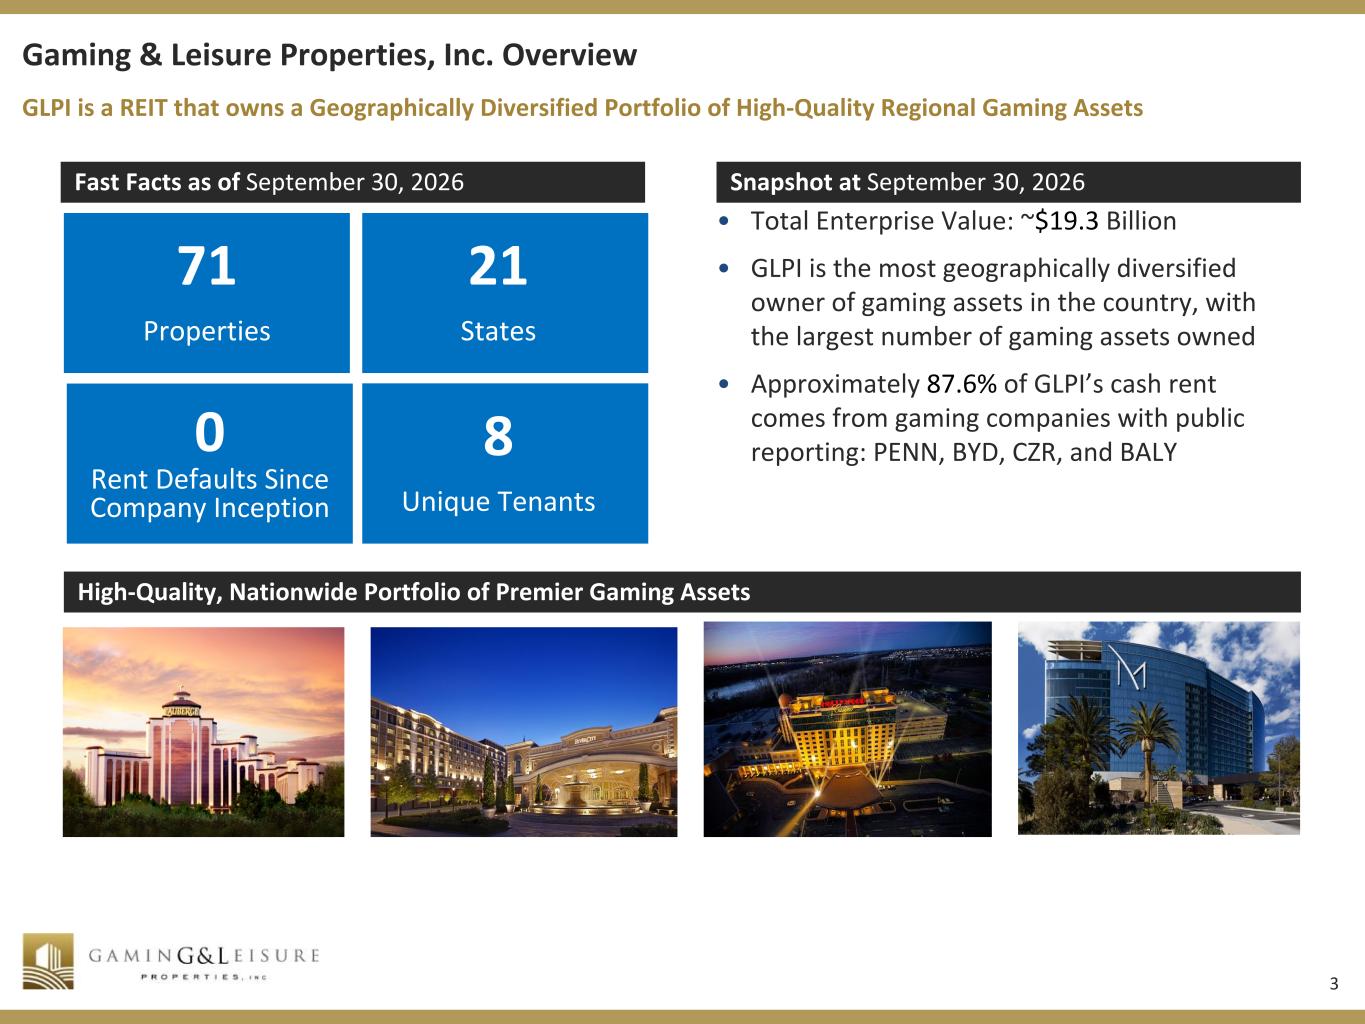
3 R 41 G 41 B 41 R 255 G 255 B 255 R 207 G 182 B 103 R 163 G 131 B 56 R 31 G 73 B 125 R 144 G 124 B 75 R 79 G 129 B 189 R 235 G 235 B 237 R 128 G 100 B 162 R 199 G 198 B 215 Gaming & Leisure Properties, Inc. Overview Fast Facts as of September 30, 2026 Snapshot at September 30, 2026 71 Properties 21 States • Total Enterprise Value: ~$19.3 Billion • GLPI is the most geographically diversified owner of gaming assets in the country, with the largest number of gaming assets owned • Approximately 87.6% of GLPI’s cash rent comes from gaming companies with public reporting: PENN, BYD, CZR, and BALY High-Quality, Nationwide Portfolio of Premier Gaming Assets GLPI is a REIT that owns a Geographically Diversified Portfolio of High-Quality Regional Gaming Assets 0 Rent Defaults Since Company Inception 8 Unique Tenants
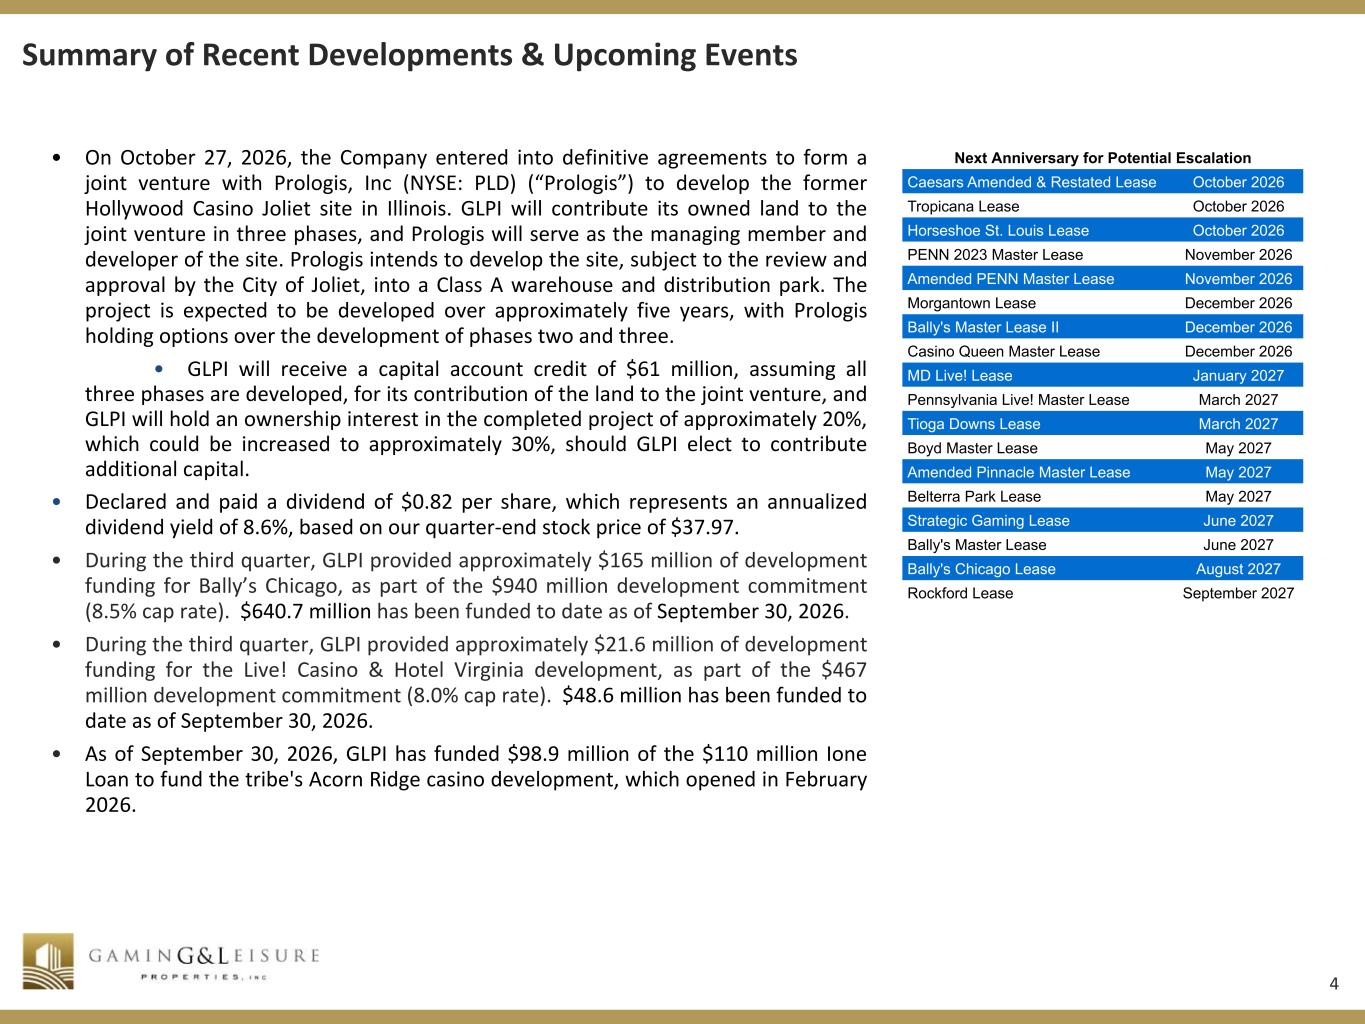
4 R 41 G 41 B 41 R 255 G 255 B 255 R 207 G 182 B 103 R 163 G 131 B 56 R 31 G 73 B 125 R 144 G 124 B 75 R 79 G 129 B 189 R 235 G 235 B 237 R 128 G 100 B 162 R 199 G 198 B 215 Summary of Recent Developments & Upcoming Events • On October 27, 2026, the Company entered into definitive agreements to form a joint venture with Prologis, Inc (NYSE: PLD) (“Prologis”) to develop the former Hollywood Casino Joliet site in Illinois. GLPI will contribute its owned land to the joint venture in three phases, and Prologis will serve as the managing member and developer of the site. Prologis intends to develop the site, subject to the review and approval by the City of Joliet, into a Class A warehouse and distribution park. The project is expected to be developed over approximately five years, with Prologis holding options over the development of phases two and three. • GLPI will receive a capital account credit of $61 million, assuming all three phases are developed, for its contribution of the land to the joint venture, and GLPI will hold an ownership interest in the completed project of approximately 20%, which could be increased to approximately 30%, should GLPI elect to contribute additional capital. • Declared and paid a dividend of $0.82 per share, which represents an annualized dividend yield of 8.6%, based on our quarter-end stock price of $37.97. • During the third quarter, GLPI provided approximately $165 million of development funding for Bally’s Chicago, as part of the $940 million development commitment (8.5% cap rate). $640.7 million has been funded to date as of September 30, 2026. • During the third quarter, GLPI provided approximately $21.6 million of development funding for the Live! Casino & Hotel Virginia development, as part of the $467 million development commitment (8.0% cap rate). $48.6 million has been funded to date as of September 30, 2026. • As of September 30, 2026, GLPI has funded $98.9 million of the $110 million Ione Loan to fund the tribe's Acorn Ridge casino development, which opened in February 2026. Next Anniversary for Potential Escalation Caesars Amended & Restated Lease October 2026 Tropicana Lease October 2026 Horseshoe St. Louis Lease October 2026 PENN 2023 Master Lease November 2026 Amended PENN Master Lease November 2026 Morgantown Lease December 2026 Bally's Master Lease II December 2026 Casino Queen Master Lease December 2026 MD Live! Lease January 2027 Pennsylvania Live! Master Lease March 2027 Tioga Downs Lease March 2027 Boyd Master Lease May 2027 Amended Pinnacle Master Lease May 2027 Belterra Park Lease May 2027 Strategic Gaming Lease June 2027 Bally's Master Lease June 2027 Bally's Chicago Lease August 2027 Rockford Lease September 2027
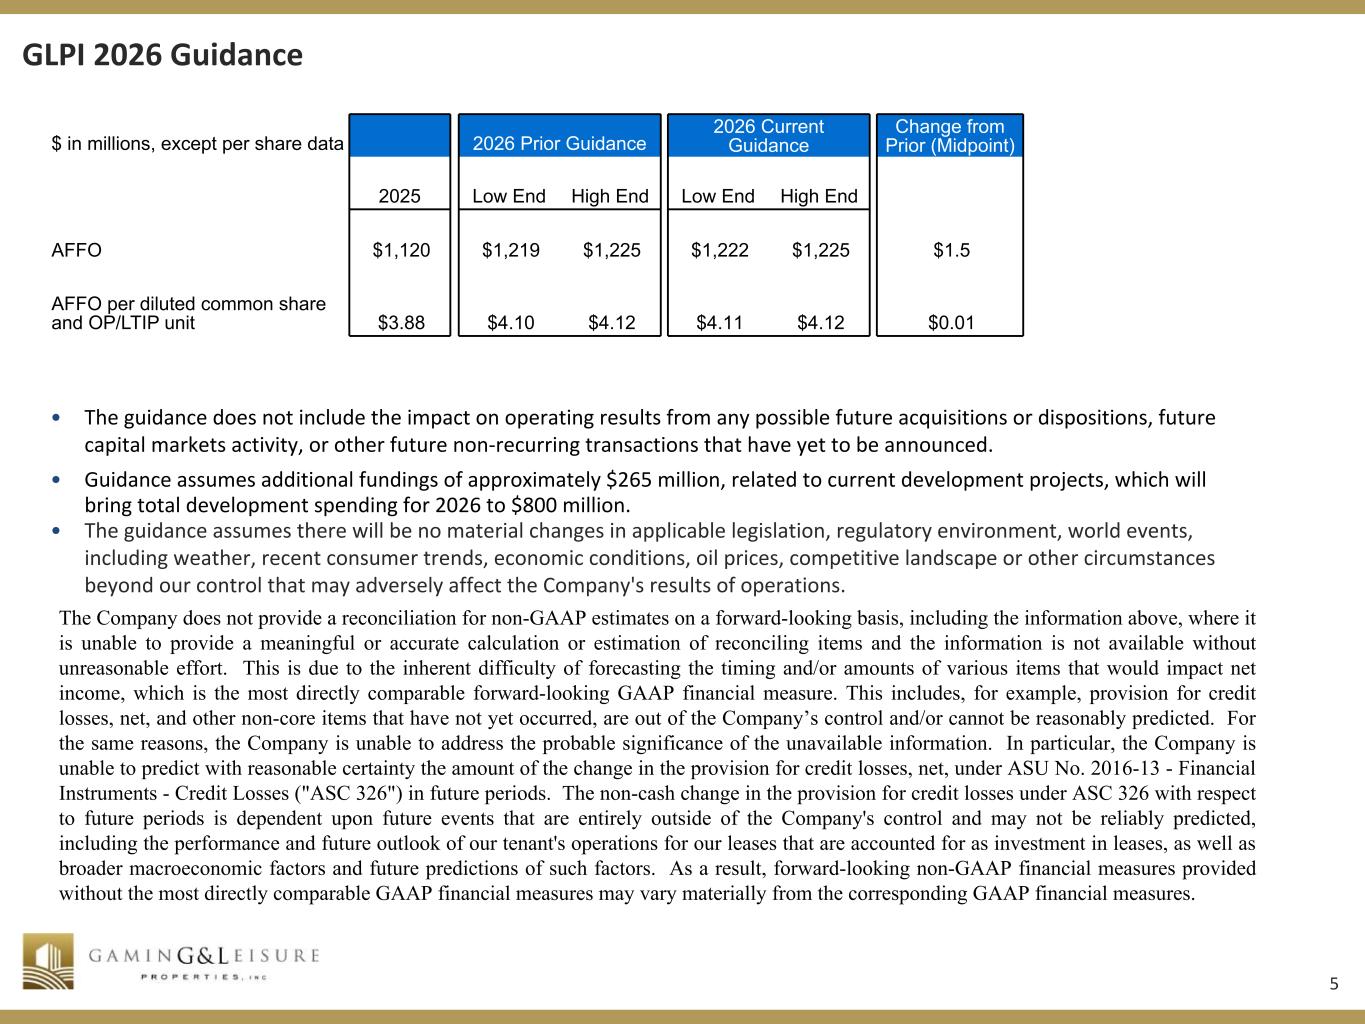
5 R 41 G 41 B 41 R 255 G 255 B 255 R 207 G 182 B 103 R 163 G 131 B 56 R 31 G 73 B 125 R 144 G 124 B 75 R 79 G 129 B 189 R 235 G 235 B 237 R 128 G 100 B 162 R 199 G 198 B 215 GLPI 2026 Guidance • The guidance does not include the impact on operating results from any possible future acquisitions or dispositions, future capital markets activity, or other future non-recurring transactions that have yet to be announced. • Guidance assumes additional fundings of approximately $265 million, related to current development projects, which will bring total development spending for 2026 to $800 million. • The guidance assumes there will be no material changes in applicable legislation, regulatory environment, world events, including weather, recent consumer trends, economic conditions, oil prices, competitive landscape or other circumstances beyond our control that may adversely affect the Company's results of operations. The Company does not provide a reconciliation for non-GAAP estimates on a forward-looking basis, including the information above, where it is unable to provide a meaningful or accurate calculation or estimation of reconciling items and the information is not available without unreasonable effort. This is due to the inherent difficulty of forecasting the timing and/or amounts of various items that would impact net income, which is the most directly comparable forward-looking GAAP financial measure. This includes, for example, provision for credit losses, net, and other non-core items that have not yet occurred, are out of the Company’s control and/or cannot be reasonably predicted. For the same reasons, the Company is unable to address the probable significance of the unavailable information. In particular, the Company is unable to predict with reasonable certainty the amount of the change in the provision for credit losses, net, under ASU No. 2016-13 - Financial Instruments - Credit Losses ("ASC 326") in future periods. The non-cash change in the provision for credit losses under ASC 326 with respect to future periods is dependent upon future events that are entirely outside of the Company's control and may not be reliably predicted, including the performance and future outlook of our tenant's operations for our leases that are accounted for as investment in leases, as well as broader macroeconomic factors and future predictions of such factors. As a result, forward-looking non-GAAP financial measures provided without the most directly comparable GAAP financial measures may vary materially from the corresponding GAAP financial measures. $ in millions, except per share data 2026 Prior Guidance 2026 Current Guidance Change from Prior (Midpoint) 2025 Low End High End Low End High End AFFO $1,120 $1,219 $1,225 $1,222 $1,225 $1.5 AFFO per diluted common share and OP/LTIP unit $3.88 $4.10 $4.12 $4.11 $4.12 $0.01
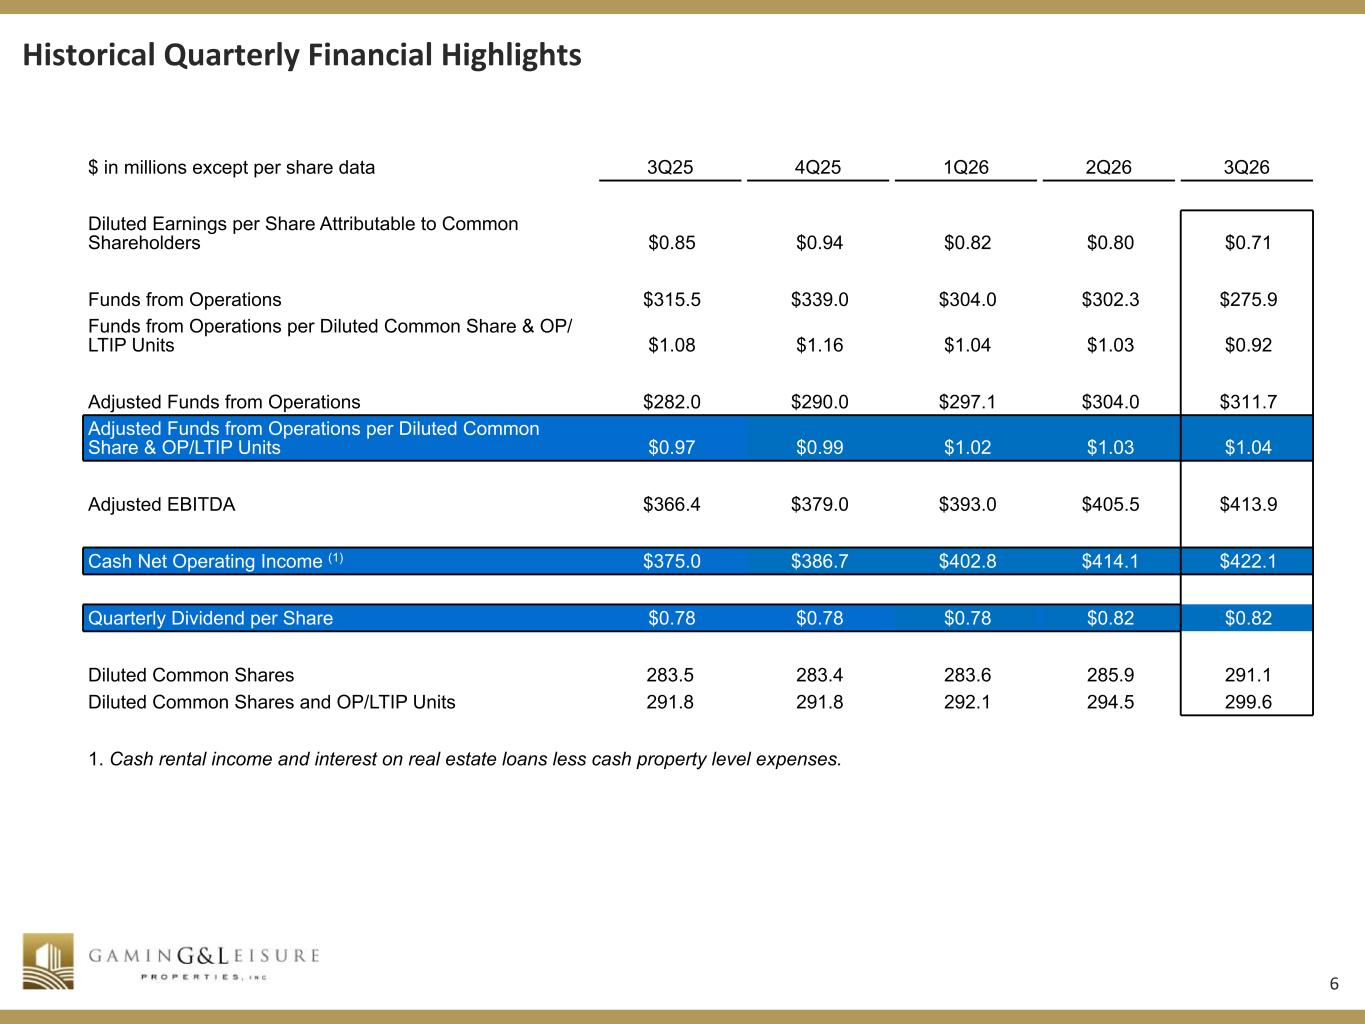
6 R 41 G 41 B 41 R 255 G 255 B 255 R 207 G 182 B 103 R 163 G 131 B 56 R 31 G 73 B 125 R 144 G 124 B 75 R 79 G 129 B 189 R 235 G 235 B 237 R 128 G 100 B 162 R 199 G 198 B 215 Historical Quarterly Financial Highlights $ in millions except per share data 3Q25 4Q25 1Q26 2Q26 3Q26 Diluted Earnings per Share Attributable to Common Shareholders $0.85 $0.94 $0.82 $0.80 $0.71 Funds from Operations $315.5 $339.0 $304.0 $302.3 $275.9 Funds from Operations per Diluted Common Share & OP/ LTIP Units $1.08 $1.16 $1.04 $1.03 $0.92 Adjusted Funds from Operations $282.0 $290.0 $297.1 $304.0 $311.7 Adjusted Funds from Operations per Diluted Common Share & OP/LTIP Units $0.97 $0.99 $1.02 $1.03 $1.04 Adjusted EBITDA $366.4 $379.0 $393.0 $405.5 $413.9 Cash Net Operating Income (1) $375.0 $386.7 $402.8 $414.1 $422.1 Quarterly Dividend per Share $0.78 $0.78 $0.78 $0.82 $0.82 Diluted Common Shares 283.5 283.4 283.6 285.9 291.1 Diluted Common Shares and OP/LTIP Units 291.8 291.8 292.1 294.5 299.6 1. Cash rental income and interest on real estate loans less cash property level expenses.
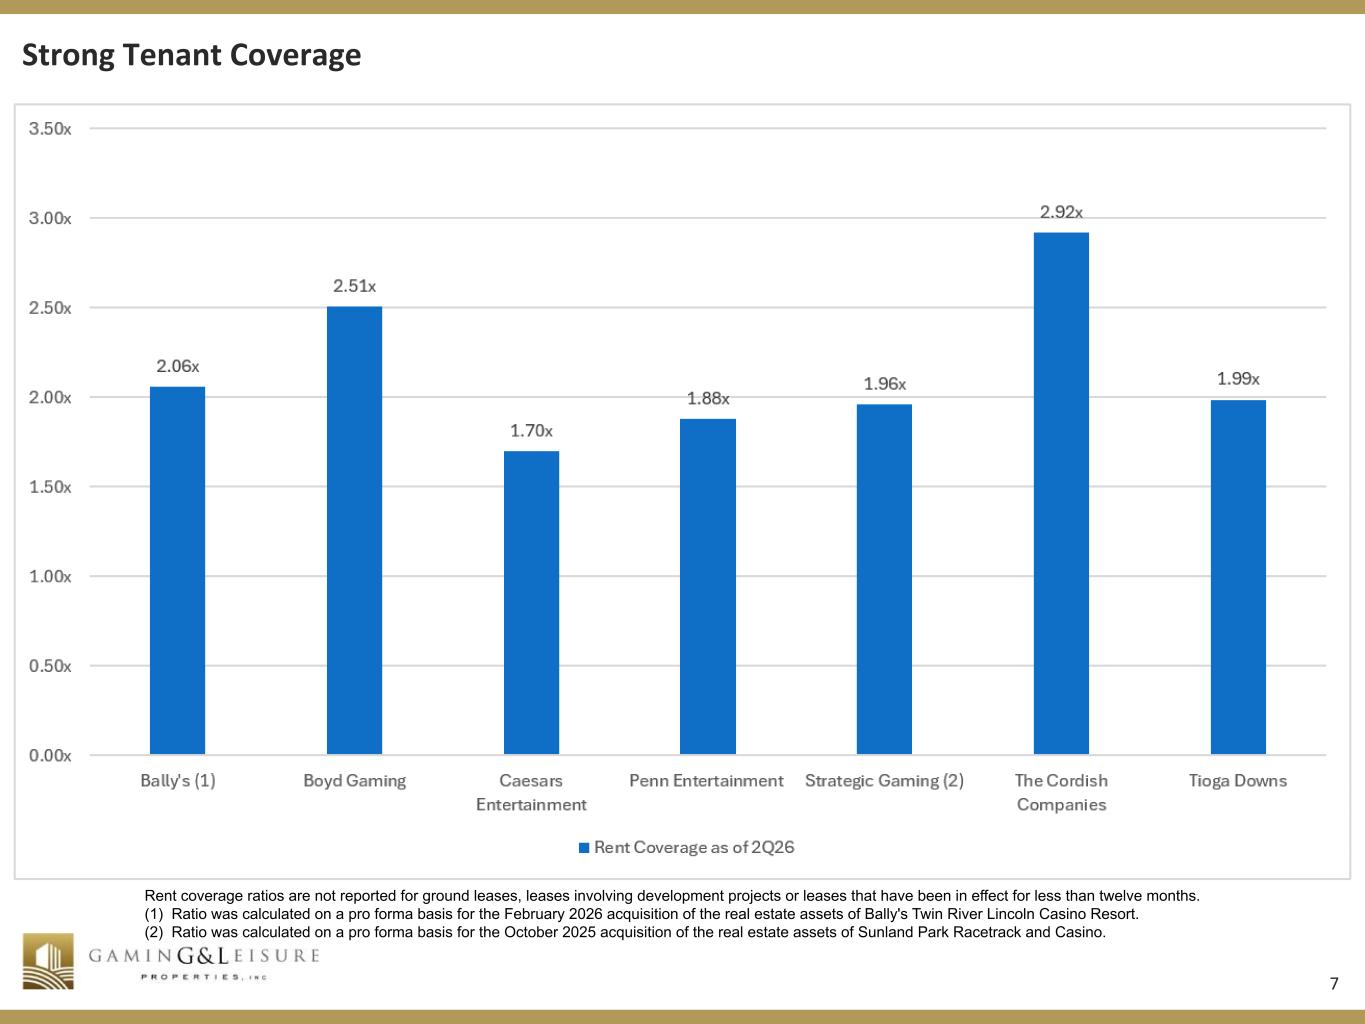
7 R 41 G 41 B 41 R 255 G 255 B 255 R 207 G 182 B 103 R 163 G 131 B 56 R 31 G 73 B 125 R 144 G 124 B 75 R 79 G 129 B 189 R 235 G 235 B 237 R 128 G 100 B 162 R 199 G 198 B 215 Strong Tenant Coverage Rent coverage ratios are not reported for ground leases, leases involving development projects or leases that have been in effect for less than twelve months. (1) Ratio was calculated on a pro forma basis for the February 2026 acquisition of the real estate assets of Bally's Twin River Lincoln Casino Resort. (2) Ratio was calculated on a pro forma basis for the October 2025 acquisition of the real estate assets of Sunland Park Racetrack and Casino.
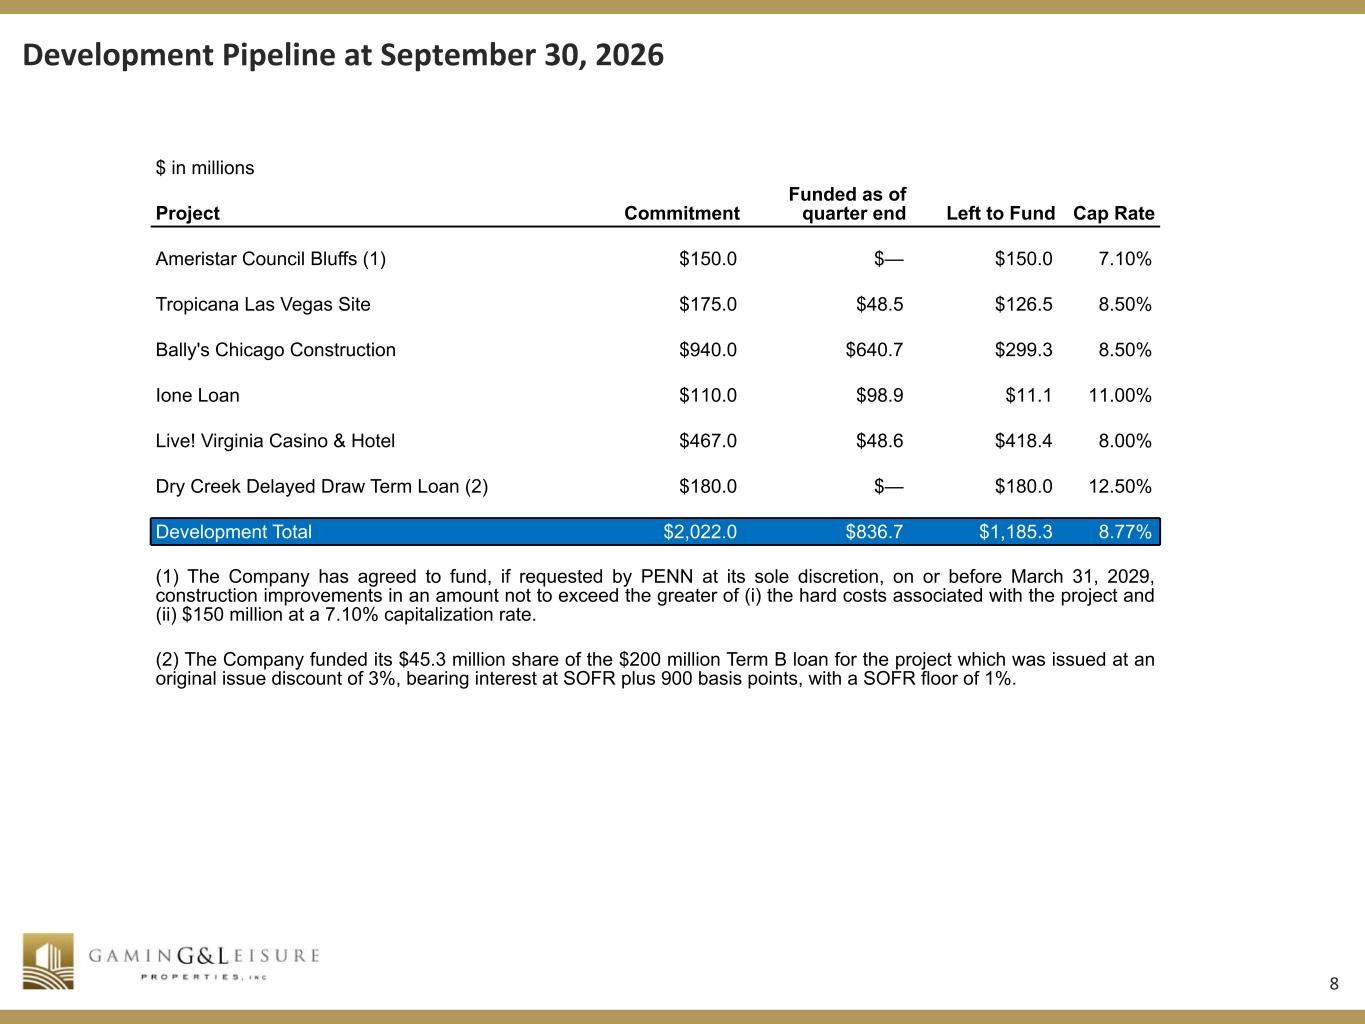
8 R 41 G 41 B 41 R 255 G 255 B 255 R 207 G 182 B 103 R 163 G 131 B 56 R 31 G 73 B 125 R 144 G 124 B 75 R 79 G 129 B 189 R 235 G 235 B 237 R 128 G 100 B 162 R 199 G 198 B 215 Development Pipeline at September 30, 2026 $ in millions Project Commitment Funded as of quarter end Left to Fund Cap Rate Ameristar Council Bluffs (1) $150.0 $— $150.0 7.10% Tropicana Las Vegas Site $175.0 $48.5 $126.5 8.50% Bally's Chicago Construction $940.0 $640.7 $299.3 8.50% Ione Loan $110.0 $98.9 $11.1 11.00% Live! Virginia Casino & Hotel $467.0 $48.6 $418.4 8.00% Dry Creek Delayed Draw Term Loan (2) $180.0 $— $180.0 12.50% Development Total $2,022.0 $836.7 $1,185.3 8.77% (1) The Company has agreed to fund, if requested by PENN at its sole discretion, on or before March 31, 2029, construction improvements in an amount not to exceed the greater of (i) the hard costs associated with the project and (ii) $150 million at a 7.10% capitalization rate. (2) The Company funded its $45.3 million share of the $200 million Term B loan for the project which was issued at an original issue discount of 3%, bearing interest at SOFR plus 900 basis points, with a SOFR floor of 1%.
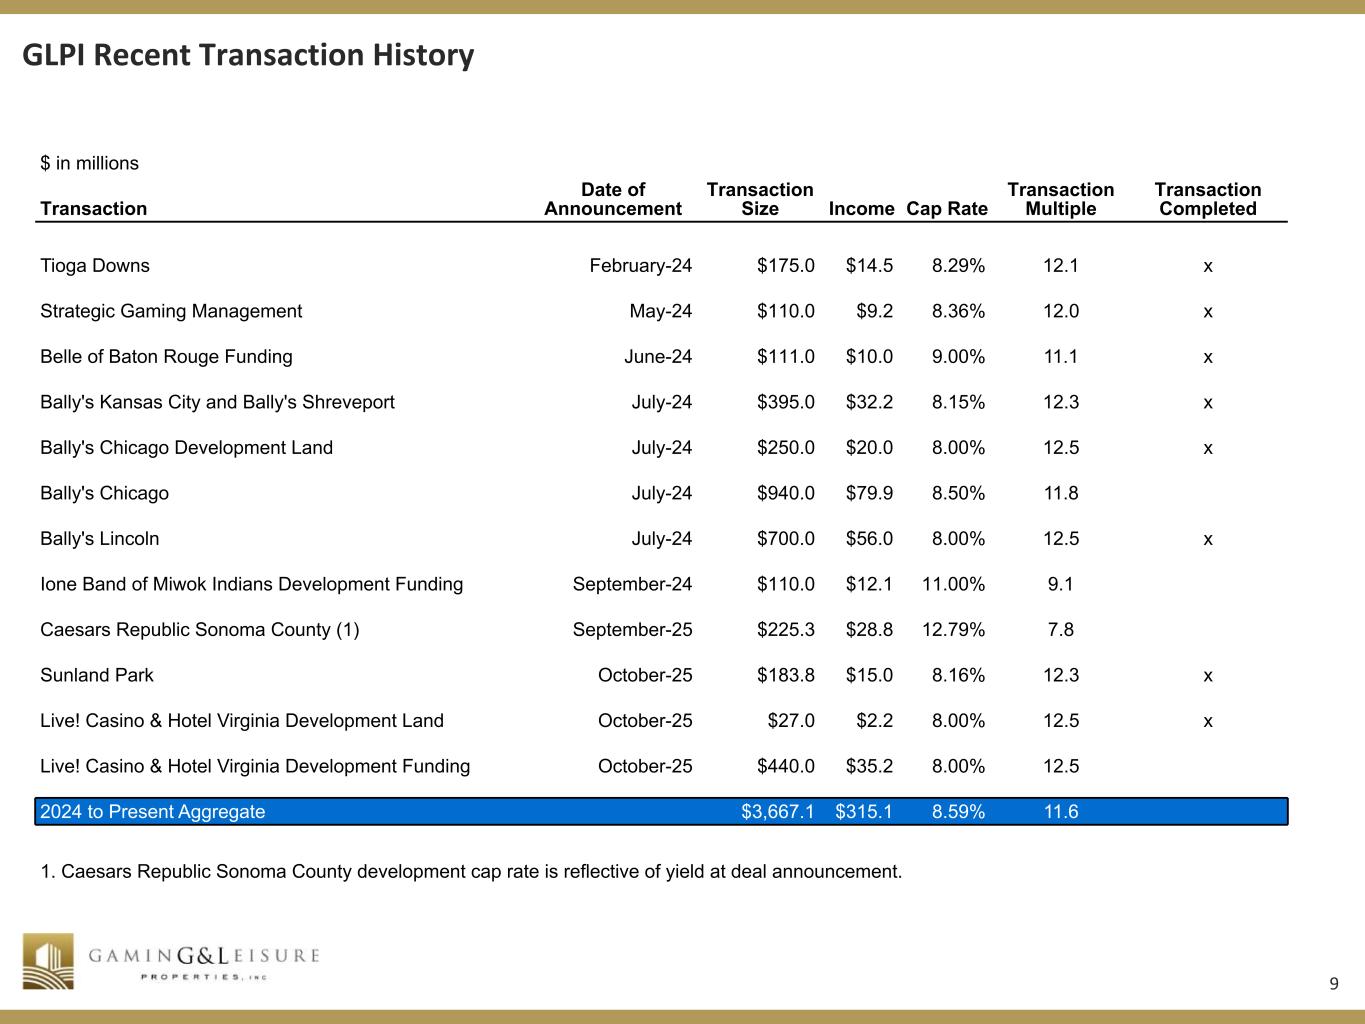
9 R 41 G 41 B 41 R 255 G 255 B 255 R 207 G 182 B 103 R 163 G 131 B 56 R 31 G 73 B 125 R 144 G 124 B 75 R 79 G 129 B 189 R 235 G 235 B 237 R 128 G 100 B 162 R 199 G 198 B 215 GLPI Recent Transaction History $ in millions Transaction Date of Announcement Transaction Size Income Cap Rate Transaction Multiple Transaction Completed Tioga Downs February-24 $175.0 $14.5 8.29% 12.1 x Strategic Gaming Management May-24 $110.0 $9.2 8.36% 12.0 x Belle of Baton Rouge Funding June-24 $111.0 $10.0 9.00% 11.1 x Bally's Kansas City and Bally's Shreveport July-24 $395.0 $32.2 8.15% 12.3 x Bally's Chicago Development Land July-24 $250.0 $20.0 8.00% 12.5 x Bally's Chicago July-24 $940.0 $79.9 8.50% 11.8 Bally's Lincoln July-24 $700.0 $56.0 8.00% 12.5 x Ione Band of Miwok Indians Development Funding September-24 $110.0 $12.1 11.00% 9.1 Caesars Republic Sonoma County (1) September-25 $225.3 $28.8 12.79% 7.8 Sunland Park October-25 $183.8 $15.0 8.16% 12.3 x Live! Casino & Hotel Virginia Development Land October-25 $27.0 $2.2 8.00% 12.5 x Live! Casino & Hotel Virginia Development Funding October-25 $440.0 $35.2 8.00% 12.5 2024 to Present Aggregate $3,667.1 $315.1 8.59% 11.6 1. Caesars Republic Sonoma County development cap rate is reflective of yield at deal announcement.
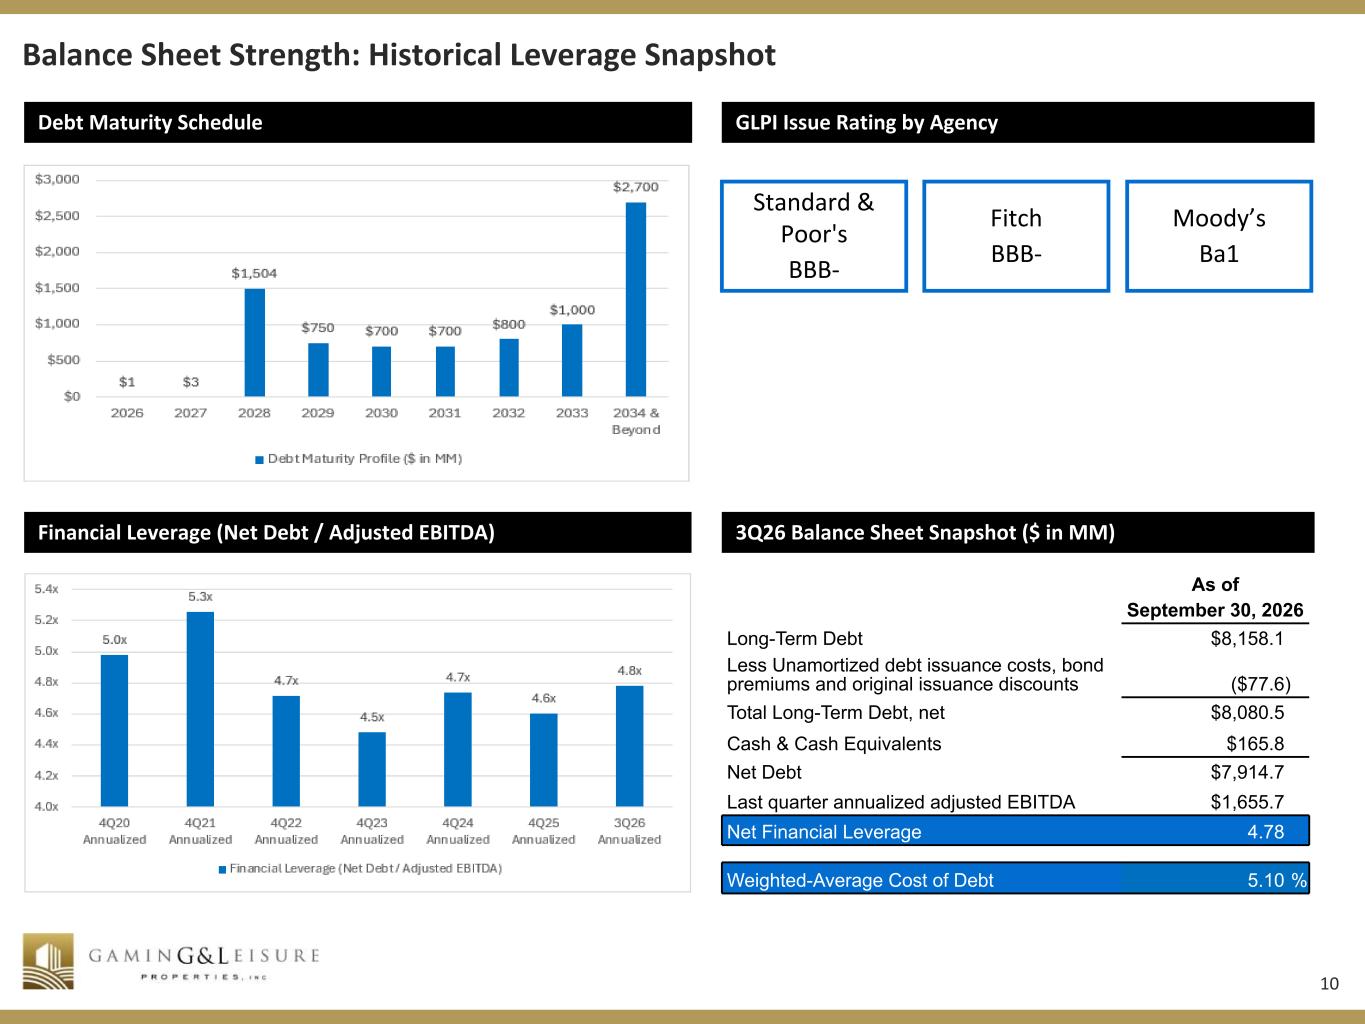
10 R 41 G 41 B 41 R 255 G 255 B 255 R 207 G 182 B 103 R 163 G 131 B 56 R 31 G 73 B 125 R 144 G 124 B 75 R 79 G 129 B 189 R 235 G 235 B 237 R 128 G 100 B 162 R 199 G 198 B 215 Debt Maturity Schedule Balance Sheet Strength: Historical Leverage Snapshot GLPI Issue Rating by Agency Fitch BBB- Moody’s Ba1 Financial Leverage (Net Debt / Adjusted EBITDA) 3Q26 Balance Sheet Snapshot ($ in MM) As of September 30, 2026 Long-Term Debt $8,158.1 Less Unamortized debt issuance costs, bond premiums and original issuance discounts ($77.6) Total Long-Term Debt, net $8,080.5 Cash & Cash Equivalents $165.8 Net Debt $7,914.7 Last quarter annualized adjusted EBITDA $1,655.7 Net Financial Leverage 4.78 Weighted-Average Cost of Debt 5.10 % Standard & Poor's BBB-
11 R 41 G 41 B 41 R 255 G 255 B 255 R 207 G 182 B 103 R 163 G 131 B 56 R 31 G 73 B 125 R 144 G 124 B 75 R 79 G 129 B 189 R 235 G 235 B 237 R 128 G 100 B 162 R 199 G 198 B 215 FFO, FFO per diluted common share and OP/LTIP units, AFFO, AFFO per diluted common share and OP/LTIP units, Adjusted EBITDA and Cash Net Operating Income ("Cash NOI"), which are detailed in the reconciliation tables that accompany this release, are used by the Company as performance measures for benchmarking against the Company’s peers and as internal measures of business operating performance, which is used for a bonus metric. These metrics are presented assuming full conversion of limited partnership units to common shares and therefore before the income statement impact of non-controlling interests. The Company believes FFO, FFO per diluted common share and OP/LTIP units, AFFO, AFFO per diluted common share and OP/LTIP units, Adjusted EBITDA and Cash NOI provide a meaningful perspective of the underlying operating performance of the Company’s current business. This is especially true since these measures exclude real estate depreciation and we believe that real estate values fluctuate based on market conditions rather than depreciating in value ratably on a straight-line basis over time. Cash NOI is cash rental income and interest on real estate loans, less cash property level expenses. Cash NOI excludes depreciation, the amortization of land rights, real estate general and administrative expenses, other non-routine costs and the impact of certain generally accepted accounting principles (“GAAP”) adjustments to rental revenue, such as straight-line rent and deferred rent adjustments and non-cash ground lease income and expense. It is management's view that Cash NOI is a performance measure used to evaluate the operating performance of the Company’s real estate operations and provides investors relevant and useful information because it reflects only income and operating expense items that are incurred at the property level and presents them on an unleveraged basis. FFO, FFO per diluted common share and OP/LTIP units, AFFO, AFFO per diluted common share and OP/LTIP units, Adjusted EBITDA and Cash NOI are non-GAAP financial measures that are considered supplemental measures for the real estate industry and a supplement to GAAP measures. NAREIT defines FFO as net income (computed in accordance with GAAP), excluding (gains) or losses from dispositions of property, and real estate depreciation. We have defined AFFO as FFO excluding, as applicable to the particular period, stock-based compensation expense, the amortization of debt issuance costs, bond premiums and original issuance discounts, other depreciation, the amortization of land rights, accretion on investment in leases, non-cash adjustments to financing lease liabilities, straight-line rent and deferred rent adjustments, losses on debt extinguishment and other financing costs, severance charges, capitalized interest and provision (benefit) for credit losses, net, reduced by capital maintenance expenditures. We have defined Adjusted EBITDA as net income excluding, as applicable to the particular period, interest, net, income tax expense, real estate depreciation, other depreciation, (gains) or losses from dispositions of property, stock-based compensation expense, straight-line rent and deferred rent adjustments, the amortization of land rights, accretion on investment in leases, non-cash adjustments to financing lease liabilities, losses on debt extinguishment and other financing costs, severance charges, and provision (benefit) for credit losses, net. Finally, we have defined Cash NOI as Adjusted EBITDA excluding general and administrative expenses and including stock-based compensation expense and severance charges. FFO, FFO per diluted common share and OP/LTIP units, AFFO, AFFO per diluted common share and OP/LTIP units, Adjusted EBITDA and Cash NOI are not recognized terms under GAAP. These non-GAAP financial measures: (i) do not represent cash flow from operations as defined by GAAP; (ii) should not be considered as an alternative to net income as a measure of operating performance or to cash flows from operating, investing and financing activities; and (iii) are not alternatives to cash flow as a measure of liquidity. In addition, these measures should not be viewed as an indication of our ability to fund all of our cash needs, including to make cash distributions to our shareholders, to fund capital improvements, or to make interest payments on our indebtedness. Investors are also cautioned that FFO, FFO per diluted common share and OP/ LTIP units, AFFO, AFFO per diluted common share and OP/LTIP units, Adjusted EBITDA and Cash NOI, as presented, may not be comparable to similarly titled measures reported by other real estate companies, including REITs, due to the fact that not all real estate companies use the same definitions. Our presentation of these measures does not replace the presentation of our financial results in accordance with GAAP. Definitions of Non-GAAP Financial Measures
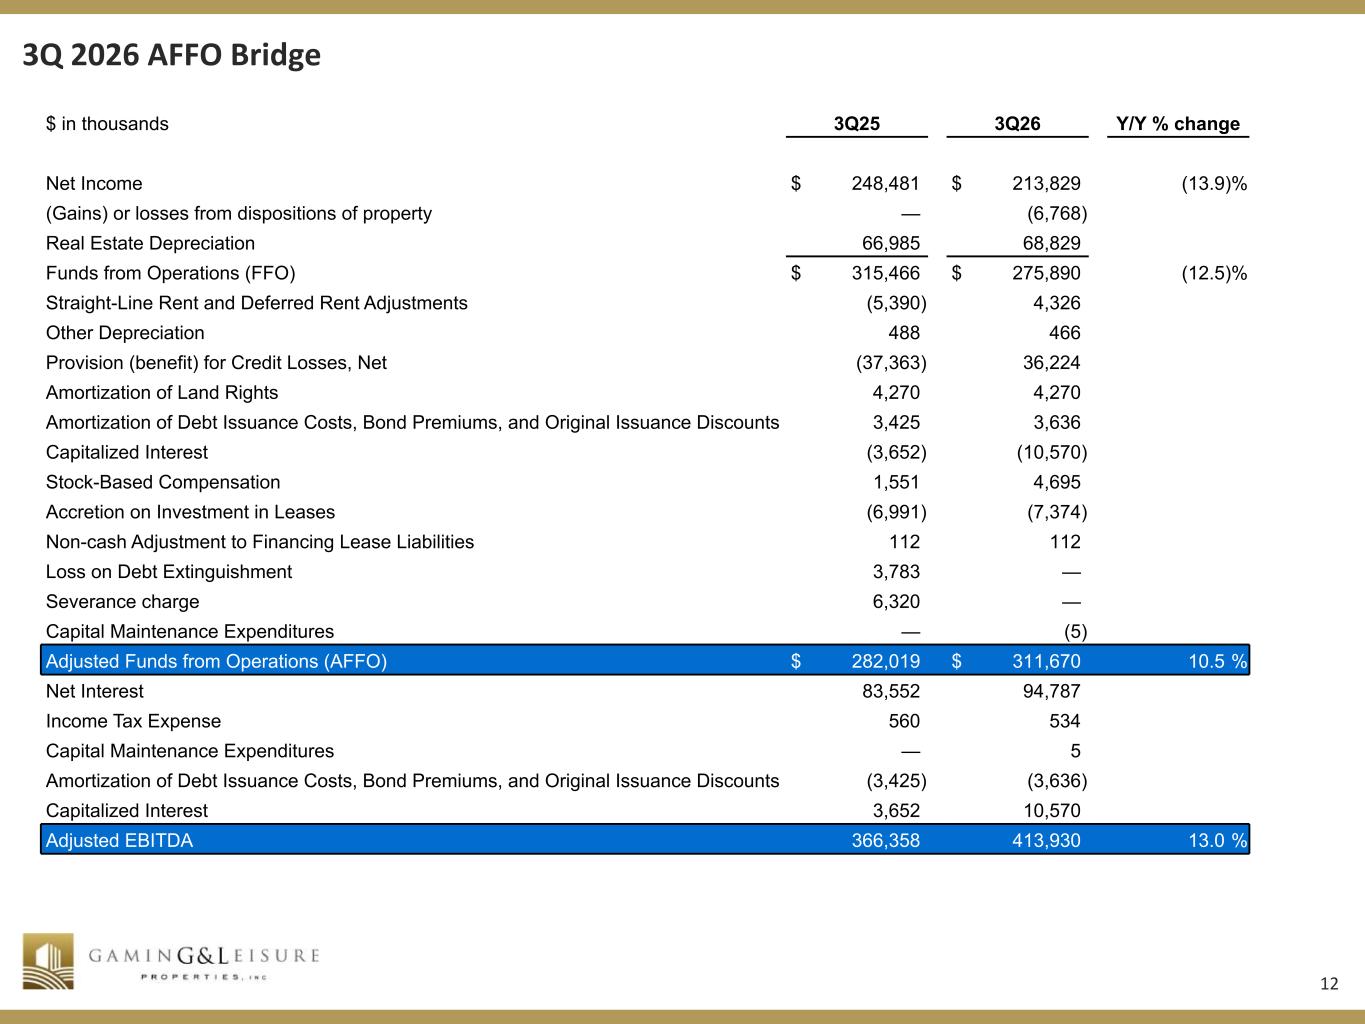
12 R 41 G 41 B 41 R 255 G 255 B 255 R 207 G 182 B 103 R 163 G 131 B 56 R 31 G 73 B 125 R 144 G 124 B 75 R 79 G 129 B 189 R 235 G 235 B 237 R 128 G 100 B 162 R 199 G 198 B 215 3Q 2026 AFFO Bridge $ in thousands 3Q25 3Q26 Y/Y % change Net Income $ 248,481 $ 213,829 (13.9) % (Gains) or losses from dispositions of property — (6,768) Real Estate Depreciation 66,985 68,829 Funds from Operations (FFO) $ 315,466 $ 275,890 (12.5) % Straight-Line Rent and Deferred Rent Adjustments (5,390) 4,326 Other Depreciation 488 466 Provision (benefit) for Credit Losses, Net (37,363) 36,224 Amortization of Land Rights 4,270 4,270 Amortization of Debt Issuance Costs, Bond Premiums, and Original Issuance Discounts 3,425 3,636 Capitalized Interest (3,652) (10,570) Stock-Based Compensation 1,551 4,695 Accretion on Investment in Leases (6,991) (7,374) Non-cash Adjustment to Financing Lease Liabilities 112 112 Loss on Debt Extinguishment 3,783 — Severance charge 6,320 — Capital Maintenance Expenditures — (5) Adjusted Funds from Operations (AFFO) $ 282,019 $ 311,670 10.5 % Net Interest 83,552 94,787 Income Tax Expense 560 534 Capital Maintenance Expenditures — 5 Amortization of Debt Issuance Costs, Bond Premiums, and Original Issuance Discounts (3,425) (3,636) Capitalized Interest 3,652 10,570 Adjusted EBITDA 366,358 413,930 13.0 %
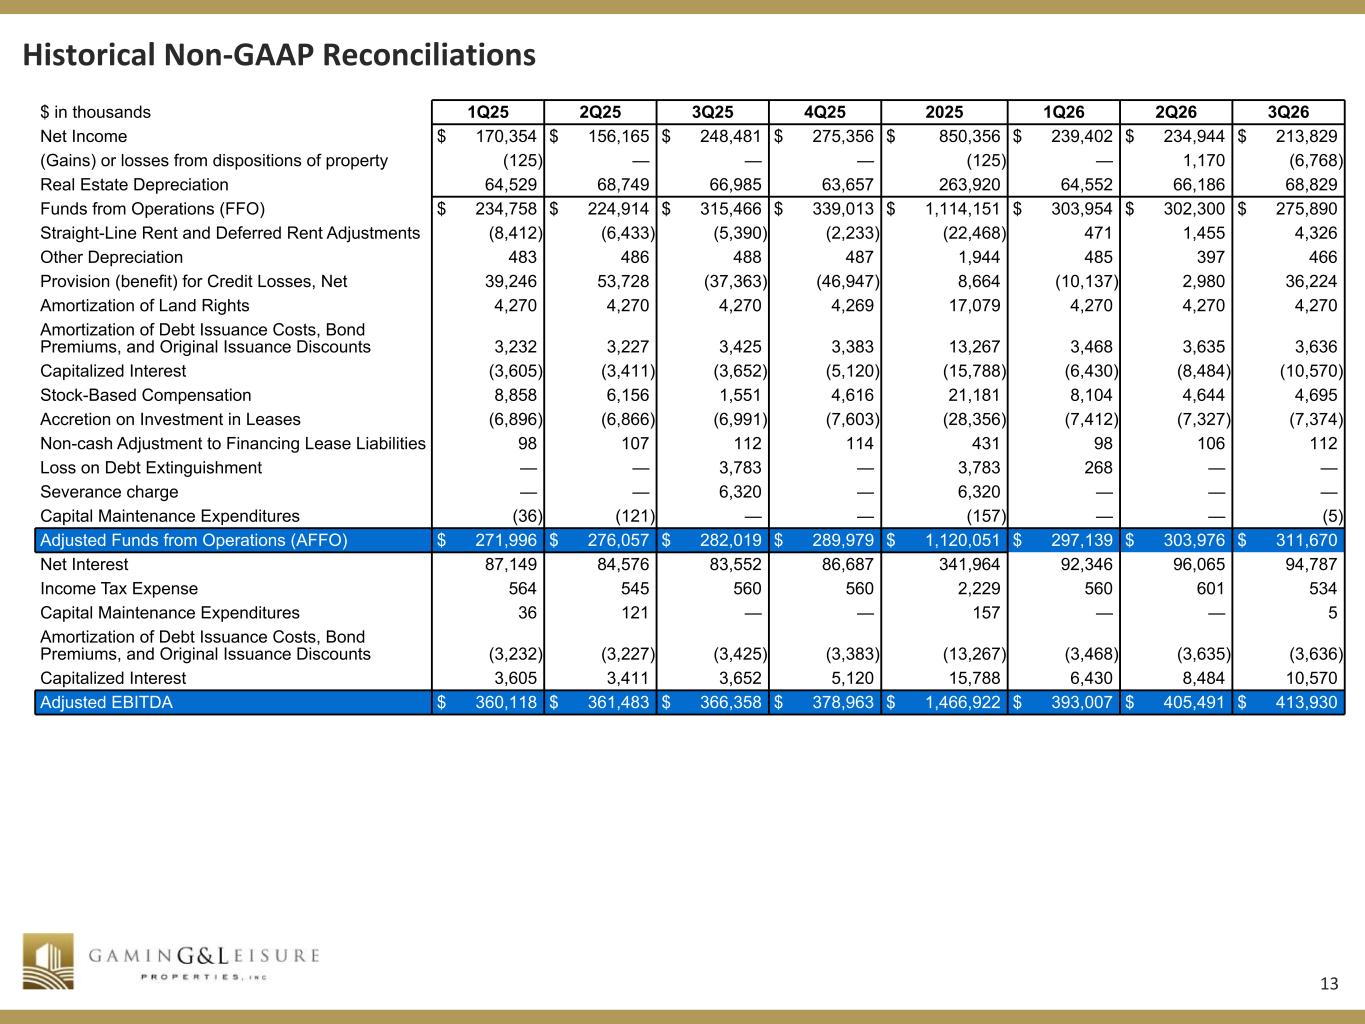
13 R 41 G 41 B 41 R 255 G 255 B 255 R 207 G 182 B 103 R 163 G 131 B 56 R 31 G 73 B 125 R 144 G 124 B 75 R 79 G 129 B 189 R 235 G 235 B 237 R 128 G 100 B 162 R 199 G 198 B 215 Historical Non-GAAP Reconciliations $ in thousands 1Q25 2Q25 3Q25 4Q25 2025 1Q26 2Q26 3Q26 Net Income $ 170,354 $ 156,165 $ 248,481 $ 275,356 $ 850,356 $ 239,402 $ 234,944 $ 213,829 (Gains) or losses from dispositions of property (125) — — — (125) — 1,170 (6,768) Real Estate Depreciation 64,529 68,749 66,985 63,657 263,920 64,552 66,186 68,829 Funds from Operations (FFO) $ 234,758 $ 224,914 $ 315,466 $ 339,013 $ 1,114,151 $ 303,954 $ 302,300 $ 275,890 Straight-Line Rent and Deferred Rent Adjustments (8,412) (6,433) (5,390) (2,233) (22,468) 471 1,455 4,326 Other Depreciation 483 486 488 487 1,944 485 397 466 Provision (benefit) for Credit Losses, Net 39,246 53,728 (37,363) (46,947) 8,664 (10,137) 2,980 36,224 Amortization of Land Rights 4,270 4,270 4,270 4,269 17,079 4,270 4,270 4,270 Amortization of Debt Issuance Costs, Bond Premiums, and Original Issuance Discounts 3,232 3,227 3,425 3,383 13,267 3,468 3,635 3,636 Capitalized Interest (3,605) (3,411) (3,652) (5,120) (15,788) (6,430) (8,484) (10,570) Stock-Based Compensation 8,858 6,156 1,551 4,616 21,181 8,104 4,644 4,695 Accretion on Investment in Leases (6,896) (6,866) (6,991) (7,603) (28,356) (7,412) (7,327) (7,374) Non-cash Adjustment to Financing Lease Liabilities 98 107 112 114 431 98 106 112 Loss on Debt Extinguishment — — 3,783 — 3,783 268 — — Severance charge — — 6,320 — 6,320 — — — Capital Maintenance Expenditures (36) (121) — — (157) — — (5) Adjusted Funds from Operations (AFFO) $ 271,996 $ 276,057 $ 282,019 $ 289,979 $ 1,120,051 $ 297,139 $ 303,976 $ 311,670 Net Interest 87,149 84,576 83,552 86,687 341,964 92,346 96,065 94,787 Income Tax Expense 564 545 560 560 2,229 560 601 534 Capital Maintenance Expenditures 36 121 — — 157 — — 5 Amortization of Debt Issuance Costs, Bond Premiums, and Original Issuance Discounts (3,232) (3,227) (3,425) (3,383) (13,267) (3,468) (3,635) (3,636) Capitalized Interest 3,605 3,411 3,652 5,120 15,788 6,430 8,484 10,570 Adjusted EBITDA $ 360,118 $ 361,483 $ 366,358 $ 378,963 $ 1,466,922 $ 393,007 $ 405,491 $ 413,930