Shareholder Report
|
12 Months Ended |
|
Aug. 31, 2026
USD ($)
Holding
|
|---|
| Shareholder Report [Line Items] |
|
| Document Type |
N-CSR
|
| Amendment Flag |
false
|
| Registrant Name |
ALLSPRING EXCHANGE-TRADED FUNDS TRUST
|
| Entity Central Index Key |
0001611331
|
| Entity Investment Company Type |
N-1A
|
| Document Period End Date |
Aug. 31, 2026
|
| Shareholder Report Annual or Semi-Annual |
Annual Shareholder Report
|
| C000254753 |
|
| Shareholder Report [Line Items] |
|
| Fund Name |
Broad Market Core Bond ETF
|
| Trading Symbol |
AFIX
|
| Security Exchange Name |
NYSEArca
|
| Annual or Semi-Annual Statement [Text Block] |
This annual shareholder report contains important information about Broad Market Core Bond ETF for the period from September 1, 2025 to August 31, 2026.
|
| Additional Information [Text Block] |
You can find additional information about the Fund at allspringglobal.com. You can also request this information by contacting us at 1-866-701-2575.
|
| Additional Information Phone Number |
<span style="white-space: nowrap; box-sizing: border-box; color: rgb(0, 0, 0); display: inline; flex-wrap: nowrap; font-size: 12px; font-weight: 400; grid-area: auto; line-height: 18px; margin: 0px; overflow: visible; text-align: left; text-align-last: auto;"> 1-866-701-2575.</span>
|
| Additional Information Website |
<span style="box-sizing: border-box; color: rgb(0, 0, 0); display: inline; flex-wrap: nowrap; font-size: 12px; font-weight: 400; grid-area: auto; line-height: 18px; margin: 0px; overflow: visible; text-align: left; text-align-last: auto; white-space-collapse: preserve-breaks;">allspringglobal.com</span>
|
| Expenses [Text Block] |
What were the Fund costs for the past year?The table explains the costs you would have paid within the reporting period based on a hypothetical $10,000 investment.
Table Summary
CLASS NAME |
COSTS OF A $10,000 INVESTMENT |
COSTS PAID AS A % OF A $10,000 INVESTMENT |
Broad Market Core Bond ETF |
$19 |
0.19% | Pursuant to a unitary fee arrangement between the Fund and the Manager, the Manager has agreed to pay all expenses incurred by, and appropriately allocated to, the Fund, excluding only: the management fee payable to the Manager and certain other expenses. Please see the prospectus for the annual unitary fee and more details on excluded expenses. |
| Expenses Paid, Amount |
$ 19
|
| Expense Ratio, Percent |
0.19%
|
| Factors Affecting Performance [Text Block] |
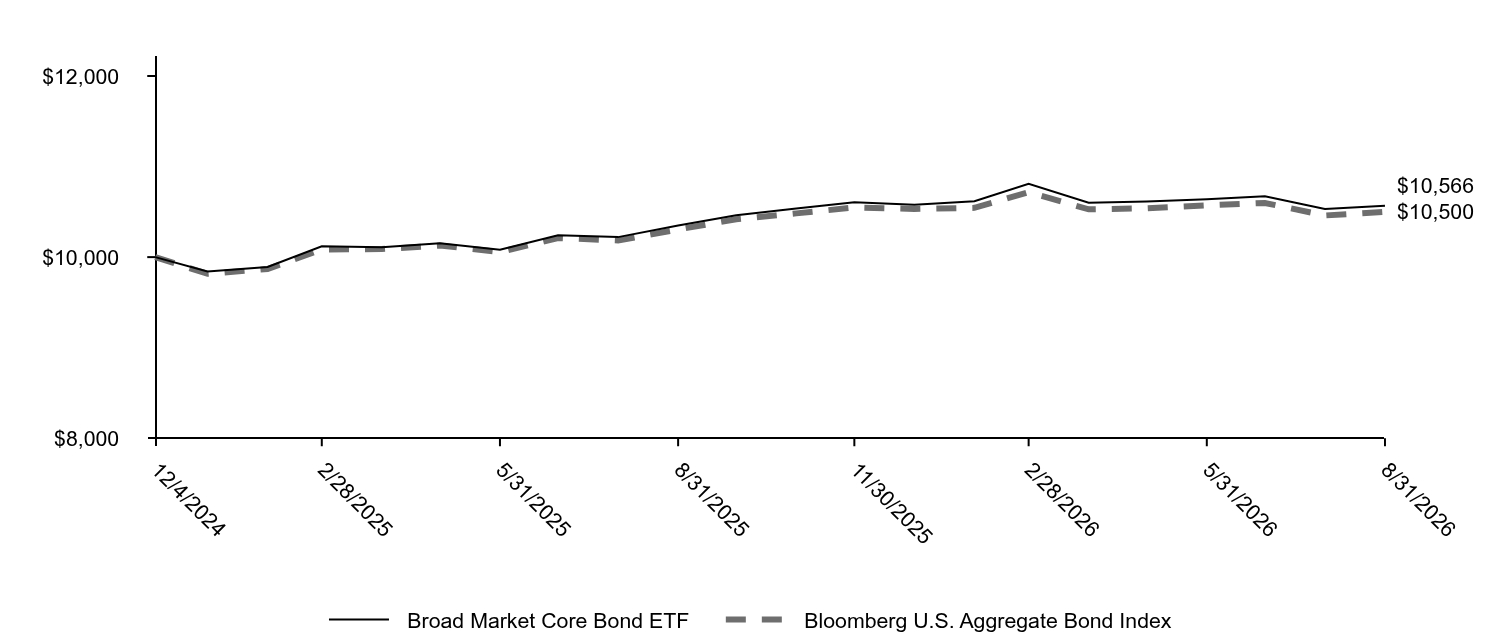
How did the Fund perform last year and what affected its performance?The Fund outperformed its benchmark for the 12-month period ended August 31, 2026. Overweight allocations to other U.S. government securitizations, including Small Business Administration securitizations, taxable municipals, and corporates were the biggest contributors to performance. Our bond selections within agency residential mortgage-backed securities and corporates also enhanced returns. Yield-curve positioning was a relative drag on returns. Treasury rates rose to multi-decade highs in 2026 on renewed concerns over inflation and government balance sheets. Despite rising rates, a meaningful income stream more than offset negative price returns, resulting in positive total returns. Credit spreads were durable, supported by a resilient U.S. economy and labor market, which drove outperformance across non-Treasury sectors. Portfolio positioning was consistent, with only minor adjustments made to capture relative value opportunities. The portfolio is fully invested, with a modestly defensive posture. We plan to maintain a disciplined, quality-focused approach based on protecting capital and capturing selective opportunities while staying flexible as conditions evolve. |
| Performance Past Does Not Indicate Future [Text] |
Figures quoted represent past performance, which is no guarantee of future results,
|
| Line Graph [Table Text Block] |
Table Summary
|
Broad Market Core Bond ETF |
Bloomberg U.S. Aggregate Bond Index |
12/4/2024 |
$10,000 |
$10,000 |
12/31/2024 |
$9,841 |
$9,816 |
1/31/2025 |
$9,892 |
$9,868 |
2/28/2025 |
$10,119 |
$10,085 |
3/31/2025 |
$10,109 |
$10,089 |
4/30/2025 |
$10,154 |
$10,128 |
5/31/2025 |
$10,081 |
$10,056 |
6/30/2025 |
$10,241 |
$10,211 |
7/31/2025 |
$10,221 |
$10,184 |
8/31/2025 |
$10,350 |
$10,305 |
9/30/2025 |
$10,462 |
$10,418 |
10/31/2025 |
$10,538 |
$10,483 |
11/30/2025 |
$10,607 |
$10,548 |
12/31/2025 |
$10,577 |
$10,532 |
1/31/2026 |
$10,617 |
$10,544 |
2/28/2026 |
$10,811 |
$10,716 |
3/31/2026 |
$10,601 |
$10,528 |
4/30/2026 |
$10,615 |
$10,539 |
5/31/2026 |
$10,640 |
$10,572 |
6/30/2026 |
$10,672 |
$10,598 |
7/31/2026 |
$10,531 |
$10,460 |
8/31/2026 |
$10,566 |
$10,500 |
|
| Average Annual Return [Table Text Block] |
AVERAGE ANNUAL TOTAL RETURNS (%)
Table Summary
AATR |
1 Year |
Since Inception (12/4/24) |
Broad Market Core Bond ETF |
2.09 |
3.22 |
Bloomberg U.S. Aggregate Bond Index |
1.89 |
2.85 | Figures quoted represent past performance, which is no guarantee of future results, and do not reflect taxes that a shareholder may pay on an investment in a fund. |
| Performance Inception Date |
Dec. 04, 2024
|
| No Deduction of Taxes [Text Block] |
do not reflect taxes that a shareholder may pay on an investment in a fund.
|
| AssetsNet |
$ 199,452,901
|
| Holdings Count | Holding |
580
|
| Advisory Fees Paid, Amount |
$ 358,328
|
| InvestmentCompanyPortfolioTurnover |
95.00%
|
| Additional Fund Statistics [Text Block] |
Table Summary
Total net assets |
$199,452,901 |
# of portfolio holdings |
580 |
Portfolio turnover rate |
95% |
Total advisory fees paid |
$358,328 | |
| Holdings [Text Block] |
PORTFOLIO COMPOSITION (% OF LONG-TERM INVESTMENTS)
Table Summary
Agency securities |
32.0 |
Corporate bonds and notes |
27.6 |
U.S. Treasury securities |
14.7 |
Asset-backed securities |
11.4 |
Non-agency mortgage-backed securities |
6.1 |
Municipal obligations |
4.3 |
Yankee corporate bonds and notes |
3.9 | |
| Largest Holdings [Text Block] |
TOP TEN HOLDINGS (% OF NET ASSETS)
Table Summary
U.S. Treasury Bonds, 4.75%, 2‑15‑2056 |
5.2 |
U.S. Treasury Bonds, 5.00%, 5‑15‑2046 |
3.7 |
U.S. Treasury Bonds, 4.63%, 2‑15‑2046 |
3.2 |
FHLMC, 2.50%, 9‑1‑2051 |
1.5 |
FHLMC, 5.00%, 3‑1‑2056 |
1.5 |
U.S. Treasury Inflation-Indexed Notes, 1.88%, 1‑15‑2036 |
1.3 |
FHLMC, 5.50%, 1‑1‑2055 |
1.1 |
FNMA, 4.00%, 5‑1‑2051 |
0.9 |
FNMA, 3.50%, 2‑1‑2051 |
0.9 |
FNMA, 3.50%, 9‑1‑2050 |
0.8 | |
| Material Fund Change [Text Block] |
|
| C000254754 |
|
| Shareholder Report [Line Items] |
|
| Fund Name |
Core Plus ETF
|
| Trading Symbol |
APLU
|
| Security Exchange Name |
NYSEArca
|
| Annual or Semi-Annual Statement [Text Block] |
This annual shareholder report contains important information about Core Plus ETF for the period from September 1, 2025 to August 31, 2026.
|
| Additional Information [Text Block] |
You can find additional information about the Fund at allspringglobal.com. You can also request this information by contacting us at 1-866-701-2575.
|
| Additional Information Phone Number |
<span style="white-space: nowrap; box-sizing: border-box; color: rgb(0, 0, 0); display: inline; flex-wrap: nowrap; font-size: 12px; font-weight: 400; grid-area: auto; line-height: 18px; margin: 0px; overflow: visible; text-align: left; text-align-last: auto;"> 1-866-701-2575.</span>
|
| Additional Information Website |
<span style="box-sizing: border-box; color: rgb(0, 0, 0); display: inline; flex-wrap: nowrap; font-size: 12px; font-weight: 400; grid-area: auto; line-height: 18px; margin: 0px; overflow: visible; text-align: left; text-align-last: auto; white-space-collapse: preserve-breaks;">allspringglobal.com</span>
|
| Expenses [Text Block] |
What were the Fund costs for the past year?The table explains the costs you would have paid within the reporting period based on a hypothetical $10,000 investment.
Table Summary
CLASS NAME |
COSTS OF A $10,000 INVESTMENT |
COSTS PAID AS A % OF A $10,000 INVESTMENT |
Core Plus ETF |
$30 |
0.30% | Pursuant to a unitary fee arrangement between the Fund and the Manager, the Manager has agreed to pay all expenses incurred by, and appropriately allocated to, the Fund, excluding only: the management fee payable to the Manager and certain other expenses. Please see the prospectus for the annual unitary fee and more details on excluded expenses. |
| Expenses Paid, Amount |
$ 30
|
| Expense Ratio, Percent |
0.30%
|
| Factors Affecting Performance [Text Block] |
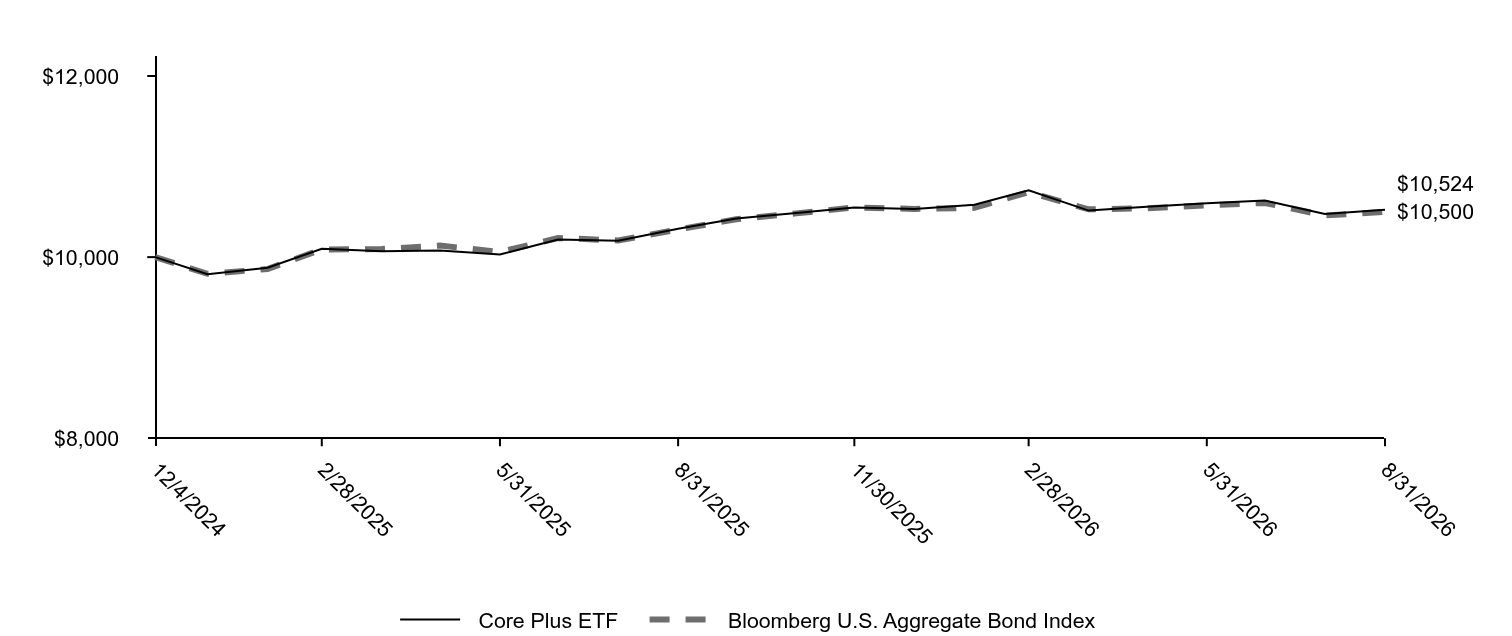
How did the Fund perform last year and what affected its performance?The Fund outperformed its benchmark for the 12-month period ended August 31, 2026. Treasury yields were volatile and rose across most maturities. Yields initially declined as the Federal Reserve (Fed) cut its policy rate by 75 basis points (bps; 100 bps equal 1.00%) from September through December 2025. The Fed then held rates steady as resilient growth, elevated inflation, higher energy prices, and concerns about federal borrowing pushed yields higher. Credit spreads remained tight, supported by solid corporate fundamentals and strong investor demand. Portfolio duration was neutral to the benchmark before we modestly extended after sovereign yields rose in response to the war in Iran. The portfolio sought higher-quality yield through diversified corporate, non-benchmark securitized, and out-of-benchmark plus sector exposures. These plus sectors include emerging market debt, U.S. and European high yield bonds, European investment grade bonds, and global government bonds. Sector allocation, including securitized and plus sector exposures, contributed to performance, as did credit-quality allocation, security selection, and duration. Yield-curve positioning was the primary detractor, particularly an overweight to the 2-year portion of the curve and an underweight to the long end. |
| Performance Past Does Not Indicate Future [Text] |
Figures quoted represent past performance, which is no guarantee of future results,
|
| Line Graph [Table Text Block] |
Table Summary
|
Core Plus ETF |
Bloomberg U.S. Aggregate Bond Index |
12/4/2024 |
$10,000 |
$10,000 |
12/31/2024 |
$9,811 |
$9,816 |
1/31/2025 |
$9,882 |
$9,868 |
2/28/2025 |
$10,092 |
$10,085 |
3/31/2025 |
$10,064 |
$10,089 |
4/30/2025 |
$10,072 |
$10,128 |
5/31/2025 |
$10,028 |
$10,056 |
6/30/2025 |
$10,194 |
$10,211 |
7/31/2025 |
$10,182 |
$10,184 |
8/31/2025 |
$10,313 |
$10,305 |
9/30/2025 |
$10,427 |
$10,418 |
10/31/2025 |
$10,487 |
$10,483 |
11/30/2025 |
$10,547 |
$10,548 |
12/31/2025 |
$10,532 |
$10,532 |
1/31/2026 |
$10,578 |
$10,544 |
2/28/2026 |
$10,738 |
$10,716 |
3/31/2026 |
$10,514 |
$10,528 |
4/30/2026 |
$10,556 |
$10,539 |
5/31/2026 |
$10,596 |
$10,572 |
6/30/2026 |
$10,624 |
$10,598 |
7/31/2026 |
$10,477 |
$10,460 |
8/31/2026 |
$10,524 |
$10,500 |
|
| Average Annual Return [Table Text Block] |
AVERAGE ANNUAL TOTAL RETURNS (%)
Table Summary
AATR |
1 Year |
Since Inception (12/4/24) |
Core Plus ETF |
2.05 |
2.98 |
Bloomberg U.S. Aggregate Bond Index |
1.89 |
2.85 | Figures quoted represent past performance, which is no guarantee of future results, and do not reflect taxes that a shareholder may pay on an investment in a fund. |
| Performance Inception Date |
Dec. 04, 2024
|
| No Deduction of Taxes [Text Block] |
do not reflect taxes that a shareholder may pay on an investment in a fund.
|
| AssetsNet |
$ 422,488,114
|
| Holdings Count | Holding |
563
|
| Advisory Fees Paid, Amount |
$ 1,090,087
|
| InvestmentCompanyPortfolioTurnover |
202.00%
|
| Additional Fund Statistics [Text Block] |
Table Summary
Total net assets |
$422,488,114 |
# of portfolio holdings |
563 |
Portfolio turnover rate |
202% |
Total advisory fees paid |
$1,090,087 | |
| Holdings [Text Block] |
PORTFOLIO COMPOSITION (% OF LONG-TERM INVESTMENTS)
Table Summary
Agency securities |
30.7 |
Corporate bonds and notes |
22.8 |
U.S. Treasury securities |
11.4 |
Asset-backed securities |
8.5 |
Yankee corporate bonds and notes |
8.5 |
Non-agency mortgage-backed securities |
6.0 |
Foreign government bonds |
5.5 |
Investment companies |
3.1 |
Foreign corporate bonds and notes |
1.9 |
Yankee government bonds |
1.6 | |
| Largest Holdings [Text Block] |
TOP TEN HOLDINGS (% OF NET ASSETS)
Table Summary
U.S. Treasury Bonds, 4.63%, 2‑15‑2046 |
5.5 |
GNMA, 5.00%, 4‑20‑2056 |
2.8 |
FNMA, 5.50%, 9‑14‑2056 |
2.0 |
FHLMC, 2.00%, 4‑1‑2052 |
1.5 |
U.S. Treasury Notes, 4.38%, 5‑15‑2036 |
1.4 |
FNMA, 3.00%, 11‑1‑2051 |
1.4 |
FNMA, 2.50%, 2‑1‑2051 |
1.3 |
FNMA, 6.00%, 9‑14‑2056 |
1.0 |
Vanguard Intermediate-Term Corporate Bond ETF |
1.0 |
U.S. Treasury Notes, 4.13%, 11‑15‑2032 |
1.0 | |
| Material Fund Change [Text Block] |
|