Pay vs Performance Disclosure - USD ($)
Dec. 31, 2025
Dec. 31, 2024
Dec. 31, 2023
PAY VERSUS PERFORMANCE
The following Pay Versus Performance information presents the compensation of our Named Executive Officers (“NEOs”) disclosed in the Summary Compensation Table as well as Compensation Actually Paid (“CAP”) to our NEOs and certain performance measures prepared in accordance with Item 402(v) of SEC Regulations S-K as of December 31, 2025.
As discussed further below, the CAP amounts do not necessarily represent actual compensation earned or realized by our NEOs in a given year. The Compensation Committee did not consider the Pay Versus Performance information in 2025 in making its compensation decisions for our NEOs.
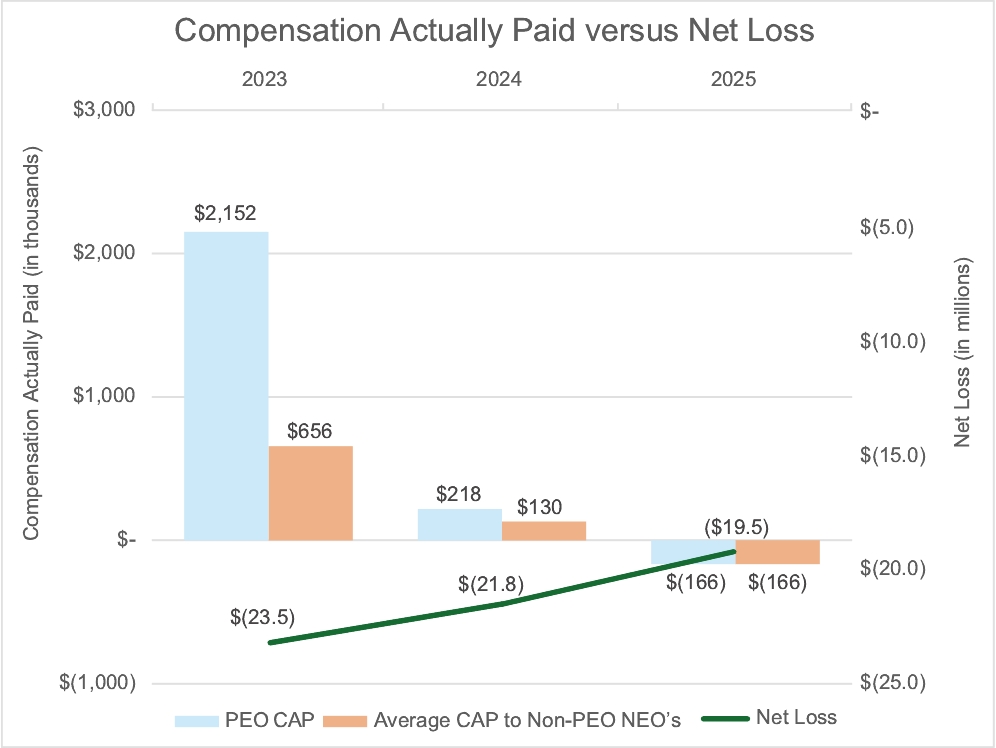
Year | Executive Compensation Table Total for CEO(1) | Compensation Actually Paid to CEO(1) | Average Executive Compensation Table Total for non-CEO named executive officers(2),(4) | Average Executive Compensation Actually paid to non-CEO named executive officers(2),(4) | Total Shareholder return(3) | Net Loss | ||||||||||||
2025 | $583,762 | $(166,041) | $525,352 | $(166,300) | $6.29 | $(19,472,000) | ||||||||||||
2024 | $1,161,132 | $218,405 | $483,564 | $129,734 | $59.22 | $(21,819,000) | ||||||||||||
2023 | $1,870,884 | $2,151,900 | $657,621 | $656,069 | $100.78 | $(23,516,000) | ||||||||||||
(1) | Mr. Berman was our CEO for each of the three years included in the table. For each of the years listed in the table, our non-CEO named executives were Marc Glickman, Jennifer Bright (appointed as Chief Financial Officer on May 19, 2025), Craig Glynn (resigned as Chief Financial Officer on May 19, 2025) and Hamed Alavi. |
(2) | See the Executive Compensation Table above for detail on the Executive Compensation Table total compensation for our CEO for each year covered in the table. The average compensation for the Non-CEO NEOs for 2025, 2024, and 2023 was calculated from the Executive Compensation Table above. |
(3) | Total Shareholder Return (TSR) represents cumulative total shareholder return on a fixed investment of $100 in our common stock for the period beginning on the last trading day of 2022 through the end of the applicable year. |
(4) | Fair value or change in fair value, as applicable, of equity awards in the “Compensation Actually Paid” columns was determined by reference to (1) for RSU awards, the closing price on applicable year-end date(s), and (2) for stock options, a Black Scholes value as of the applicable year-end or vesting date(s), determined based on the same methodology as used to determine grant date fair value but using the closing stock price on the applicable revaluation date as the current market price and with an expected life set equal to the remaining life of the award, and based on volatility and risk free rates determined as of the revaluation date based on the expected life period and based on an expected dividend rate of 0%. |
For purposes of this table, the compensation actually paid (also referred to as “CAP”) to each of our NEOs means the NEO’s total compensation as reflected in the Summary Compensation Table for the applicable year and adjusted for the following with respect to each NEO:
• | Plus/(minus) the amounts reported in the “Stock Awards” and “Option Awards” columns of the Summary Compensation Table for the applicable year. |
• | Plus/(minus) the change in value as of the end of the covered year as compared to the value at the end of the prior year for option awards which were granted in prior years and were outstanding and unvested at the end of the covered year. |
• | Plus/(minus) the vesting date fair value of option awards which were granted and vested during the same covered year. |
• | Plus/(minus) the change in value as of the vesting date as compared to the value at the end of the prior year for option awards which were granted in prior years and vested in the covered year. |
• | Plus/(minus) the fair value at the end of prior year of awards granted in prior years that forfeited/cancelled during the covered year. |
In making each of these adjustments, the “value” of an option or stock award is the fair value of the award on the applicable date determined in accordance with FASB ASC Topic 718 using the valuation assumptions we then used to calculate the fair value of our equity awards. For more information on the valuation of our equity awards, please see the notes to our financial statements that appear in our Annual Report on Form 10 K each year and the footnotes to the Executive Compensation Table appearing therein.
Compensation Actually Paid
CEO | Non-CEO NEO Average | |||||||||||||||||
2025 | 2024 | 2023 | 2025 | 2024 | 2023 | |||||||||||||
Summary Compensation Table Total Compensation | $583,762 | $1,161,132 | $1,870,884 | $525,352 | $483,564 | $657,621 | ||||||||||||
Less: Grant Date Fair Value of Option Awards and Stock Awards Granted in Fiscal Year | — | (400,513) | (854,393) | (324,248) | (100,128) | (261,064) | ||||||||||||
Add: Fair Value at Fiscal Year-End of Outstanding and Unvested Option Awards and Stock Awards Granted in Fiscal Year | — | 481,885 | 1,245,042 | 17,865 | 120,471 | 380,429 | ||||||||||||
Less: Fair Value of Outstanding and Unvested Option Awards and Stock Awards Granted in Prior Fiscal Years | — | (827,842) | (31,468) | (115,756) | (287,146) | (27,596) | ||||||||||||
Add: Fair Value at Vesting of Option Awards and Stock Awards Granted in Fiscal Year That Vested During Fiscal Year | — | — | 30,713 | — | — | 9,384 | ||||||||||||
Less: Fair Value as of Vesting Date of Option Awards and Stock Awards Granted in Prior Fiscal Years for Which Applicable Vesting Conditions Were Satisfied During Fiscal Year | (145,803) | (196,257) | (108,878) | (41,209) | (87,027) | (102,705) | ||||||||||||
Less: Fair Value at End of Prior Year of Awards Granted in Prior Years That Forfeited/Cancelled During Fiscal Year | (604,000) | — | — | (228,304) | — | — | ||||||||||||
Compensation Actually Paid | $(166,041) | $218,405 | $2,151,900 | $(166,300) | $129,734 | $656,069 | ||||||||||||
The table above reflects the CAP (determined as noted above) for our CEO and, for our Non-CEO NEOs, the average of the CAPs determined for the Non-CEO NEOs for each of the years shown in the table.
(1) | Mr. Berman was our CEO for each of the three years included in the table. For each of the years listed in the table, our non-CEO named executives were Marc Glickman, Jennifer Bright (appointed as Chief Financial Officer on May 19, 2025), Craig Glynn (resigned as Chief Financial Officer on May 19, 2025) and Hamed Alavi. |
(4) | Fair value or change in fair value, as applicable, of equity awards in the “Compensation Actually Paid” columns was determined by reference to (1) for RSU awards, the closing price on applicable year-end date(s), and (2) for stock options, a Black Scholes value as of the applicable year-end or vesting date(s), determined based on the same methodology as used to determine grant date fair value but using the closing stock price on the applicable revaluation date as the current market price and with an expected life set equal to the remaining life of the award, and based on volatility and risk free rates determined as of the revaluation date based on the expected life period and based on an expected dividend rate of 0%. |
For purposes of this table, the compensation actually paid (also referred to as “CAP”) to each of our NEOs means the NEO’s total compensation as reflected in the Summary Compensation Table for the applicable year and adjusted for the following with respect to each NEO:
• | Plus/(minus) the amounts reported in the “Stock Awards” and “Option Awards” columns of the Summary Compensation Table for the applicable year. |
• | Plus/(minus) the change in value as of the end of the covered year as compared to the value at the end of the prior year for option awards which were granted in prior years and were outstanding and unvested at the end of the covered year. |
• | Plus/(minus) the vesting date fair value of option awards which were granted and vested during the same covered year. |
• | Plus/(minus) the change in value as of the vesting date as compared to the value at the end of the prior year for option awards which were granted in prior years and vested in the covered year. |
• | Plus/(minus) the fair value at the end of prior year of awards granted in prior years that forfeited/cancelled during the covered year. |
In making each of these adjustments, the “value” of an option or stock award is the fair value of the award on the applicable date determined in accordance with FASB ASC Topic 718 using the valuation assumptions we then used to calculate the fair value of our equity awards. For more information on the valuation of our equity awards, please see the notes to our financial statements that appear in our Annual Report on Form 10 K each year and the footnotes to the Executive Compensation Table appearing therein.
Compensation Actually Paid
CEO | Non-CEO NEO Average | |||||||||||||||||
2025 | 2024 | 2023 | 2025 | 2024 | 2023 | |||||||||||||
Summary Compensation Table Total Compensation | $583,762 | $1,161,132 | $1,870,884 | $525,352 | $483,564 | $657,621 | ||||||||||||
Less: Grant Date Fair Value of Option Awards and Stock Awards Granted in Fiscal Year | — | (400,513) | (854,393) | (324,248) | (100,128) | (261,064) | ||||||||||||
Add: Fair Value at Fiscal Year-End of Outstanding and Unvested Option Awards and Stock Awards Granted in Fiscal Year | — | 481,885 | 1,245,042 | 17,865 | 120,471 | 380,429 | ||||||||||||
Less: Fair Value of Outstanding and Unvested Option Awards and Stock Awards Granted in Prior Fiscal Years | — | (827,842) | (31,468) | (115,756) | (287,146) | (27,596) | ||||||||||||
Add: Fair Value at Vesting of Option Awards and Stock Awards Granted in Fiscal Year That Vested During Fiscal Year | — | — | 30,713 | — | — | 9,384 | ||||||||||||
Less: Fair Value as of Vesting Date of Option Awards and Stock Awards Granted in Prior Fiscal Years for Which Applicable Vesting Conditions Were Satisfied During Fiscal Year | (145,803) | (196,257) | (108,878) | (41,209) | (87,027) | (102,705) | ||||||||||||
Less: Fair Value at End of Prior Year of Awards Granted in Prior Years That Forfeited/Cancelled During Fiscal Year | (604,000) | — | — | (228,304) | — | — | ||||||||||||
Compensation Actually Paid | $(166,041) | $218,405 | $2,151,900 | $(166,300) | $129,734 | $656,069 | ||||||||||||
The table above reflects the CAP (determined as noted above) for our CEO and, for our Non-CEO NEOs, the average of the CAPs determined for the Non-CEO NEOs for each of the years shown in the table.
(4) | Fair value or change in fair value, as applicable, of equity awards in the “Compensation Actually Paid” columns was determined by reference to (1) for RSU awards, the closing price on applicable year-end date(s), and (2) for stock options, a Black Scholes value as of the applicable year-end or vesting date(s), determined based on the same methodology as used to determine grant date fair value but using the closing stock price on the applicable revaluation date as the current market price and with an expected life set equal to the remaining life of the award, and based on volatility and risk free rates determined as of the revaluation date based on the expected life period and based on an expected dividend rate of 0%. |
For purposes of this table, the compensation actually paid (also referred to as “CAP”) to each of our NEOs means the NEO’s total compensation as reflected in the Summary Compensation Table for the applicable year and adjusted for the following with respect to each NEO:
• | Plus/(minus) the amounts reported in the “Stock Awards” and “Option Awards” columns of the Summary Compensation Table for the applicable year. |
• | Plus/(minus) the change in value as of the end of the covered year as compared to the value at the end of the prior year for option awards which were granted in prior years and were outstanding and unvested at the end of the covered year. |
• | Plus/(minus) the vesting date fair value of option awards which were granted and vested during the same covered year. |
• | Plus/(minus) the change in value as of the vesting date as compared to the value at the end of the prior year for option awards which were granted in prior years and vested in the covered year. |
• | Plus/(minus) the fair value at the end of prior year of awards granted in prior years that forfeited/cancelled during the covered year. |
In making each of these adjustments, the “value” of an option or stock award is the fair value of the award on the applicable date determined in accordance with FASB ASC Topic 718 using the valuation assumptions we then used to calculate the fair value of our equity awards. For more information on the valuation of our equity awards, please see the notes to our financial statements that appear in our Annual Report on Form 10 K each year and the footnotes to the Executive Compensation Table appearing therein.
Compensation Actually Paid
CEO | Non-CEO NEO Average | |||||||||||||||||
2025 | 2024 | 2023 | 2025 | 2024 | 2023 | |||||||||||||
Summary Compensation Table Total Compensation | $583,762 | $1,161,132 | $1,870,884 | $525,352 | $483,564 | $657,621 | ||||||||||||
Less: Grant Date Fair Value of Option Awards and Stock Awards Granted in Fiscal Year | — | (400,513) | (854,393) | (324,248) | (100,128) | (261,064) | ||||||||||||
Add: Fair Value at Fiscal Year-End of Outstanding and Unvested Option Awards and Stock Awards Granted in Fiscal Year | — | 481,885 | 1,245,042 | 17,865 | 120,471 | 380,429 | ||||||||||||
Less: Fair Value of Outstanding and Unvested Option Awards and Stock Awards Granted in Prior Fiscal Years | — | (827,842) | (31,468) | (115,756) | (287,146) | (27,596) | ||||||||||||
Add: Fair Value at Vesting of Option Awards and Stock Awards Granted in Fiscal Year That Vested During Fiscal Year | — | — | 30,713 | — | — | 9,384 | ||||||||||||
Less: Fair Value as of Vesting Date of Option Awards and Stock Awards Granted in Prior Fiscal Years for Which Applicable Vesting Conditions Were Satisfied During Fiscal Year | (145,803) | (196,257) | (108,878) | (41,209) | (87,027) | (102,705) | ||||||||||||
Less: Fair Value at End of Prior Year of Awards Granted in Prior Years That Forfeited/Cancelled During Fiscal Year | (604,000) | — | — | (228,304) | — | — | ||||||||||||
Compensation Actually Paid | $(166,041) | $218,405 | $2,151,900 | $(166,300) | $129,734 | $656,069 | ||||||||||||
The table above reflects the CAP (determined as noted above) for our CEO and, for our Non-CEO NEOs, the average of the CAPs determined for the Non-CEO NEOs for each of the years shown in the table.
Chart 1: Compensation Actually Paid versus TSR
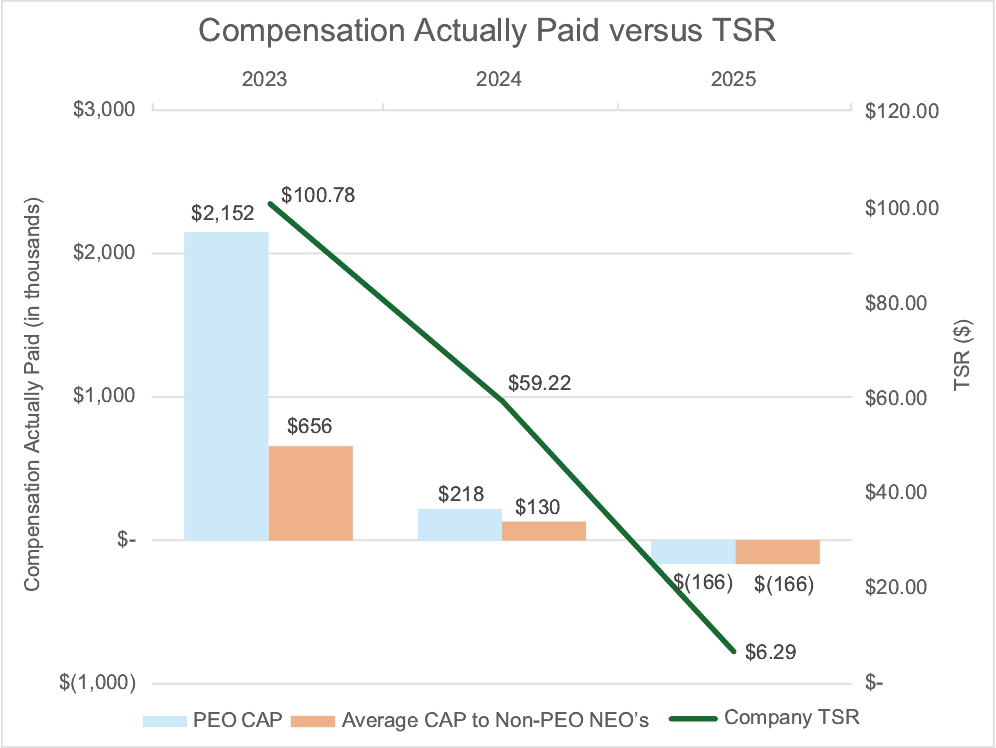
Chart 2: Compensation Actually Paid versus Net Loss