
West Pharmaceutical Services, Inc. Michel Lagarde President & CEO Bob McMahon Senior VP & Chief Financial Officer Third-Quarter 2026 Earnings Call October 29, 2026 | 8 a.m. Eastern Time

2 West Analyst Conference Call October 29, 2026 8 a.m. Eastern Time These presentation materials are intended to accompany and serve as a reference for today’s press release announcing the Company’s results for the third-quarter 2026 and management’s discussion of those results during today’s conference call. A webcast of today’s call can be accessed in the “Investors” section of the Company’s website at www.investor.westpharma.com. To participate on the call by asking questions to Management, please register in advance by clicking here. Registered telephone participants will receive the dial-in number along with a unique PIN number that will enable them to ask questions on the call. A replay of the webcast will be available on the Company’s website for approximately 90 days after the event. REGISTER TODAY
3 This presentation and any accompanying management commentary contain forward-looking statements within the meaning of the Private Securities Litigation Reform Act of 1995, including, but not limited to, statements regarding the Company's expectations regarding future events, financial guidance and financial or operational performance. Forward- looking statements may be identified by words such as "believe," "expect," "intend," "estimate," "plan," "anticipate," "project," "forecast," "guidance," "target," "may," "will," "continue" and similar expressions. These statements are based on current expectations and assumptions and are subject to risks and uncertainties that could cause actual results to differ materially from those expressed or implied by such forward-looking statements. For additional information regarding these risks as well as other risks, uncertainties and factors that could affect our forward- looking statements, please refer to Part I Item 1A, entitled "Risk Factors," of the Company's most recent Annual Report on Form 10-K and any amendments thereto, as well as the Company's most recently filed Quarterly Reports on Form 10-Q and other filings the Company makes with the Securities and Exchange Commission. Forward-looking statements speak only as of the date of this press release. Except as required by law or regulation, West Pharmaceutical Services, Inc. undertakes no obligation to update or revise any forward-looking statements, whether as a result of new information, future events or otherwise. The Company reports its financial results in accordance with U.S. generally accepted accounting principles (“U.S. GAAP”). However, management also uses certain non-U.S. GAAP financial measures in evaluating our results of operations. Management believes that this information provides users with a valuable insight into our overall performance and financial position. As a result, this presentation and any accompanying management commentary contain certain non-GAAP financial measures, including organic net sales, adjusted-diluted earnings per share and adjusted operating profit. Organic net sales exclude the impact from acquisitions and/or divestitures and translate the current-period reported sales of subsidiaries whose functional currency is other than the U.S. Dollar at the applicable foreign currency exchange rates in effect during the comparable prior-year period. We may also refer to financial results, such as adjusted-diluted EPS and adjusted operating profit, that exclude the effects of unallocated items. The unallocated items are not representative of ongoing operations, and generally include restructuring and related charges, certain asset impairments, and other specifically identified income or expense items. These non-U.S. GAAP financial measures should be viewed in addition to, and not as an alternative for, the Company’s results prepared in accordance with U.S. GAAP. Reconciliations of these non-U.S. GAAP measures to the comparable U.S. GAAP financial measures are included in the accompanying tables at the end of this presentation and in today's press release. Forward-Looking Statements Non-U.S. GAAP Financial Measures All trademarks and registered trademarks used in this report are the property of West Pharmaceutical Services, Inc. or its subsidiaries, in the United States and other jurisdictions, unless noted otherwise. Daikyo Crystal Zenith® and Daikyo CZ® are registered trademarks of Daikyo Seiko, Ltd. Daikyo Crystal Zenith technologies are licensed from Daikyo Seiko, Ltd. Trademarks
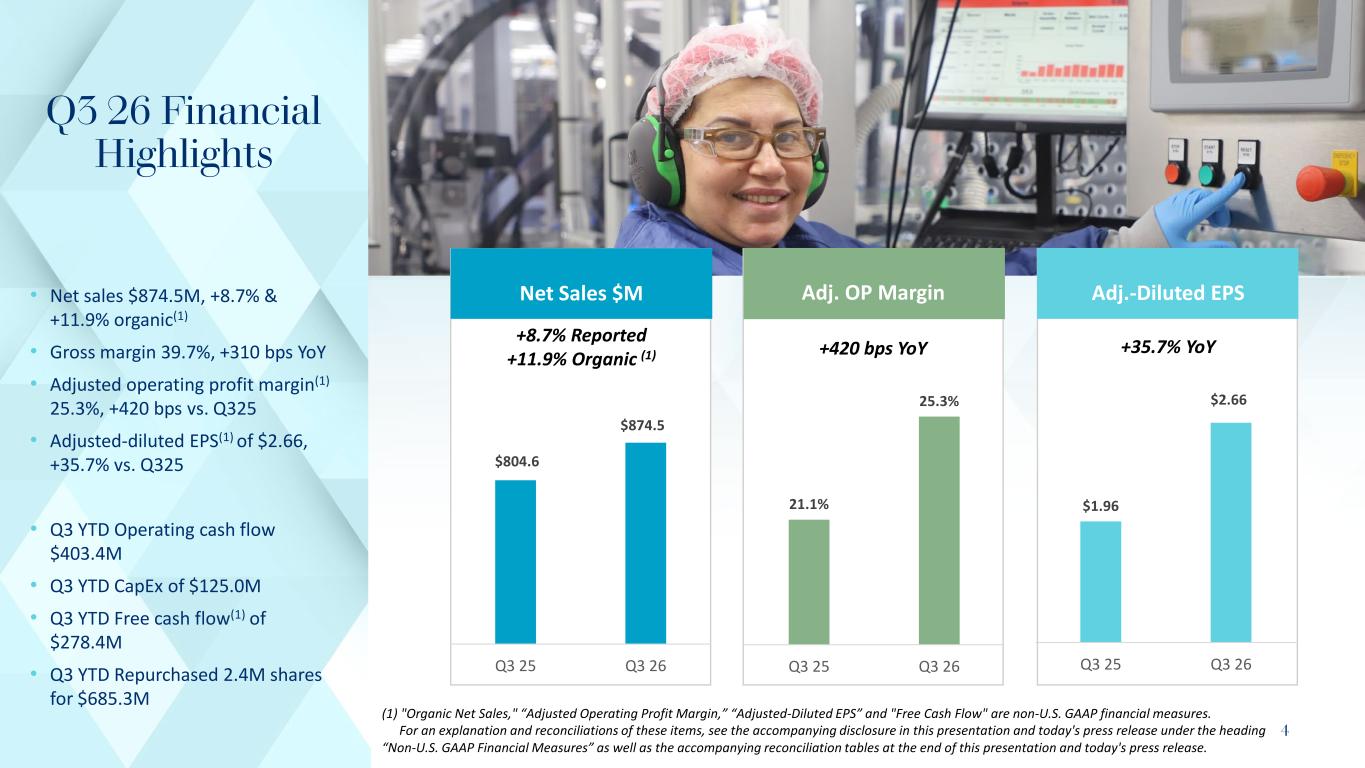
4 • Net sales $874.5M, +8.7% & +11.9% organic(1) • Gross margin 39.7%, +310 bps YoY • Adjusted operating profit margin(1) 25.3%, +420 bps vs. Q325 • Adjusted-diluted EPS(1) of $2.66, +35.7% vs. Q325 • Q3 YTD Operating cash flow $403.4M • Q3 YTD CapEx of $125.0M • Q3 YTD Free cash flow(1) of $278.4M • Q3 YTD Repurchased 2.4M shares for $685.3M (1) "Organic Net Sales," “Adjusted Operating Profit Margin,” “Adjusted-Diluted EPS” and "Free Cash Flow" are non-U.S. GAAP financial measures. For an explanation and reconciliations of these items, see the accompanying disclosure in this presentation and today's press release under the heading “Non-U.S. GAAP Financial Measures” as well as the accompanying reconciliation tables at the end of this presentation and today's press release. Q3 26 Financial Highlights 21.1% 25.3% Q3 25 Q3 26 $1.96 $2.66 Q3 25 Q3 26 $804.6 $874.5 Q3 25 Q3 26 Net Sales $M Adj. OP Margin Adj.-Diluted EPS +35.7% YoY+420 bps YoY +8.7% Reported +11.9% Organic (1)
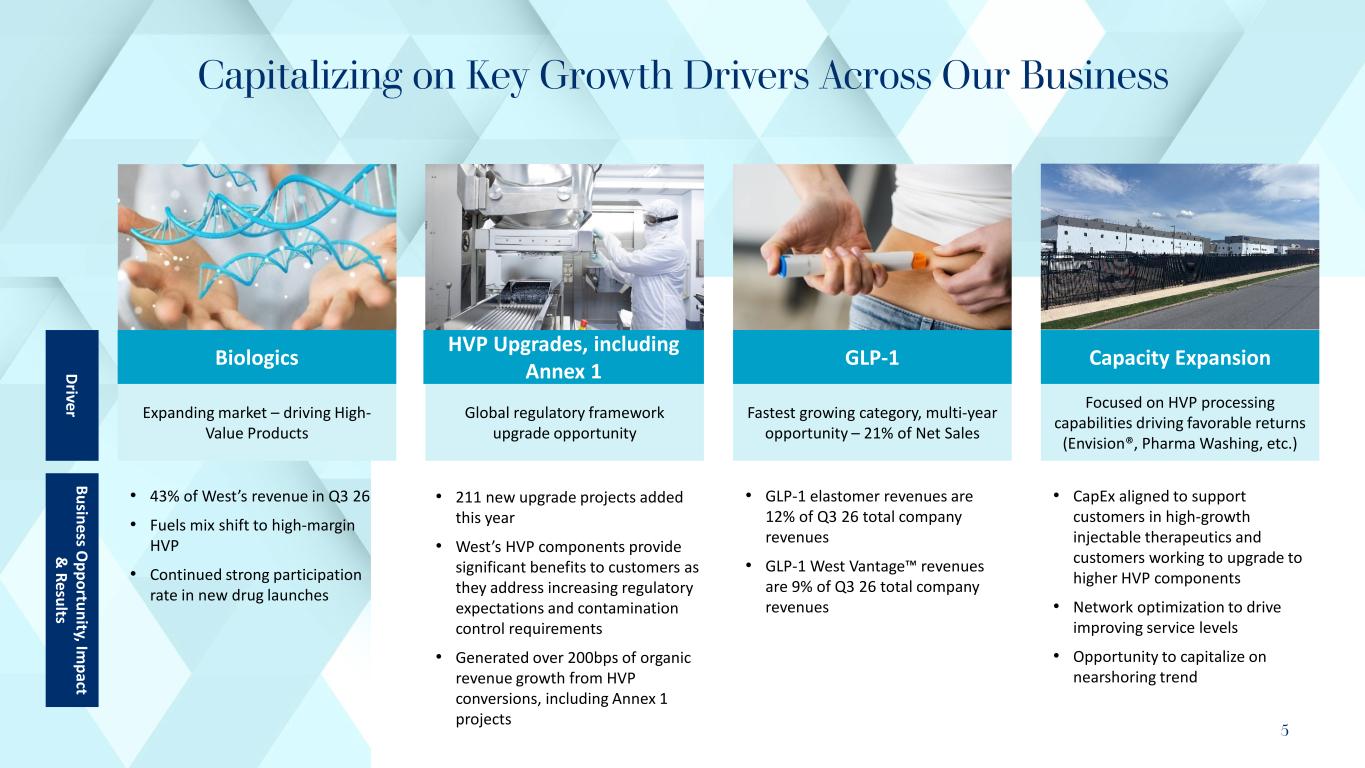
5 Capitalizing on Key Growth Drivers Across Our Business Biologics Expanding market – driving High- Value Products Global regulatory framework upgrade opportunity GLP-1 Fastest growing category, multi-year opportunity – 21% of Net Sales Capacity Expansion Focused on HVP processing capabilities driving favorable returns (Envision®, Pharma Washing, etc.) • 43% of West’s revenue in Q3 26 • Fuels mix shift to high-margin HVP • Continued strong participation rate in new drug launches • 211 new upgrade projects added this year • West’s HVP components provide significant benefits to customers as they address increasing regulatory expectations and contamination control requirements • Generated over 200bps of organic revenue growth from HVP conversions, including Annex 1 projects • GLP-1 elastomer revenues are 12% of Q3 26 total company revenues • GLP-1 West Vantage revenues are 9% of Q3 26 total company revenues • CapEx aligned to support customers in high-growth injectable therapeutics and customers working to upgrade to higher HVP components • Network optimization to drive improving service levels • Opportunity to capitalize on nearshoring trend Business O pportunity, Im pact & Results Driver HVP Upgrades, including Annex 1
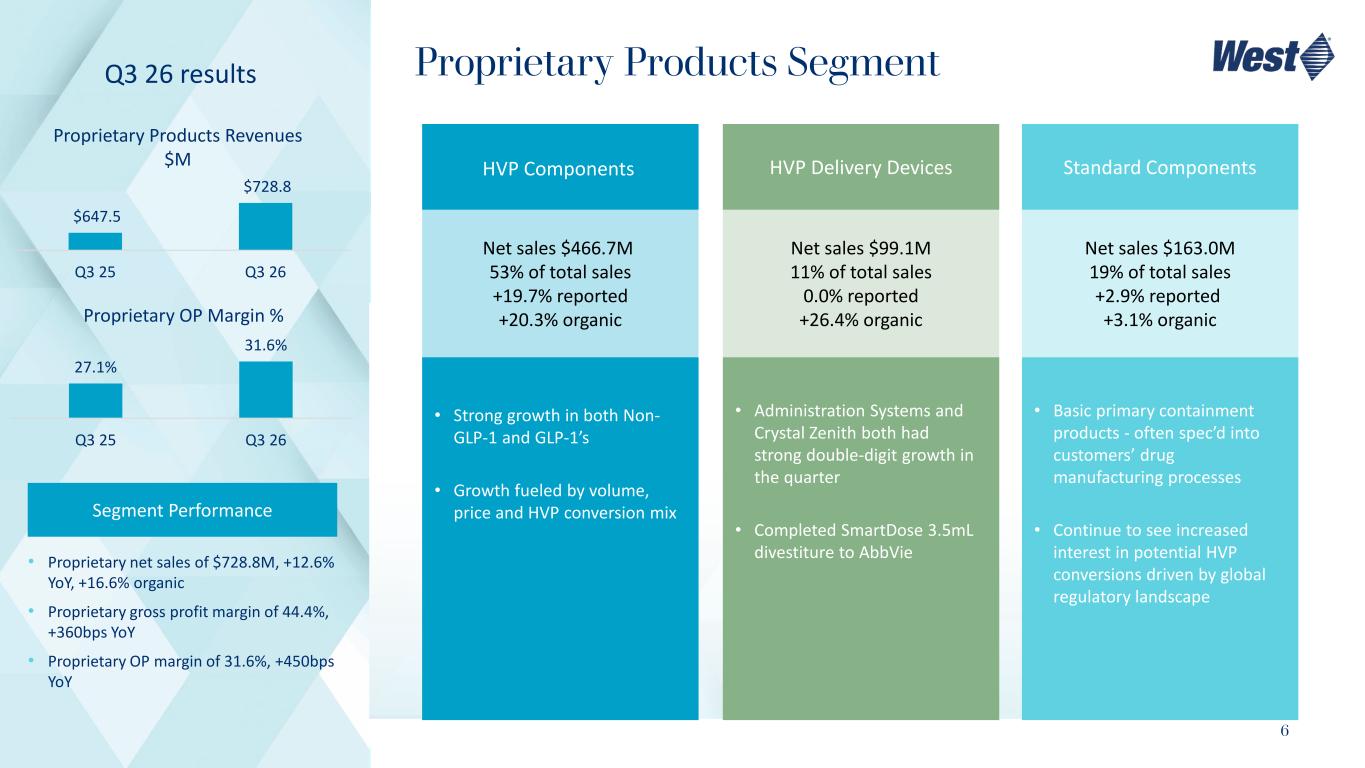
6 Proprietary Products Segment Segment Performance • Proprietary net sales of $728.8M, +12.6% YoY, +16.6% organic • Proprietary gross profit margin of 44.4%, +360bps YoY • Proprietary OP margin of 31.6%, +450bps YoY Proprietary Products Revenues $M $647.5 $728.8 Q3 25 Q3 26 Q3 26 results Proprietary OP Margin % 27.1% 31.6% Q3 25 Q3 26 Net sales $466.7M 53% of total sales +19.7% reported +20.3% organic Net sales $99.1M 11% of total sales 0.0% reported +26.4% organic Net sales $163.0M 19% of total sales +2.9% reported +3.1% organic • Strong growth in both Non- GLP-1 and GLP-1’s • Growth fueled by volume, price and HVP conversion mix • Administration Systems and Crystal Zenith both had strong double-digit growth in the quarter • Completed SmartDose 3.5mL divestiture to AbbVie • Basic primary containment products - often spec’d into customers’ drug manufacturing processes • Continue to see increased interest in potential HVP conversions driven by global regulatory landscape HVP Components HVP Delivery Devices Standard Components
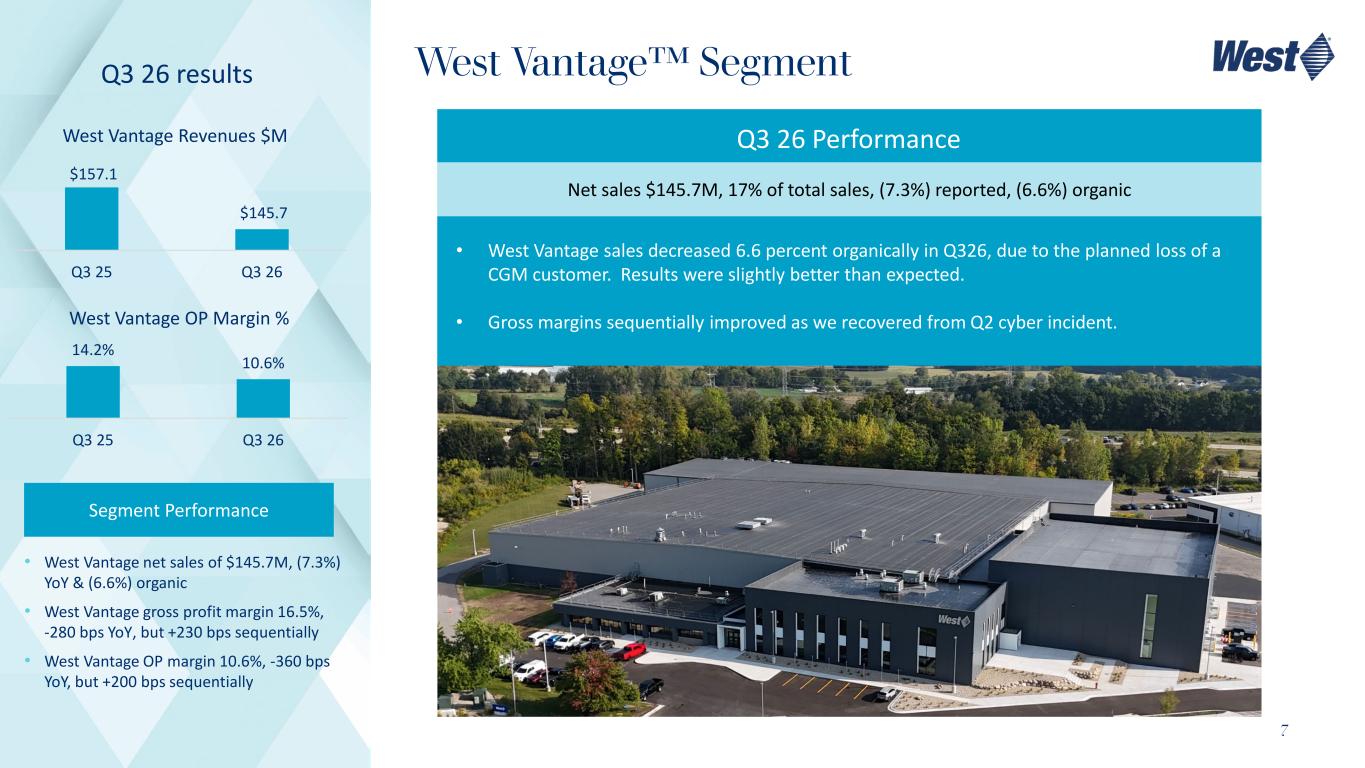
7 West Vantage Segment Segment Performance • West Vantage net sales of $145.7M, (7.3%) YoY & (6.6%) organic • West Vantage gross profit margin 16.5%, -280 bps YoY, but +230 bps sequentially • West Vantage OP margin 10.6%, -360 bps YoY, but +200 bps sequentially West Vantage Revenues $M $157.1 $145.7 Q3 25 Q3 26 Q3 26 results West Vantage OP Margin % 14.2% 10.6% Q3 25 Q3 26 Net sales $145.7M, 17% of total sales, (7.3%) reported, (6.6%) organic • West Vantage sales decreased 6.6 percent organically in Q326, due to the planned loss of a CGM customer. Results were slightly better than expected. • Gross margins sequentially improved as we recovered from Q2 cyber incident. Q3 26 Performance
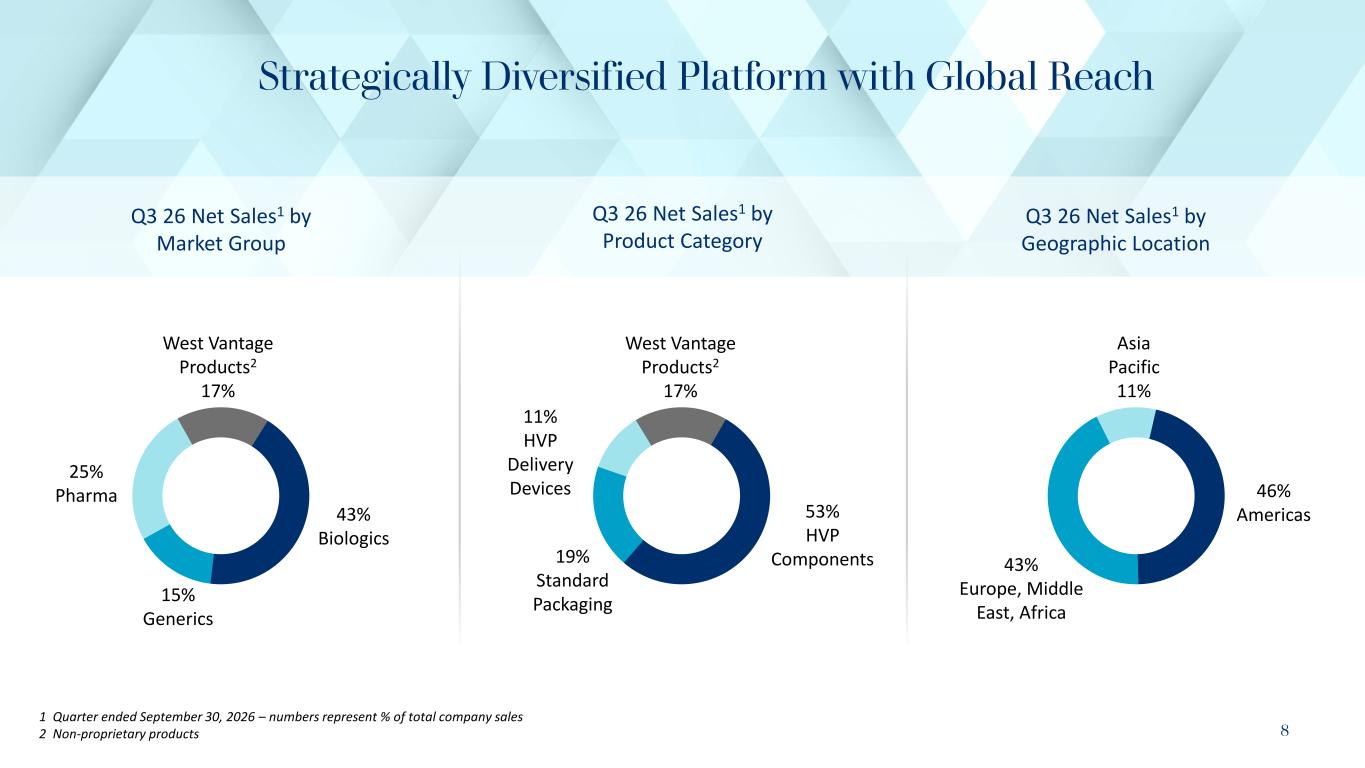
8 Strategically Diversified Platform with Global Reach 1 Quarter ended September 30, 2026 – numbers represent % of total company sales 2 Non-proprietary products 46% Americas 43% Europe, Middle East, Africa Asia Pacific 11% Q3 26 Net Sales1 by Geographic Location 53% HVP Components19% Standard Packaging 11% HVP Delivery Devices West Vantage Products2 17% Q3 26 Net Sales1 by Product Category 43% Biologics 15% Generics 25% Pharma Q3 26 Net Sales1 by Market Group West Vantage Products2 17%
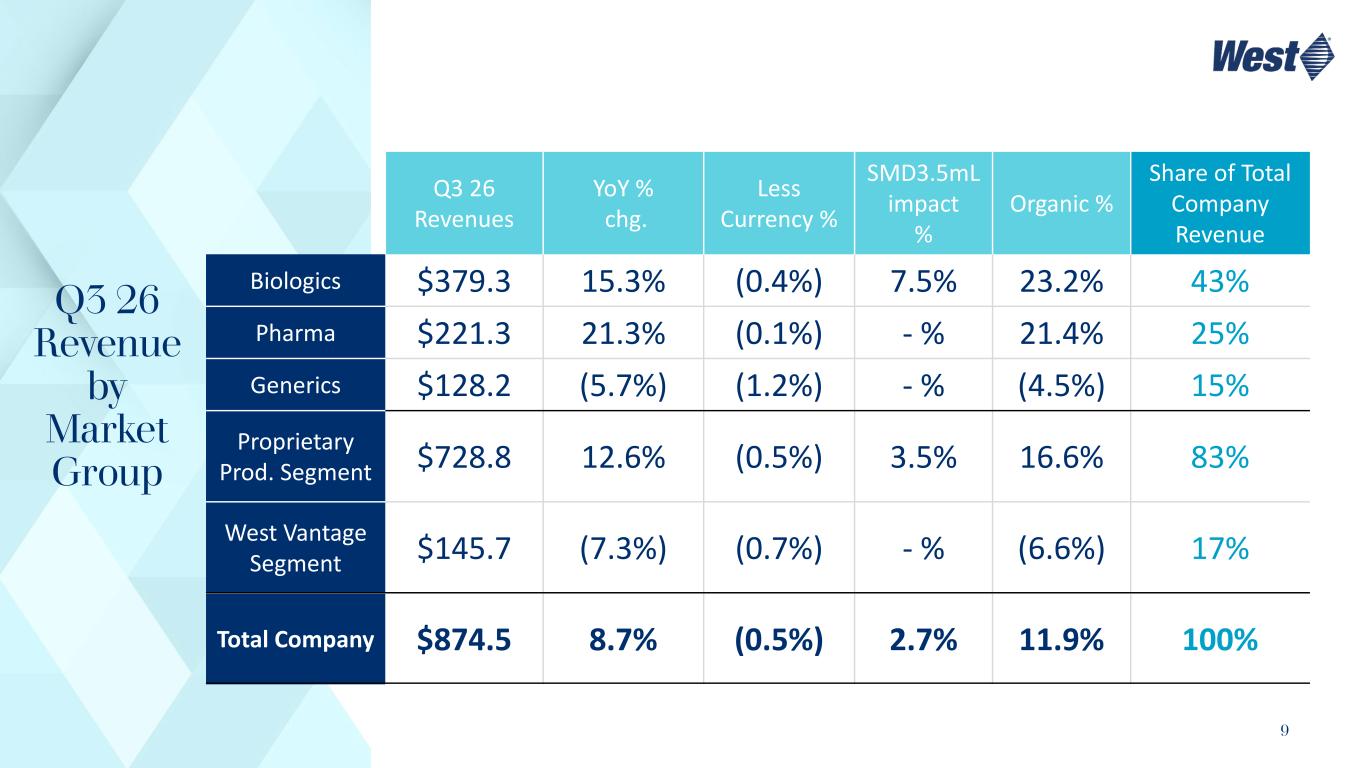
9 Q3 26 Revenue by Market Group Q3 26 Revenues YoY % chg. Less Currency % SMD3.5mL impact % Organic % Share of Total Company Revenue Biologics $379.3 15.3% (0.4%) 7.5% 23.2% 43% Pharma $221.3 21.3% (0.1%) - % 21.4% 25% Generics $128.2 (5.7%) (1.2%) - % (4.5%) 15% Proprietary Prod. Segment $728.8 12.6% (0.5%) 3.5% 16.6% 83% West Vantage Segment $145.7 (7.3%) (0.7%) - % (6.6%) 17% Total Company $874.5 8.7% (0.5%) 2.7% 11.9% 100%
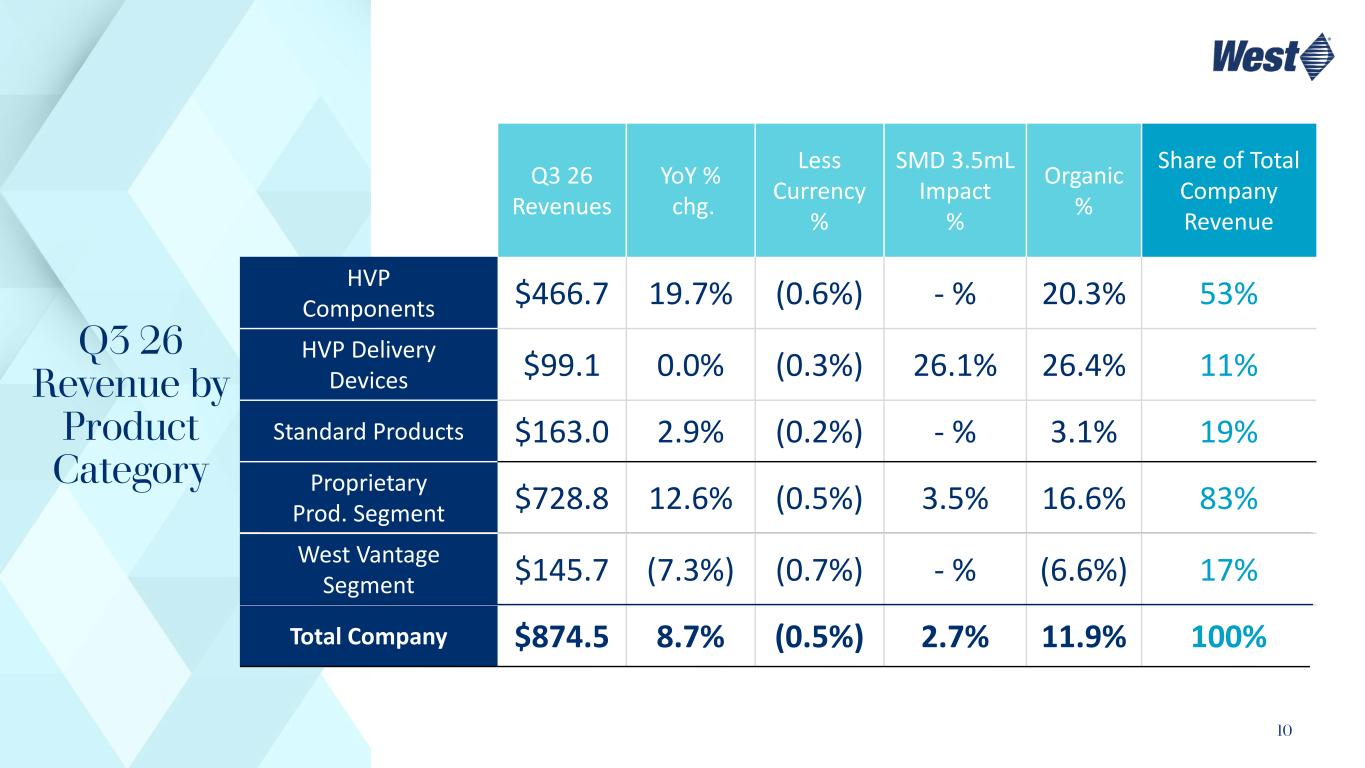
10 Q3 26 Revenue by Product Category Q3 26 Revenues YoY % chg. Less Currency % SMD 3.5mL Impact % Organic % Share of Total Company Revenue HVP Components $466.7 19.7% (0.6%) - % 20.3% 53% HVP Delivery Devices $99.1 0.0% (0.3%) 26.1% 26.4% 11% Standard Products $163.0 2.9% (0.2%) - % 3.1% 19% Proprietary Prod. Segment $728.8 12.6% (0.5%) 3.5% 16.6% 83% West Vantage Segment $145.7 (7.3%) (0.7%) - % (6.6%) 17% Total Company $874.5 8.7% (0.5%) 2.7% 11.9% 100%
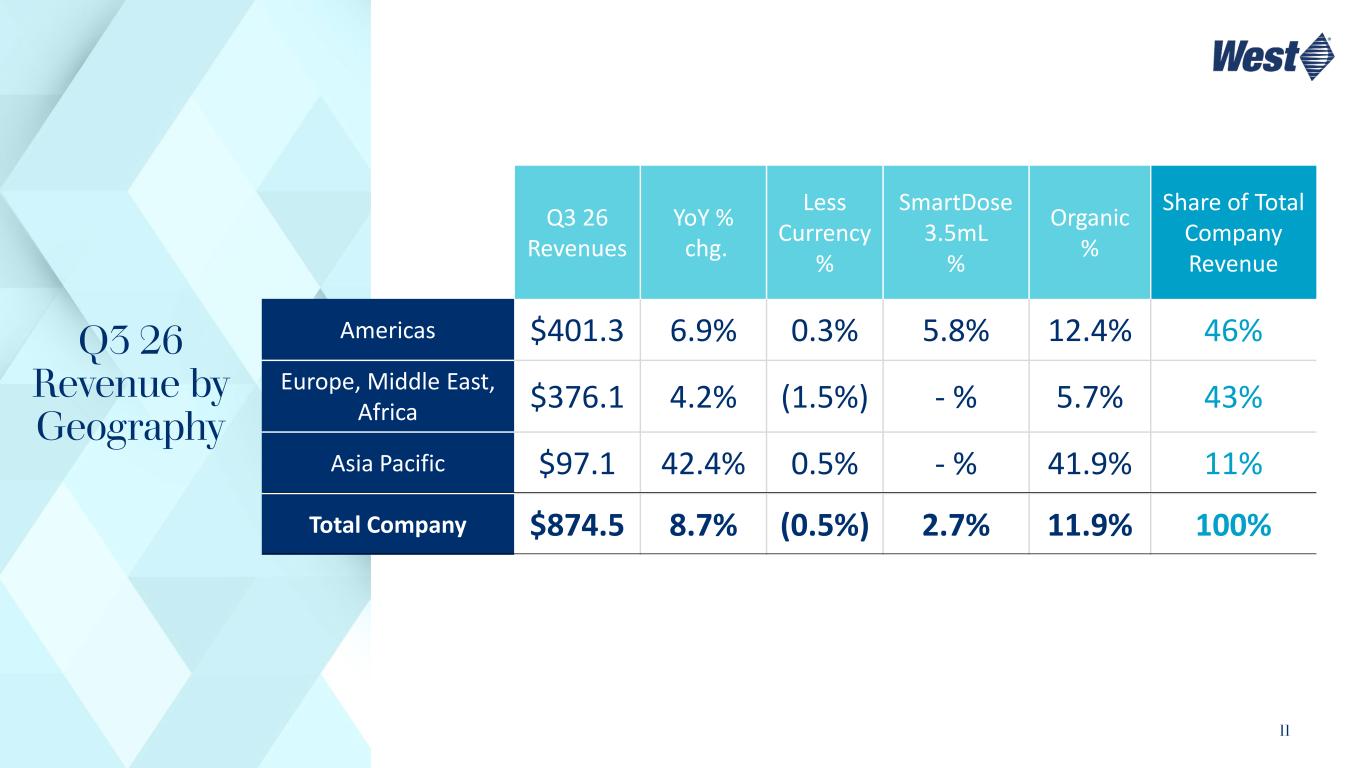
11 Q3 26 Revenue by Geography Q3 26 Revenues YoY % chg. Less Currency % SmartDose 3.5mL % Organic % Share of Total Company Revenue Americas $401.3 6.9% 0.3% 5.8% 12.4% 46% Europe, Middle East, Africa $376.1 4.2% (1.5%) - % 5.7% 43% Asia Pacific $97.1 42.4% 0.5% - % 41.9% 11% Total Company $874.5 8.7% (0.5%) 2.7% 11.9% 100%
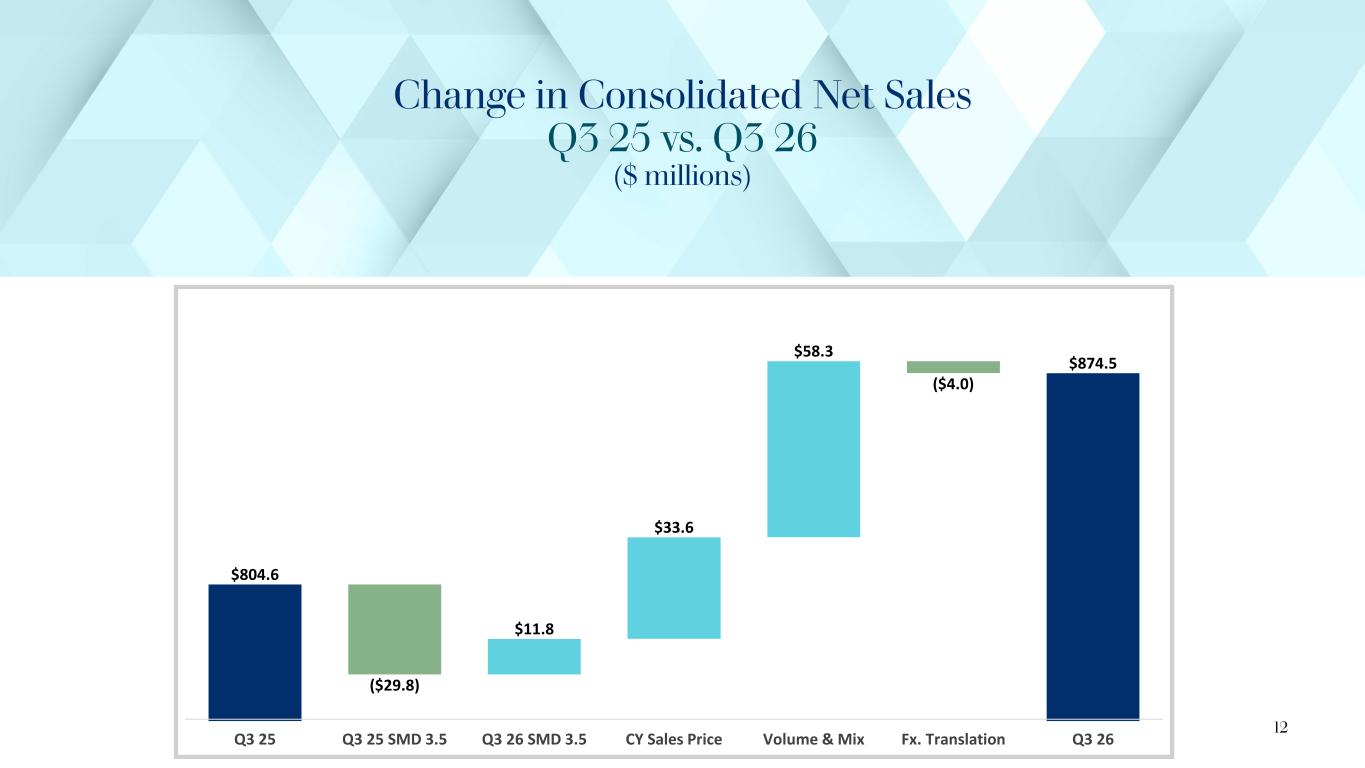
Change in Consolidated Net Sales Q3 25 vs. Q3 26 ($ millions) $804.6 ($29.8) $11.8 $33.6 ($4.0) $874.5 $58.3 Q3 25 Q3 25 SMD 3.5 Q3 26 SMD 3.5 CY Sales Price Volume & Mix Fx. Translation Q3 26 12
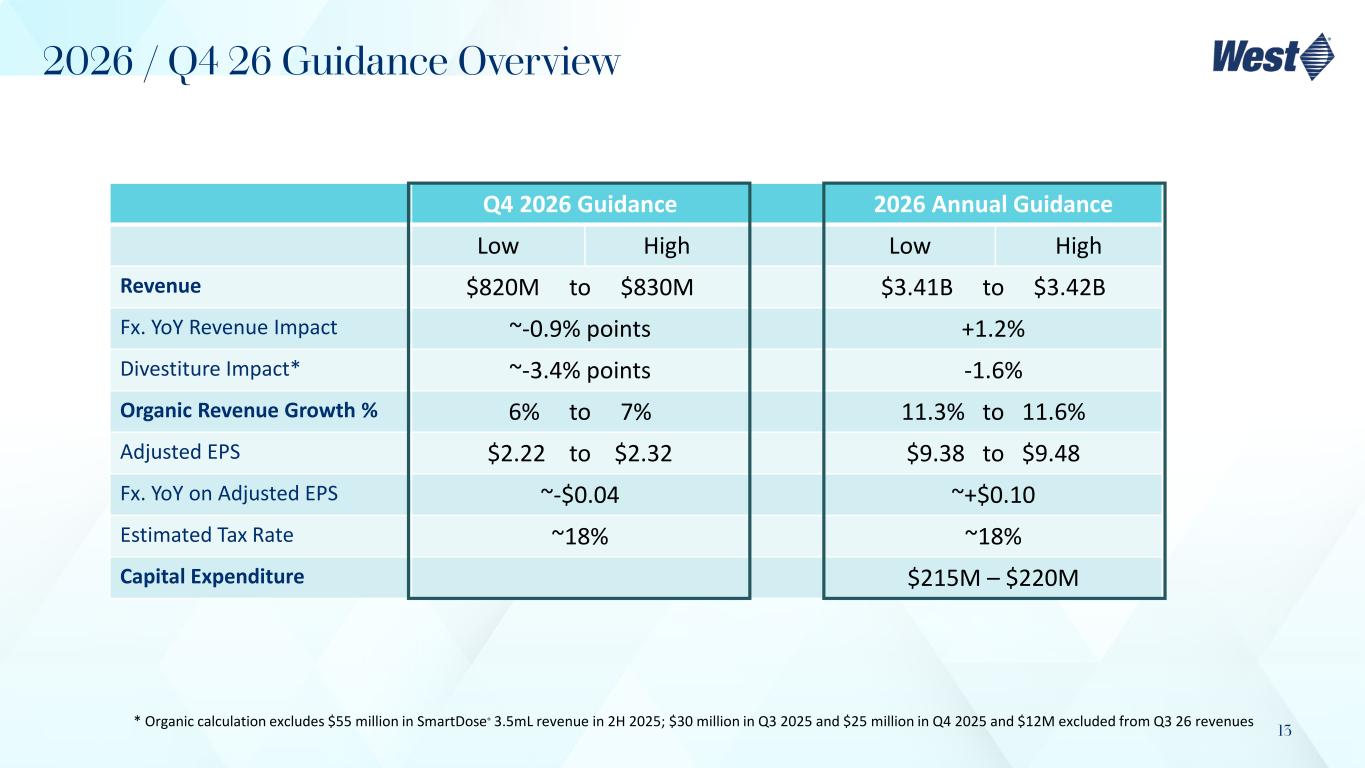
13 Q4 2026 Guidance 2026 Annual Guidance Low High Low High Revenue $820M to $830M $3.41B to $3.42B Fx. YoY Revenue Impact ~-0.9% points +1.2% Divestiture Impact* ~-3.4% points -1.6% Organic Revenue Growth % 6% to 7% 11.3% to 11.6% Adjusted EPS $2.22 to $2.32 $9.38 to $9.48 Fx. YoY on Adjusted EPS ~-$0.04 ~+$0.10 Estimated Tax Rate ~18% ~18% Capital Expenditure $215M – $220M 2026 / Q4 26 Guidance Overview * Organic calculation excludes $55 million in SmartDose® 3.5mL revenue in 2H 2025; $30 million in Q3 2025 and $25 million in Q4 2025 and $12M excluded from Q3 26 revenues

Investor Relations contact: https://investor.westpharma.com /contact-investor-relations www.westpharma.com
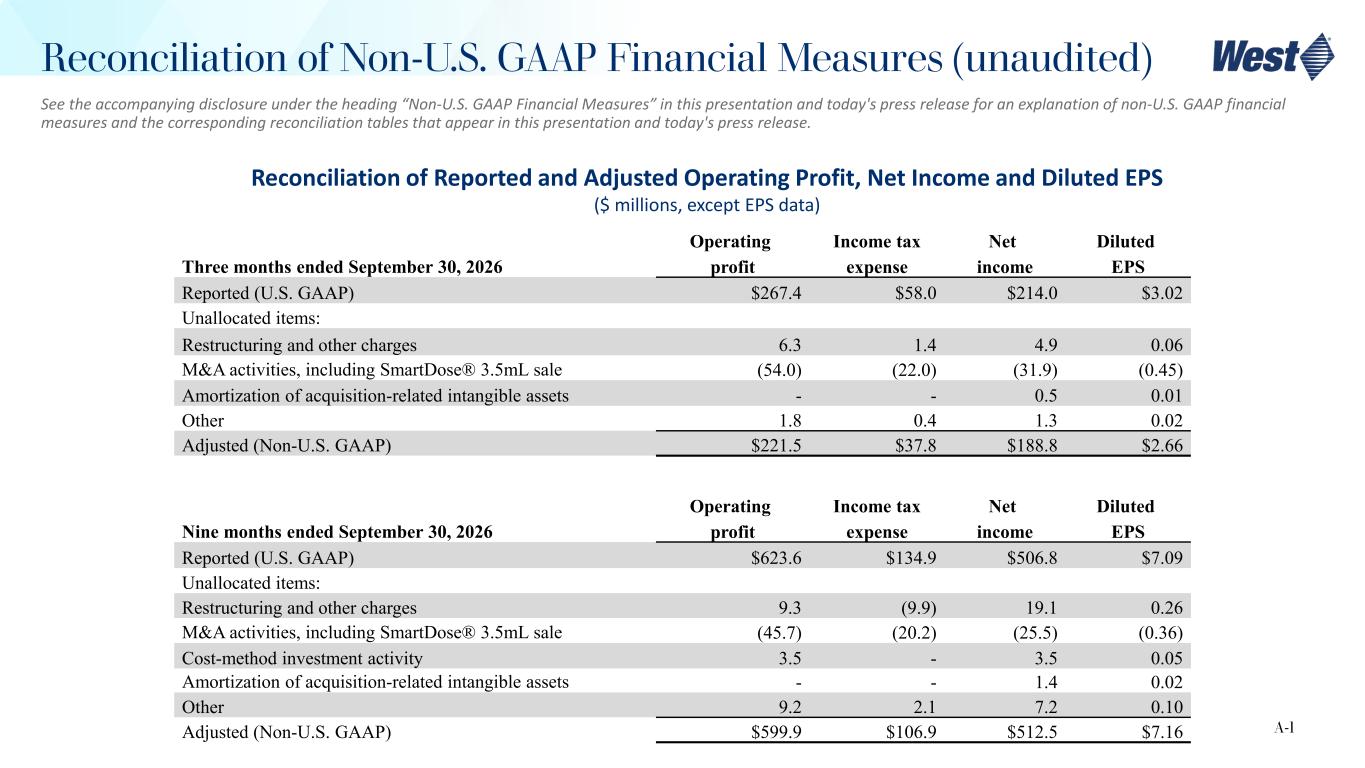
See the accompanying disclosure under the heading “Non-U.S. GAAP Financial Measures” in this presentation and today's press release for an explanation of non-U.S. GAAP financial measures and the corresponding reconciliation tables that appear in this presentation and today's press release. Reconciliation of Reported and Adjusted Operating Profit, Net Income and Diluted EPS ($ millions, except EPS data) Three months ended September 30, 2026 Operating profit Income tax expense Net income Diluted EPS Reported (U.S. GAAP) $267.4 $58.0 $214.0 $3.02 Unallocated items: Restructuring and other charges 6.3 1.4 4.9 0.06 M&A activities, including SmartDose® 3.5mL sale (54.0) (22.0) (31.9) (0.45) Amortization of acquisition-related intangible assets - - 0.5 0.01 Other 1.8 0.4 1.3 0.02 Adjusted (Non-U.S. GAAP) $221.5 $37.8 $188.8 $2.66 A-1 Reconciliation of Non-U.S. GAAP Financial Measures (unaudited) Nine months ended September 30, 2026 Operating profit Income tax expense Net income Diluted EPS Reported (U.S. GAAP) $623.6 $134.9 $506.8 $7.09 Unallocated items: Restructuring and other charges 9.3 (9.9) 19.1 0.26 M&A activities, including SmartDose® 3.5mL sale (45.7) (20.2) (25.5) (0.36) Cost-method investment activity 3.5 - 3.5 0.05 Amortization of acquisition-related intangible assets - - 1.4 0.02 Other 9.2 2.1 7.2 0.10 Adjusted (Non-U.S. GAAP) $599.9 $106.9 $512.5 $7.16
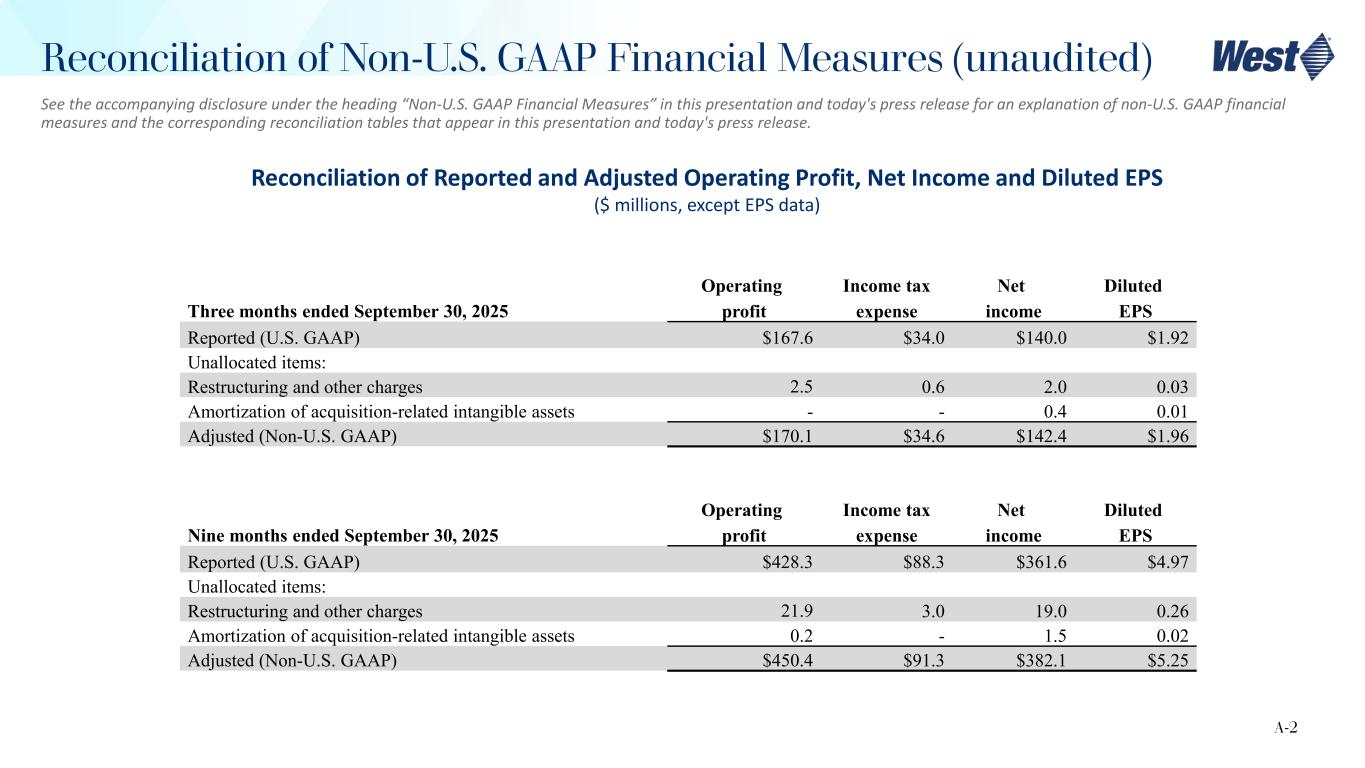
See the accompanying disclosure under the heading “Non-U.S. GAAP Financial Measures” in this presentation and today's press release for an explanation of non-U.S. GAAP financial measures and the corresponding reconciliation tables that appear in this presentation and today's press release. Reconciliation of Reported and Adjusted Operating Profit, Net Income and Diluted EPS ($ millions, except EPS data) Nine months ended September 30, 2025 Operating profit Income tax expense Net income Diluted EPS Reported (U.S. GAAP) $428.3 $88.3 $361.6 $4.97 Unallocated items: Restructuring and other charges 21.9 3.0 19.0 0.26 Amortization of acquisition-related intangible assets 0.2 - 1.5 0.02 Adjusted (Non-U.S. GAAP) $450.4 $91.3 $382.1 $5.25 A-2 Reconciliation of Non-U.S. GAAP Financial Measures (unaudited) Three months ended September 30, 2025 Operating profit Income tax expense Net income Diluted EPS Reported (U.S. GAAP) $167.6 $34.0 $140.0 $1.92 Unallocated items: Restructuring and other charges 2.5 0.6 2.0 0.03 Amortization of acquisition-related intangible assets - - 0.4 0.01 Adjusted (Non-U.S. GAAP) $170.1 $34.6 $142.4 $1.96
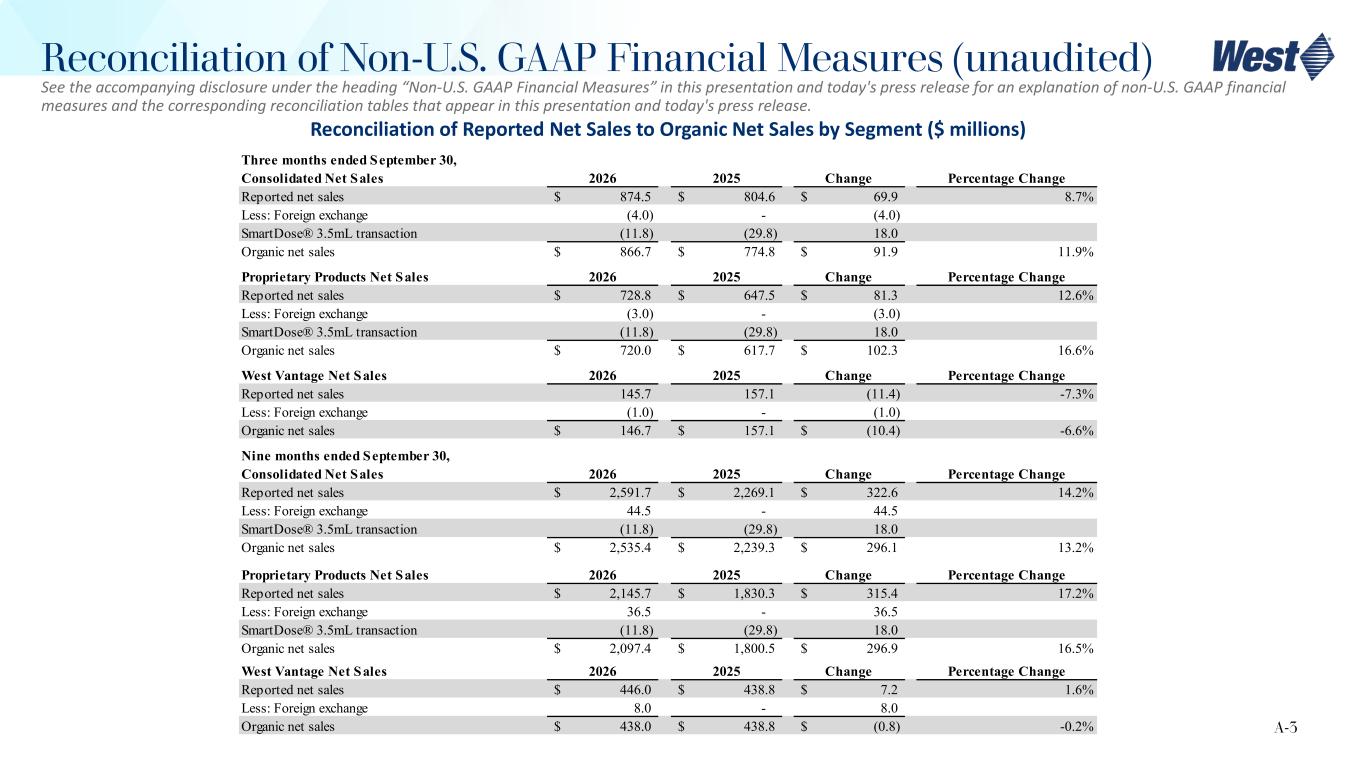
Reconciliation of Reported Net Sales to Organic Net Sales by Segment ($ millions) A-3 Reconciliation of Non-U.S. GAAP Financial Measures (unaudited) See the accompanying disclosure under the heading “Non-U.S. GAAP Financial Measures” in this presentation and today's press release for an explanation of non-U.S. GAAP financial measures and the corresponding reconciliation tables that appear in this presentation and today's press release. Three months ended September 30, Consolidated Net Sales 2026 2025 Change Percentage Change Reported net sales $ 874.5 $ 804.6 $ 69.9 8.7% Less: Foreign exchange (4.0) - (4.0) SmartDose® 3.5mL transaction (11.8) (29.8) 18.0 Organic net sales $ 866.7 $ 774.8 $ 91.9 11.9% Proprietary Products Net Sales 2026 2025 Change Percentage Change Reported net sales $ 728.8 $ 647.5 $ 81.3 12.6% Less: Foreign exchange (3.0) - (3.0) SmartDose® 3.5mL transaction (11.8) (29.8) 18.0 Organic net sales $ 720.0 $ 617.7 $ 102.3 16.6% West Vantage Net Sales 2026 2025 Change Percentage Change Reported net sales 145.7 157.1 (11.4) -7.3% Less: Foreign exchange (1.0) - (1.0) Organic net sales $ 146.7 $ 157.1 $ (10.4) -6.6% Nine months ended September 30, Consolidated Net Sales 2026 2025 Change Percentage Change Reported net sales $ 2,591.7 $ 2,269.1 $ 322.6 14.2% Less: Foreign exchange 44.5 - 44.5 SmartDose® 3.5mL transaction (11.8) (29.8) 18.0 Organic net sales $ 2,535.4 $ 2,239.3 $ 296.1 13.2% Proprietary Products Net Sales 2026 2025 Change Percentage Change Reported net sales $ 2,145.7 $ 1,830.3 $ 315.4 17.2% Less: Foreign exchange 36.5 - 36.5 SmartDose® 3.5mL transaction (11.8) (29.8) 18.0 Organic net sales $ 2,097.4 $ 1,800.5 $ 296.9 16.5% West Vantage Net Sales 2026 2025 Change Percentage Change Reported net sales $ 446.0 $ 438.8 $ 7.2 1.6% Less: Foreign exchange 8.0 - 8.0 Organic net sales $ 438.0 $ 438.8 $ (0.8) -0.2%
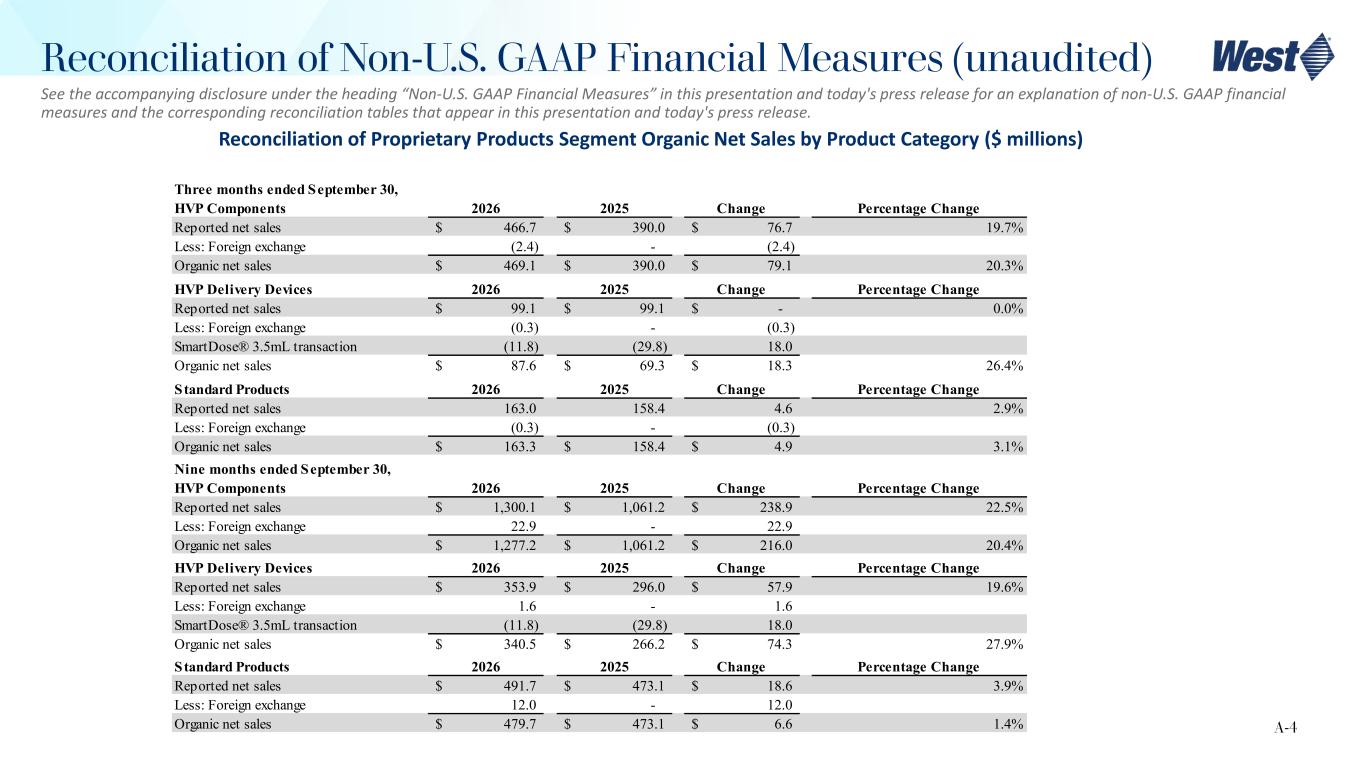
Reconciliation of Proprietary Products Segment Organic Net Sales by Product Category ($ millions) A-4 Reconciliation of Non-U.S. GAAP Financial Measures (unaudited) See the accompanying disclosure under the heading “Non-U.S. GAAP Financial Measures” in this presentation and today's press release for an explanation of non-U.S. GAAP financial measures and the corresponding reconciliation tables that appear in this presentation and today's press release. Three months ended September 30, HVP Components 2026 2025 Change Percentage Change Reported net sales $ 466.7 $ 390.0 $ 76.7 19.7% Less: Foreign exchange (2.4) - (2.4) Organic net sales $ 469.1 $ 390.0 $ 79.1 20.3% HVP Delivery Devices 2026 2025 Change Percentage Change Reported net sales $ 99.1 $ 99.1 $ - 0.0% Less: Foreign exchange (0.3) - (0.3) SmartDose® 3.5mL transaction (11.8) (29.8) 18.0 Organic net sales $ 87.6 $ 69.3 $ 18.3 26.4% Standard Products 2026 2025 Change Percentage Change Reported net sales 163.0 158.4 4.6 2.9% Less: Foreign exchange (0.3) - (0.3) Organic net sales $ 163.3 $ 158.4 $ 4.9 3.1% Nine months ended September 30, HVP Components 2026 2025 Change Percentage Change Reported net sales $ 1,300.1 $ 1,061.2 $ 238.9 22.5% Less: Foreign exchange 22.9 - 22.9 Organic net sales $ 1,277.2 $ 1,061.2 $ 216.0 20.4% HVP Delivery Devices 2026 2025 Change Percentage Change Reported net sales $ 353.9 $ 296.0 $ 57.9 19.6% Less: Foreign exchange 1.6 - 1.6 SmartDose® 3.5mL transaction (11.8) (29.8) 18.0 Organic net sales $ 340.5 $ 266.2 $ 74.3 27.9% Standard Products 2026 2025 Change Percentage Change Reported net sales $ 491.7 $ 473.1 $ 18.6 3.9% Less: Foreign exchange 12.0 - 12.0 Organic net sales $ 479.7 $ 473.1 $ 6.6 1.4%
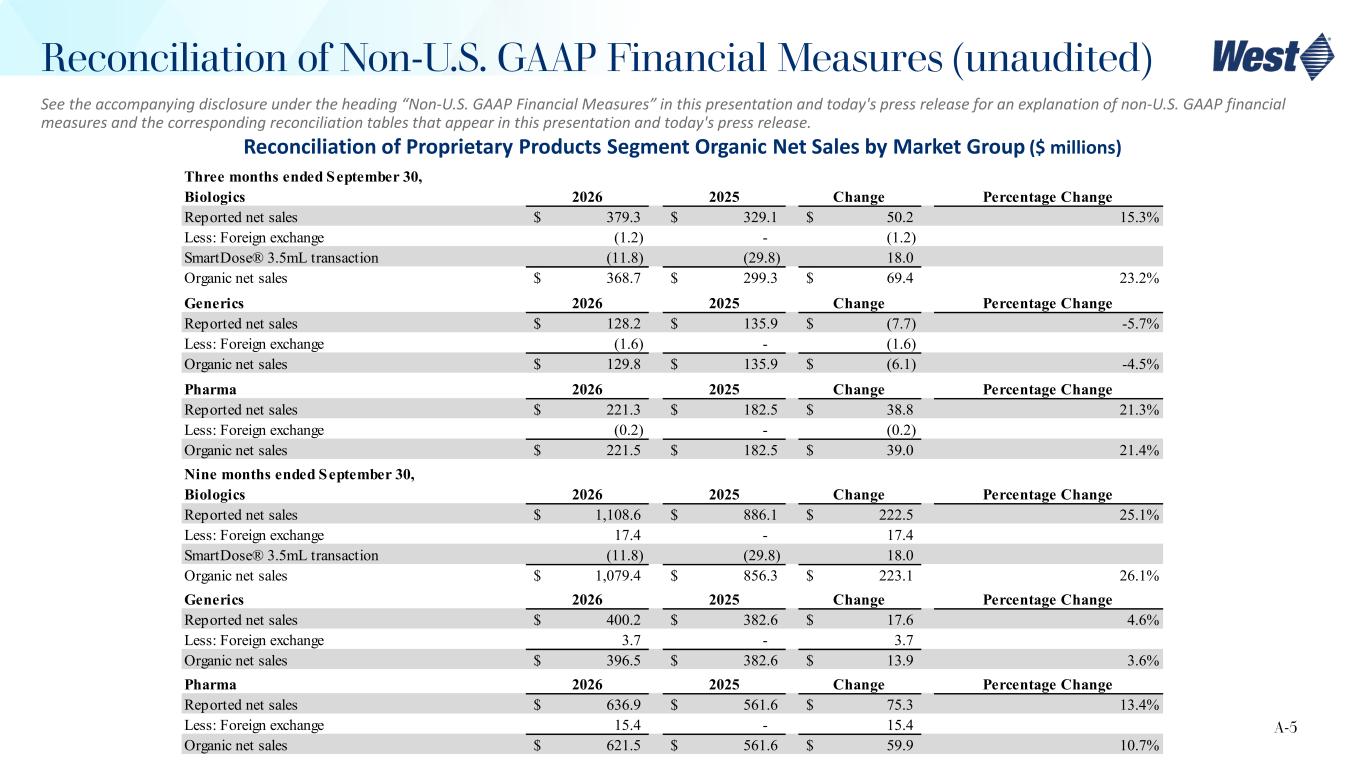
Reconciliation of Proprietary Products Segment Organic Net Sales by Market Group ($ millions) A-5 See the accompanying disclosure under the heading “Non-U.S. GAAP Financial Measures” in this presentation and today's press release for an explanation of non-U.S. GAAP financial measures and the corresponding reconciliation tables that appear in this presentation and today's press release. Reconciliation of Non-U.S. GAAP Financial Measures (unaudited) Three months ended September 30, Biologics 2026 2025 Change Percentage Change Reported net sales $ 379.3 $ 329.1 $ 50.2 15.3% Less: Foreign exchange (1.2) - (1.2) SmartDose® 3.5mL transaction (11.8) (29.8) 18.0 Organic net sales $ 368.7 $ 299.3 $ 69.4 23.2% Generics 2026 2025 Change Percentage Change Reported net sales $ 128.2 $ 135.9 $ (7.7) -5.7% Less: Foreign exchange (1.6) - (1.6) Organic net sales $ 129.8 $ 135.9 $ (6.1) -4.5% Pharma 2026 2025 Change Percentage Change Reported net sales $ 221.3 $ 182.5 $ 38.8 21.3% Less: Foreign exchange (0.2) - (0.2) Organic net sales $ 221.5 $ 182.5 $ 39.0 21.4% Nine months ended September 30, Biologics 2026 2025 Change Percentage Change Reported net sales $ 1,108.6 $ 886.1 $ 222.5 25.1% Less: Foreign exchange 17.4 - 17.4 SmartDose® 3.5mL transaction (11.8) (29.8) 18.0 Organic net sales $ 1,079.4 $ 856.3 $ 223.1 26.1% Generics 2026 2025 Change Percentage Change Reported net sales $ 400.2 $ 382.6 $ 17.6 4.6% Less: Foreign exchange 3.7 - 3.7 Organic net sales $ 396.5 $ 382.6 $ 13.9 3.6% Pharma 2026 2025 Change Percentage Change Reported net sales $ 636.9 $ 561.6 $ 75.3 13.4% Less: Foreign exchange 15.4 - 15.4 Organic net sales $ 621.5 $ 561.6 $ 59.9 10.7%
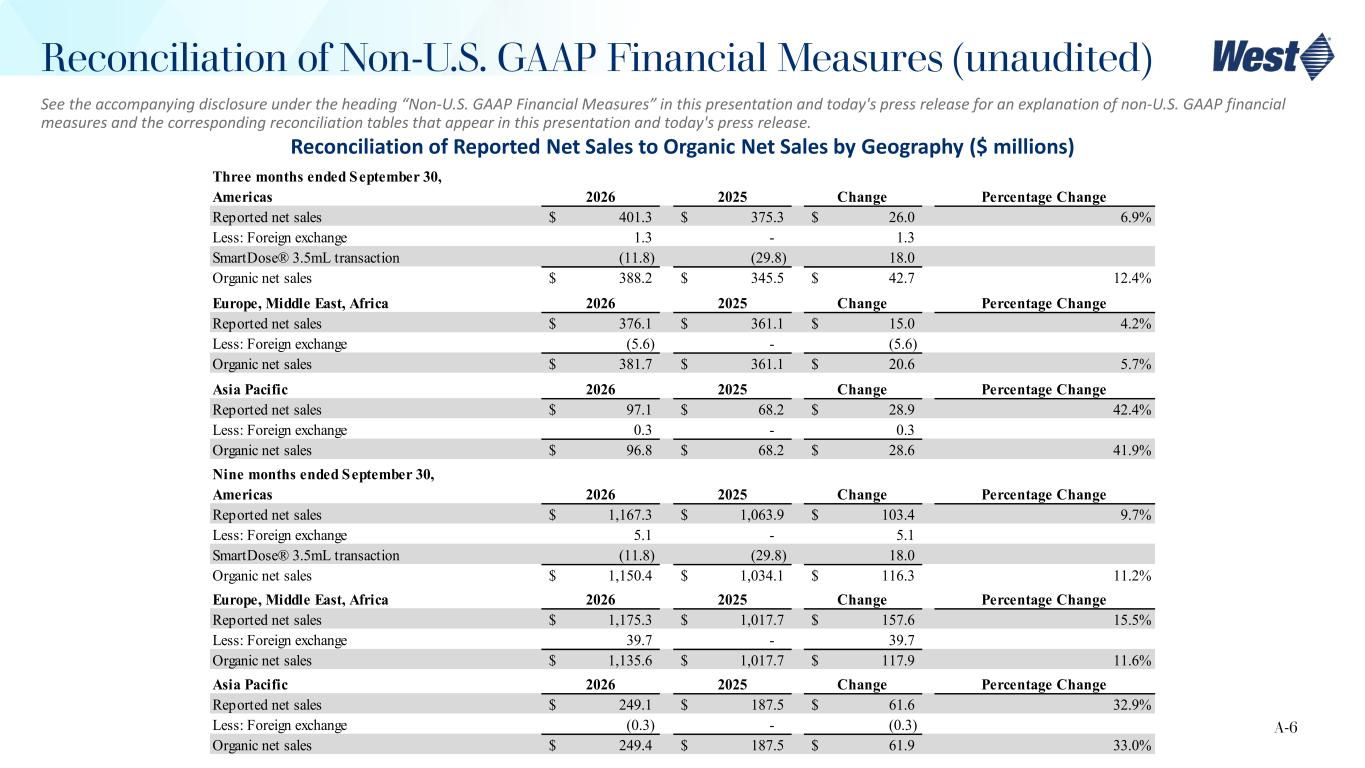
Reconciliation of Reported Net Sales to Organic Net Sales by Geography ($ millions) A-6 See the accompanying disclosure under the heading “Non-U.S. GAAP Financial Measures” in this presentation and today's press release for an explanation of non-U.S. GAAP financial measures and the corresponding reconciliation tables that appear in this presentation and today's press release. Reconciliation of Non-U.S. GAAP Financial Measures (unaudited) Three months ended September 30, Americas 2026 2025 Change Percentage Change Reported net sales $ 401.3 $ 375.3 $ 26.0 6.9% Less: Foreign exchange 1.3 - 1.3 SmartDose® 3.5mL transaction (11.8) (29.8) 18.0 Organic net sales $ 388.2 $ 345.5 $ 42.7 12.4% Europe, Middle East, Africa 2026 2025 Change Percentage Change Reported net sales $ 376.1 $ 361.1 $ 15.0 4.2% Less: Foreign exchange (5.6) - (5.6) Organic net sales $ 381.7 $ 361.1 $ 20.6 5.7% Asia Pacific 2026 2025 Change Percentage Change Reported net sales $ 97.1 $ 68.2 $ 28.9 42.4% Less: Foreign exchange 0.3 - 0.3 Organic net sales $ 96.8 $ 68.2 $ 28.6 41.9% Nine months ended September 30, Americas 2026 2025 Change Percentage Change Reported net sales $ 1,167.3 $ 1,063.9 $ 103.4 9.7% Less: Foreign exchange 5.1 - 5.1 SmartDose® 3.5mL transaction (11.8) (29.8) 18.0 Organic net sales $ 1,150.4 $ 1,034.1 $ 116.3 11.2% Europe, Middle East, Africa 2026 2025 Change Percentage Change Reported net sales $ 1,175.3 $ 1,017.7 $ 157.6 15.5% Less: Foreign exchange 39.7 - 39.7 Organic net sales $ 1,135.6 $ 1,017.7 $ 117.9 11.6% Asia Pacific 2026 2025 Change Percentage Change Reported net sales $ 249.1 $ 187.5 $ 61.6 32.9% Less: Foreign exchange (0.3) - (0.3) Organic net sales $ 249.4 $ 187.5 $ 61.9 33.0%
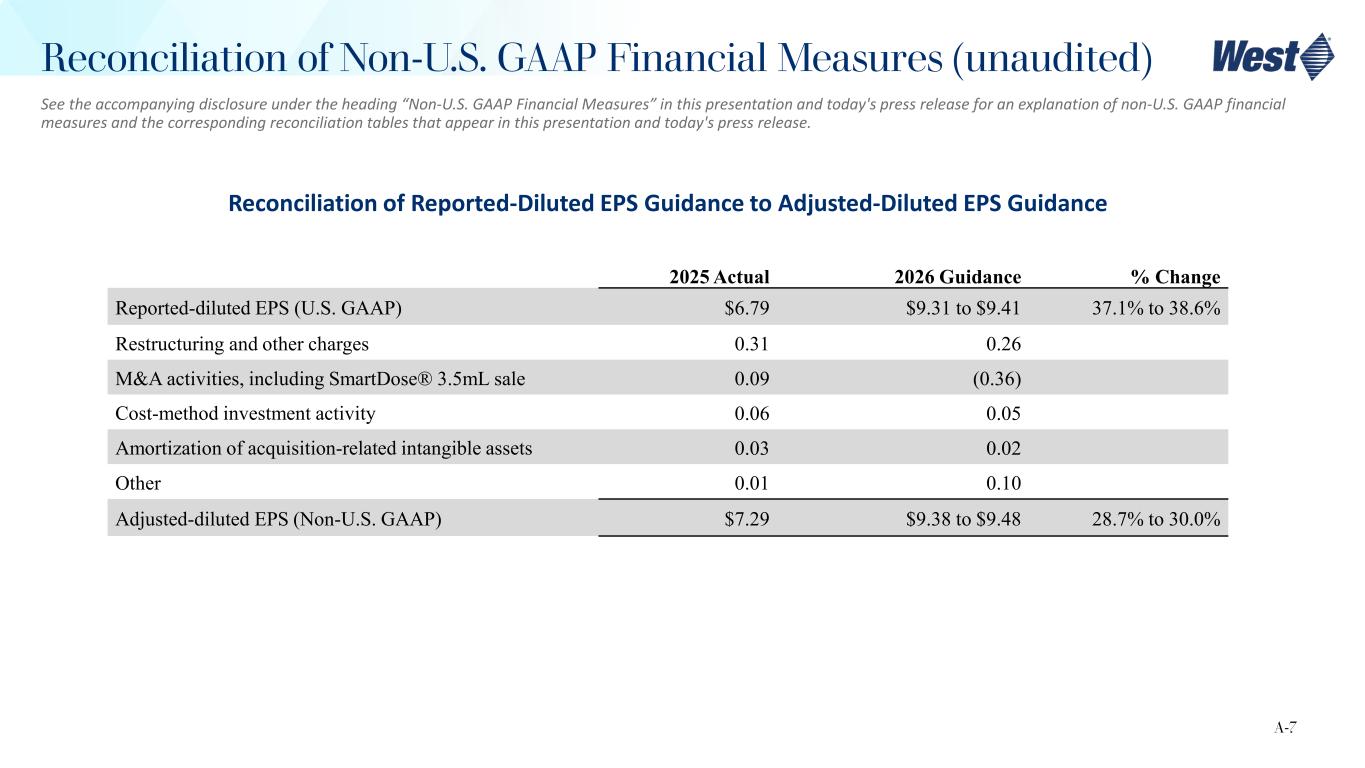
Reconciliation of Reported-Diluted EPS Guidance to Adjusted-Diluted EPS Guidance 2025 Actual 2026 Guidance % Change Reported-diluted EPS (U.S. GAAP) $6.79 $9.31 to $9.41 37.1% to 38.6% Restructuring and other charges 0.31 0.26 M&A activities, including SmartDose® 3.5mL sale 0.09 (0.36) Cost-method investment activity 0.06 0.05 Amortization of acquisition-related intangible assets 0.03 0.02 Other 0.01 0.10 Adjusted-diluted EPS (Non-U.S. GAAP) $7.29 $9.38 to $9.48 28.7% to 30.0% A-7 Reconciliation of Non-U.S. GAAP Financial Measures (unaudited) See the accompanying disclosure under the heading “Non-U.S. GAAP Financial Measures” in this presentation and today's press release for an explanation of non-U.S. GAAP financial measures and the corresponding reconciliation tables that appear in this presentation and today's press release.
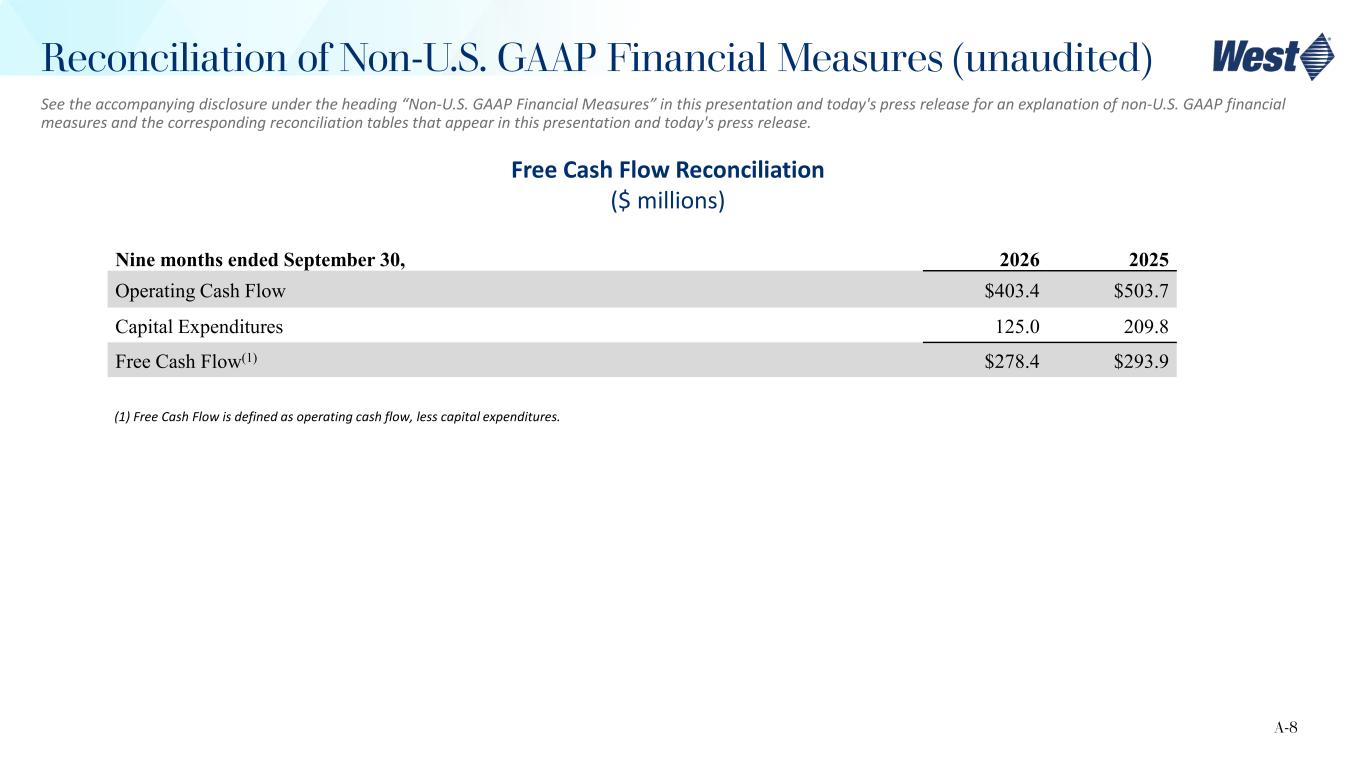
Free Cash Flow Reconciliation ($ millions) Nine months ended September 30, 2026 2025 Operating Cash Flow $403.4 $503.7 Capital Expenditures 125.0 209.8 Free Cash Flow(1) $278.4 $293.9 (1) Free Cash Flow is defined as operating cash flow, less capital expenditures. A-8 Reconciliation of Non-U.S. GAAP Financial Measures (unaudited) See the accompanying disclosure under the heading “Non-U.S. GAAP Financial Measures” in this presentation and today's press release for an explanation of non-U.S. GAAP financial measures and the corresponding reconciliation tables that appear in this presentation and today's press release.