October 2026 Investor Presentation NASDAQ: INBK Exhibit 99.2
2 Forward-Looking Statements & Non-GAAP Financial Measures This presentation contains forward-looking statements within the meaning of the safe harbor provisions of the Private Securities Litigation Reform Act of 1995, including statements with respect to the financial condition, results of operations, trends in lending policies and loan programs, plans and prospective business partnerships, objectives, future performance and business of the Company. Forward-looking statements are generally identifiable by the use of words such as “believe,” “continue,” “could,” “decline,” “drive,” “enhance,” “estimate,” “expanding,” “expect,” “grow,” “growth,” “improve,” “increase,” “looking ahead,” “may,” “pending,” “plan,” “position,” “preliminary,” “remain,” “rising,” “should,” “slow,” “stable,” “strategy,” “well-positioned,” or other similar expressions. Forward-looking statements are not a guarantee of future performance or results, are based on information available at the time the statements are made and involve known and unknown risks, uncertainties and other factors that could cause actual results to differ materially from the information in the forward- looking statements. Such statements are subject to certain risks and uncertainties including: our business and operations and the business and operations of our vendors and customers; general economic conditions, whether national or regional, and conditions in the lending markets in which we participate may have an adverse effect on the demand for our loans and other products; our credit quality and related levels of nonperforming assets and loan losses, and the value and salability of the real estate that is the collateral for our loans. Other factors that may cause such differences include: failures or breaches of or interruptions in the communications and information systems on which we rely to conduct our business; failure of our plans to grow our commercial and industrial, construction and SBA loan portfolios; competition with national, regional and community financial institutions; the loss of any key members of senior management; the impacts of inflation and rising interest rates on the general economy; risks relating to the regulation of financial institutions; and other factors identified in reports we file with the U.S. Securities and Exchange Commission. All statements in this presentation, including forward-looking statements, speak only as of the date they are made, and the Company undertakes no obligation to update any statement in light of new information or future events. This presentation contains financial information determined by methods other than in accordance with U.S. generally accepted accounting principles (“GAAP”). Non-GAAP financial measures, specifically tangible common equity, tangible assets, tangible book value per common share, tangible common equity to tangible assets, total interest income – FTE, net interest income – FTE, net interest margin – FTE, adjusted total revenue, pre-provision net revenue (loss), adjusted pre-provision net revenue, adjusted noninterest income, adjusted noninterest expense, adjusted noninterest expense to average assets, adjusted efficiency ratio, adjusted income (loss) before income taxes, adjusted income tax (benefit) provision, adjusted net income (loss), adjusted diluted earnings per share, adjusted return on average assets, adjusted return on average shareholders’ equity, adjusted return on average tangible common equity, adjusted tangible common equity, adjusted tangible assets, adjusted tangible common equity to adjusted tangible assets, adjusted nonperforming loans to total loans and adjusted allowance for credit losses - loans to nonperforming loans are used by the Company’s management to measure the strength of its capital and analyze profitability, including its ability to generate earnings on tangible capital invested by its shareholders. Although management believes these non-GAAP measures are useful to investors by providing a greater understanding of its business, they should not be considered a substitute for financial measures determined in accordance with GAAP, nor are they necessarily comparable to non-GAAP performance measures that may be presented by other companies. Reconciliations of these non-GAAP financial measures to the most directly comparable GAAP financial measures are included in the table at the end of this presentation under the caption “Reconciliation of Non-GAAP Financial Measures.”
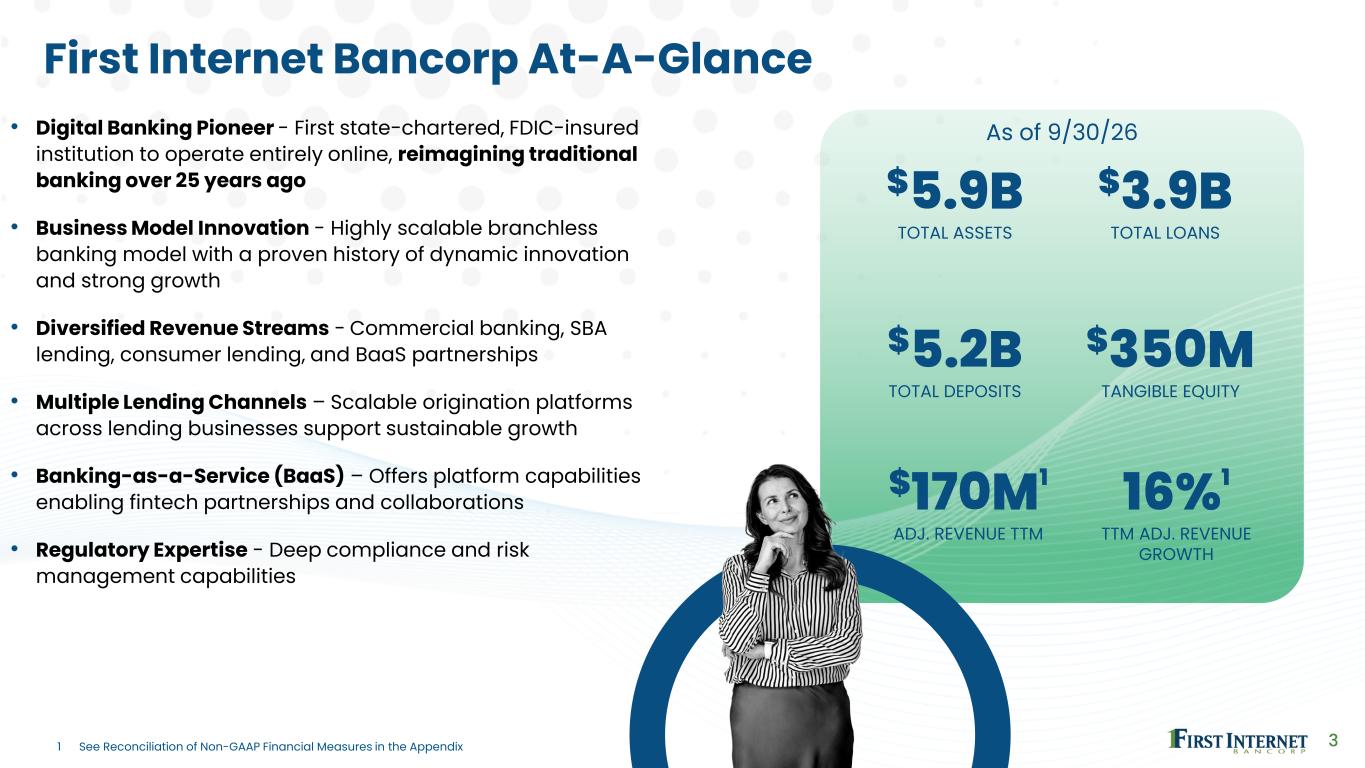
3 First Internet Bancorp At-A-Glance • Digital Banking Pioneer - First state-chartered, FDIC-insured institution to operate entirely online, reimagining traditional banking over 25 years ago • Business Model Innovation - Highly scalable branchless banking model with a proven history of dynamic innovation and strong growth • Diversified Revenue Streams - Commercial banking, SBA lending, consumer lending, and BaaS partnerships • Multiple Lending Channels – Scalable origination platforms across lending businesses support sustainable growth • Banking-as-a-Service (BaaS) – Offers platform capabilities enabling fintech partnerships and collaborations • Regulatory Expertise - Deep compliance and risk management capabilities $5.9B TOTAL ASSETS 16%1 TTM ADJ. REVENUE GROWTH $170M1 ADJ. REVENUE TTM $3.9B TOTAL LOANS $5.2B TOTAL DEPOSITS $350M TANGIBLE EQUITY As of 9/30/26 1 See Reconciliation of Non-GAAP Financial Measures in the Appendix
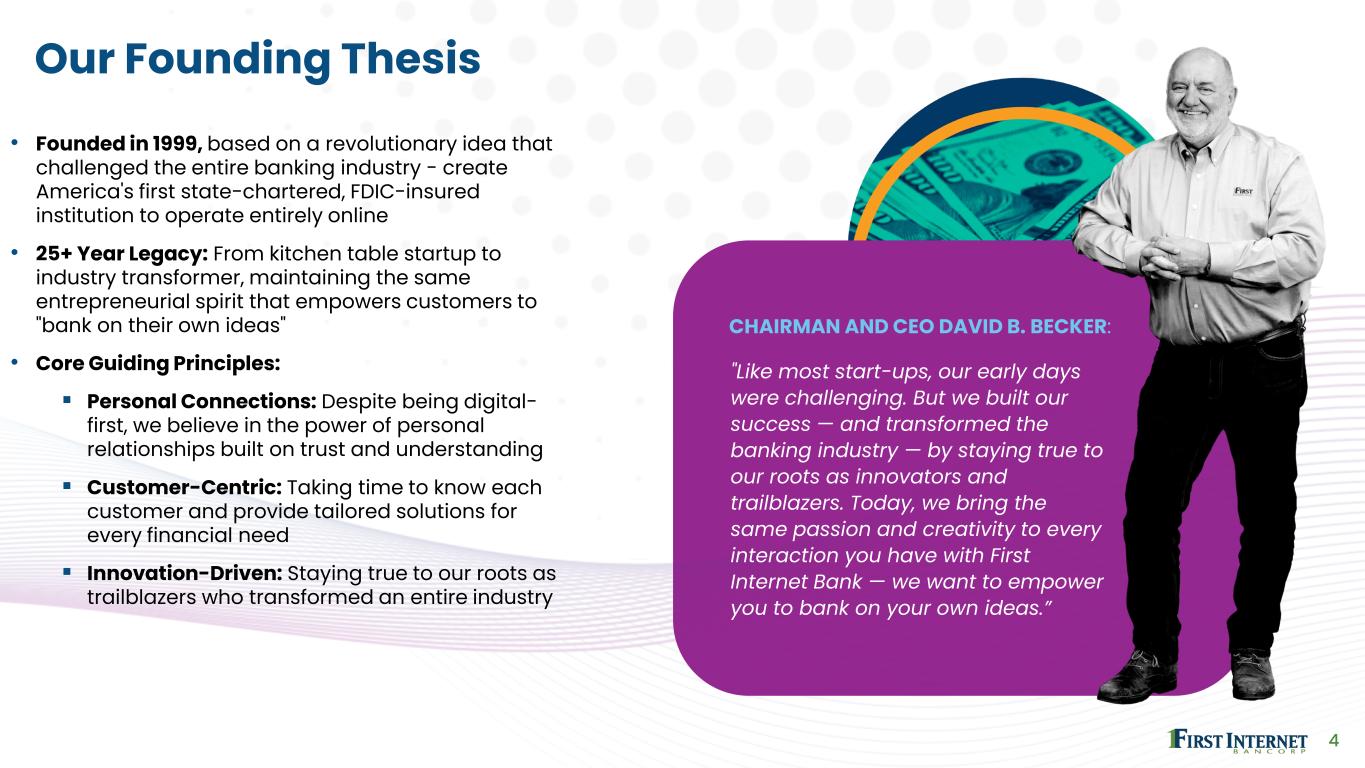
4 Our Founding Thesis • Founded in 1999, based on a revolutionary idea that challenged the entire banking industry - create America's first state-chartered, FDIC-insured institution to operate entirely online • 25+ Year Legacy: From kitchen table startup to industry transformer, maintaining the same entrepreneurial spirit that empowers customers to "bank on their own ideas" • Core Guiding Principles: Personal Connections: Despite being digital- first, we believe in the power of personal relationships built on trust and understanding Customer-Centric: Taking time to know each customer and provide tailored solutions for every financial need Innovation-Driven: Staying true to our roots as trailblazers who transformed an entire industry "Like most start-ups, our early days were challenging. But we built our success — and transformed the banking industry — by staying true to our roots as innovators and trailblazers. Today, we bring the same passion and creativity to every interaction you have with First Internet Bank — we want to empower you to bank on your own ideas.” CHAIRMAN AND CEO DAVID B. BECKER:
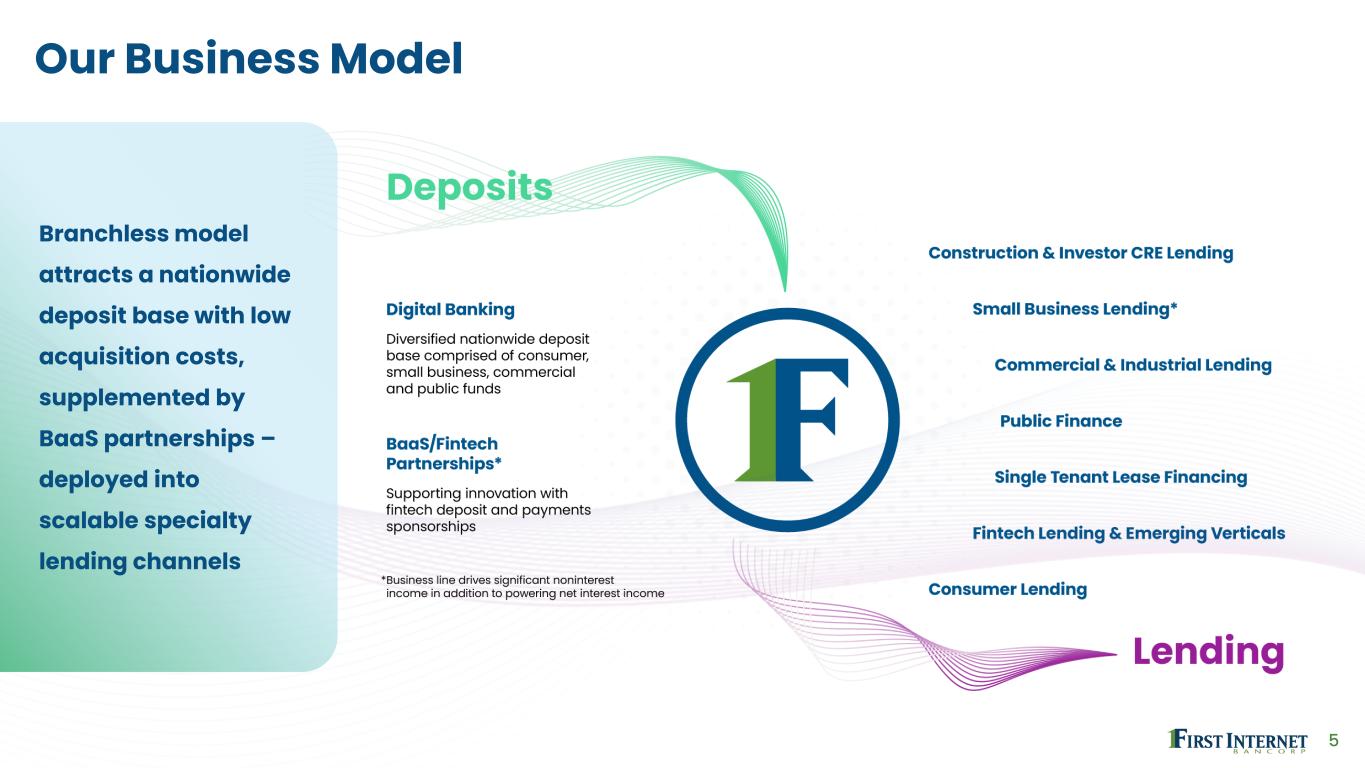
5 Our Business Model Branchless model attracts a nationwide deposit base with low acquisition costs, supplemented by BaaS partnerships – deployed into scalable specialty lending channels
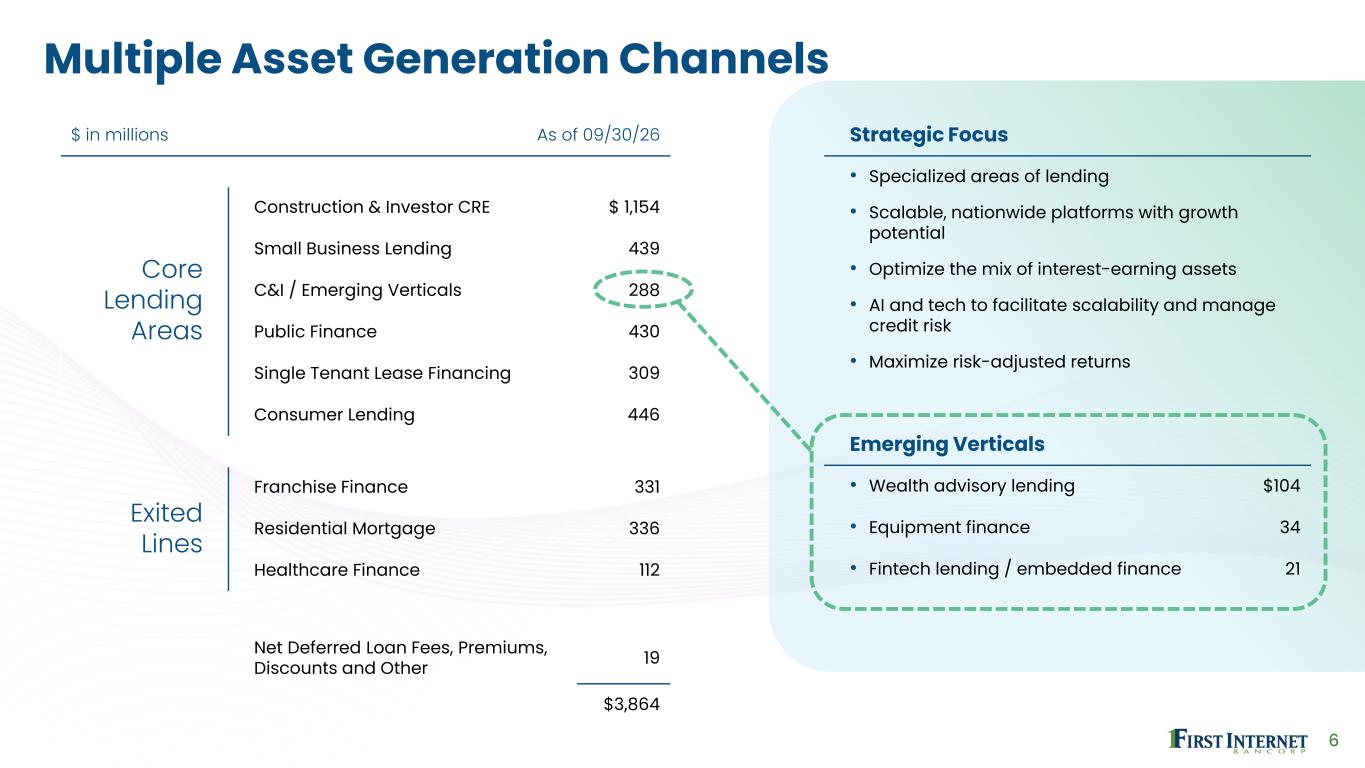
6 Multiple Asset Generation Channels $ in millions As of 09/30/26 Core Lending Areas Construction & Investor CRE $ 1,154 Small Business Lending 439 C&I / Emerging Verticals 288 Public Finance 430 Single Tenant Lease Financing 309 Consumer Lending 446 Exited Lines Franchise Finance 331 Residential Mortgage 336 Healthcare Finance 112 Net Deferred Loan Fees, Premiums, Discounts and Other 19 $3,864 Strategic Focus • Specialized areas of lending • Scalable, nationwide platforms with growth potential • Optimize the mix of interest-earning assets • AI and tech to facilitate scalability and manage credit risk • Maximize risk-adjusted returns Emerging Verticals • Wealth advisory lending $104 • Equipment finance 34 • Fintech lending / embedded finance 21
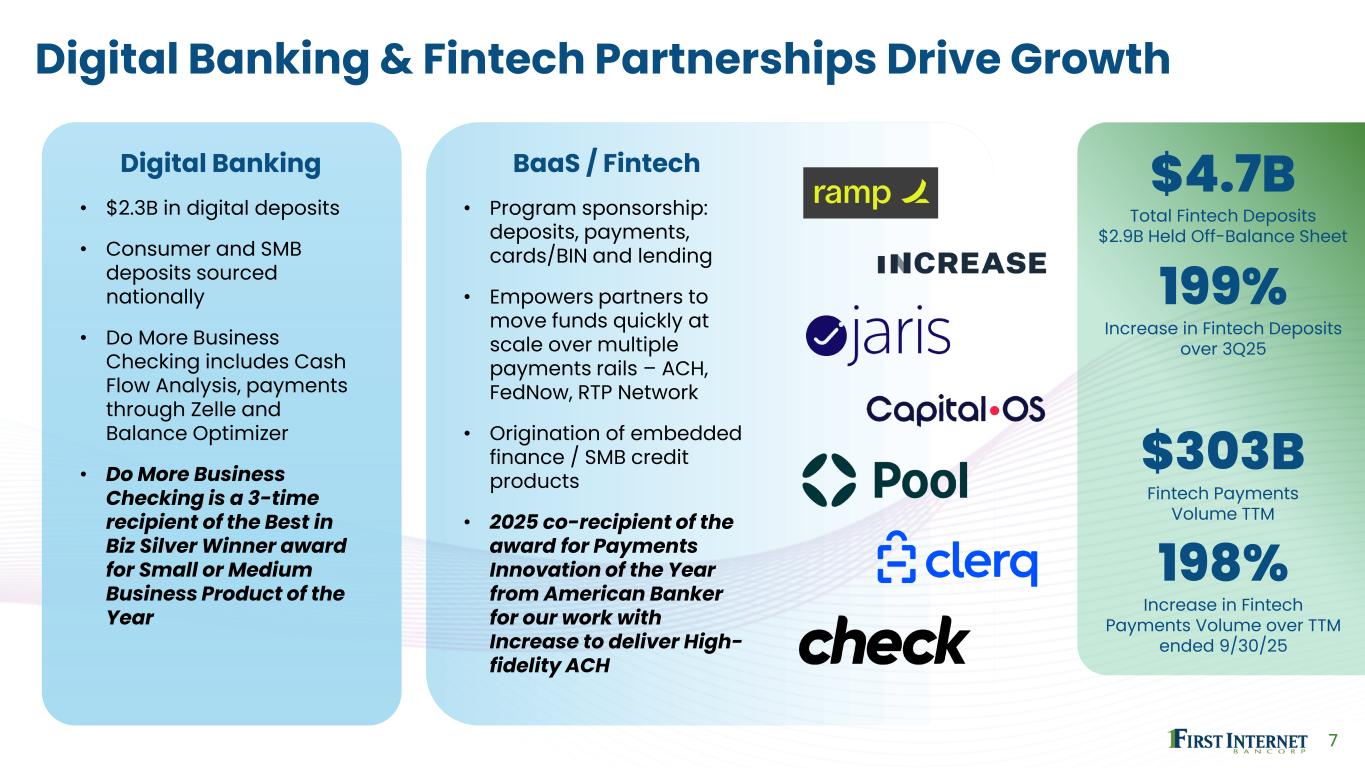
7 Digital Banking & Fintech Partnerships Drive Growth Digital Banking • $2.3B in digital deposits • Consumer and SMB deposits sourced nationally • Do More Business Checking includes Cash Flow Analysis, payments through Zelle and Balance Optimizer • Do More Business Checking is a 3-time recipient of the Best in Biz Silver Winner award for Small or Medium Business Product of the Year BaaS / Fintech • Program sponsorship: deposits, payments, cards/BIN and lending • Empowers partners to move funds quickly at scale over multiple payments rails – ACH, FedNow, RTP Network • Origination of embedded finance / SMB credit products • 2025 co-recipient of the award for Payments Innovation of the Year from American Banker for our work with Increase to deliver High- fidelity ACH $4.7B Total Fintech Deposits $2.9B Held Off-Balance Sheet 199% Increase in Fintech Deposits over 3Q25 $303B Fintech Payments Volume TTM 198% Increase in Fintech Payments Volume over TTM ended 9/30/25
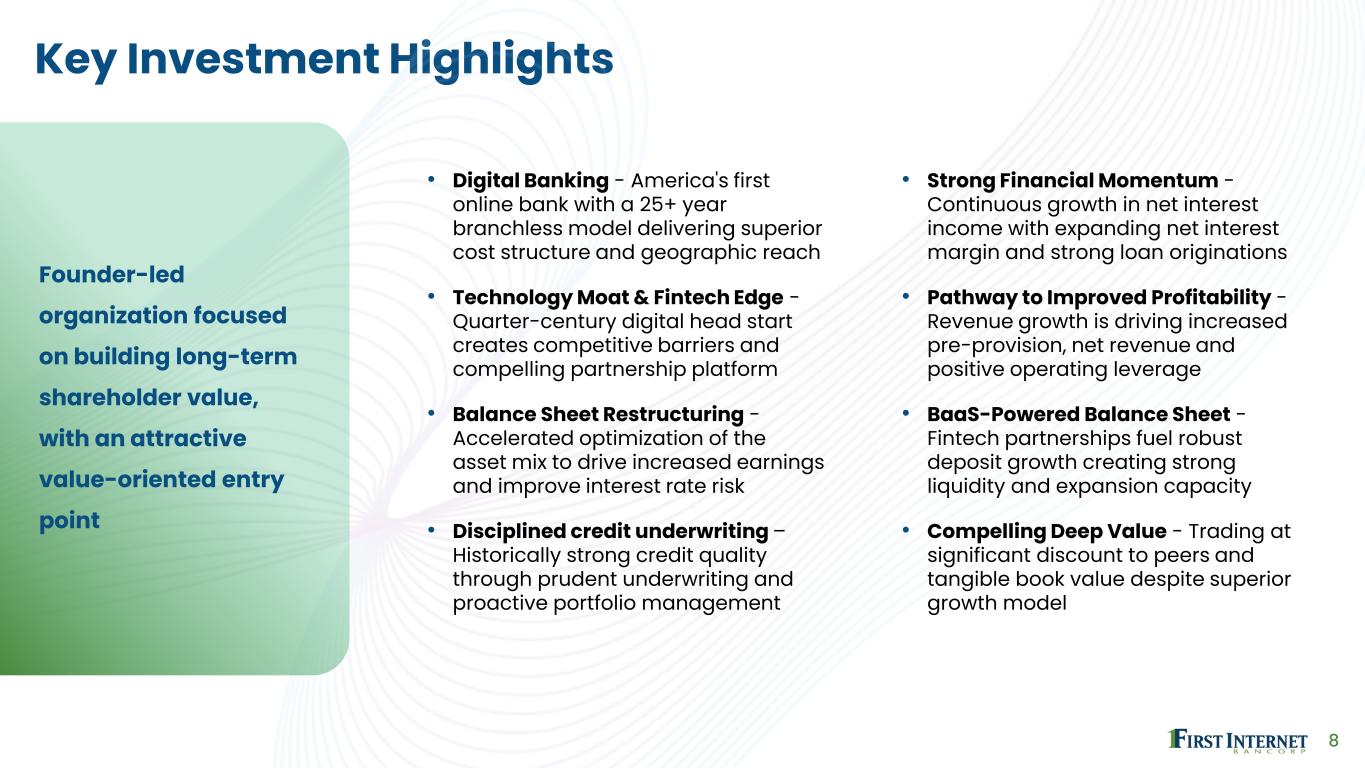
8 Key Investment Highlights • Digital Banking - America's first online bank with a 25+ year branchless model delivering superior cost structure and geographic reach • Technology Moat & Fintech Edge - Quarter-century digital head start creates competitive barriers and compelling partnership platform • Balance Sheet Restructuring - Accelerated optimization of the asset mix to drive increased earnings and improve interest rate risk • Disciplined credit underwriting – Historically strong credit quality through prudent underwriting and proactive portfolio management • Strong Financial Momentum - Continuous growth in net interest income with expanding net interest margin and strong loan originations • Pathway to Improved Profitability - Revenue growth is driving increased pre-provision, net revenue and positive operating leverage • BaaS-Powered Balance Sheet - Fintech partnerships fuel robust deposit growth creating strong liquidity and expansion capacity • Compelling Deep Value - Trading at significant discount to peers and tangible book value despite superior growth model Founder-led organization focused on building long-term shareholder value, with an attractive value-oriented entry point
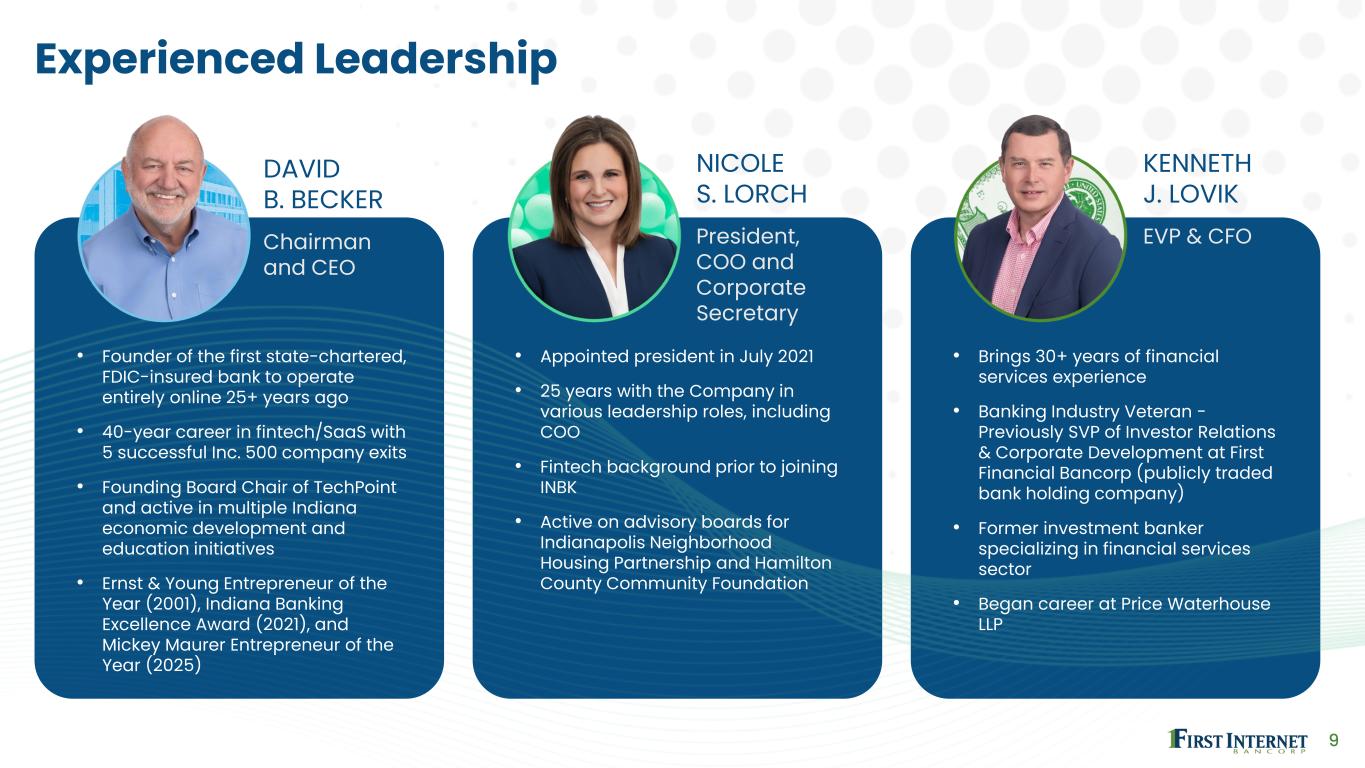
9 Experienced Leadership • Founder of the first state-chartered, FDIC-insured bank to operate entirely online 25+ years ago • 40-year career in fintech/SaaS with 5 successful Inc. 500 company exits • Founding Board Chair of TechPoint and active in multiple Indiana economic development and education initiatives • Ernst & Young Entrepreneur of the Year (2001), Indiana Banking Excellence Award (2021), and Mickey Maurer Entrepreneur of the Year (2025) • Appointed president in July 2021 • 25 years with the Company in various leadership roles, including COO • Fintech background prior to joining INBK • Active on advisory boards for Indianapolis Neighborhood Housing Partnership and Hamilton County Community Foundation • Brings 30+ years of financial services experience • Banking Industry Veteran - Previously SVP of Investor Relations & Corporate Development at First Financial Bancorp (publicly traded bank holding company) • Former investment banker specializing in financial services sector • Began career at Price Waterhouse LLP DAVID B. BECKER Chairman and CEO NICOLE S. LORCH President, COO and Corporate Secretary KENNETH J. LOVIK EVP & CFO
Financial Review
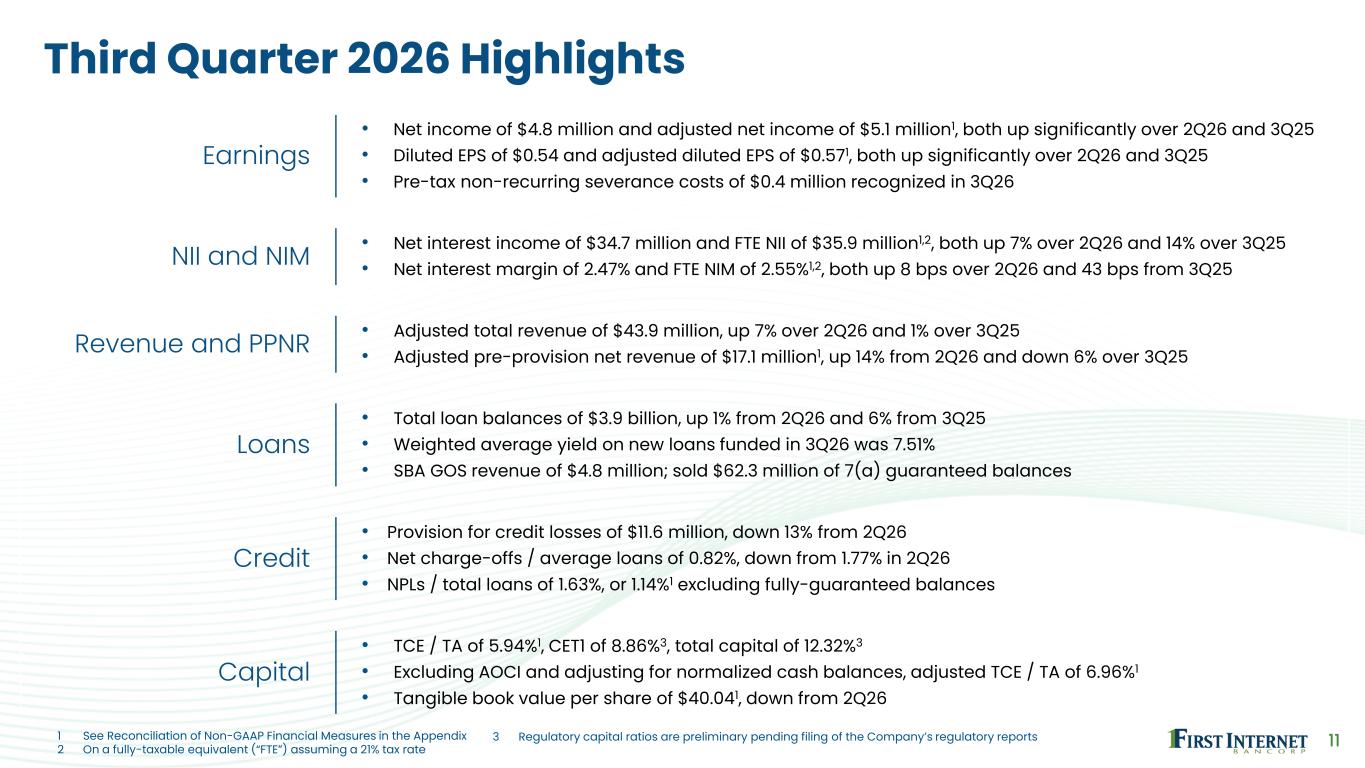
11 Third Quarter 2026 Highlights Earnings • Net income of $4.8 million and adjusted net income of $5.1 million1, both up significantly over 2Q26 and 3Q25 • Diluted EPS of $0.54 and adjusted diluted EPS of $0.571, both up significantly over 2Q26 and 3Q25 • Pre-tax non-recurring severance costs of $0.4 million recognized in 3Q26 NII and NIM • Net interest income of $34.7 million and FTE NII of $35.9 million1,2, both up 7% over 2Q26 and 14% over 3Q25 • Net interest margin of 2.47% and FTE NIM of 2.55%1,2, both up 8 bps over 2Q26 and 43 bps from 3Q25 Revenue and PPNR • Adjusted total revenue of $43.9 million, up 7% over 2Q26 and 1% over 3Q25 • Adjusted pre-provision net revenue of $17.1 million1, up 14% from 2Q26 and down 6% over 3Q25 Loans • Total loan balances of $3.9 billion, up 1% from 2Q26 and 6% from 3Q25 • Weighted average yield on new loans funded in 3Q26 was 7.51% • SBA GOS revenue of $4.8 million; sold $62.3 million of 7(a) guaranteed balances Credit • Provision for credit losses of $11.6 million, down 13% from 2Q26 • Net charge-offs / average loans of 0.82%, down from 1.77% in 2Q26 • NPLs / total loans of 1.63%, or 1.14%1 excluding fully-guaranteed balances Capital • TCE / TA of 5.94%1, CET1 of 8.86%3, total capital of 12.32%3 • Excluding AOCI and adjusting for normalized cash balances, adjusted TCE / TA of 6.96%1 • Tangible book value per share of $40.041, down from 2Q26 1 See Reconciliation of Non-GAAP Financial Measures in the Appendix 2 On a fully-taxable equivalent (“FTE”) assuming a 21% tax rate 3 Regulatory capital ratios are preliminary pending filing of the Company’s regulatory reports
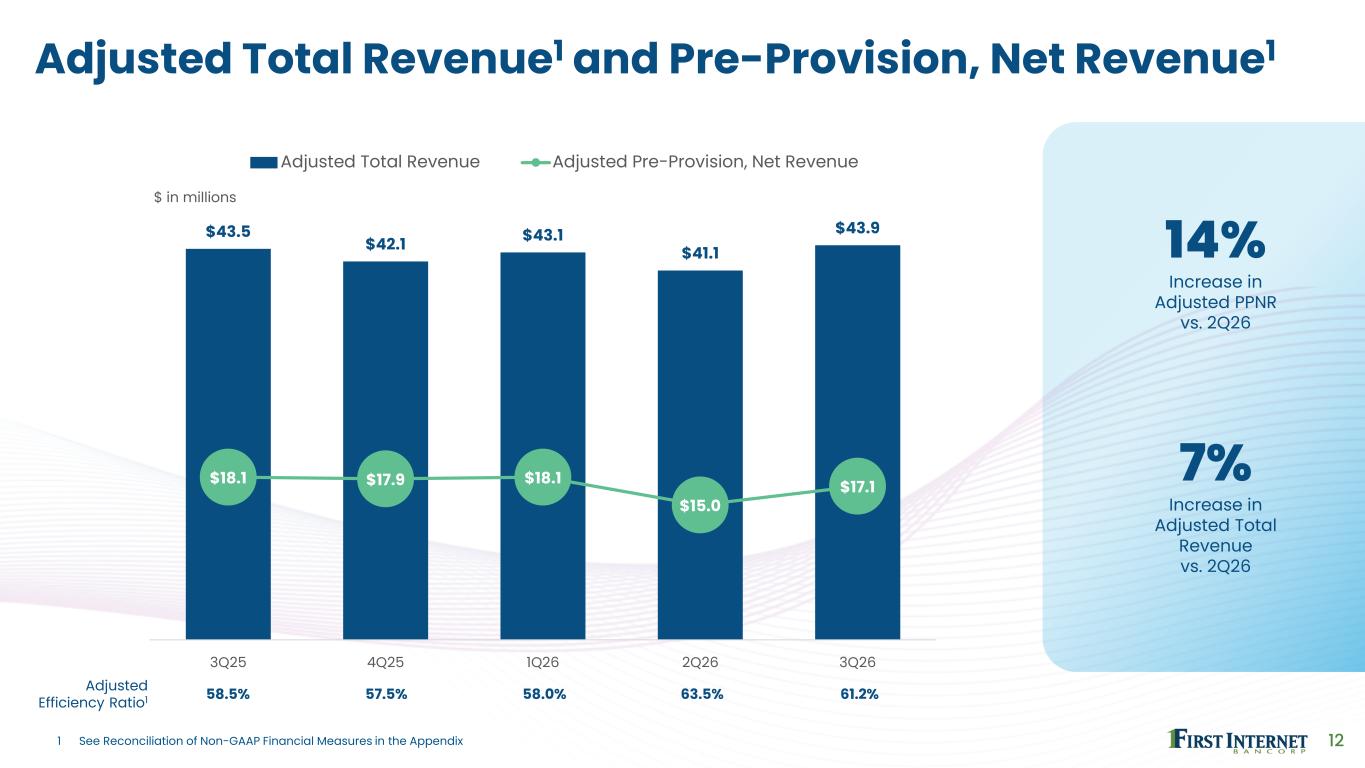
12 Adjusted Total Revenue1 and Pre-Provision, Net Revenue1 $43.5 $42.1 $43.1 $41.1 $43.9 $18.1 $17.9 $18.1 $15.0 $17.1 3Q25 4Q25 1Q26 2Q26 3Q26 Adjusted Total Revenue Adjusted Pre-Provision, Net Revenue Adjusted Efficiency Ratio1 58.5% 57.5% 58.0% 63.5% 61.2% 14% Increase in Adjusted PPNR vs. 2Q26 7% Increase in Adjusted Total Revenue vs. 2Q26 $ in millions 1 See Reconciliation of Non-GAAP Financial Measures in the Appendix
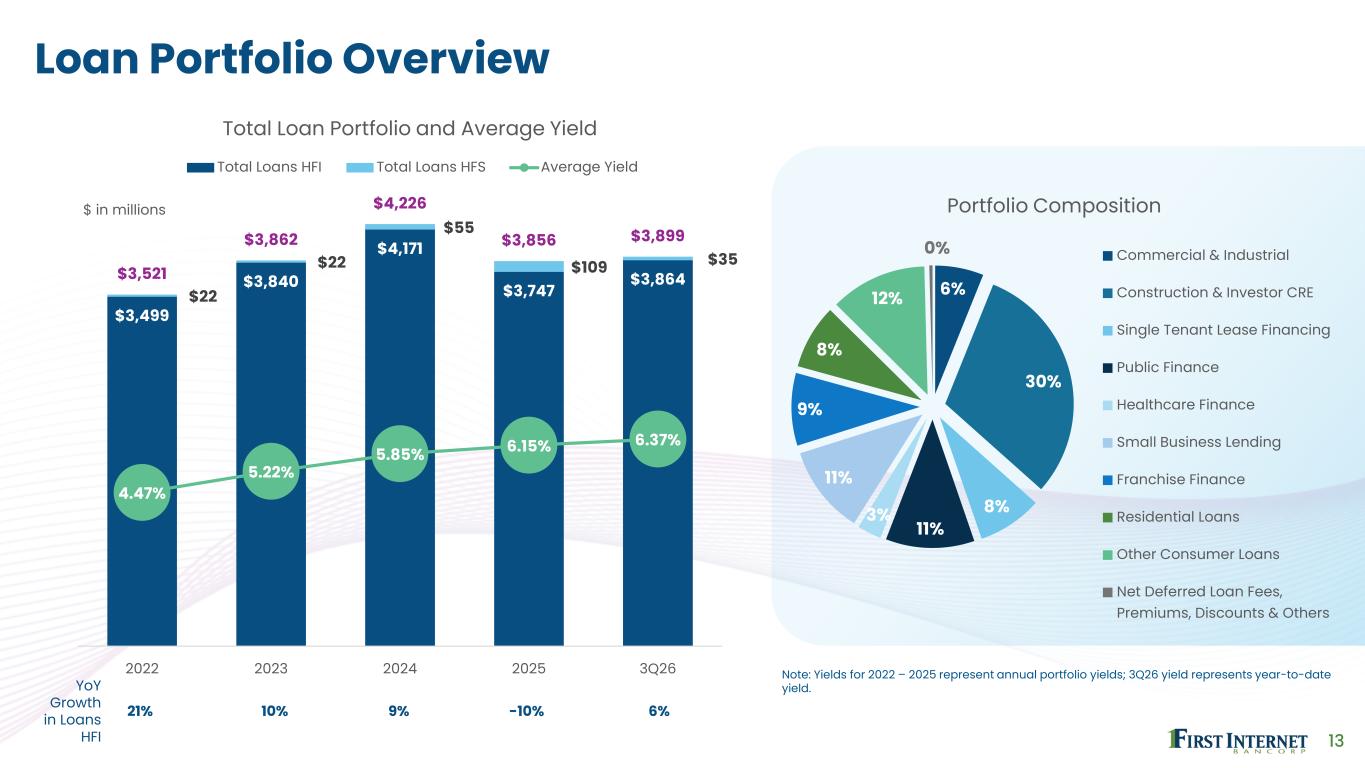
13 Loan Portfolio Overview $3,499 $3,840 $4,171 $3,747 $3,864 $22 $22 $55 $109 $35 $3,521 $3,862 $4,226 $3,856 $3,899 4.47% 5.22% 5.85% 6.15% 6.37% 2022 2023 2024 2025 3Q26 Total Loan Portfolio and Average Yield Total Loans HFI Total Loans HFS Average Yield 6% 30% 8% 11% 3% 11% 9% 8% 12% 0% Portfolio Composition Commercial & Industrial Construction & Investor CRE Single Tenant Lease Financing Public Finance Healthcare Finance Small Business Lending Franchise Finance Residential Loans Other Consumer Loans Net Deferred Loan Fees, Premiums, Discounts & Others YoY Growth in Loans HFI 21% 10% 9% -10% 6% $ in millions Note: Yields for 2022 – 2025 represent annual portfolio yields; 3Q26 yield represents year-to-date yield.
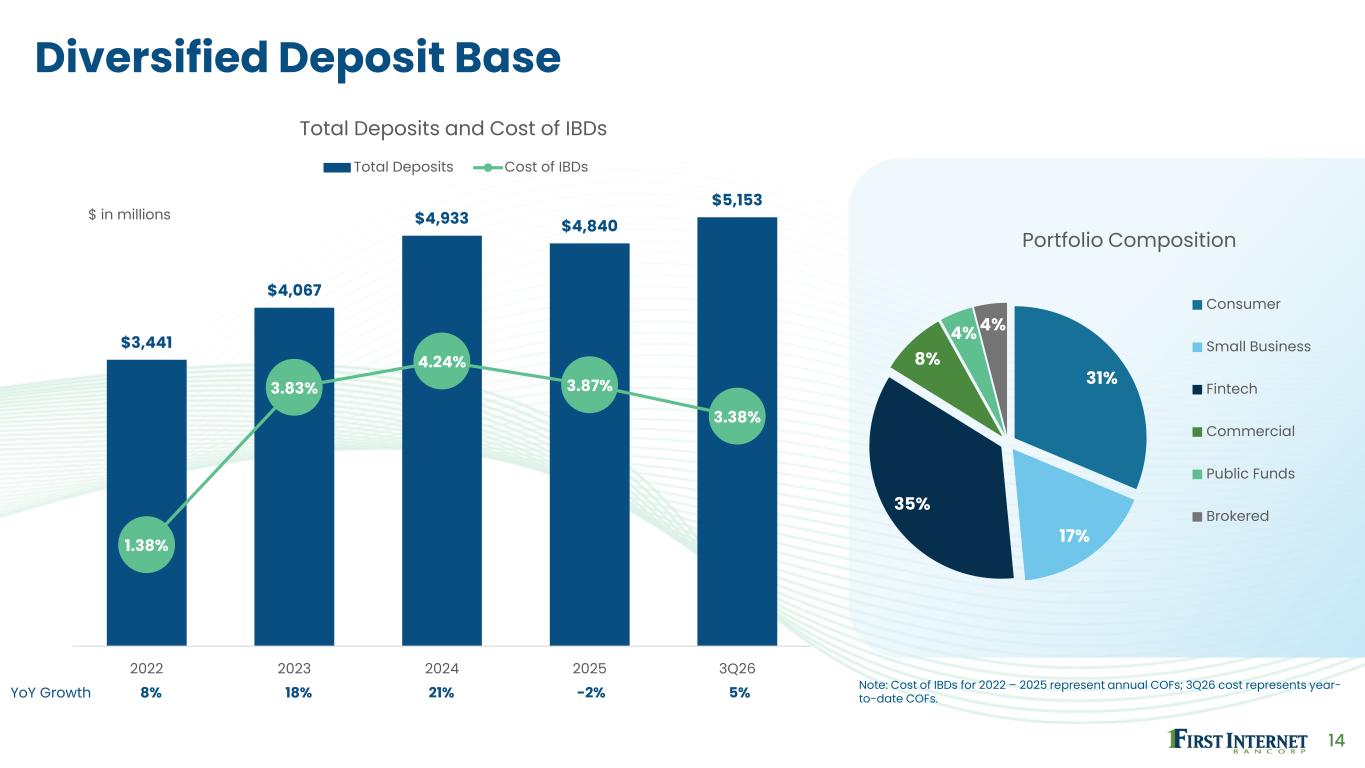
14 Diversified Deposit Base $3,441 $4,067 $4,933 $4,840 $5,153 1.38% 3.83% 4.24% 3.87% 3.38% 2022 2023 2024 2025 3Q26 Total Deposits and Cost of IBDs Total Deposits Cost of IBDs $ in millions 31% 17% 35% 8% 4% 4% Portfolio Composition Consumer Small Business Fintech Commercial Public Funds Brokered YoY Growth 8% 18% 21% -2% 5% Note: Cost of IBDs for 2022 – 2025 represent annual COFs; 3Q26 cost represents year- to-date COFs.
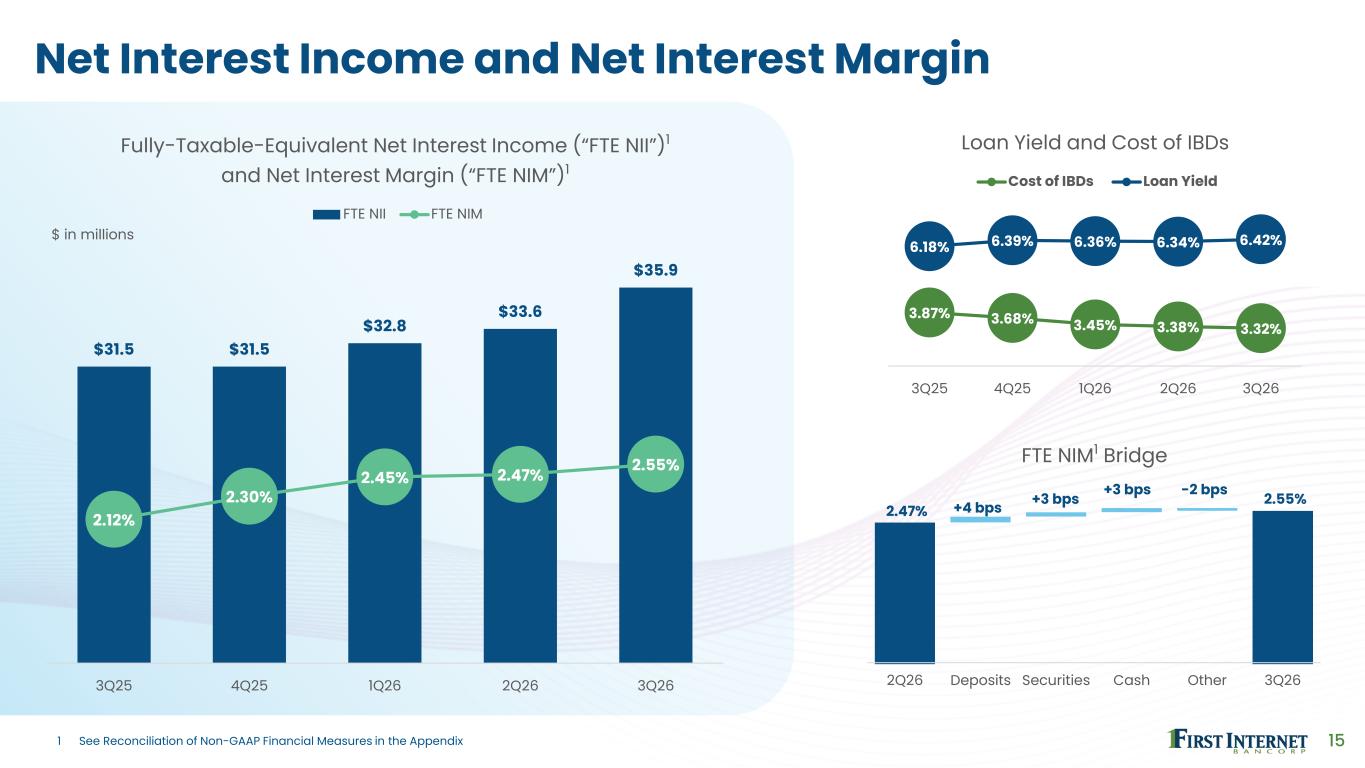
15 $31.5 $31.5 $32.8 $33.6 $35.9 2.12% 2.30% 2.45% 2.47% 2.55% 3Q25 4Q25 1Q26 2Q26 3Q26 Fully-Taxable-Equivalent Net Interest Income (“FTE NII”)1 and Net Interest Margin (“FTE NIM”)1 FTE NII FTE NIM 3.87% 3.68% 3.45% 3.38% 3.32% 6.18% 6.39% 6.36% 6.34% 6.42% 3Q25 4Q25 1Q26 2Q26 3Q26 Loan Yield and Cost of IBDs Cost of IBDs Loan Yield 2Q26 Deposits Securities Cash Other 3Q26 Net Interest Income and Net Interest Margin 2.47% -2 bps+3 bps +3 bps 2.55%+4 bps FTE NIM1 Bridge $ in millions 1 See Reconciliation of Non-GAAP Financial Measures in the Appendix
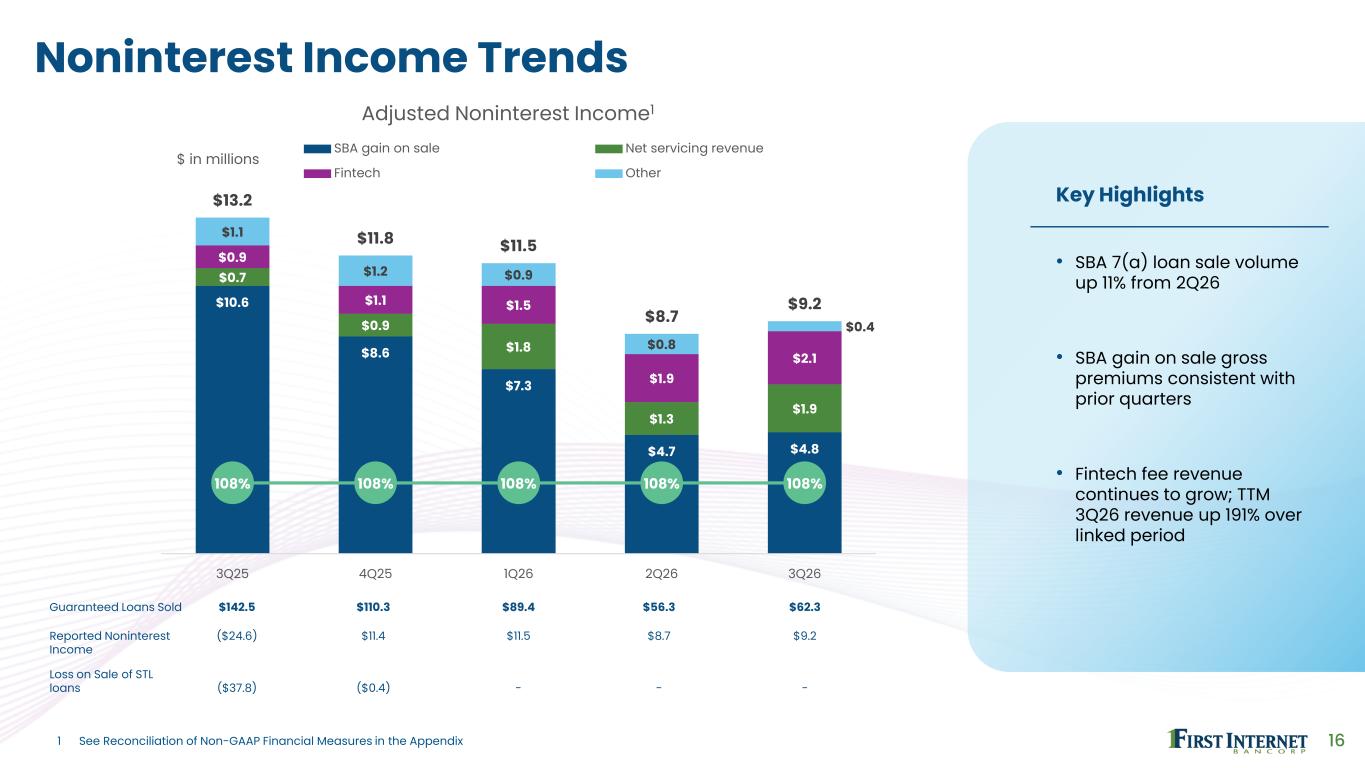
16 Noninterest Income Trends 1 See Reconciliation of Non-GAAP Financial Measures in the Appendix Key Highlights • SBA 7(a) loan sale volume up 11% from 2Q26 • SBA gain on sale gross premiums consistent with prior quarters • Fintech fee revenue continues to grow; TTM 3Q26 revenue up 191% over linked period Guaranteed Loans Sold $142.5 $110.3 $89.4 $56.3 $62.3 Reported Noninterest Income ($24.6) $11.4 $11.5 $8.7 $9.2 Loss on Sale of STL loans ($37.8) ($0.4) - - - $10.6 $8.6 $7.3 $4.7 $4.8 $0.7 $0.9 $1.8 $1.3 $1.9 $0.9 $1.1 $1.5 $1.9 $2.1 $1.1 $1.2 $0.9 $0.8 $0.4 $13.2 $11.8 $11.5 $8.7 $9.2 108% 108% 108% 108% 108% 3Q25 4Q25 1Q26 2Q26 3Q26 Adjusted Noninterest Income1 SBA gain on sale Net servicing revenue Fintech Other $ in millions
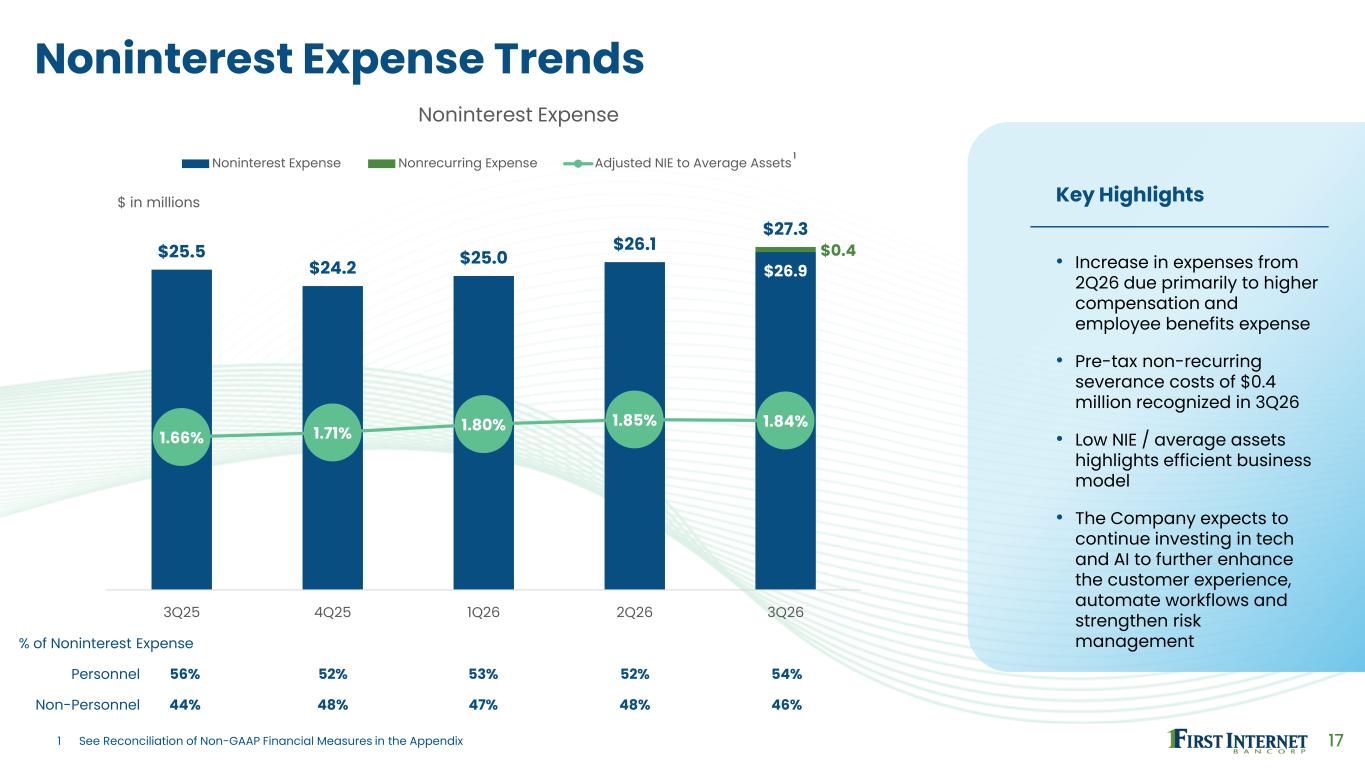
17 Noninterest Expense Trends $26.9 $0.4 $25.5 $24.2 $25.0 $26.1 $27.3 1.66% 1.71% 1.80% 1.85% 1.84% 3Q25 4Q25 1Q26 2Q26 3Q26 Noninterest Expense Noninterest Expense Nonrecurring Expense Adjusted NIE to Average Assets $ in millions Key Highlights • Increase in expenses from 2Q26 due primarily to higher compensation and employee benefits expense • Pre-tax non-recurring severance costs of $0.4 million recognized in 3Q26 • Low NIE / average assets highlights efficient business model • The Company expects to continue investing in tech and AI to further enhance the customer experience, automate workflows and strengthen risk management % of Noninterest Expense Personnel 56% 52% 53% 52% 54% Non-Personnel 44% 48% 47% 48% 46% 1 See Reconciliation of Non-GAAP Financial Measures in the Appendix 1
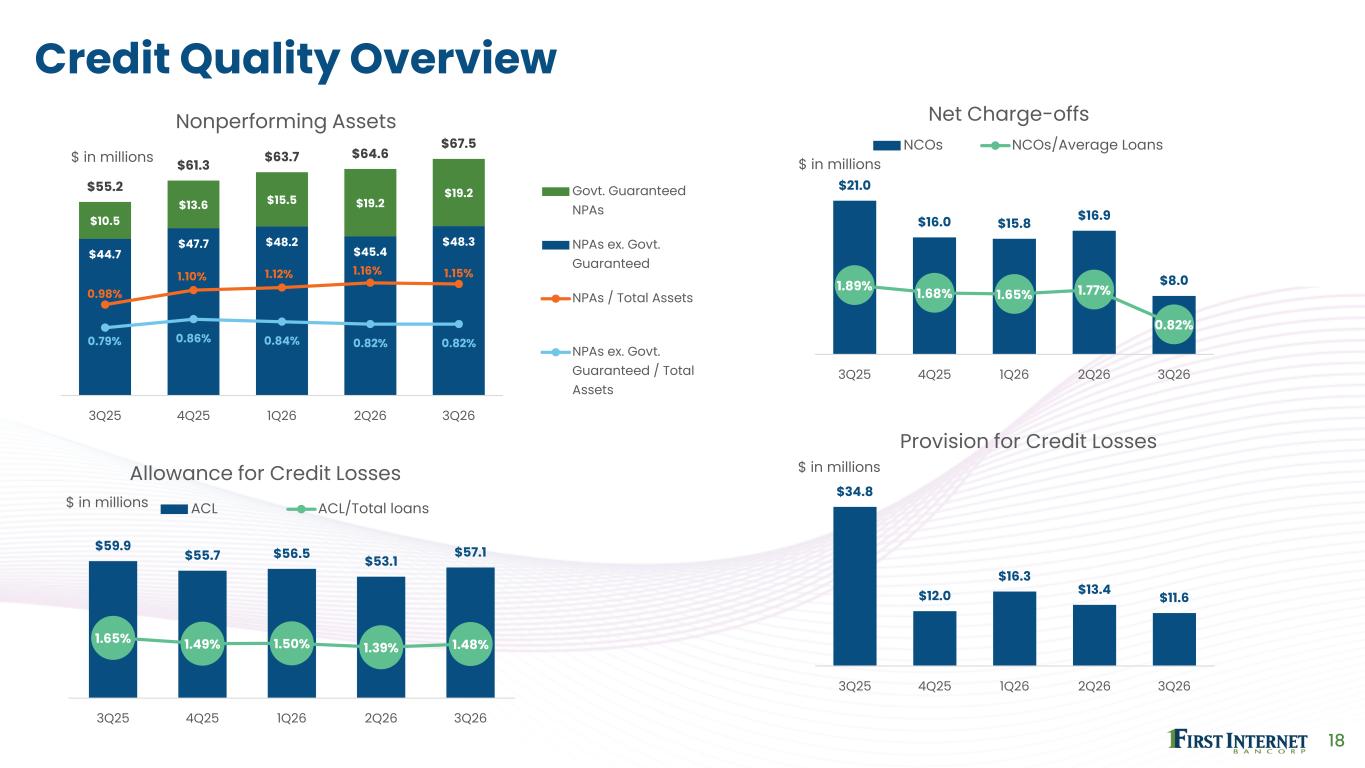
18 Credit Quality Overview $59.9 $55.7 $56.5 $53.1 $57.1 1.65% 1.49% 1.50% 1.39% 1.48% 3Q25 4Q25 1Q26 2Q26 3Q26 Allowance for Credit Losses ACL ACL/Total loans$ in millions $21.0 $16.0 $15.8 $16.9 $8.0 1.89% 1.68% 1.65% 1.77% 0.82% 3Q25 4Q25 1Q26 2Q26 3Q26 Net Charge-offs NCOs NCOs/Average Loans $ in millions $34.8 $12.0 $16.3 $13.4 $11.6 3Q25 4Q25 1Q26 2Q26 3Q26 Provision for Credit Losses $ in millions $ in millions $44.7 $47.7 $48.2 $45.4 $48.3 $10.5 $13.6 $15.5 $19.2 $19.2 $55.2 $61.3 $63.7 $64.6 $67.5 0.98% 1.10% 1.12% 1.16% 1.15% 0.79% 0.86% 0.84% 0.82% 0.82% 3Q25 4Q25 1Q26 2Q26 3Q26 Nonperforming Assets Govt. Guaranteed NPAs NPAs ex. Govt. Guaranteed NPAs / Total Assets NPAs ex. Govt. Guaranteed / Total Assets
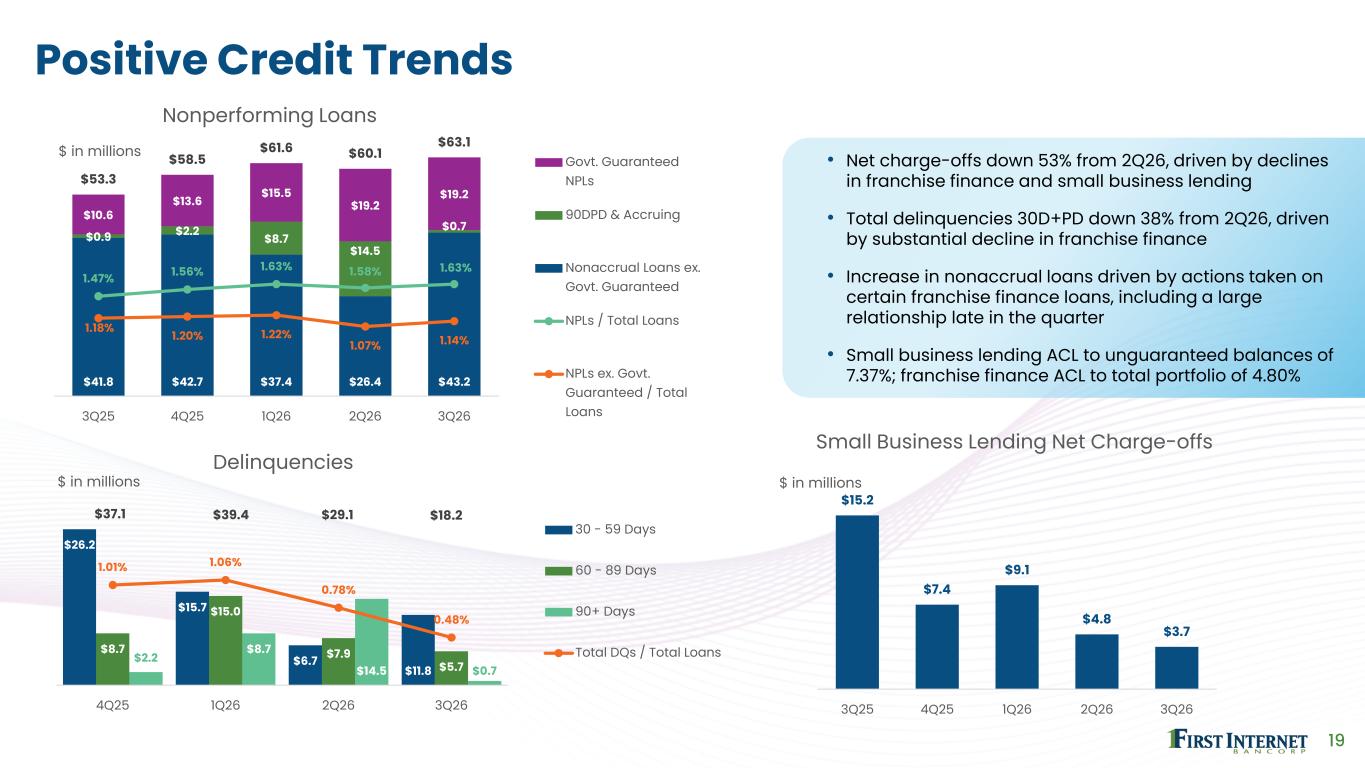
19 Positive Credit Trends $15.2 $7.4 $9.1 $4.8 $3.7 3Q25 4Q25 1Q26 2Q26 3Q26 Small Business Lending Net Charge-offs $ in millions • Net charge-offs down 53% from 2Q26, driven by declines in franchise finance and small business lending • Total delinquencies 30D+PD down 38% from 2Q26, driven by substantial decline in franchise finance • Increase in nonaccrual loans driven by actions taken on certain franchise finance loans, including a large relationship late in the quarter • Small business lending ACL to unguaranteed balances of 7.37%; franchise finance ACL to total portfolio of 4.80% $26.2 $15.7 $6.7 $11.8 $8.7 $15.0 $7.9 $5.7 $2.2 $8.7 $14.5 $0.7 $37.1 $39.4 $29.1 $18.2 1.01% 1.06% 0.78% 0.48% 4Q25 1Q26 2Q26 3Q26 Delinquencies 30 - 59 Days 60 - 89 Days 90+ Days Total DQs / Total Loans $ in millions $41.8 $42.7 $37.4 $26.4 $43.2 $0.9 $2.2 $8.7 $14.5 $0.7 $10.6 $13.6 $15.5 $19.2 $19.2 $53.3 $58.5 $61.6 $60.1 $63.1 1.47% 1.56% 1.63% 1.58% 1.63% 1.18% 1.20% 1.22% 1.07% 1.14% 3Q25 4Q25 1Q26 2Q26 3Q26 Nonperforming Loans Govt. Guaranteed NPLs 90DPD & Accruing Nonaccrual Loans ex. Govt. Guaranteed NPLs / Total Loans NPLs ex. Govt. Guaranteed / Total Loans $ in millions
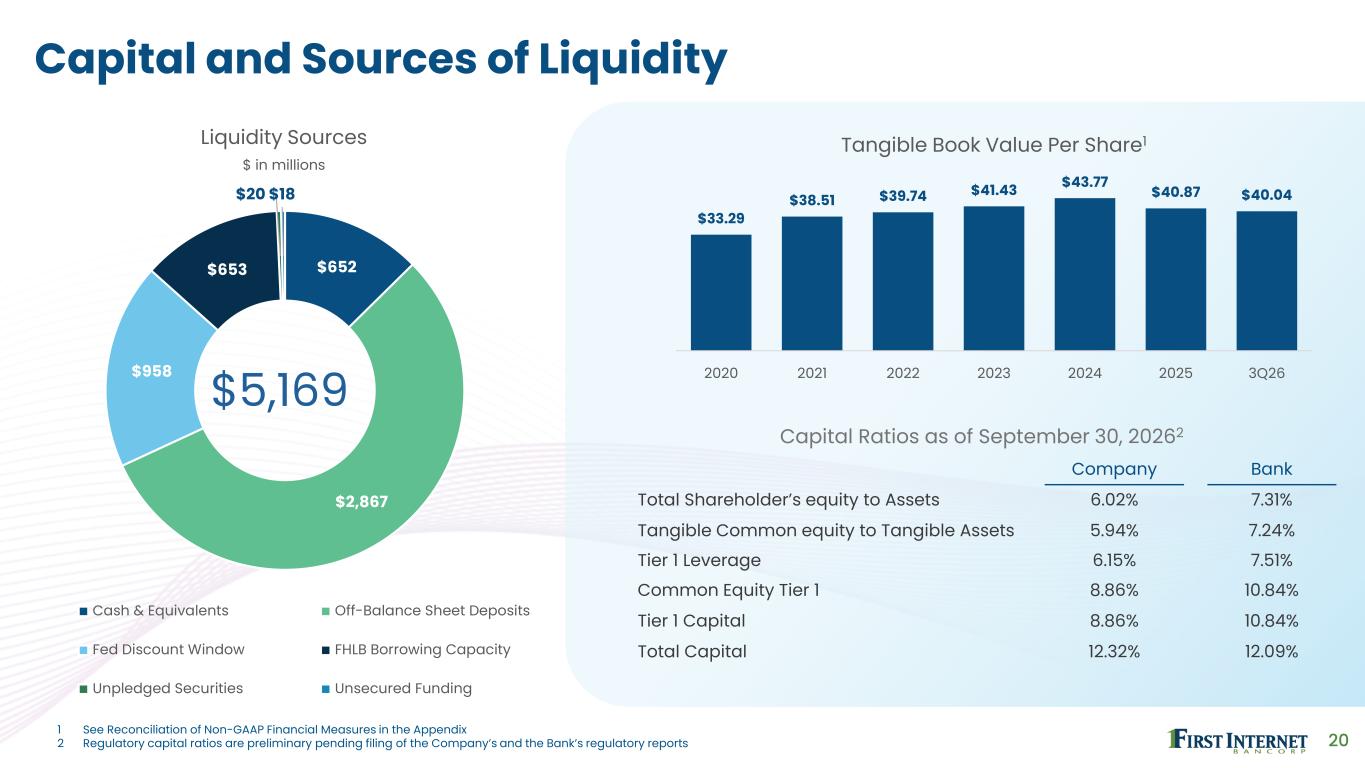
20 Capital and Sources of Liquidity $33.29 $38.51 $39.74 $41.43 $43.77 $40.87 $40.04 2020 2021 2022 2023 2024 2025 3Q26 Tangible Book Value Per Share1 Capital Ratios as of September 30, 20262 Company Bank Total Shareholder’s equity to Assets 6.02% 7.31% Tangible Common equity to Tangible Assets 5.94% 7.24% Tier 1 Leverage 6.15% 7.51% Common Equity Tier 1 8.86% 10.84% Tier 1 Capital 8.86% 10.84% Total Capital 12.32% 12.09% $652 $2,867 $958 $653 $20 $18 Liquidity Sources $ in millions Cash & Equivalents Off-Balance Sheet Deposits Fed Discount Window FHLB Borrowing Capacity Unpledged Securities Unsecured Funding $5,169 1 See Reconciliation of Non-GAAP Financial Measures in the Appendix 2 Regulatory capital ratios are preliminary pending filing of the Company’s and the Bank’s regulatory reports
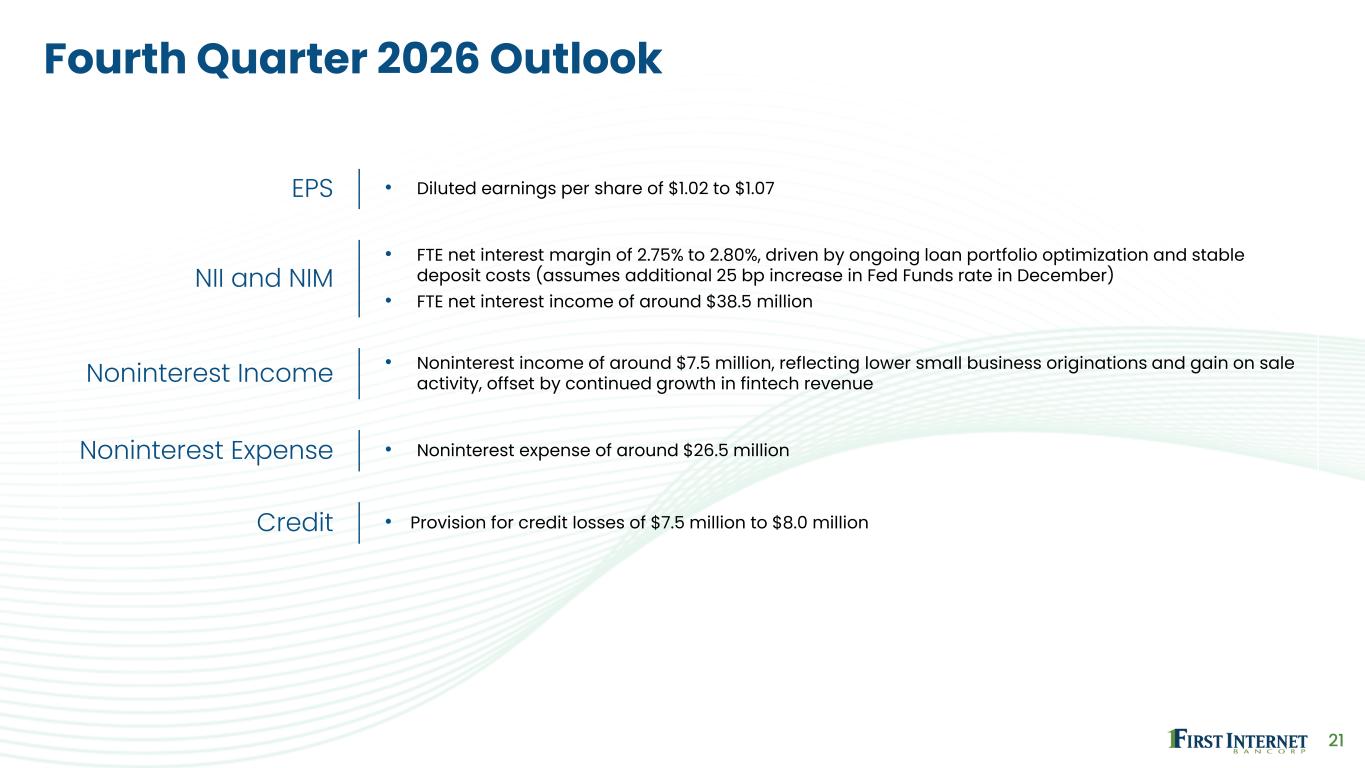
21 Fourth Quarter 2026 Outlook EPS • Diluted earnings per share of $1.02 to $1.07 NII and NIM • FTE net interest margin of 2.75% to 2.80%, driven by ongoing loan portfolio optimization and stable deposit costs (assumes additional 25 bp increase in Fed Funds rate in December) • FTE net interest income of around $38.5 million Noninterest Income • Noninterest income of around $7.5 million, reflecting lower small business originations and gain on sale activity, offset by continued growth in fintech revenue Noninterest Expense • Noninterest expense of around $26.5 million Credit • Provision for credit losses of $7.5 million to $8.0 million
Appendix
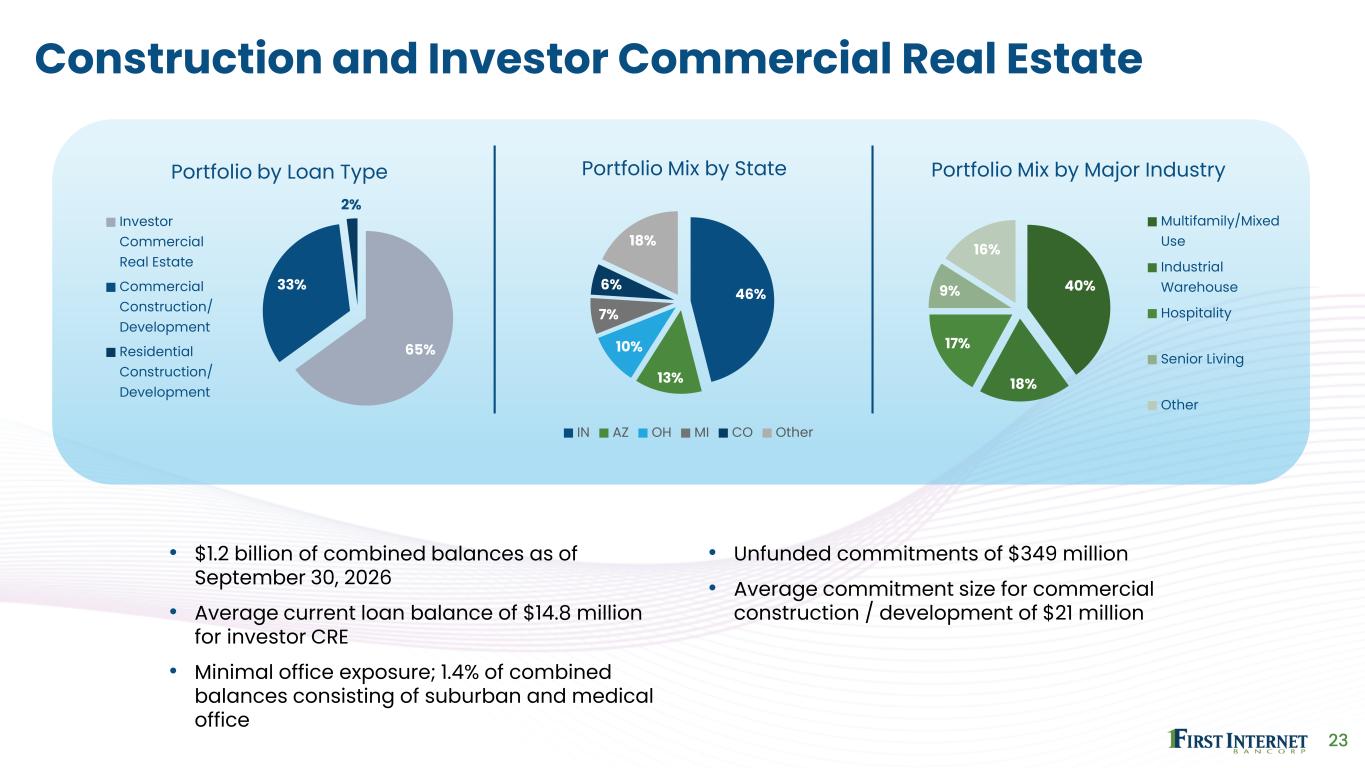
23 Construction and Investor Commercial Real Estate 46% 13% 10% 7% 6% 18% Portfolio Mix by State IN AZ OH MI CO Other 65% 33% 2% Portfolio by Loan Type Investor Commercial Real Estate Commercial Construction/ Development Residential Construction/ Development 40% 18% 17% 9% 16% Portfolio Mix by Major Industry Multifamily/Mixed Use Industrial Warehouse Hospitality Senior Living Other • $1.2 billion of combined balances as of September 30, 2026 • Average current loan balance of $14.8 million for investor CRE • Minimal office exposure; 1.4% of combined balances consisting of suburban and medical office • Unfunded commitments of $349 million • Average commitment size for commercial construction / development of $21 million
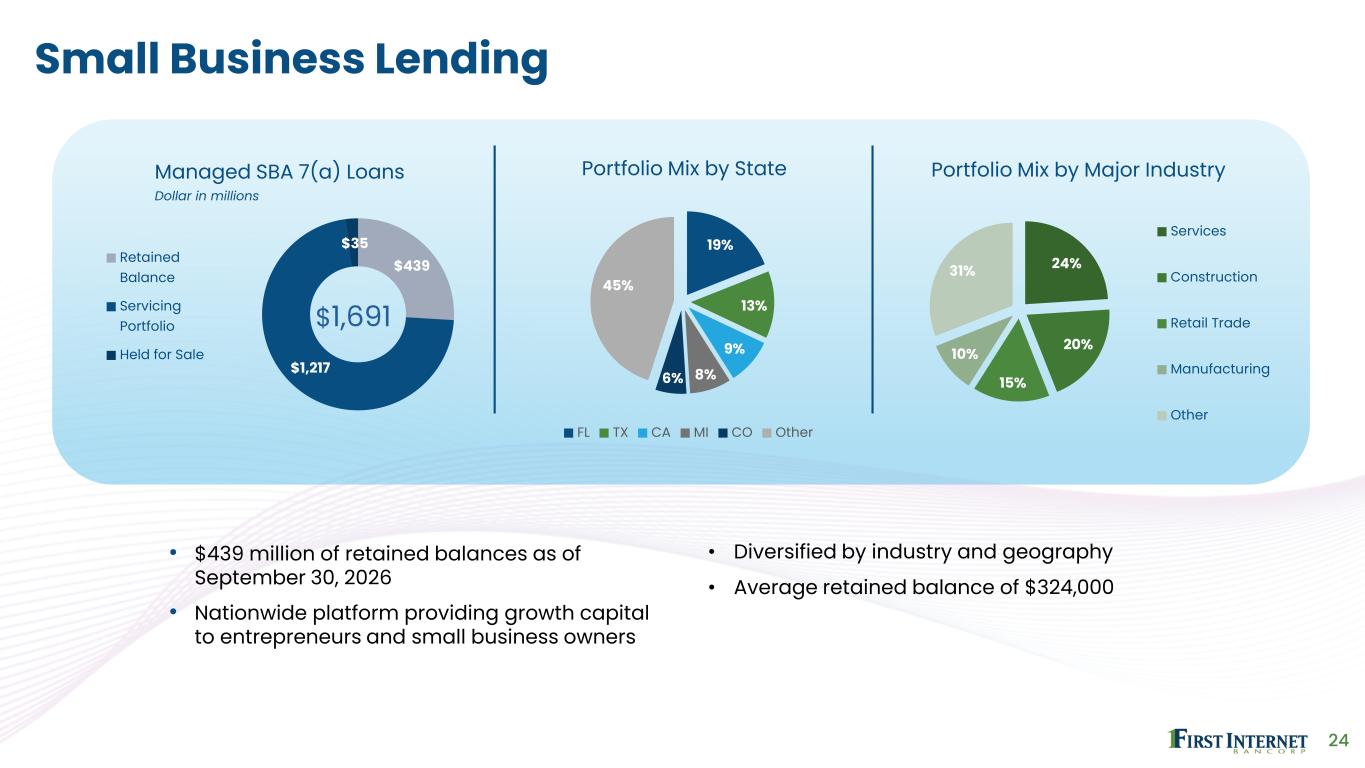
24 Small Business Lending 24% 20% 15% 10% 31% Portfolio Mix by Major Industry Services Construction Retail Trade Manufacturing Other $439 $1,217 $35 Managed SBA 7(a) Loans Dollar in millions Retained Balance Servicing Portfolio Held for Sale $1,691 19% 13% 9% 8%6% 45% Portfolio Mix by State FL TX CA MI CO Other • $439 million of retained balances as of September 30, 2026 • Nationwide platform providing growth capital to entrepreneurs and small business owners • Diversified by industry and geography • Average retained balance of $324,000
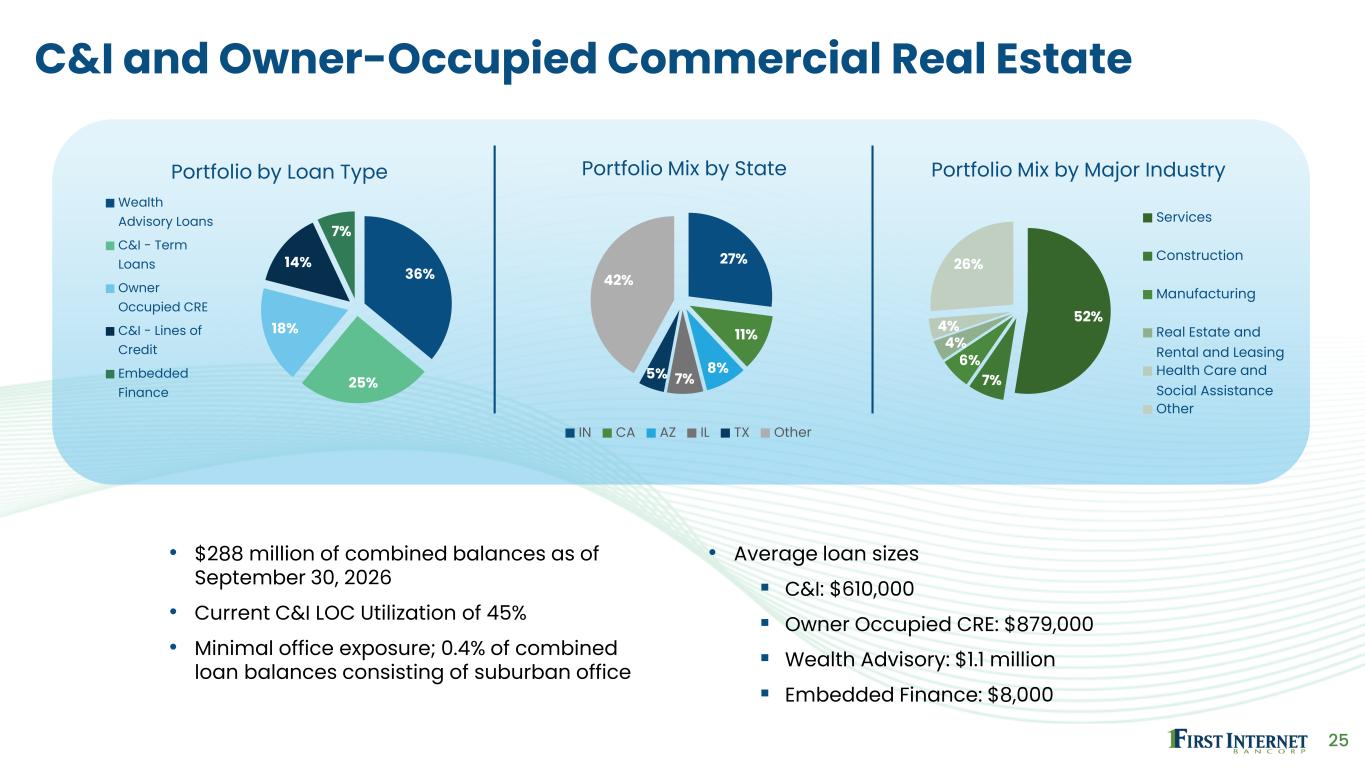
25 C&I and Owner-Occupied Commercial Real Estate • $288 million of combined balances as of September 30, 2026 • Current C&I LOC Utilization of 45% • Minimal office exposure; 0.4% of combined loan balances consisting of suburban office • Average loan sizes C&I: $610,000 Owner Occupied CRE: $879,000 Wealth Advisory: $1.1 million Embedded Finance: $8,000 36% 25% 18% 14% 7% Portfolio by Loan Type Wealth Advisory Loans C&I - Term Loans Owner Occupied CRE C&I - Lines of Credit Embedded Finance 27% 11% 8% 7%5% 42% Portfolio Mix by State IN CA AZ IL TX Other 52% 7% 6% 4% 4% 26% Portfolio Mix by Major Industry Services Construction Manufacturing Real Estate and Rental and Leasing Health Care and Social Assistance Other
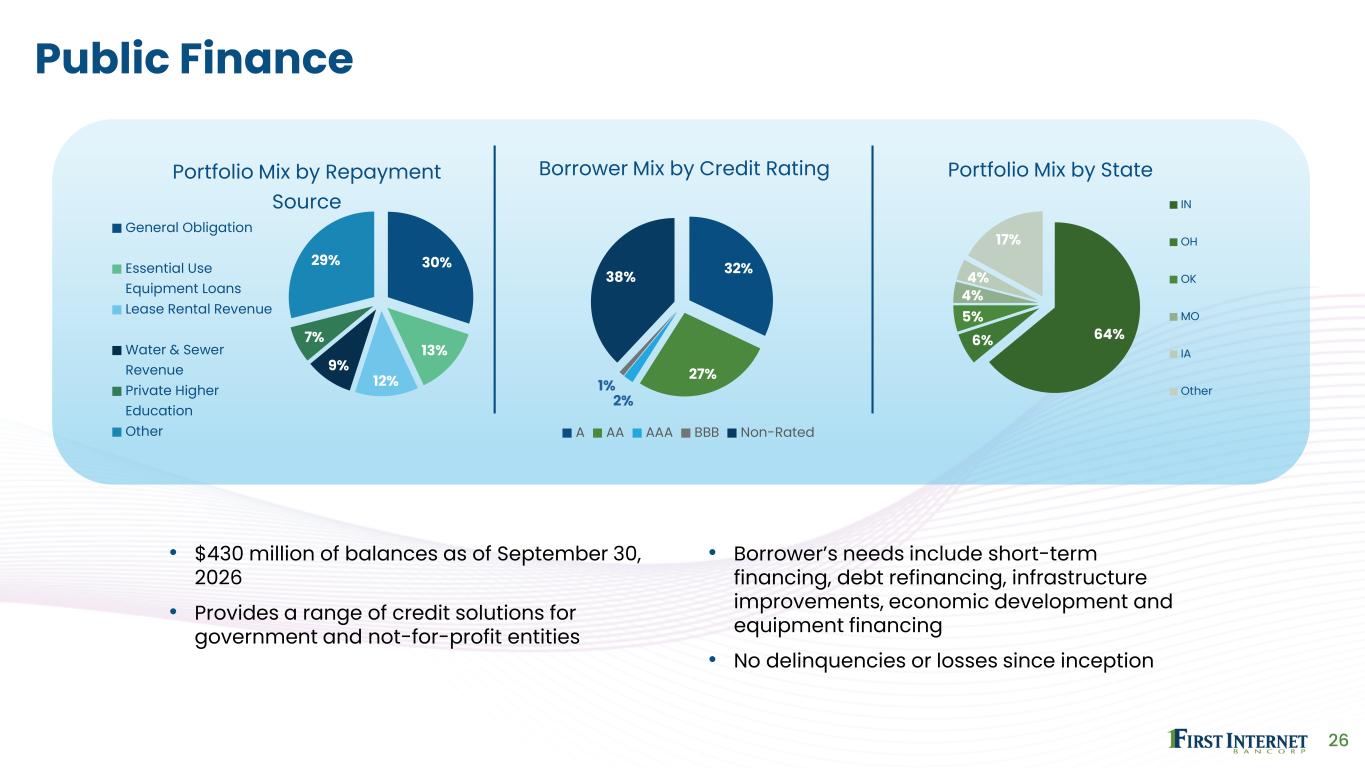
26 Public Finance • $430 million of balances as of September 30, 2026 • Provides a range of credit solutions for government and not-for-profit entities • Borrower’s needs include short-term financing, debt refinancing, infrastructure improvements, economic development and equipment financing • No delinquencies or losses since inception 30% 13% 12% 9% 7% 29% Portfolio Mix by Repayment Source General Obligation Essential Use Equipment Loans Lease Rental Revenue Water & Sewer Revenue Private Higher Education Other 32% 27% 2% 1% 38% Borrower Mix by Credit Rating A AA AAA BBB Non-Rated 64%6% 5% 4% 4% 17% Portfolio Mix by State IN OH OK MO IA Other
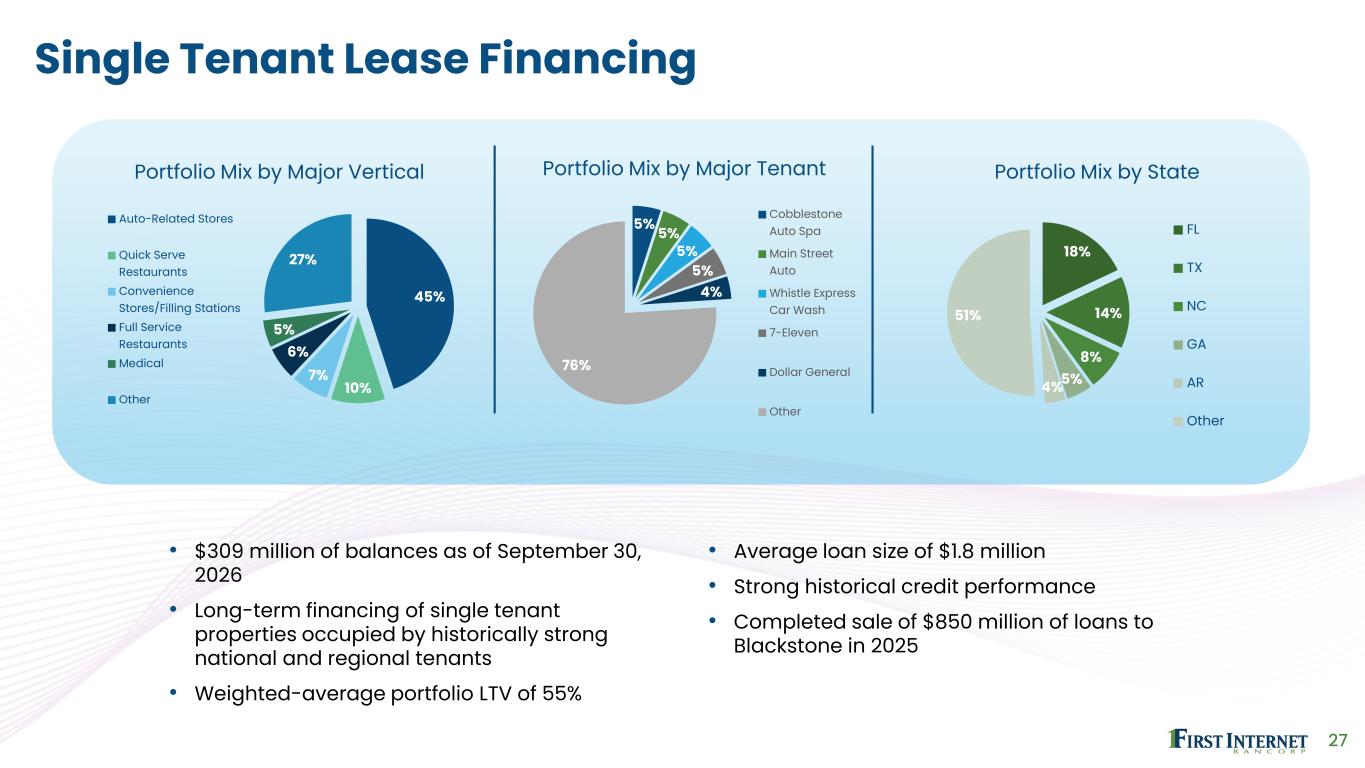
27 Single Tenant Lease Financing • $309 million of balances as of September 30, 2026 • Long-term financing of single tenant properties occupied by historically strong national and regional tenants • Weighted-average portfolio LTV of 55% • Average loan size of $1.8 million • Strong historical credit performance • Completed sale of $850 million of loans to Blackstone in 2025 45% 10% 7% 6% 5% 27% Portfolio Mix by Major Vertical Auto-Related Stores Quick Serve Restaurants Convenience Stores/Filling Stations Full Service Restaurants Medical Other 5% 5% 5% 5% 4% 76% Portfolio Mix by Major Tenant Cobblestone Auto Spa Main Street Auto Whistle Express Car Wash 7-Eleven Dollar General Other 18% 14% 8% 5%4% 51% Portfolio Mix by State FL TX NC GA AR Other
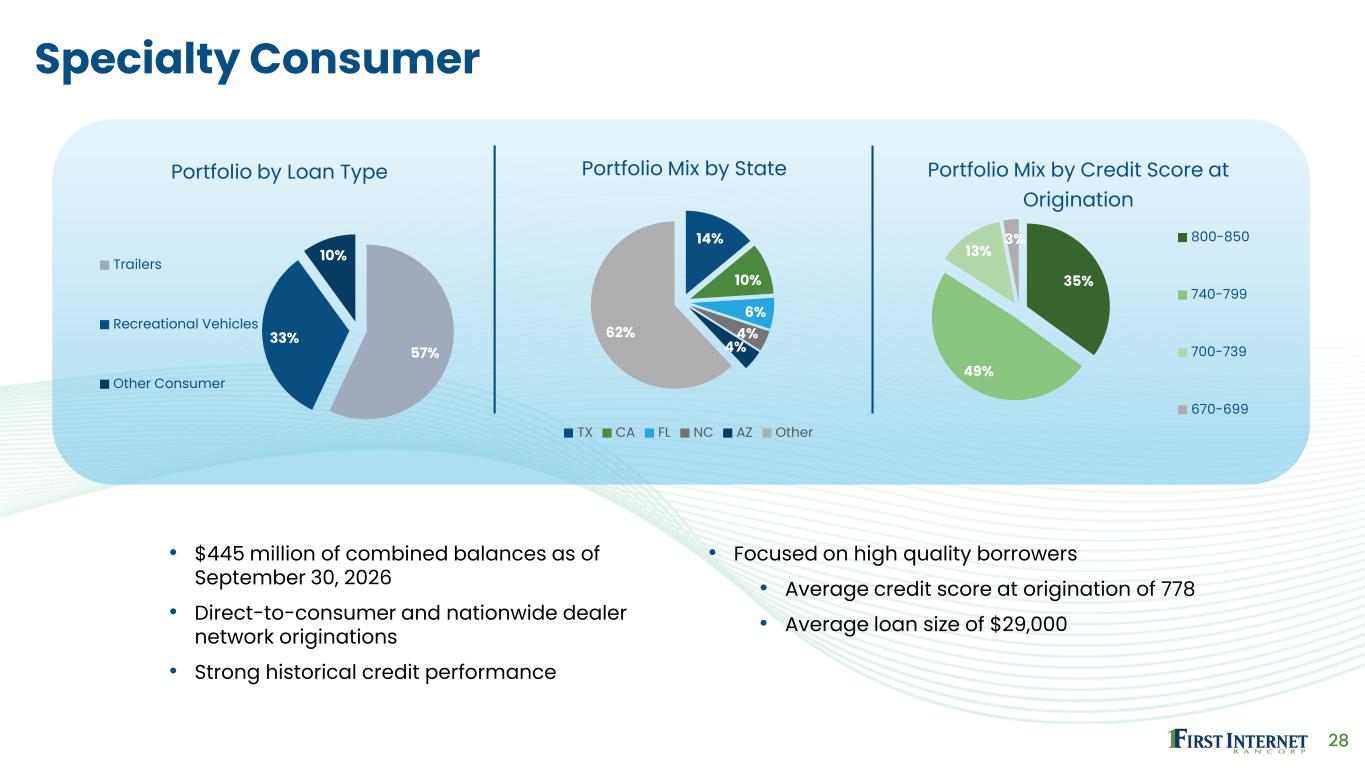
28 Specialty Consumer • $445 million of combined balances as of September 30, 2026 • Direct-to-consumer and nationwide dealer network originations • Strong historical credit performance • Focused on high quality borrowers • Average credit score at origination of 778 • Average loan size of $29,000 57% 33% 10% Portfolio by Loan Type Trailers Recreational Vehicles Other Consumer 14% 10% 6% 4% 4% 62% Portfolio Mix by State TX CA FL NC AZ Other 35% 49% 13% 3% Portfolio Mix by Credit Score at Origination 800-850 740-799 700-739 670-699
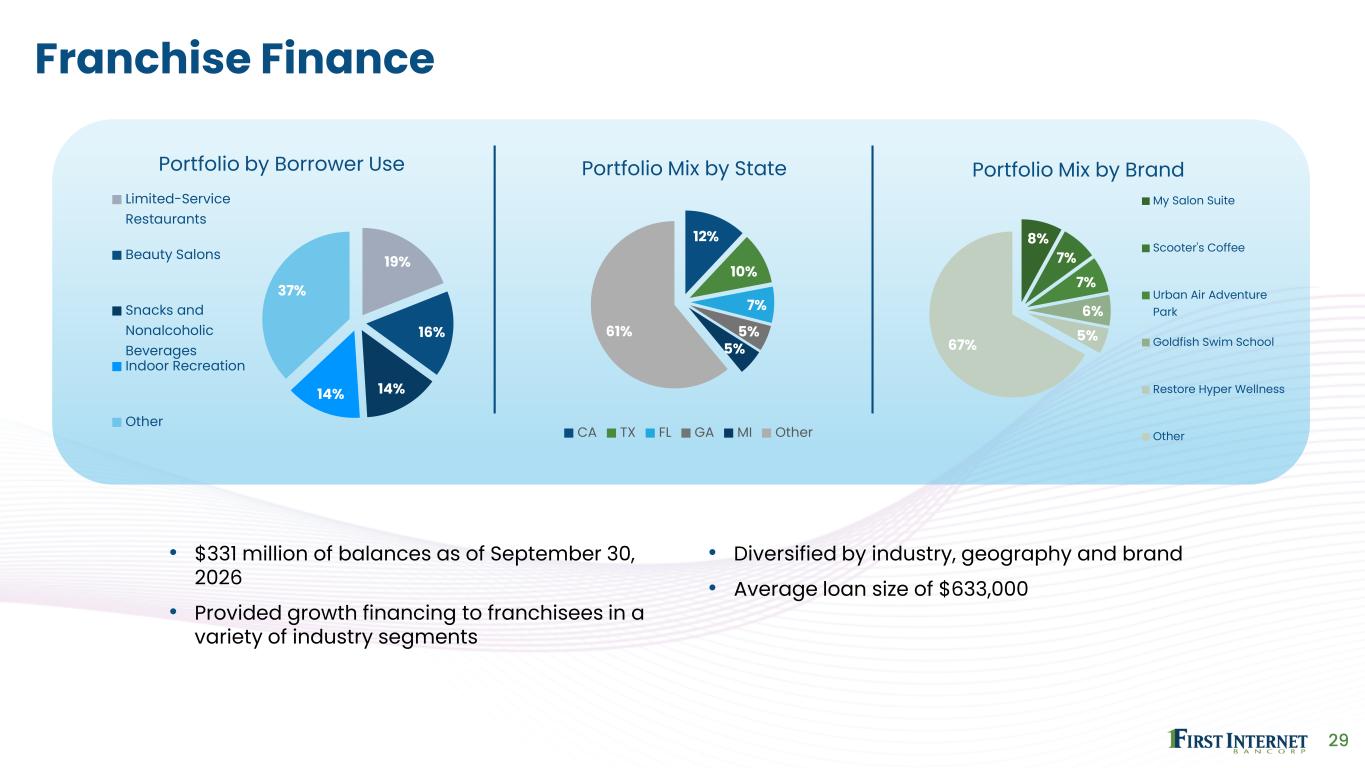
29 Franchise Finance • $331 million of balances as of September 30, 2026 • Provided growth financing to franchisees in a variety of industry segments • Diversified by industry, geography and brand • Average loan size of $633,000 19% 16% 14%14% 37% Portfolio by Borrower Use Limited-Service Restaurants Beauty Salons Snacks and Nonalcoholic Beverages Indoor Recreation Other 12% 10% 7% 5% 5% 61% Portfolio Mix by State CA TX FL GA MI Other 8% 7% 7% 6% 5%67% Portfolio Mix by Brand My Salon Suite Scooter's Coffee Urban Air Adventure Park Goldfish Swim School Restore Hyper Wellness Other
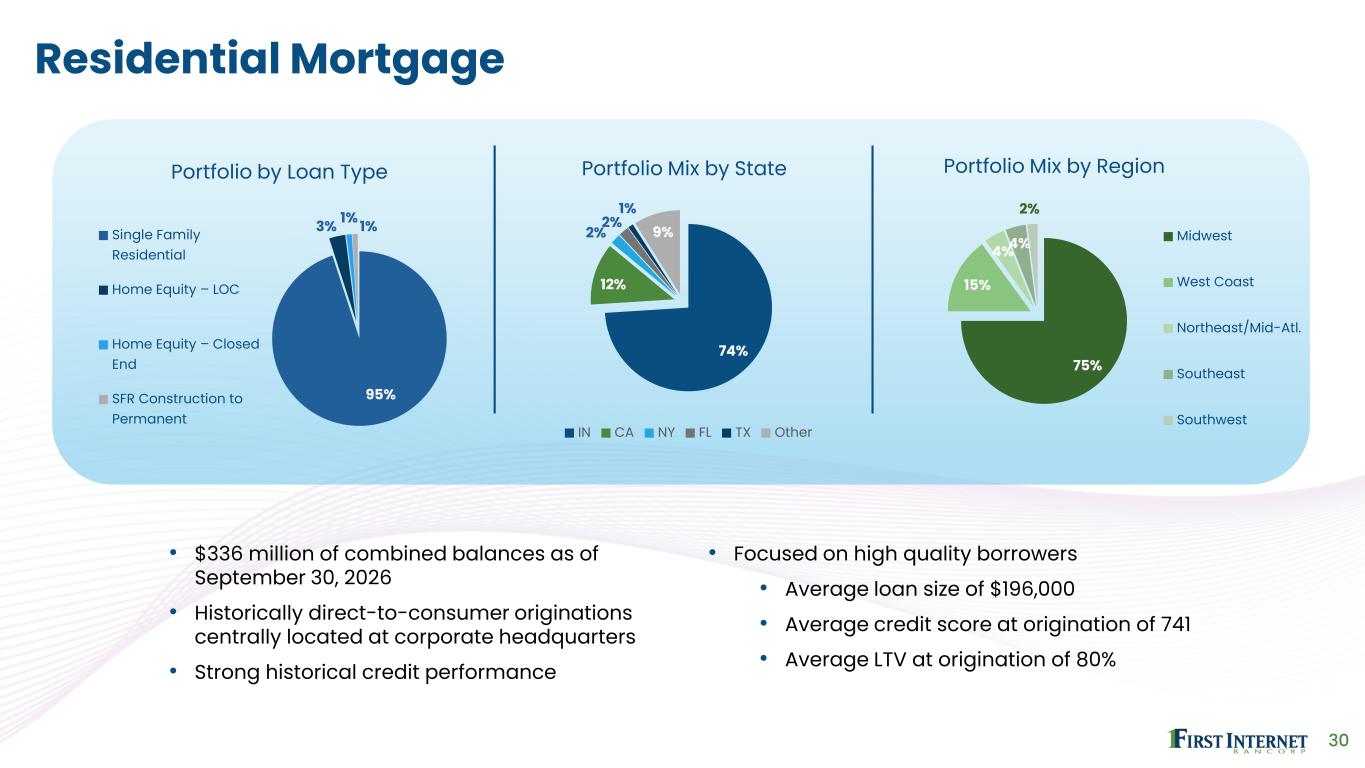
30 Residential Mortgage • $336 million of combined balances as of September 30, 2026 • Historically direct-to-consumer originations centrally located at corporate headquarters • Strong historical credit performance • Focused on high quality borrowers • Average loan size of $196,000 • Average credit score at origination of 741 • Average LTV at origination of 80% 95% 3% 1% 1% Portfolio by Loan Type Single Family Residential Home Equity – LOC Home Equity – Closed End SFR Construction to Permanent 74% 12% 2% 2% 1% 9% Portfolio Mix by State IN CA NY FL TX Other 75% 15% 4%4% 2% Portfolio Mix by Region Midwest West Coast Northeast/Mid-Atl. Southeast Southwest
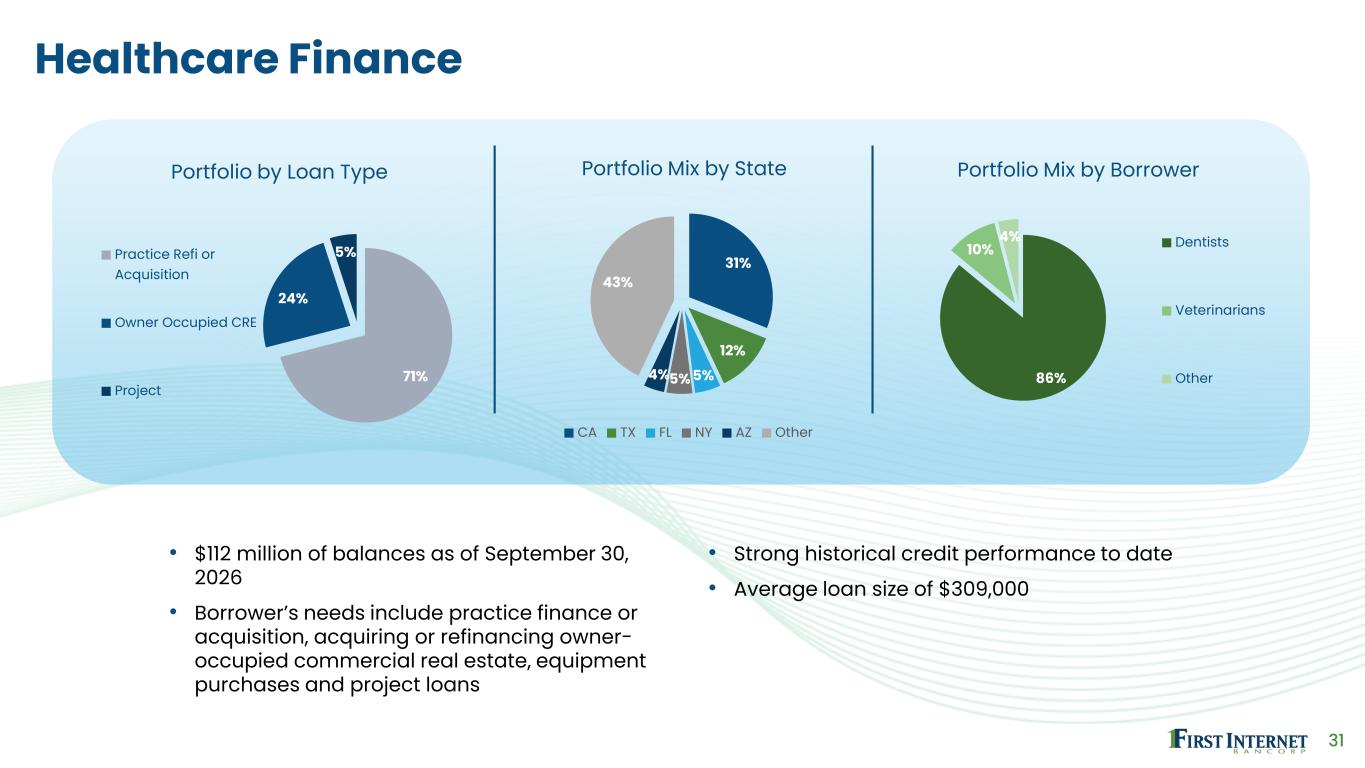
31 Healthcare Finance • $112 million of balances as of September 30, 2026 • Borrower’s needs include practice finance or acquisition, acquiring or refinancing owner- occupied commercial real estate, equipment purchases and project loans • Strong historical credit performance to date • Average loan size of $309,000 71% 24% 5% Portfolio by Loan Type Practice Refi or Acquisition Owner Occupied CRE Project 31% 12% 5%5%4% 43% Portfolio Mix by State CA TX FL NY AZ Other 86% 10% 4% Portfolio Mix by Borrower Dentists Veterinarians Other
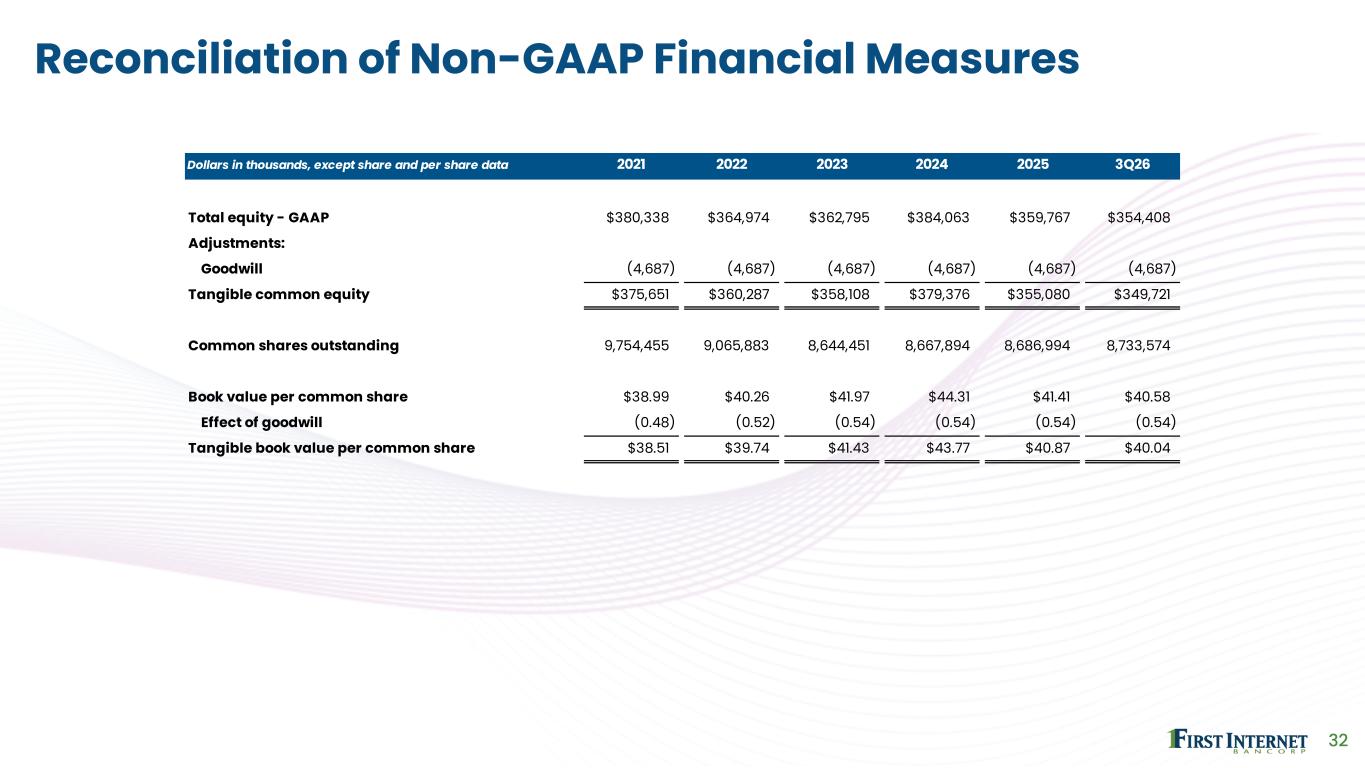
Dollars in thousands, except share and per share data 2021 2022 2023 2024 2025 3Q26 Total equity - GAAP $380,338 $364,974 $362,795 $384,063 $359,767 $354,408 Adjustments: Goodwill (4,687) (4,687) (4,687) (4,687) (4,687) (4,687) Tangible common equity $375,651 $360,287 $358,108 $379,376 $355,080 $349,721 Common shares outstanding 9,754,455 9,065,883 8,644,451 8,667,894 8,686,994 8,733,574 Book value per common share $38.99 $40.26 $41.97 $44.31 $41.41 $40.58 Effect of goodwill (0.48) (0.52) (0.54) (0.54) (0.54) (0.54) Tangible book value per common share $38.51 $39.74 $41.43 $43.77 $40.87 $40.04 32 Reconciliation of Non-GAAP Financial Measures
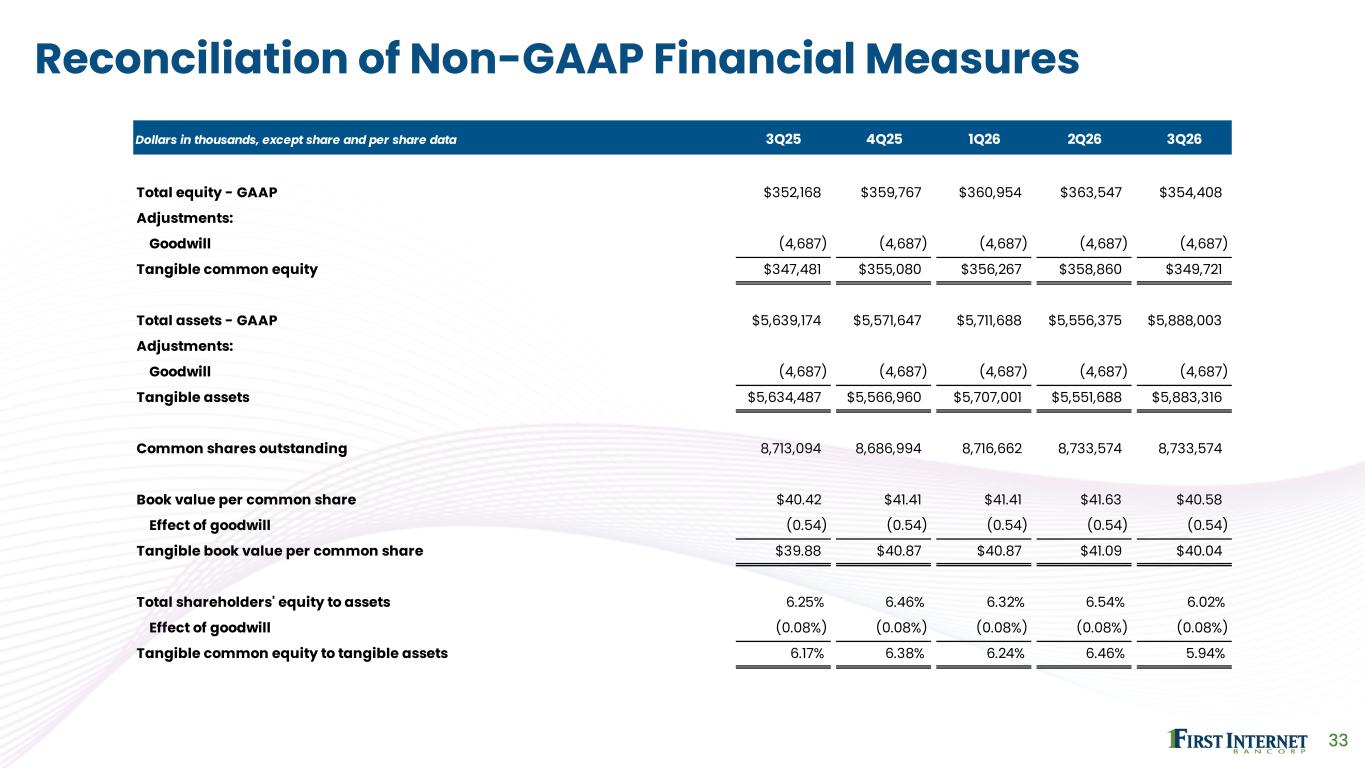
Dollars in thousands, except share and per share data 3Q25 4Q25 1Q26 2Q26 3Q26 Total equity - GAAP $352,168 $359,767 $360,954 $363,547 $354,408 Adjustments: Goodwill (4,687) (4,687) (4,687) (4,687) (4,687) Tangible common equity $347,481 $355,080 $356,267 $358,860 $349,721 Total assets - GAAP $5,639,174 $5,571,647 $5,711,688 $5,556,375 $5,888,003 Adjustments: Goodwill (4,687) (4,687) (4,687) (4,687) (4,687) Tangible assets $5,634,487 $5,566,960 $5,707,001 $5,551,688 $5,883,316 Common shares outstanding 8,713,094 8,686,994 8,716,662 8,733,574 8,733,574 Book value per common share $40.42 $41.41 $41.41 $41.63 $40.58 Effect of goodwill (0.54) (0.54) (0.54) (0.54) (0.54) Tangible book value per common share $39.88 $40.87 $40.87 $41.09 $40.04 Total shareholders' equity to assets 6.25% 6.46% 6.32% 6.54% 6.02% Effect of goodwill (0.08%) (0.08%) (0.08%) (0.08%) (0.08%) Tangible common equity to tangible assets 6.17% 6.38% 6.24% 6.46% 5.94% 33 Reconciliation of Non-GAAP Financial Measures
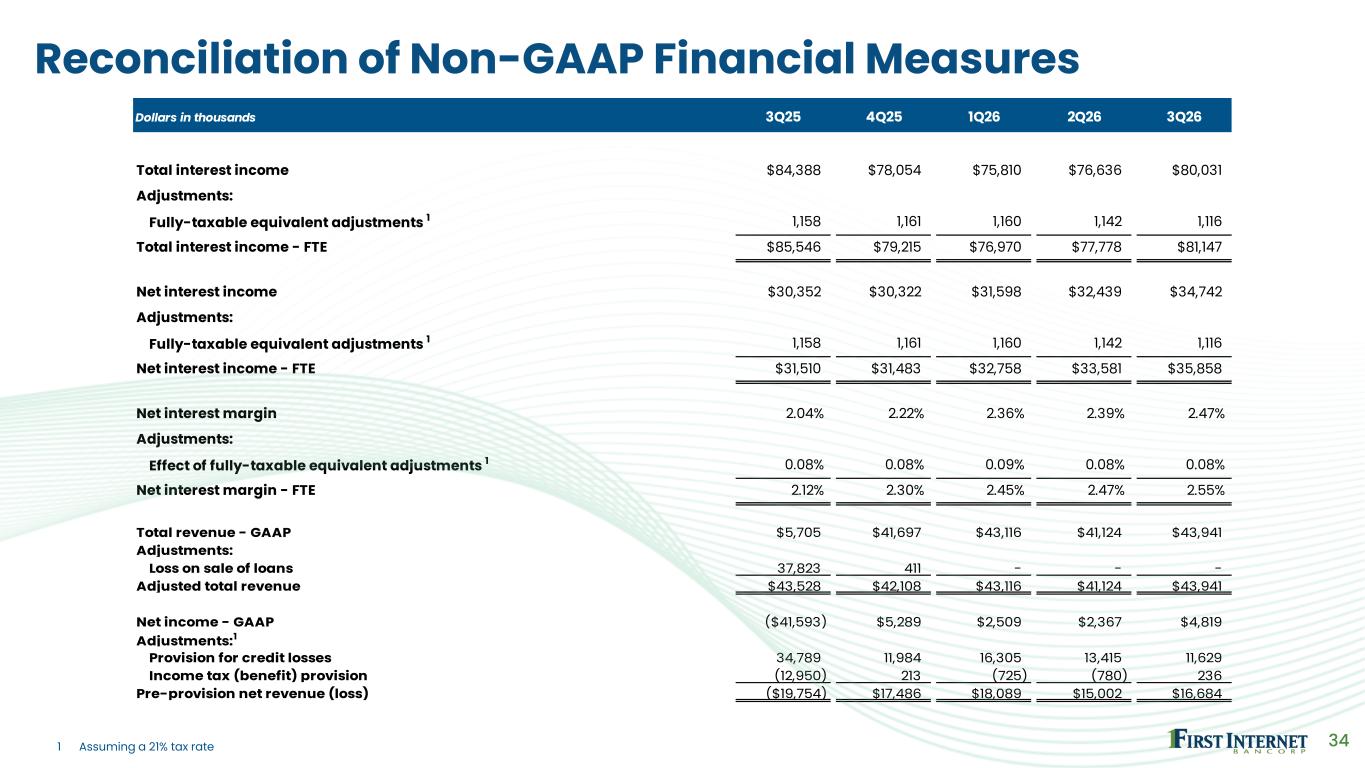
Dollars in thousands 3Q25 4Q25 1Q26 2Q26 3Q26 Total interest income $84,388 $78,054 $75,810 $76,636 $80,031 Adjustments: Fully-taxable equivalent adjustments 1 1,158 1,161 1,160 1,142 1,116 Total interest income - FTE $85,546 $79,215 $76,970 $77,778 $81,147 Net interest income $30,352 $30,322 $31,598 $32,439 $34,742 Adjustments: Fully-taxable equivalent adjustments 1 1,158 1,161 1,160 1,142 1,116 Net interest income - FTE $31,510 $31,483 $32,758 $33,581 $35,858 Net interest margin 2.04% 2.22% 2.36% 2.39% 2.47% Adjustments: Effect of fully-taxable equivalent adjustments 1 0.08% 0.08% 0.09% 0.08% 0.08% Net interest margin - FTE 2.12% 2.30% 2.45% 2.47% 2.55% Total revenue - GAAP $5,705 $41,697 $43,116 $41,124 $43,941 Adjustments: Loss on sale of loans 37,823 411 - - - Adjusted total revenue $43,528 $42,108 $43,116 $41,124 $43,941 Net income - GAAP ($41,593) $5,289 $2,509 $2,367 $4,819 Adjustments:1 Provision for credit losses 34,789 11,984 16,305 13,415 11,629 Income tax (benefit) provision (12,950) 213 (725) (780) 236 Pre-provision net revenue (loss) ($19,754) $17,486 $18,089 $15,002 $16,684 34 Reconciliation of Non-GAAP Financial Measures 1 Assuming a 21% tax rate
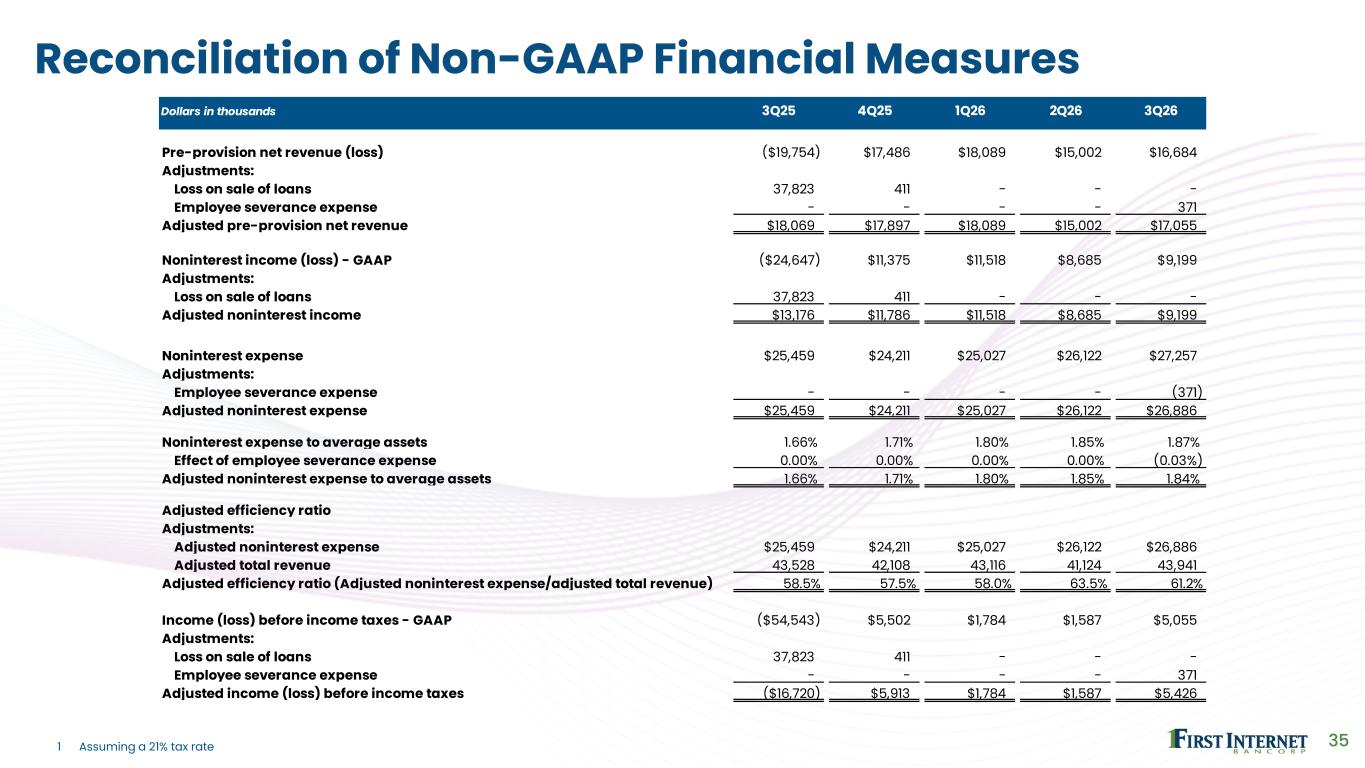
Dollars in thousands 3Q25 4Q25 1Q26 2Q26 3Q26 Pre-provision net revenue (loss) ($19,754) $17,486 $18,089 $15,002 $16,684 Adjustments: Loss on sale of loans 37,823 411 - - - Employee severance expense - - - - 371 Adjusted pre-provision net revenue $18,069 $17,897 $18,089 $15,002 $17,055 Noninterest income (loss) - GAAP ($24,647) $11,375 $11,518 $8,685 $9,199 Adjustments: Loss on sale of loans 37,823 411 - - - Adjusted noninterest income $13,176 $11,786 $11,518 $8,685 $9,199 Noninterest expense $25,459 $24,211 $25,027 $26,122 $27,257 Adjustments: Employee severance expense - - - - (371) Adjusted noninterest expense $25,459 $24,211 $25,027 $26,122 $26,886 Noninterest expense to average assets 1.66% 1.71% 1.80% 1.85% 1.87% Effect of employee severance expense 0.00% 0.00% 0.00% 0.00% (0.03%) Adjusted noninterest expense to average assets 1.66% 1.71% 1.80% 1.85% 1.84% Adjusted efficiency ratio Adjustments: Adjusted noninterest expense $25,459 $24,211 $25,027 $26,122 $26,886 Adjusted total revenue 43,528 42,108 43,116 41,124 43,941 Adjusted efficiency ratio (Adjusted noninterest expense/adjusted total revenue) 58.5% 57.5% 58.0% 63.5% 61.2% Income (loss) before income taxes - GAAP ($54,543) $5,502 $1,784 $1,587 $5,055 Adjustments: Loss on sale of loans 37,823 411 - - - Employee severance expense - - - - 371 Adjusted income (loss) before income taxes ($16,720) $5,913 $1,784 $1,587 $5,426 35 Reconciliation of Non-GAAP Financial Measures 1 Assuming a 21% tax rate
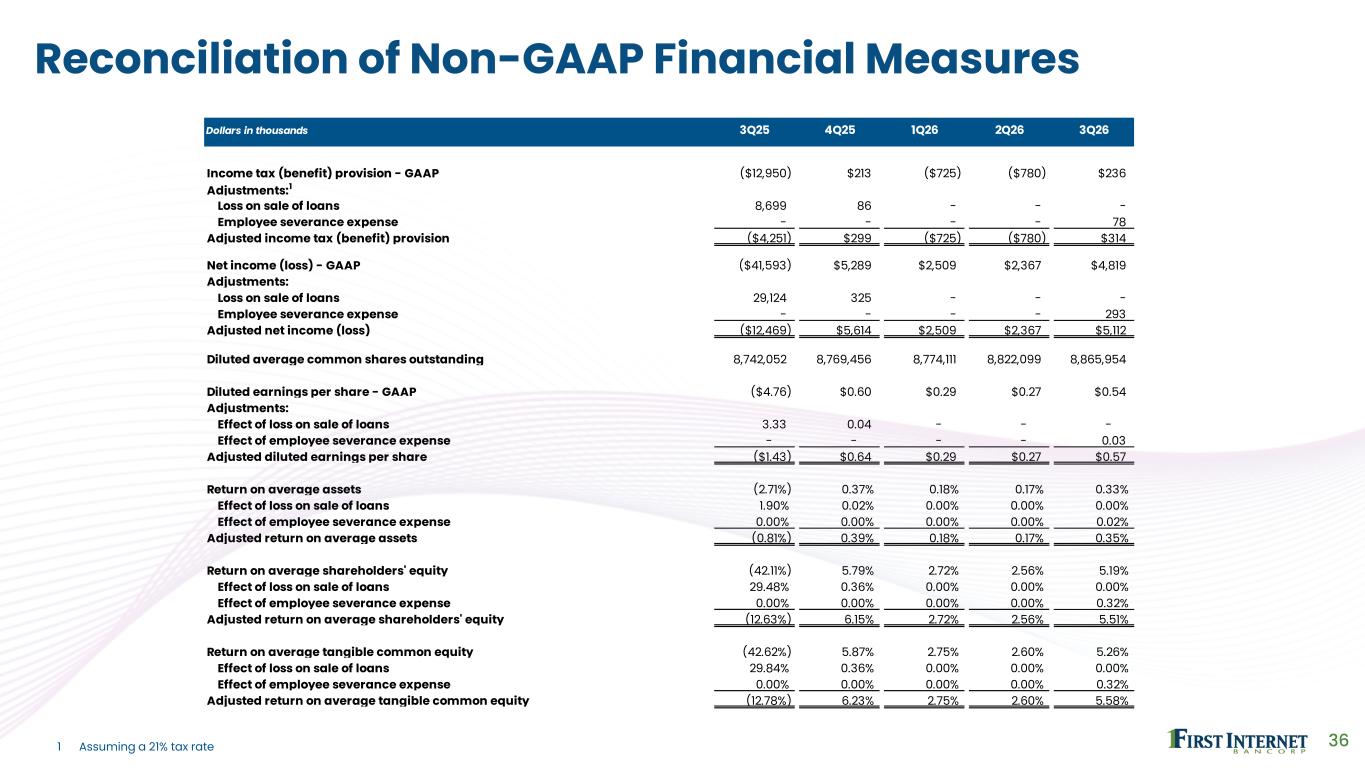
Dollars in thousands 3Q25 4Q25 1Q26 2Q26 3Q26 Income tax (benefit) provision - GAAP ($12,950) $213 ($725) ($780) $236 Adjustments:1 Loss on sale of loans 8,699 86 - - - Employee severance expense - - - - 78 Adjusted income tax (benefit) provision ($4,251) $299 ($725) ($780) $314 Net income (loss) - GAAP ($41,593) $5,289 $2,509 $2,367 $4,819 Adjustments: Loss on sale of loans 29,124 325 - - - Employee severance expense - - - - 293 Adjusted net income (loss) ($12,469) $5,614 $2,509 $2,367 $5,112 Diluted average common shares outstanding 8,742,052 8,769,456 8,774,111 8,822,099 8,865,954 Diluted earnings per share - GAAP ($4.76) $0.60 $0.29 $0.27 $0.54 Adjustments: Effect of loss on sale of loans 3.33 0.04 - - - Effect of employee severance expense - - - - 0.03 Adjusted diluted earnings per share ($1.43) $0.64 $0.29 $0.27 $0.57 Return on average assets (2.71%) 0.37% 0.18% 0.17% 0.33% Effect of loss on sale of loans 1.90% 0.02% 0.00% 0.00% 0.00% Effect of employee severance expense 0.00% 0.00% 0.00% 0.00% 0.02% Adjusted return on average assets (0.81%) 0.39% 0.18% 0.17% 0.35% Return on average shareholders' equity (42.11%) 5.79% 2.72% 2.56% 5.19% Effect of loss on sale of loans 29.48% 0.36% 0.00% 0.00% 0.00% Effect of employee severance expense 0.00% 0.00% 0.00% 0.00% 0.32% Adjusted return on average shareholders' equity (12.63%) 6.15% 2.72% 2.56% 5.51% Return on average tangible common equity (42.62%) 5.87% 2.75% 2.60% 5.26% Effect of loss on sale of loans 29.84% 0.36% 0.00% 0.00% 0.00% Effect of employee severance expense 0.00% 0.00% 0.00% 0.00% 0.32% Adjusted return on average tangible common equity (12.78%) 6.23% 2.75% 2.60% 5.58% 36 Reconciliation of Non-GAAP Financial Measures 1 Assuming a 21% tax rate
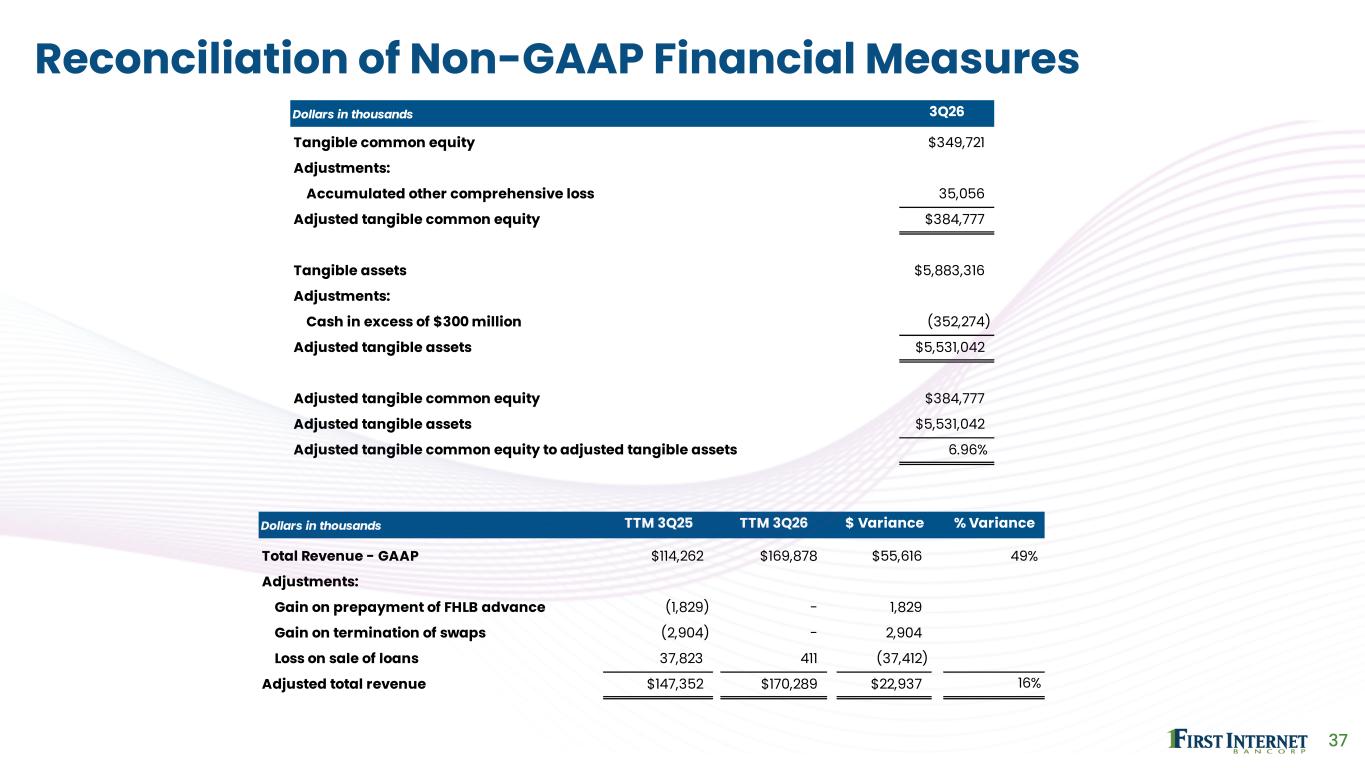
Dollars in thousands TTM 3Q25 TTM 3Q26 $ Variance % Variance Total Revenue - GAAP $114,262 $169,878 $55,616 49% Adjustments: Gain on prepayment of FHLB advance (1,829) - 1,829 Gain on termination of swaps (2,904) - 2,904 Loss on sale of loans 37,823 411 (37,412) Adjusted total revenue $147,352 $170,289 $22,937 16% Dollars in thousands 3Q26 Tangible common equity $349,721 Adjustments: Accumulated other comprehensive loss 35,056 Adjusted tangible common equity $384,777 Tangible assets $5,883,316 Adjustments: Cash in excess of $300 million (352,274) Adjusted tangible assets $5,531,042 Adjusted tangible common equity $384,777 Adjusted tangible assets $5,531,042 Adjusted tangible common equity to adjusted tangible assets 6.96% 37 Reconciliation of Non-GAAP Financial Measures
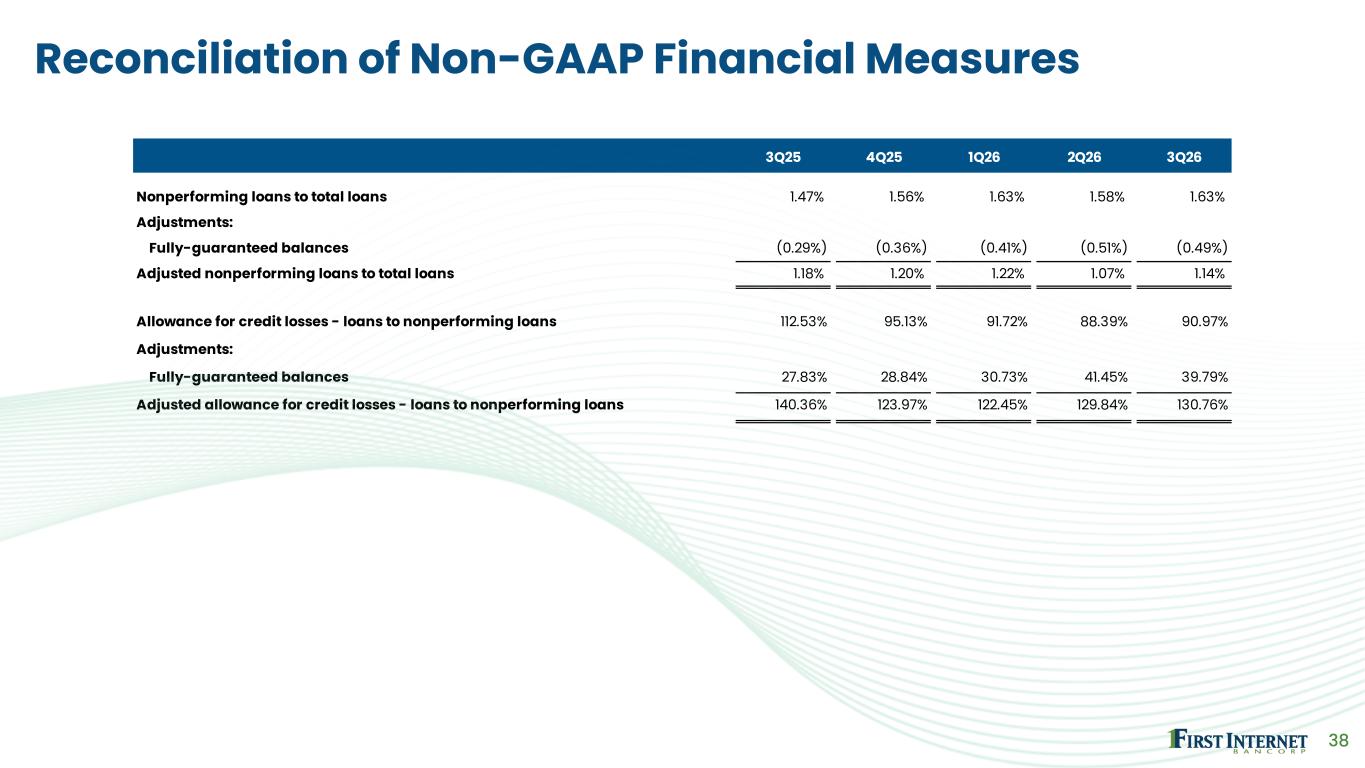
3Q25 4Q25 1Q26 2Q26 3Q26 Nonperforming loans to total loans 1.47% 1.56% 1.63% 1.58% 1.63% Adjustments: Fully-guaranteed balances (0.29%) (0.36%) (0.41%) (0.51%) (0.49%) Adjusted nonperforming loans to total loans 1.18% 1.20% 1.22% 1.07% 1.14% Allowance for credit losses - loans to nonperforming loans 112.53% 95.13% 91.72% 88.39% 90.97% Adjustments: Fully-guaranteed balances 27.83% 28.84% 30.73% 41.45% 39.79% Adjusted allowance for credit losses - loans to nonperforming loans 140.36% 123.97% 122.45% 129.84% 130.76% 38 Reconciliation of Non-GAAP Financial Measures