
Third Quarter 2026 Exhibit 99.1 Investor Presentation

2 Important note regarding forward-looking statements: Statements made in this presentation (or conveyed orally) which are not purely historical are forward-looking statements, as defined in the Private Securities Litigation Reform Act of 1995. This includes any statements regarding Coastal Financial Corporation's ("Coastal or the "Company"") plans, objectives, or goals for future operations, products or services, and forecasts of its revenues, earnings, or other measures of performance. Such forward-looking statements may be identified by the use of words such as “believe,” “expect,” “anticipate,” “plan,” “estimate,” “should,” “intend,” "target,” “outlook,” “project,” “guidance,” “forecast,” or similar expressions. Forward-looking statements are based on current management expectations and, by their nature, are subject to risks and uncertainties. Actual results may differ materially from those contained in the forward-looking statements. Factors which may cause actual results to differ materially from those contained in such forward-looking statements include the the Company's ability to effectively evaluate and manage counterparty risk associated with CCBX partners and those risks identified in the Company’s most recent Form 10-K and subsequent Form 10-Qs and other SEC filings, and such factors are incorporated herein by reference. If one or more events related to these or other risks or uncertainties materialize, or if Coastal’s underlying assumptions prove to be incorrect, actual results may differ materially from what Coastal anticipates. You are cautioned not to place undue reliance on forward-looking statements. Further, any forward-looking statement speaks only as of the date on which it is made and Coastal undertakes no obligation to update or revise any forward-looking statement to reflect events or circumstances after the date on which the statement is made or to reflect the occurrence of unanticipated events. Trademarks: All trademarks, service marks, and trade names referenced in this material are official trademarks and the property of their respective owners. Presentation: Within the charts and tables presented, certain segments, columns and rows may not sum to totals shown due to rounding. Non-GAAP Financial Measures: This presentation includes certain non-GAAP financial measures. These non-GAAP financial measures are provided in addition to, and not as substitutes for, measures of our financial performance determined in accordance with GAAP. Our calculation of these non-GAAP financial measures may not be comparable to similarly titled measures of other companies due to potential differences between companies in the method of calculation. As a result, the use of these non-GAAP financial measures has limitations and should not be considered superior to, in isolation from, or as a substitute for, related GAAP measures. Reconciliations of these non-GAAP financial measures to the most directly comparable GAAP financial measures can be found at the end of this presentation. This presentation includes non-GAAP financial measures to illustrate the impact of BaaS loan expense on net loan income and yield on CCBX loans, and net interest margin. Net BaaS loan income divided by average CCBX loans is a non-GAAP financial measure adjusts for the impact BaaS loan expense on net BaaS loan income and the yield on CCBX loans. The most directly comparable GAAP measure is yield on CCBX loans. Net interest income net of BaaS loan expense divided by average earning assets is a non-GAAP financial measure adjusts for the impact BaaS loan expense on net interest income. The most directly comparable GAAP measure is net interest income. Net interest margin, net of BaaS loan expense is a non-GAAP financial measure adjusts for the impact of BaaS loan expense on net interest margin. The most directly comparable GAAP measure is net interest margin. This presentation includes non-GAAP financial measures to provide meaningful supplemental information regarding the Company’s operational performance and to enhance investors’ overall understanding of such financial performance. Pre-tax, pre-provision net revenue ("PPNR") is presented to illustrate the impact of provision for income tax, provision for credit losses, BaaS credit and fraud indemnification income and BaaS loan expense have on net income. The most directly comparable GAAP measure is net income. Core expenses is presented to illustrate the impact of BaaS loan expense and BaaS fraud expenses and reimbursement of expenses (BaaS) have on noninterest expense. The most directly comparable GAAP measure is noninterest expense. Core net revenue is presented to illustrate the impact of BaaS credit enhancements, BaaS fraud enhancements, reimbursement of expenses (GAAP) and BaaS loan expense have on revenue. The most directly comparable GAAP measure is revenue. This presentation includes a non-GAAP financial measure to illustrate the impact of intangible assets on book value per share. We calculate tangible book value per share as total shareholders’ equity at the end of the relevant period, less goodwill and other intangible assets, divided by the outstanding number of our common shares at the end of each period. The most directly comparable GAAP financial measure is book value per share. Legal Information and Disclaimer
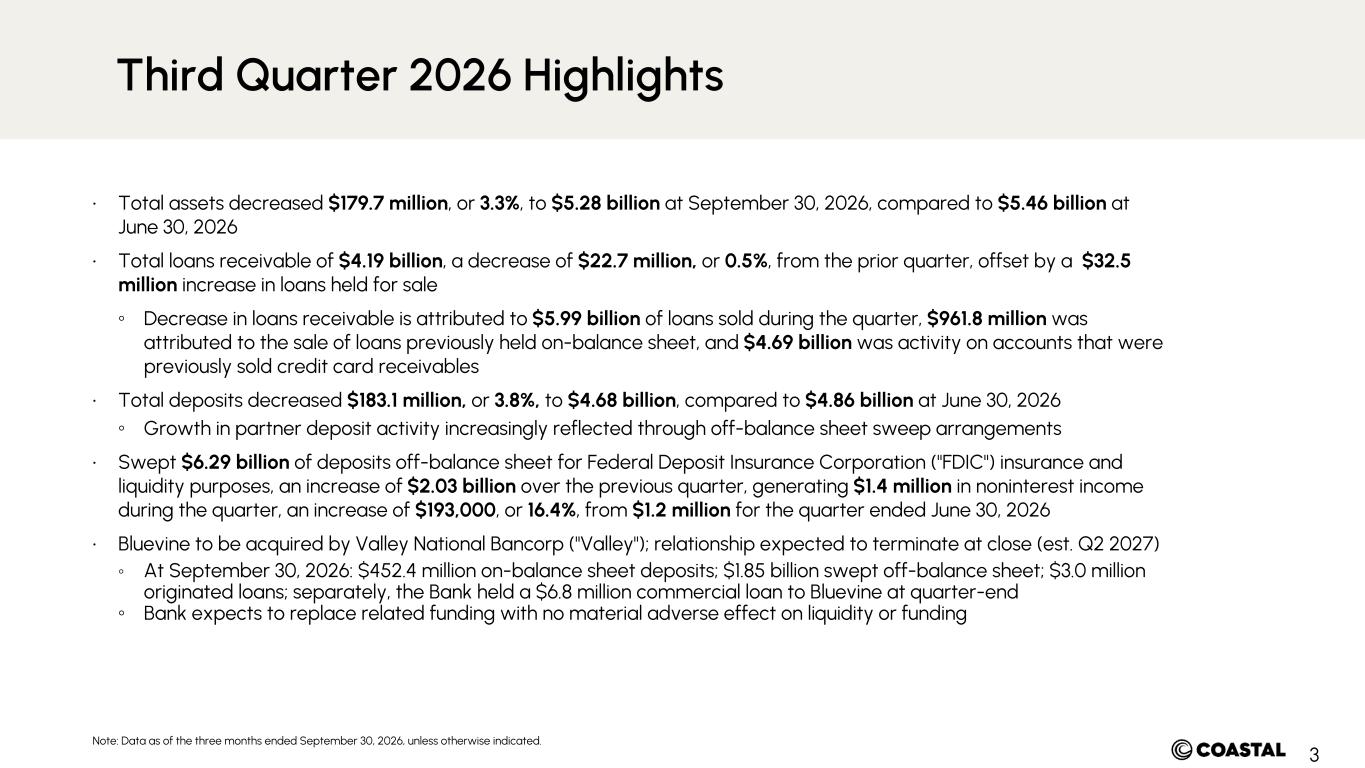
3 Note: Data as of the three months ended September 30, 2026, unless otherwise indicated. • Total assets decreased $179.7 million, or 3.3%, to $5.28 billion at September 30, 2026, compared to $5.46 billion at June 30, 2026 • Total loans receivable of $4.19 billion, a decrease of $22.7 million, or 0.5%, from the prior quarter, offset by a $32.5 million increase in loans held for sale ◦ Decrease in loans receivable is attributed to $5.99 billion of loans sold during the quarter, $961.8 million was attributed to the sale of loans previously held on-balance sheet, and $4.69 billion was activity on accounts that were previously sold credit card receivables • Total deposits decreased $183.1 million, or 3.8%, to $4.68 billion, compared to $4.86 billion at June 30, 2026 ◦ Growth in partner deposit activity increasingly reflected through off-balance sheet sweep arrangements • Swept $6.29 billion of deposits off-balance sheet for Federal Deposit Insurance Corporation ("FDIC") insurance and liquidity purposes, an increase of $2.03 billion over the previous quarter, generating $1.4 million in noninterest income during the quarter, an increase of $193,000, or 16.4%, from $1.2 million for the quarter ended June 30, 2026 • Bluevine to be acquired by Valley National Bancorp ("Valley"); relationship expected to terminate at close (est. Q2 2027) ◦ At September 30, 2026: $452.4 million on-balance sheet deposits; $1.85 billion swept off-balance sheet; $3.0 million originated loans; separately, the Bank held a $6.8 million commercial loan to Bluevine at quarter-end ◦ Bank expects to replace related funding with no material adverse effect on liquidity or funding Third Quarter 2026 Highlights
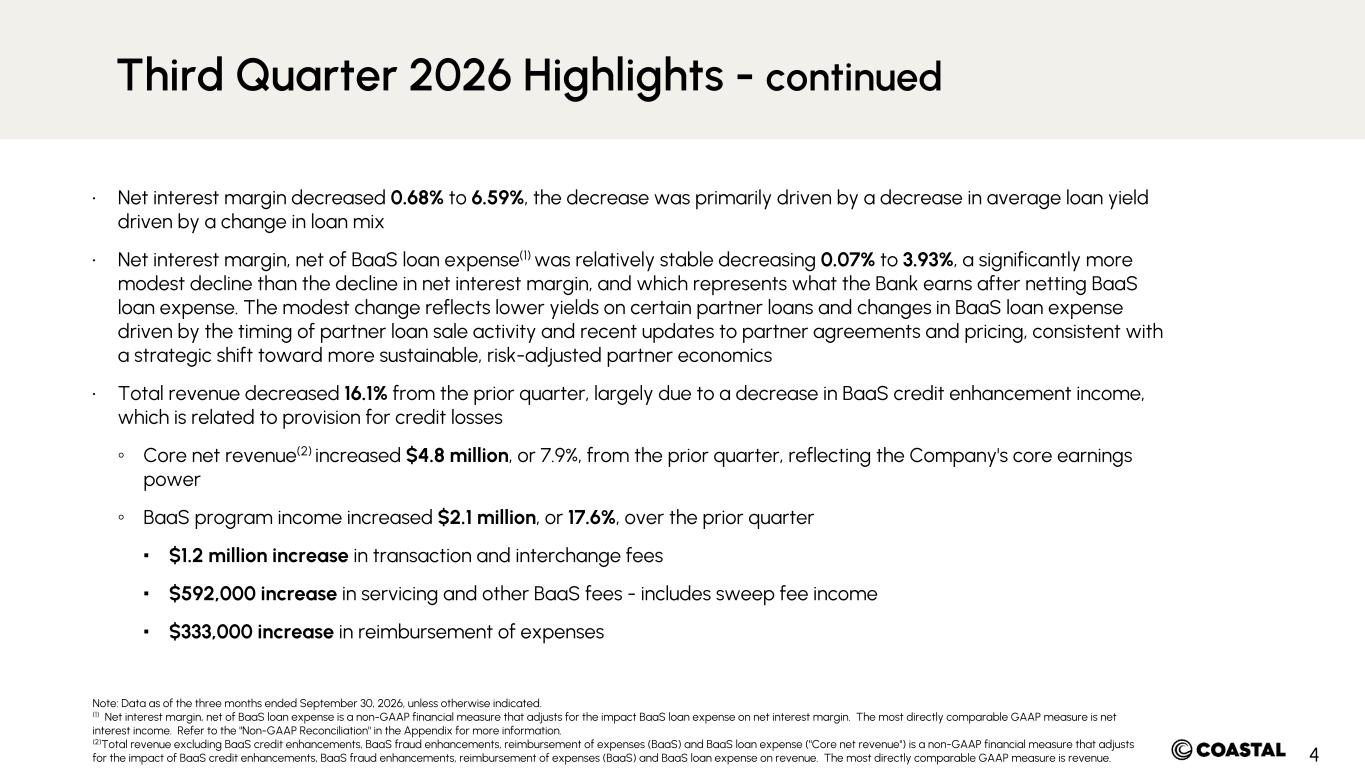
4 Note: Data as of the three months ended September 30, 2026, unless otherwise indicated. (1) Net interest margin, net of BaaS loan expense is a non-GAAP financial measure that adjusts for the impact BaaS loan expense on net interest margin. The most directly comparable GAAP measure is net interest income. Refer to the "Non-GAAP Reconciliation" in the Appendix for more information. (2)Total revenue excluding BaaS credit enhancements, BaaS fraud enhancements, reimbursement of expenses (BaaS) and BaaS loan expense ("Core net revenue") is a non-GAAP financial measure that adjusts for the impact of BaaS credit enhancements, BaaS fraud enhancements, reimbursement of expenses (BaaS) and BaaS loan expense on revenue. The most directly comparable GAAP measure is revenue. • Net interest margin decreased 0.68% to 6.59%, the decrease was primarily driven by a decrease in average loan yield driven by a change in loan mix • Net interest margin, net of BaaS loan expense(1) was relatively stable decreasing 0.07% to 3.93%, a significantly more modest decline than the decline in net interest margin, and which represents what the Bank earns after netting BaaS loan expense. The modest change reflects lower yields on certain partner loans and changes in BaaS loan expense driven by the timing of partner loan sale activity and recent updates to partner agreements and pricing, consistent with a strategic shift toward more sustainable, risk-adjusted partner economics • Total revenue decreased 16.1% from the prior quarter, largely due to a decrease in BaaS credit enhancement income, which is related to provision for credit losses ◦ Core net revenue(2) increased $4.8 million, or 7.9%, from the prior quarter, reflecting the Company's core earnings power ◦ BaaS program income increased $2.1 million, or 17.6%, over the prior quarter ▪ $1.2 million increase in transaction and interchange fees ▪ $592,000 increase in servicing and other BaaS fees - includes sweep fee income ▪ $333,000 increase in reimbursement of expenses Third Quarter 2026 Highlights - continued
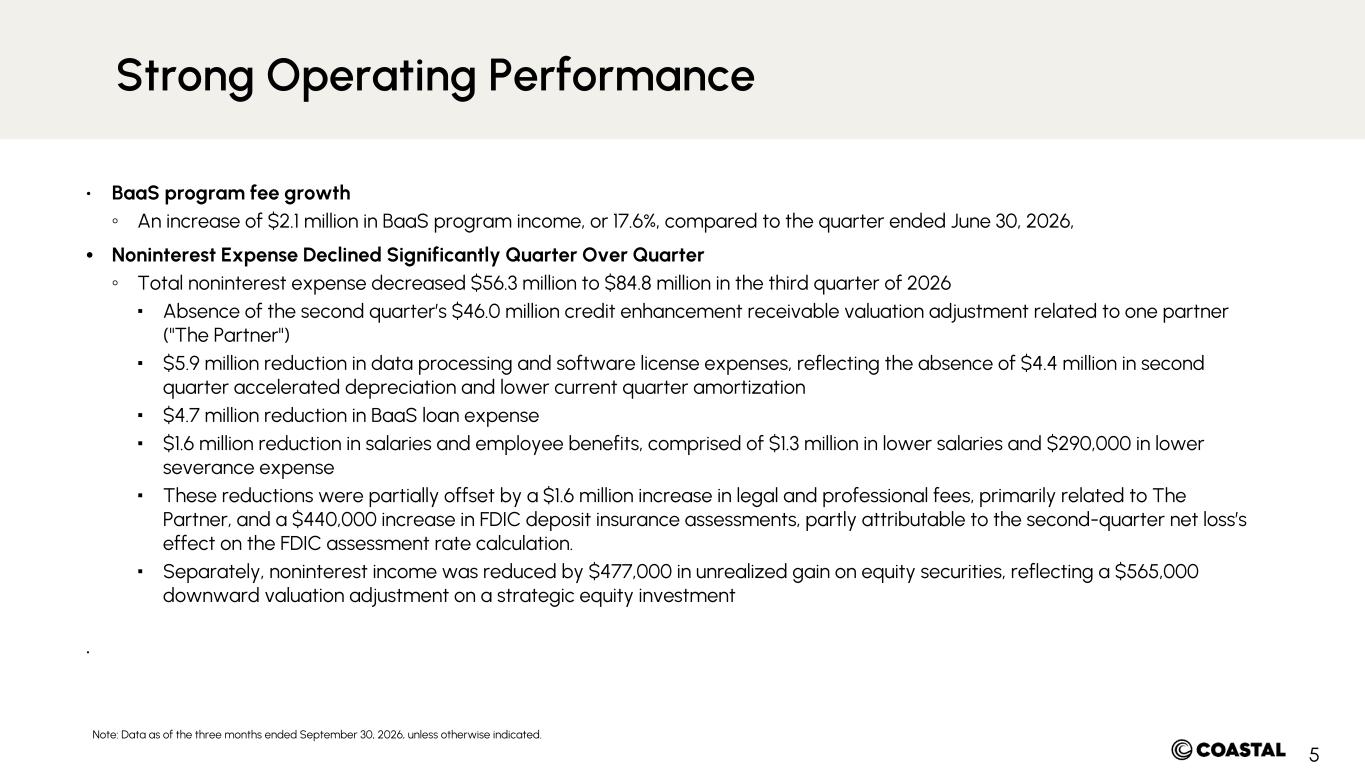
5 Note: Data as of the three months ended September 30, 2026, unless otherwise indicated. Strong Operating Performance • BaaS program fee growth ◦ An increase of $2.1 million in BaaS program income, or 17.6%, compared to the quarter ended June 30, 2026, • Noninterest Expense Declined Significantly Quarter Over Quarter ◦ Total noninterest expense decreased $56.3 million to $84.8 million in the third quarter of 2026 ▪ Absence of the second quarter’s $46.0 million credit enhancement receivable valuation adjustment related to one partner ("The Partner") ▪ $5.9 million reduction in data processing and software license expenses, reflecting the absence of $4.4 million in second quarter accelerated depreciation and lower current quarter amortization ▪ $4.7 million reduction in BaaS loan expense ▪ $1.6 million reduction in salaries and employee benefits, comprised of $1.3 million in lower salaries and $290,000 in lower severance expense ▪ These reductions were partially offset by a $1.6 million increase in legal and professional fees, primarily related to The Partner, and a $440,000 increase in FDIC deposit insurance assessments, partly attributable to the second-quarter net loss’s effect on the FDIC assessment rate calculation. ▪ Separately, noninterest income was reduced by $477,000 in unrealized gain on equity securities, reflecting a $565,000 downward valuation adjustment on a strategic equity investment •
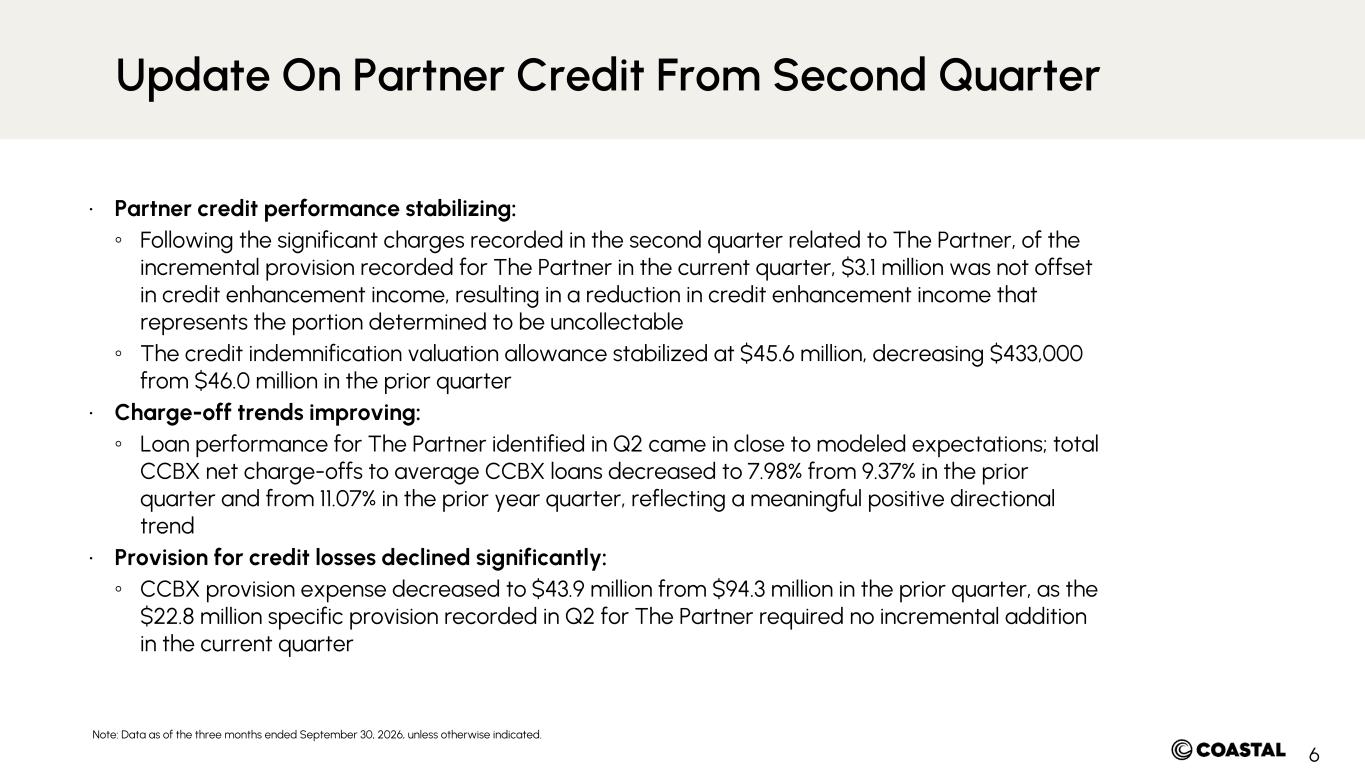
6 Note: Data as of the three months ended September 30, 2026, unless otherwise indicated. Update On Partner Credit From Second Quarter • Partner credit performance stabilizing: ◦ Following the significant charges recorded in the second quarter related to The Partner, of the incremental provision recorded for The Partner in the current quarter, $3.1 million was not offset in credit enhancement income, resulting in a reduction in credit enhancement income that represents the portion determined to be uncollectable ◦ The credit indemnification valuation allowance stabilized at $45.6 million, decreasing $433,000 from $46.0 million in the prior quarter • Charge-off trends improving: ◦ Loan performance for The Partner identified in Q2 came in close to modeled expectations; total CCBX net charge-offs to average CCBX loans decreased to 7.98% from 9.37% in the prior quarter and from 11.07% in the prior year quarter, reflecting a meaningful positive directional trend • Provision for credit losses declined significantly: ◦ CCBX provision expense decreased to $43.9 million from $94.3 million in the prior quarter, as the $22.8 million specific provision recorded in Q2 for The Partner required no incremental addition in the current quarter
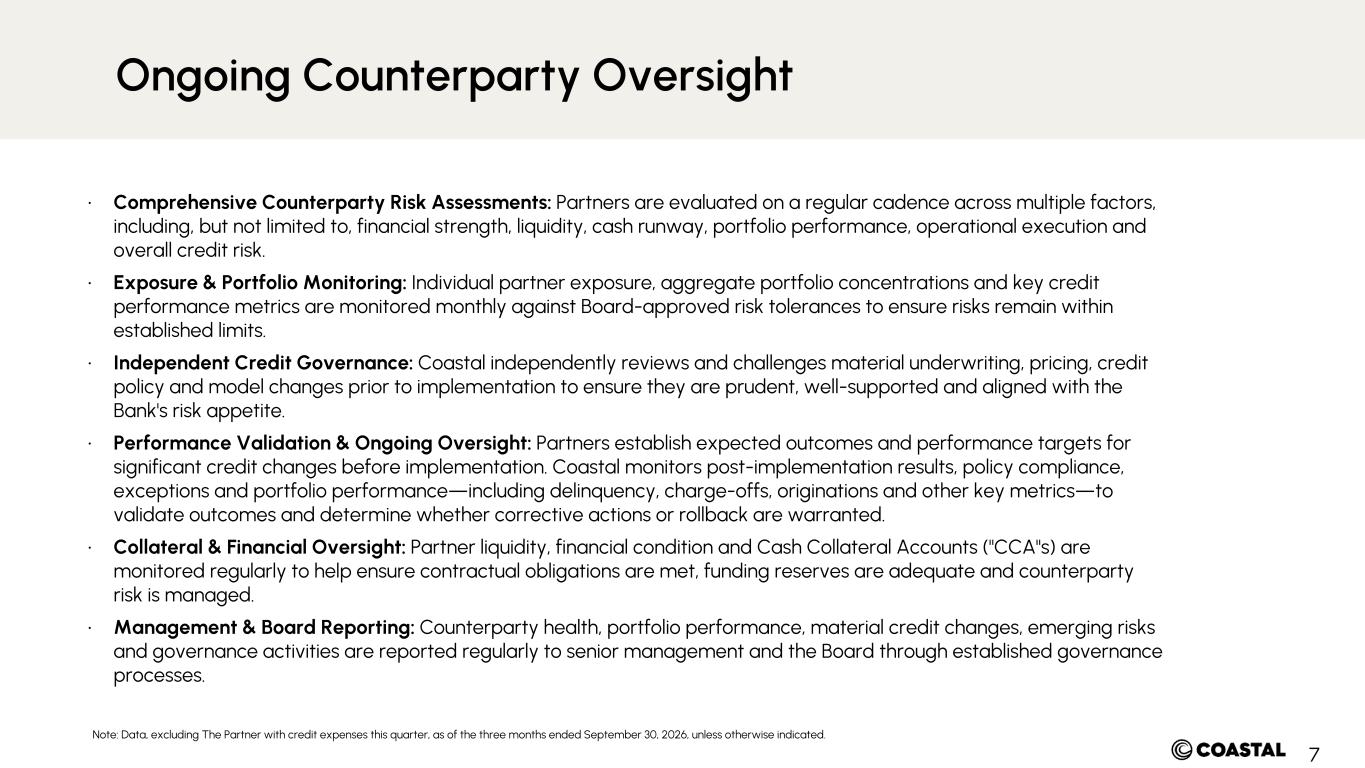
7 Note: Data, excluding The Partner with credit expenses this quarter, as of the three months ended September 30, 2026, unless otherwise indicated. Ongoing Counterparty Oversight • Comprehensive Counterparty Risk Assessments: Partners are evaluated on a regular cadence across multiple factors, including, but not limited to, financial strength, liquidity, cash runway, portfolio performance, operational execution and overall credit risk. • Exposure & Portfolio Monitoring: Individual partner exposure, aggregate portfolio concentrations and key credit performance metrics are monitored monthly against Board-approved risk tolerances to ensure risks remain within established limits. • Independent Credit Governance: Coastal independently reviews and challenges material underwriting, pricing, credit policy and model changes prior to implementation to ensure they are prudent, well-supported and aligned with the Bank's risk appetite. • Performance Validation & Ongoing Oversight: Partners establish expected outcomes and performance targets for significant credit changes before implementation. Coastal monitors post-implementation results, policy compliance, exceptions and portfolio performance—including delinquency, charge-offs, originations and other key metrics—to validate outcomes and determine whether corrective actions or rollback are warranted. • Collateral & Financial Oversight: Partner liquidity, financial condition and Cash Collateral Accounts ("CCA"s) are monitored regularly to help ensure contractual obligations are met, funding reserves are adequate and counterparty risk is managed. • Management & Board Reporting: Counterparty health, portfolio performance, material credit changes, emerging risks and governance activities are reported regularly to senior management and the Board through established governance processes.
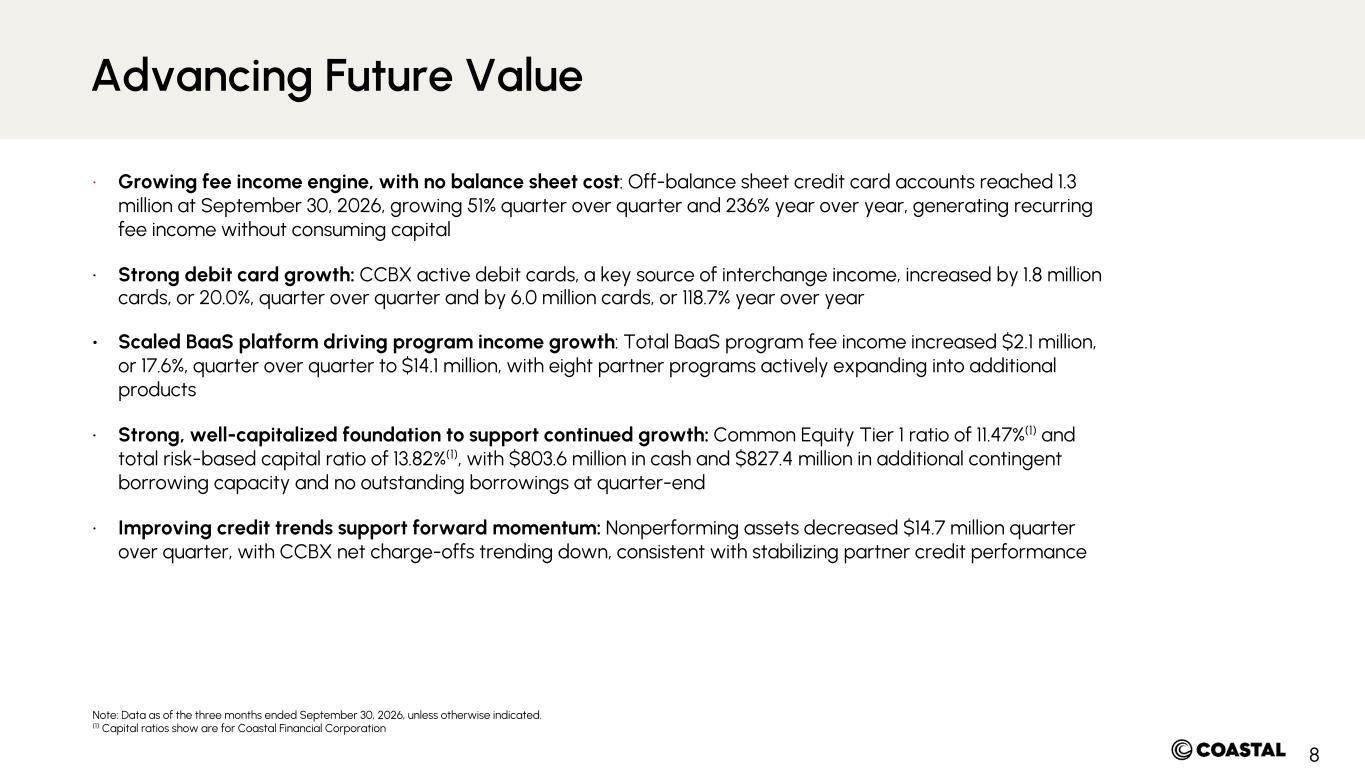
8 Note: Data as of the three months ended September 30, 2026, unless otherwise indicated. (1) Capital ratios show are for Coastal Financial Corporation • Growing fee income engine, with no balance sheet cost: Off-balance sheet credit card accounts reached 1.3 million at September 30, 2026, growing 51% quarter over quarter and 236% year over year, generating recurring fee income without consuming capital • Strong debit card growth: CCBX active debit cards, a key source of interchange income, increased by 1.8 million cards, or 20.0%, quarter over quarter and by 6.0 million cards, or 118.7% year over year • Scaled BaaS platform driving program income growth: Total BaaS program fee income increased $2.1 million, or 17.6%, quarter over quarter to $14.1 million, with eight partner programs actively expanding into additional products • Strong, well-capitalized foundation to support continued growth: Common Equity Tier 1 ratio of 11.47%(1) and total risk-based capital ratio of 13.82%(1), with $803.6 million in cash and $827.4 million in additional contingent borrowing capacity and no outstanding borrowings at quarter-end • Improving credit trends support forward momentum: Nonperforming assets decreased $14.7 million quarter over quarter, with CCBX net charge-offs trending down, consistent with stabilizing partner credit performance Advancing Future Value
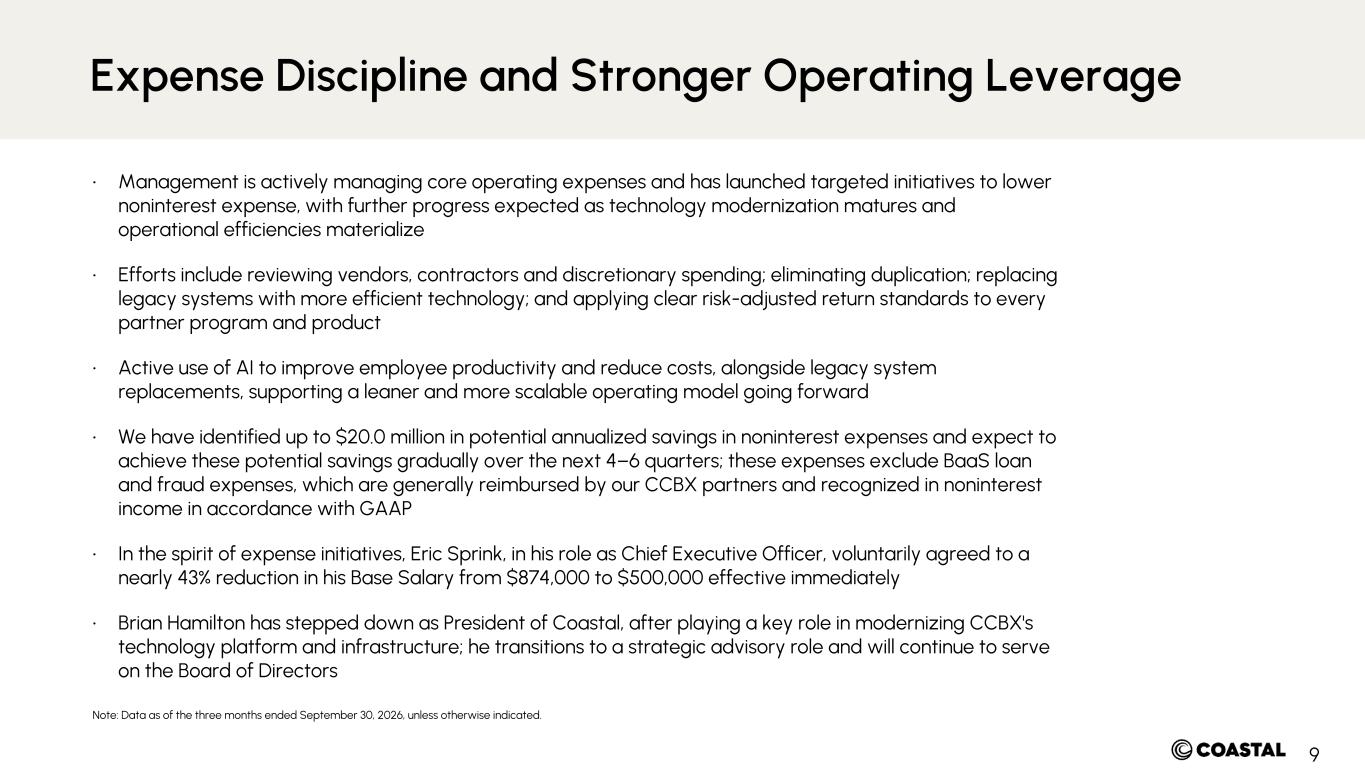
9 Note: Data as of the three months ended September 30, 2026, unless otherwise indicated. • Management is actively managing core operating expenses and has launched targeted initiatives to lower noninterest expense, with further progress expected as technology modernization matures and operational efficiencies materialize • Efforts include reviewing vendors, contractors and discretionary spending; eliminating duplication; replacing legacy systems with more efficient technology; and applying clear risk-adjusted return standards to every partner program and product • Active use of AI to improve employee productivity and reduce costs, alongside legacy system replacements, supporting a leaner and more scalable operating model going forward • We have identified up to $20.0 million in potential annualized savings in noninterest expenses and expect to achieve these potential savings gradually over the next 4–6 quarters; these expenses exclude BaaS loan and fraud expenses, which are generally reimbursed by our CCBX partners and recognized in noninterest income in accordance with GAAP • In the spirit of expense initiatives, Eric Sprink, in his role as Chief Executive Officer, voluntarily agreed to a nearly 43% reduction in his Base Salary from $874,000 to $500,000 effective immediately • Brian Hamilton has stepped down as President of Coastal, after playing a key role in modernizing CCBX's technology platform and infrastructure; he transitions to a strategic advisory role and will continue to serve on the Board of Directors Expense Discipline and Stronger Operating Leverage
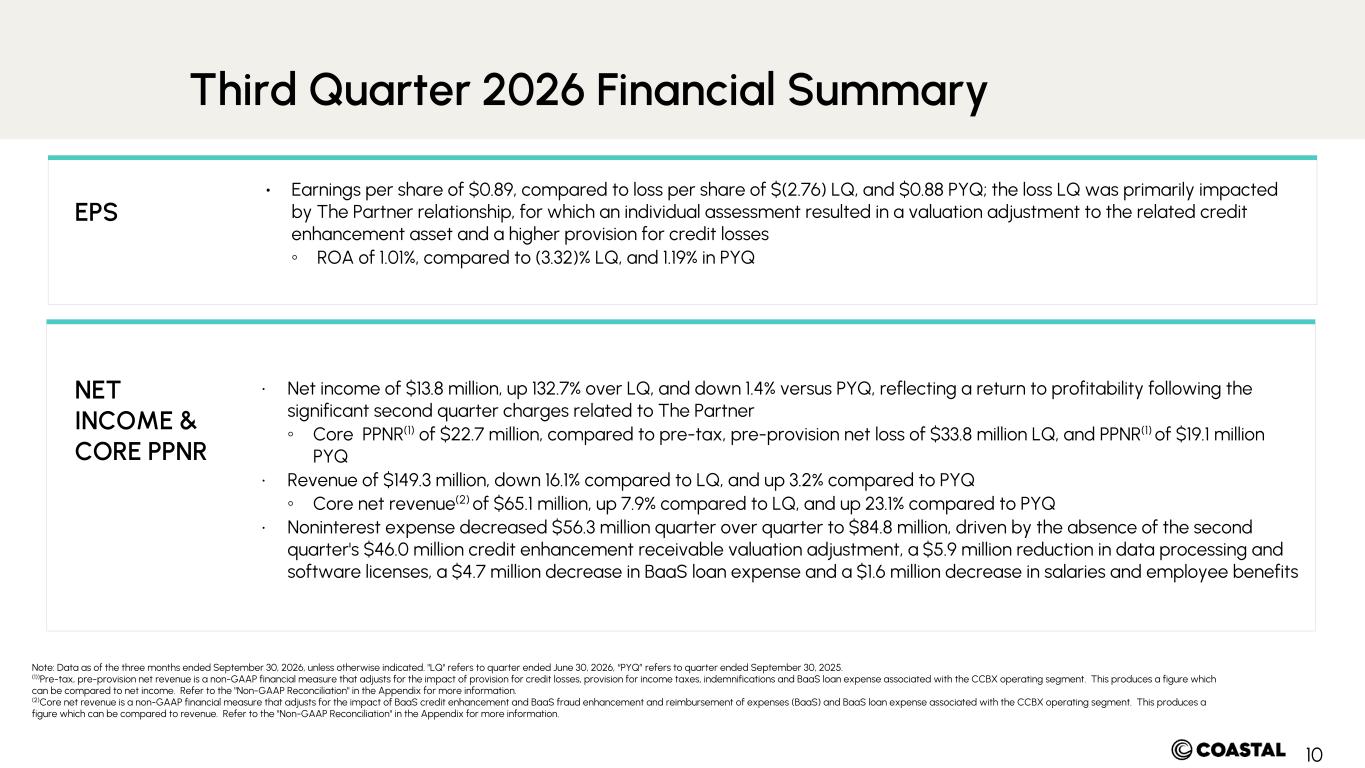
10 • Earnings per share of $0.89, compared to loss per share of $(2.76) LQ, and $0.88 PYQ; the loss LQ was primarily impacted by The Partner relationship, for which an individual assessment resulted in a valuation adjustment to the related credit enhancement asset and a higher provision for credit losses ◦ ROA of 1.01%, compared to (3.32)% LQ, and 1.19% in PYQ Note: Data as of the three months ended September 30, 2026, unless otherwise indicated. "LQ" refers to quarter ended June 30, 2026, “PYQ” refers to quarter ended September 30, 2025. (1))Pre-tax, pre-provision net revenue is a non-GAAP financial measure that adjusts for the impact of provision for credit losses, provision for income taxes, indemnifications and BaaS loan expense associated with the CCBX operating segment. This produces a figure which can be compared to net income. Refer to the "Non-GAAP Reconciliation" in the Appendix for more information. (2)Core net revenue is a non-GAAP financial measure that adjusts for the impact of BaaS credit enhancement and BaaS fraud enhancement and reimbursement of expenses (BaaS) and BaaS loan expense associated with the CCBX operating segment. This produces a figure which can be compared to revenue. Refer to the "Non-GAAP Reconciliation" in the Appendix for more information. • Net income of $13.8 million, up 132.7% over LQ, and down 1.4% versus PYQ, reflecting a return to profitability following the significant second quarter charges related to The Partner ◦ Core PPNR(1) of $22.7 million, compared to pre-tax, pre-provision net loss of $33.8 million LQ, and PPNR(1) of $19.1 million PYQ • Revenue of $149.3 million, down 16.1% compared to LQ, and up 3.2% compared to PYQ ◦ Core net revenue(2) of $65.1 million, up 7.9% compared to LQ, and up 23.1% compared to PYQ • Noninterest expense decreased $56.3 million quarter over quarter to $84.8 million, driven by the absence of the second quarter's $46.0 million credit enhancement receivable valuation adjustment, a $5.9 million reduction in data processing and software licenses, a $4.7 million decrease in BaaS loan expense and a $1.6 million decrease in salaries and employee benefits EPS Third Quarter 2026 Financial Summary NET INCOME & CORE PPNR
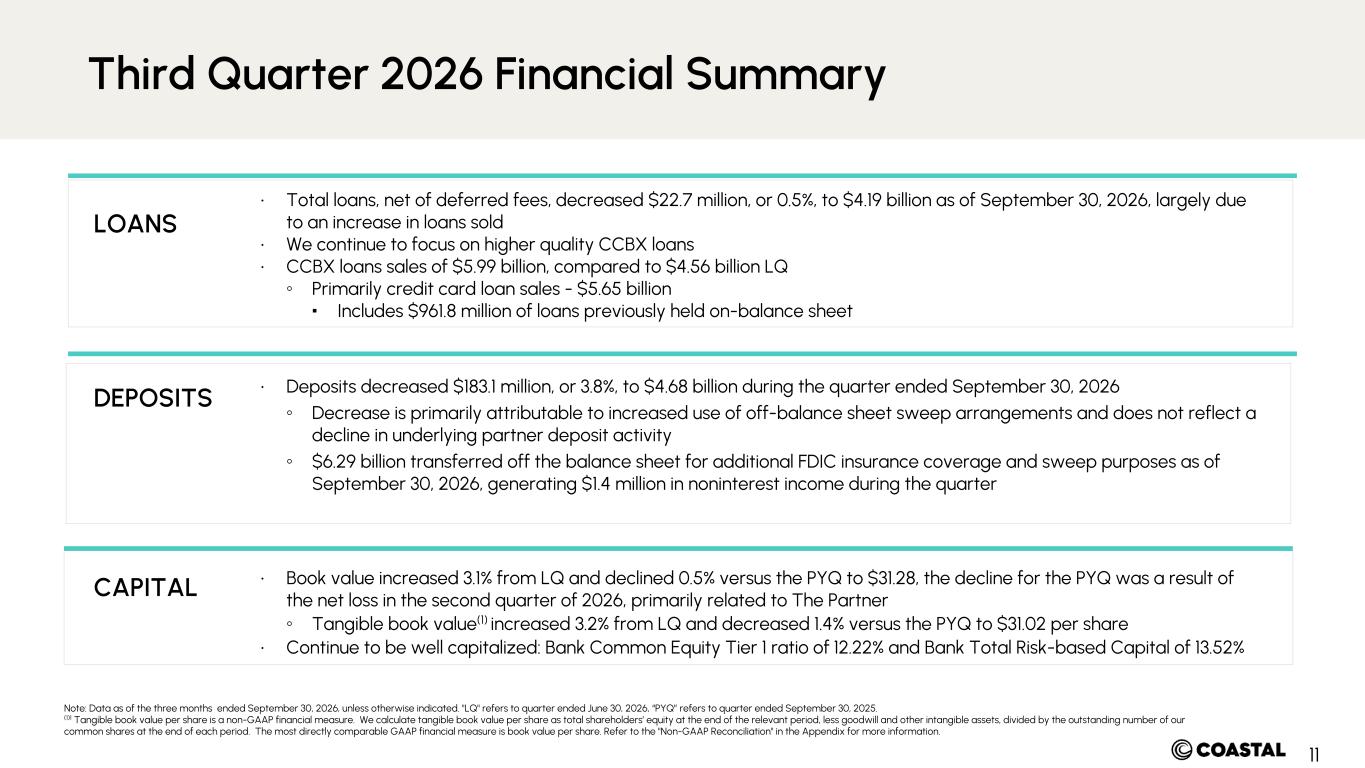
11 • Total loans, net of deferred fees, decreased $22.7 million, or 0.5%, to $4.19 billion as of September 30, 2026, largely due to an increase in loans sold • We continue to focus on higher quality CCBX loans • CCBX loans sales of $5.99 billion, compared to $4.56 billion LQ ◦ Primarily credit card loan sales - $5.65 billion ▪ Includes $961.8 million of loans previously held on-balance sheet • Deposits decreased $183.1 million, or 3.8%, to $4.68 billion during the quarter ended September 30, 2026 ◦ Decrease is primarily attributable to increased use of off-balance sheet sweep arrangements and does not reflect a decline in underlying partner deposit activity ◦ $6.29 billion transferred off the balance sheet for additional FDIC insurance coverage and sweep purposes as of September 30, 2026, generating $1.4 million in noninterest income during the quarter • Book value increased 3.1% from LQ and declined 0.5% versus the PYQ to $31.28, the decline for the PYQ was a result of the net loss in the second quarter of 2026, primarily related to The Partner ◦ Tangible book value(1) increased 3.2% from LQ and decreased 1.4% versus the PYQ to $31.02 per share • Continue to be well capitalized: Bank Common Equity Tier 1 ratio of 12.22% and Bank Total Risk-based Capital of 13.52% Third Quarter 2026 Financial Summary LOANS DEPOSITS CAPITAL Note: Data as of the three months ended September 30, 2026, unless otherwise indicated. "LQ" refers to quarter ended June 30, 2026, “PYQ” refers to quarter ended September 30, 2025. (1)1 Tangible book value per share is a non-GAAP financial measure. We calculate tangible book value per share as total shareholders’ equity at the end of the relevant period, less goodwill and other intangible assets, divided by the outstanding number of our common shares at the end of each period. The most directly comparable GAAP financial measure is book value per share. Refer to the "Non-GAAP Reconciliation" in the Appendix for more information.
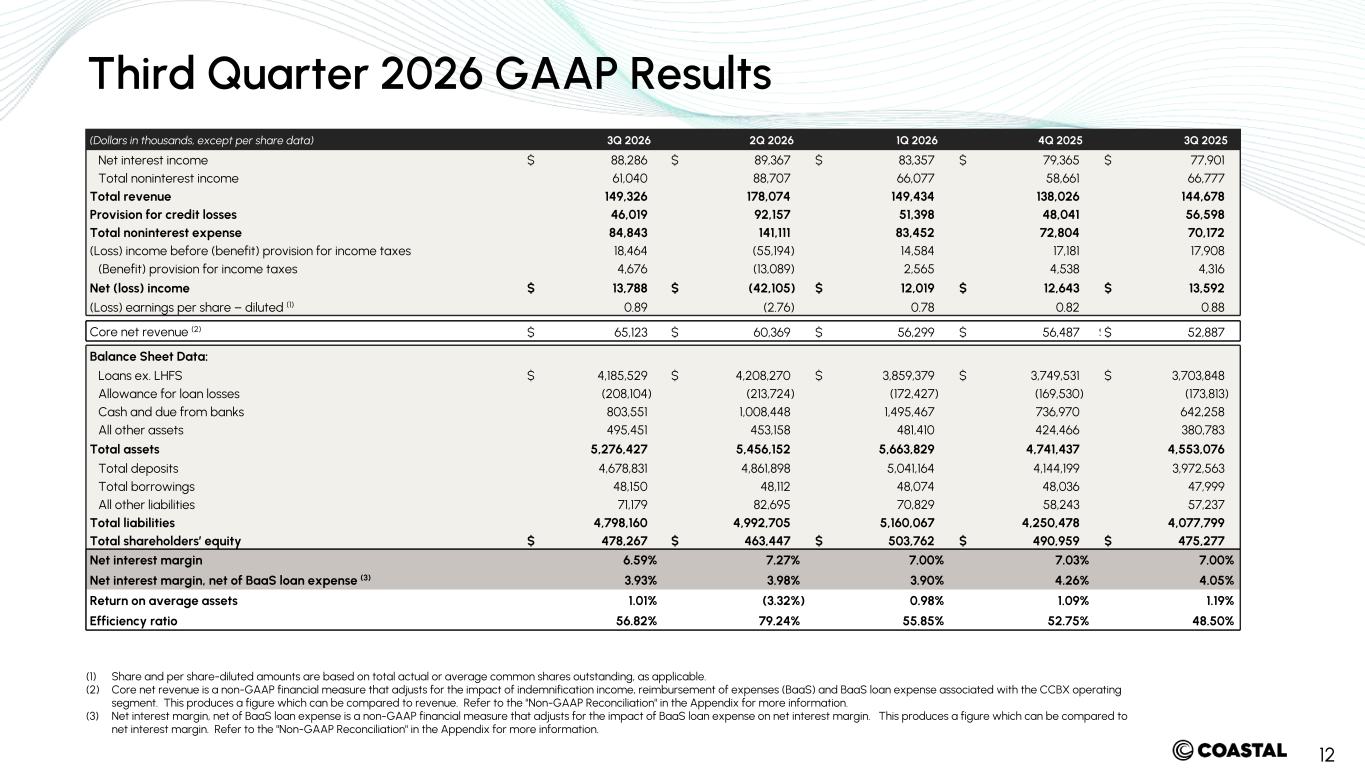
12 Third Quarter 2026 GAAP Results (1) Share and per share-diluted amounts are based on total actual or average common shares outstanding, as applicable. (2) Core net revenue is a non-GAAP financial measure that adjusts for the impact of indemnification income, reimbursement of expenses (BaaS) and BaaS loan expense associated with the CCBX operating segment. This produces a figure which can be compared to revenue. Refer to the "Non-GAAP Reconciliation" in the Appendix for more information. (3) Net interest margin, net of BaaS loan expense is a non-GAAP financial measure that adjusts for the impact of BaaS loan expense on net interest margin. This produces a figure which can be compared to net interest margin. Refer to the "Non-GAAP Reconciliation" in the Appendix for more information. (Dollars in thousands, except per share data) 3Q 2026 2Q 2026 1Q 2026 4Q 2025 3Q 2025 Net interest income $ 88,286 $ 89,367 $ 83,357 $ 79,365 $ 77,901 Total noninterest income 61,040 88,707 66,077 58,661 66,777 Total revenue 149,326 178,074 149,434 138,026 144,678 Provision for credit losses 46,019 92,157 51,398 48,041 56,598 Total noninterest expense 84,843 141,111 83,452 72,804 70,172 (Loss) income before (benefit) provision for income taxes 18,464 (55,194) 14,584 17,181 17,908 (Benefit) provision for income taxes 4,676 (13,089) 2,565 4,538 4,316 Net (loss) income $ 13,788 $ (42,105) $ 12,019 $ 12,643 $ 13,592 (Loss) earnings per share – diluted (1) 0.89 (2.76) 0.78 0.82 0.88 Core net revenue (2) $ 65,123 $ 60,369 $ 56,299 $ 56,487 $ 52,887 $ 52,887 Balance Sheet Data: Loans ex. LHFS $ 4,185,529 $ 4,208,270 $ 3,859,379 $ 3,749,531 $ 3,703,848 Allowance for loan losses (208,104) (213,724) (172,427) (169,530) (173,813) Cash and due from banks 803,551 1,008,448 1,495,467 736,970 642,258 All other assets 495,451 453,158 481,410 424,466 380,783 Total assets 5,276,427 5,456,152 5,663,829 4,741,437 4,553,076 Total deposits 4,678,831 4,861,898 5,041,164 4,144,199 3,972,563 Total borrowings 48,150 48,112 48,074 48,036 47,999 All other liabilities 71,179 82,695 70,829 58,243 57,237 Total liabilities 4,798,160 4,992,705 5,160,067 4,250,478 4,077,799 Total shareholders’ equity $ 478,267 $ 463,447 $ 503,762 $ 490,959 $ 475,277 Net interest margin 6.59% 7.27% 7.00% 7.03% 7.00% Net interest margin, net of BaaS loan expense (3) 3.93% 3.98% 3.90% 4.26% 4.05% Return on average assets 1.01% (3.32%) 0.98% 1.09% 1.19% Efficiency ratio 56.82% 79.24% 55.85% 52.75% 48.50%
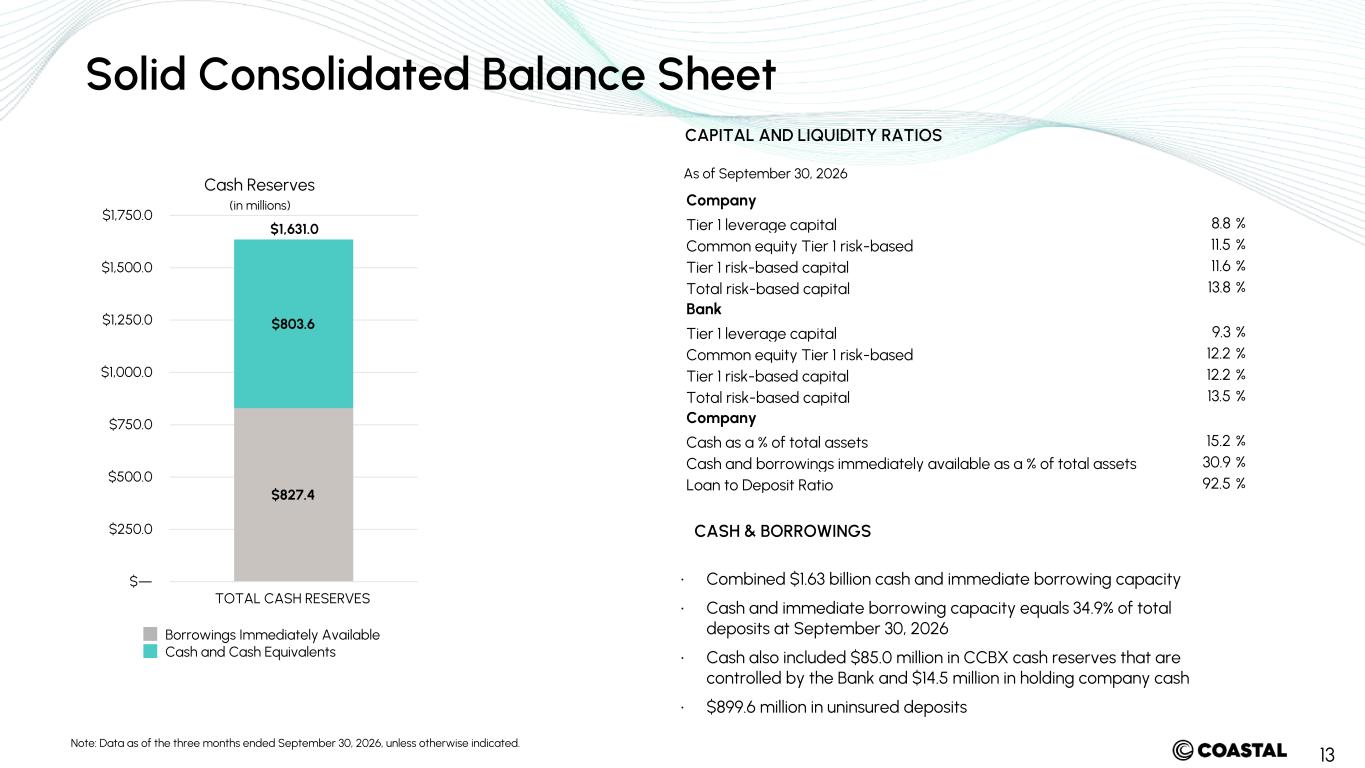
13 Solid Consolidated Balance Sheet CAPITAL AND LIQUIDITY RATIOS Note: Data as of the three months ended September 30, 2026, unless otherwise indicated. CASH & BORROWINGS • Combined $1.63 billion cash and immediate borrowing capacity • Cash and immediate borrowing capacity equals 34.9% of total deposits at September 30, 2026 • Cash also included $85.0 million in CCBX cash reserves that are controlled by the Bank and $14.5 million in holding company cash • $899.6 million in uninsured deposits Company Tier 1 leverage capital 8.8 % Common equity Tier 1 risk-based 11.5 % Tier 1 risk-based capital 11.6 % Total risk-based capital 13.8 % Bank Tier 1 leverage capital 9.3 % Common equity Tier 1 risk-based 12.2 % Tier 1 risk-based capital 12.2 % Total risk-based capital 13.5 % Company Cash as a % of total assets 15.2 % Cash and borrowings immediately available as a % of total assets 30.9 % Loan to Deposit Ratio 92.5 % As of September 30, 2026 Cash Reserves $827.4 $803.6 Borrowings Immediately Available Cash and Cash Equivalents TOTAL CASH RESERVES $— $250.0 $500.0 $750.0 $1,000.0 $1,250.0 $1,500.0 $1,750.0 (in millions) $1,631.0
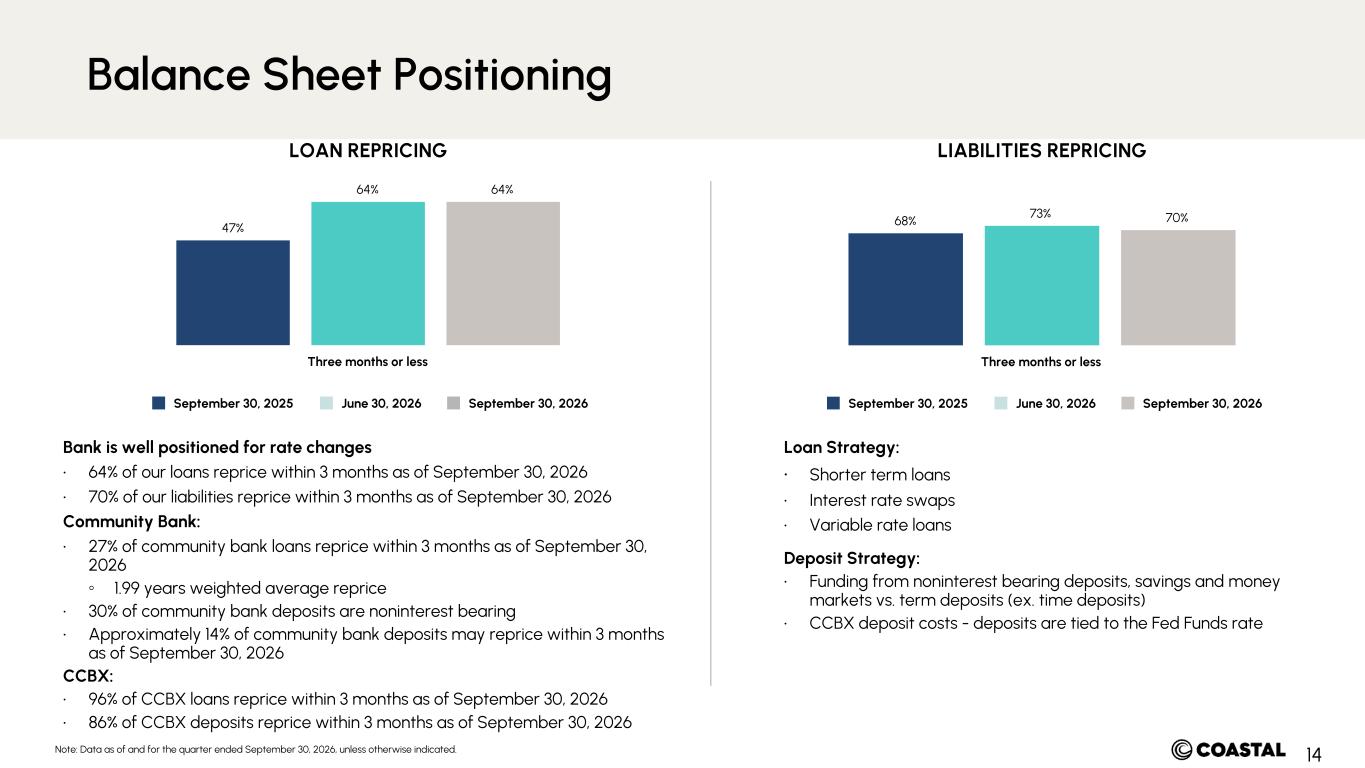
14 Bank is well positioned for rate changes • 64% of our loans reprice within 3 months as of September 30, 2026 • 70% of our liabilities reprice within 3 months as of September 30, 2026 Community Bank: • 27% of community bank loans reprice within 3 months as of September 30, 2026 ◦ 1.99 years weighted average reprice • 30% of community bank deposits are noninterest bearing • Approximately 14% of community bank deposits may reprice within 3 months as of September 30, 2026 CCBX: • 96% of CCBX loans reprice within 3 months as of September 30, 2026 • 86% of CCBX deposits reprice within 3 months as of September 30, 2026 Loan Strategy: • Shorter term loans • Interest rate swaps • Variable rate loans Deposit Strategy: • Funding from noninterest bearing deposits, savings and money markets vs. term deposits (ex. time deposits) • CCBX deposit costs - deposits are tied to the Fed Funds rate Note: Data as of and for the quarter ended September 30, 2026, unless otherwise indicated. 47% 64% 64% September 30, 2025 June 30, 2026 September 30, 2026 Three months or less 68% 73% 70% September 30, 2025 June 30, 2026 September 30, 2026 Three months or less LOAN REPRICING LIABILITIES REPRICING Balance Sheet Positioning
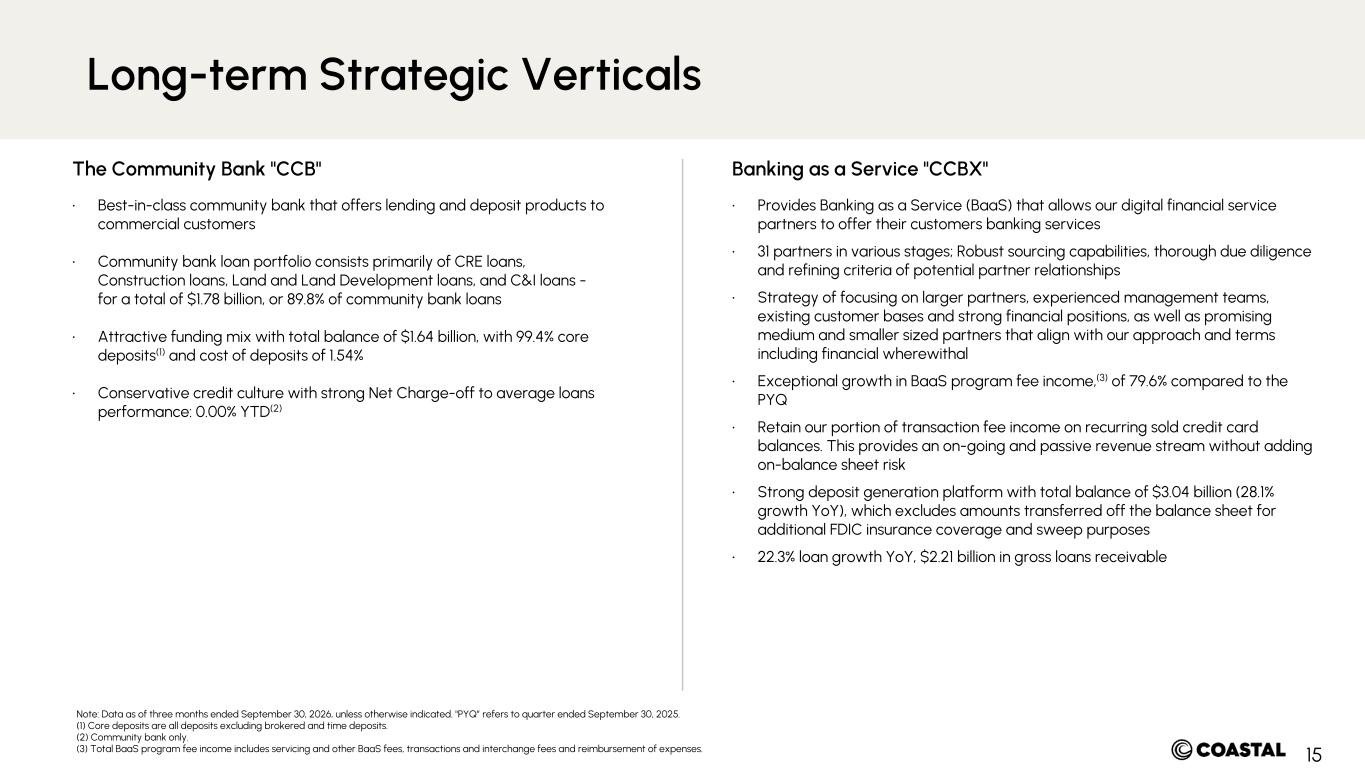
15 • Best-in-class community bank that offers lending and deposit products to commercial customers • Community bank loan portfolio consists primarily of CRE loans, Construction loans, Land and Land Development loans, and C&I loans - for a total of $1.78 billion, or 89.8% of community bank loans • Attractive funding mix with total balance of $1.64 billion, with 99.4% core deposits(1) and cost of deposits of 1.54% • Conservative credit culture with strong Net Charge-off to average loans performance: 0.00% YTD(2) • Provides Banking as a Service (BaaS) that allows our digital financial service partners to offer their customers banking services • 31 partners in various stages; Robust sourcing capabilities, thorough due diligence and refining criteria of potential partner relationships • Strategy of focusing on larger partners, experienced management teams, existing customer bases and strong financial positions, as well as promising medium and smaller sized partners that align with our approach and terms including financial wherewithal • Exceptional growth in BaaS program fee income,(3) of 79.6% compared to the PYQ • Retain our portion of transaction fee income on recurring sold credit card balances. This provides an on-going and passive revenue stream without adding on-balance sheet risk • Strong deposit generation platform with total balance of $3.04 billion (28.1% growth YoY), which excludes amounts transferred off the balance sheet for additional FDIC insurance coverage and sweep purposes • 22.3% loan growth YoY, $2.21 billion in gross loans receivable Note: Data as of three months ended September 30, 2026, unless otherwise indicated. "PYQ” refers to quarter ended September 30, 2025. (1) Core deposits are all deposits excluding brokered and time deposits. (2) Community bank only. (3) Total BaaS program fee income includes servicing and other BaaS fees, transactions and interchange fees and reimbursement of expenses. The Community Bank "CCB" Banking as a Service "CCBX" Long-term Strategic Verticals
SEGMENT UPDATES: CCBX & COMMUNITY BANK
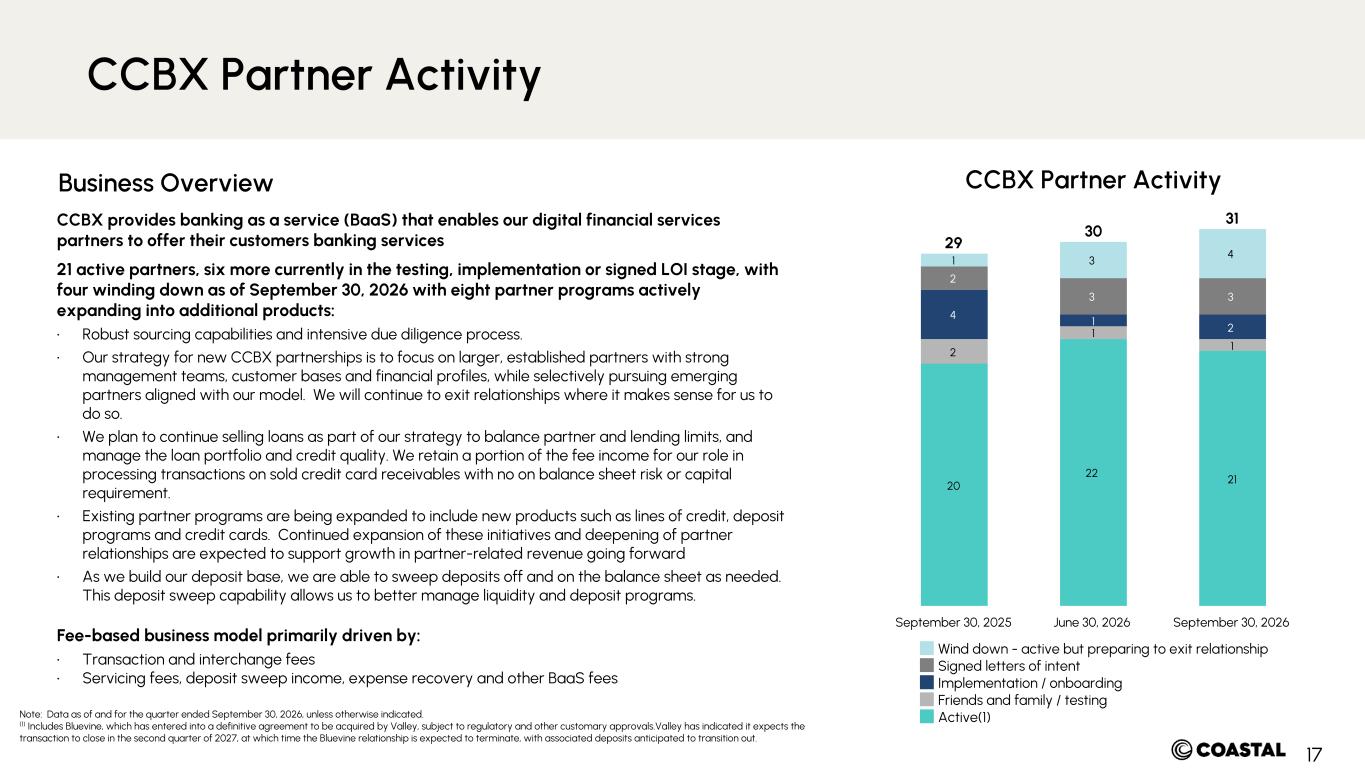
17 29 30 31 20 22 21 2 1 1 4 1 2 2 3 3 1 3 4 Wind down - active but preparing to exit relationship Signed letters of intent Implementation / onboarding Friends and family / testing Active(1) September 30, 2025 June 30, 2026 September 30, 2026 CCBX provides banking as a service (BaaS) that enables our digital financial services partners to offer their customers banking services 21 active partners, six more currently in the testing, implementation or signed LOI stage, with four winding down as of September 30, 2026 with eight partner programs actively expanding into additional products: • Robust sourcing capabilities and intensive due diligence process. • Our strategy for new CCBX partnerships is to focus on larger, established partners with strong management teams, customer bases and financial profiles, while selectively pursuing emerging partners aligned with our model. We will continue to exit relationships where it makes sense for us to do so. • We plan to continue selling loans as part of our strategy to balance partner and lending limits, and manage the loan portfolio and credit quality. We retain a portion of the fee income for our role in processing transactions on sold credit card receivables with no on balance sheet risk or capital requirement. • Existing partner programs are being expanded to include new products such as lines of credit, deposit programs and credit cards. Continued expansion of these initiatives and deepening of partner relationships are expected to support growth in partner-related revenue going forward • As we build our deposit base, we are able to sweep deposits off and on the balance sheet as needed. This deposit sweep capability allows us to better manage liquidity and deposit programs. Fee-based business model primarily driven by: • Transaction and interchange fees • Servicing fees, deposit sweep income, expense recovery and other BaaS fees CCBX Partner Activity Note: Data as of and for the quarter ended September 30, 2026, unless otherwise indicated. (1) Includes Bluevine, which has entered into a definitive agreement to be acquired by Valley, subject to regulatory and other customary approvals.Valley has indicated it expects the transaction to close in the second quarter of 2027, at which time the Bluevine relationship is expected to terminate, with associated deposits anticipated to transition out. Business Overview CCBX Partner Activity
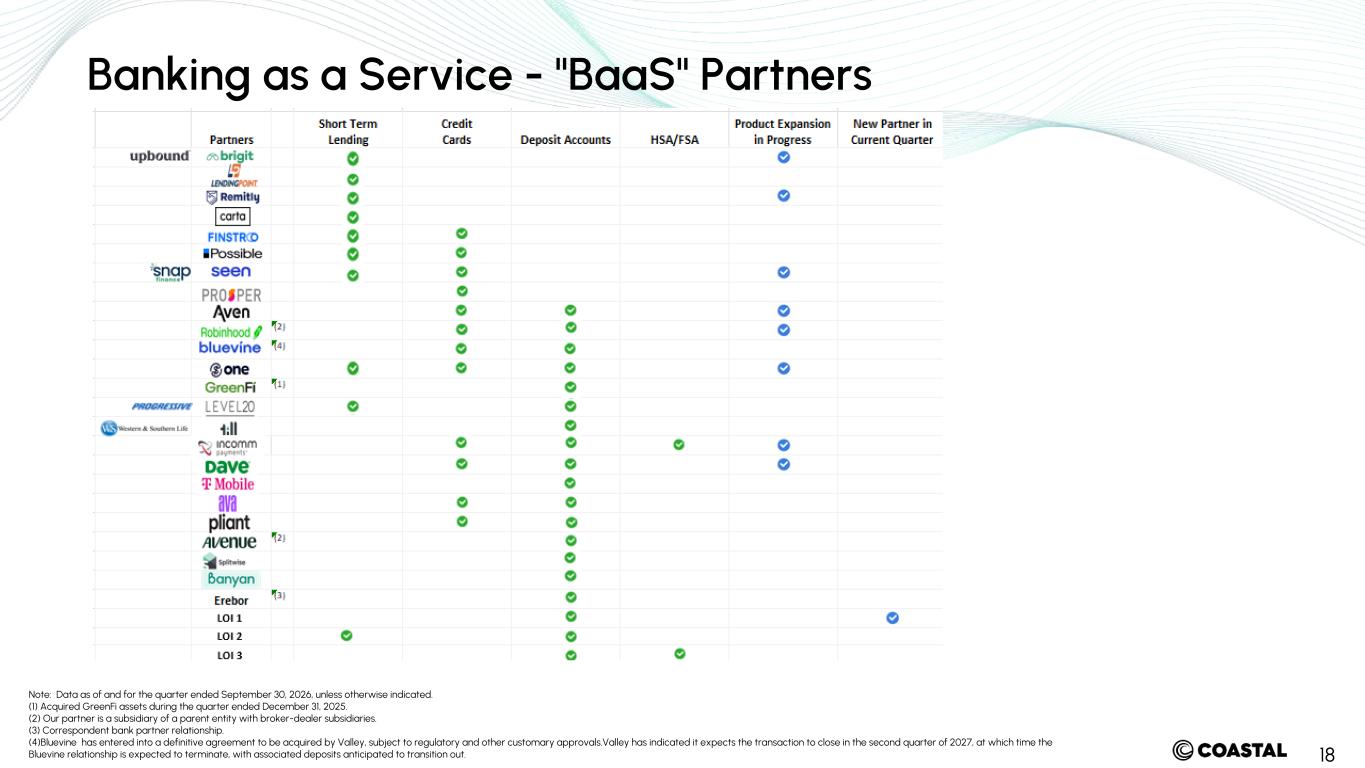
18 Note: Data as of and for the quarter ended September 30, 2026, unless otherwise indicated. (1) Acquired GreenFi assets during the quarter ended December 31, 2025. (2) Our partner is a subsidiary of a parent entity with broker-dealer subsidiaries. (3) Correspondent bank partner relationship. (4)Bluevine has entered into a definitive agreement to be acquired by Valley, subject to regulatory and other customary approvals.Valley has indicated it expects the transaction to close in the second quarter of 2027, at which time the Bluevine relationship is expected to terminate, with associated deposits anticipated to transition out. Banking as a Service - "BaaS" Partners
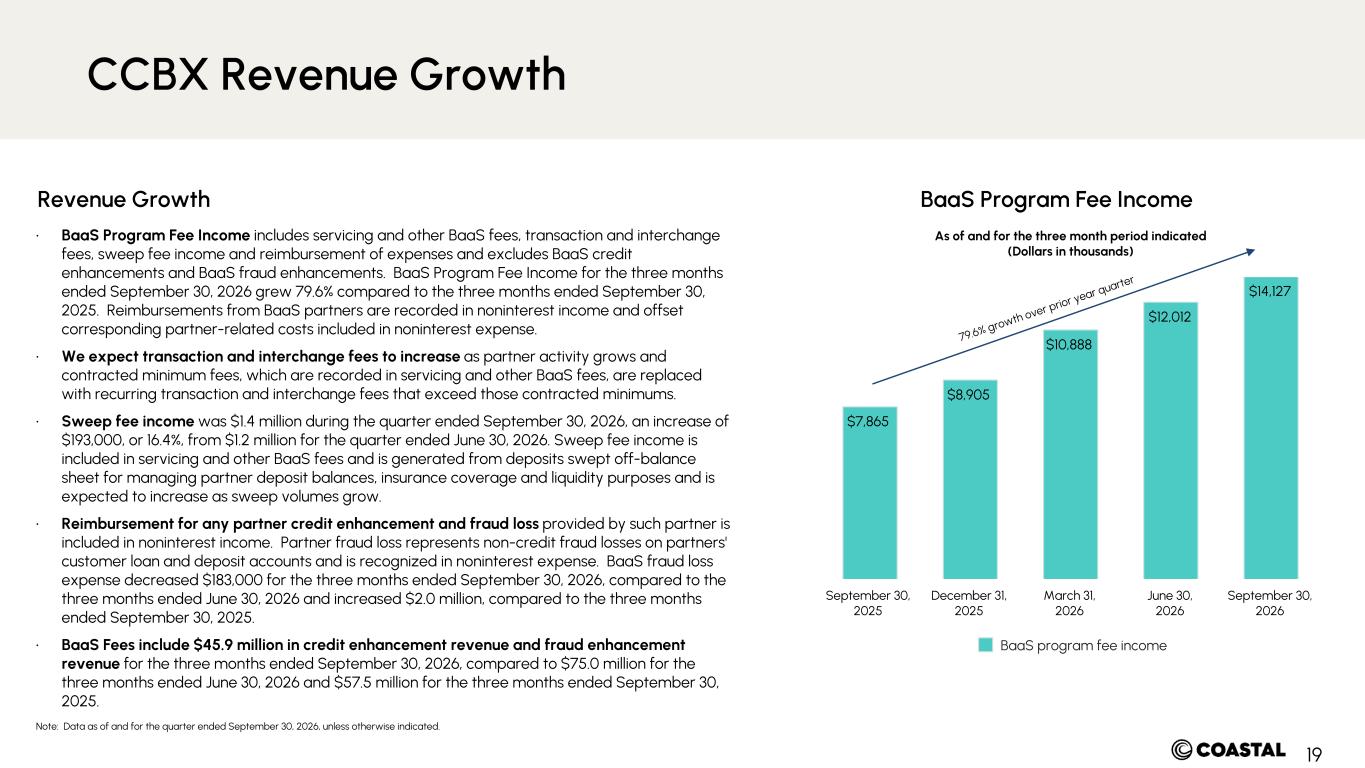
19 As of and for the three month period indicated (Dollars in thousands) $7,865 $8,905 $10,888 $12,012 $14,127 BaaS program fee income September 30, 2025 December 31, 2025 March 31, 2026 June 30, 2026 September 30, 2026 BaaS Program Fee Income Note: Data as of and for the quarter ended September 30, 2026, unless otherwise indicated. Revenue Growth • BaaS Program Fee Income includes servicing and other BaaS fees, transaction and interchange fees, sweep fee income and reimbursement of expenses and excludes BaaS credit enhancements and BaaS fraud enhancements. BaaS Program Fee Income for the three months ended September 30, 2026 grew 79.6% compared to the three months ended September 30, 2025. Reimbursements from BaaS partners are recorded in noninterest income and offset corresponding partner-related costs included in noninterest expense. • We expect transaction and interchange fees to increase as partner activity grows and contracted minimum fees, which are recorded in servicing and other BaaS fees, are replaced with recurring transaction and interchange fees that exceed those contracted minimums. • Sweep fee income was $1.4 million during the quarter ended September 30, 2026, an increase of $193,000, or 16.4%, from $1.2 million for the quarter ended June 30, 2026. Sweep fee income is included in servicing and other BaaS fees and is generated from deposits swept off-balance sheet for managing partner deposit balances, insurance coverage and liquidity purposes and is expected to increase as sweep volumes grow. • Reimbursement for any partner credit enhancement and fraud loss provided by such partner is included in noninterest income. Partner fraud loss represents non-credit fraud losses on partners' customer loan and deposit accounts and is recognized in noninterest expense. BaaS fraud loss expense decreased $183,000 for the three months ended September 30, 2026, compared to the three months ended June 30, 2026 and increased $2.0 million, compared to the three months ended September 30, 2025. • BaaS Fees include $45.9 million in credit enhancement revenue and fraud enhancement revenue for the three months ended September 30, 2026, compared to $75.0 million for the three months ended June 30, 2026 and $57.5 million for the three months ended September 30, 2025. CCBX Revenue Growth 79.6% growth over prior year quarter
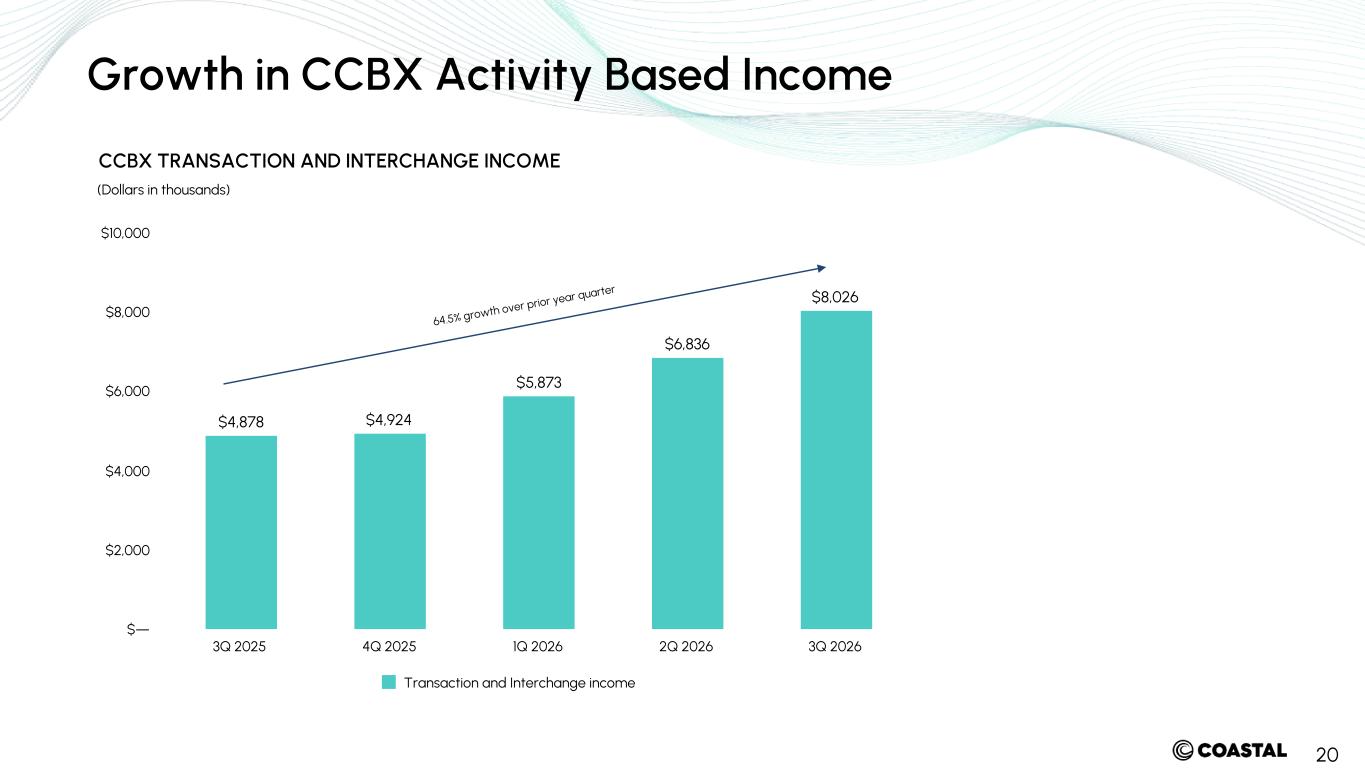
20 $4,878 $4,924 $5,873 $6,836 $8,026 Transaction and Interchange income 3Q 2025 4Q 2025 1Q 2026 2Q 2026 3Q 2026 $— $2,000 $4,000 $6,000 $8,000 $10,000 Growth in CCBX Activity Based Income CCBX TRANSACTION AND INTERCHANGE INCOME (Dollars in thousands) 64.5% growth over prior year quarter
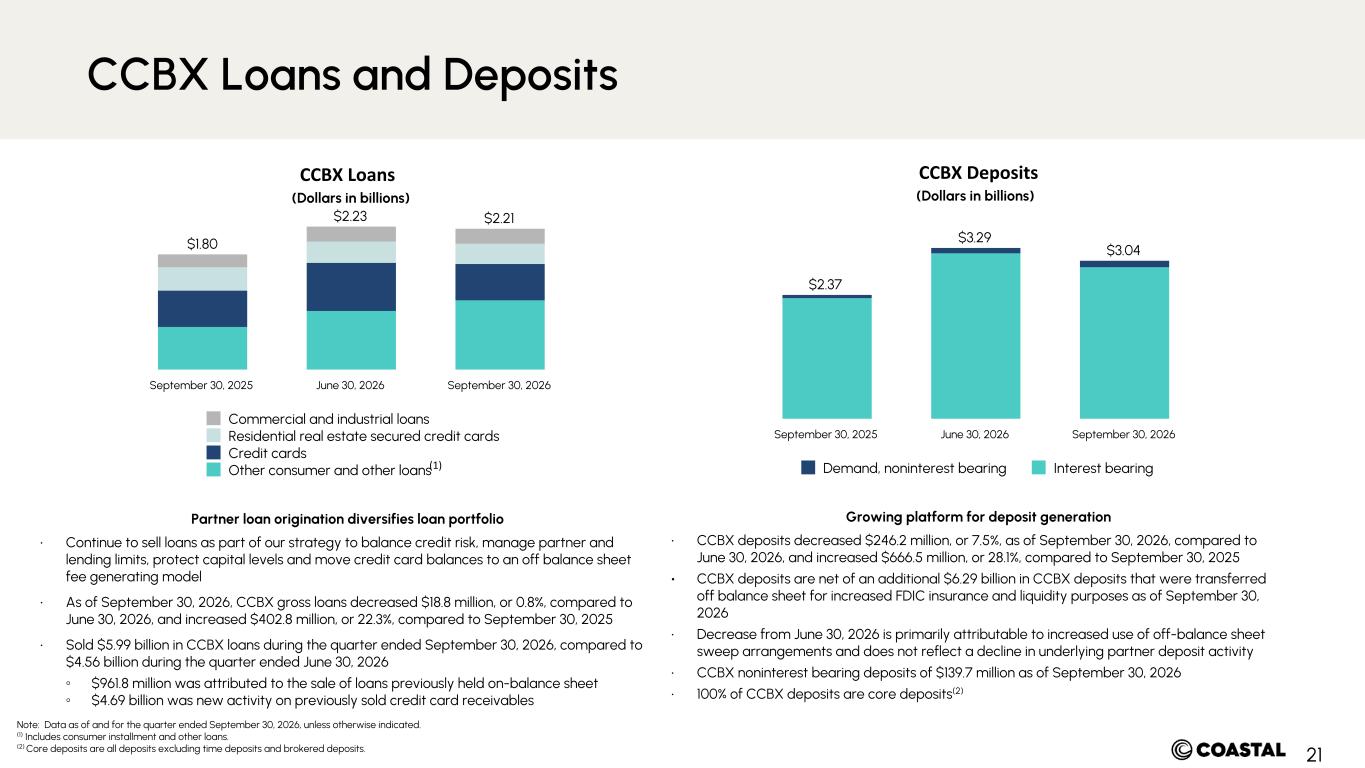
21 (Dollars in billions) $2.37 $3.29 $3.04 Demand, noninterest bearing Interest bearing September 30, 2025 June 30, 2026 September 30, 2026 (Dollars in billions) $1.80 $2.23 $2.21 Commercial and industrial loans Residential real estate secured credit cards Credit cards Other consumer and other loans September 30, 2025 June 30, 2026 September 30, 2026 CCBX Loans CCBX Deposits Note: Data as of and for the quarter ended September 30, 2026, unless otherwise indicated. (1) Includes consumer installment and other loans. (2) Core deposits are all deposits excluding time deposits and brokered deposits. Growing platform for deposit generation • CCBX deposits decreased $246.2 million, or 7.5%, as of September 30, 2026, compared to June 30, 2026, and increased $666.5 million, or 28.1%, compared to September 30, 2025 • CCBX deposits are net of an additional $6.29 billion in CCBX deposits that were transferred off balance sheet for increased FDIC insurance and liquidity purposes as of September 30, 2026 • Decrease from June 30, 2026 is primarily attributable to increased use of off-balance sheet sweep arrangements and does not reflect a decline in underlying partner deposit activity • CCBX noninterest bearing deposits of $139.7 million as of September 30, 2026 • 100% of CCBX deposits are core deposits(2) Partner loan origination diversifies loan portfolio • Continue to sell loans as part of our strategy to balance credit risk, manage partner and lending limits, protect capital levels and move credit card balances to an off balance sheet fee generating model • As of September 30, 2026, CCBX gross loans decreased $18.8 million, or 0.8%, compared to June 30, 2026, and increased $402.8 million, or 22.3%, compared to September 30, 2025 • Sold $5.99 billion in CCBX loans during the quarter ended September 30, 2026, compared to $4.56 billion during the quarter ended June 30, 2026 ◦ $961.8 million was attributed to the sale of loans previously held on-balance sheet ◦ $4.69 billion was new activity on previously sold credit card receivables (1) CCBX Loans and Deposits
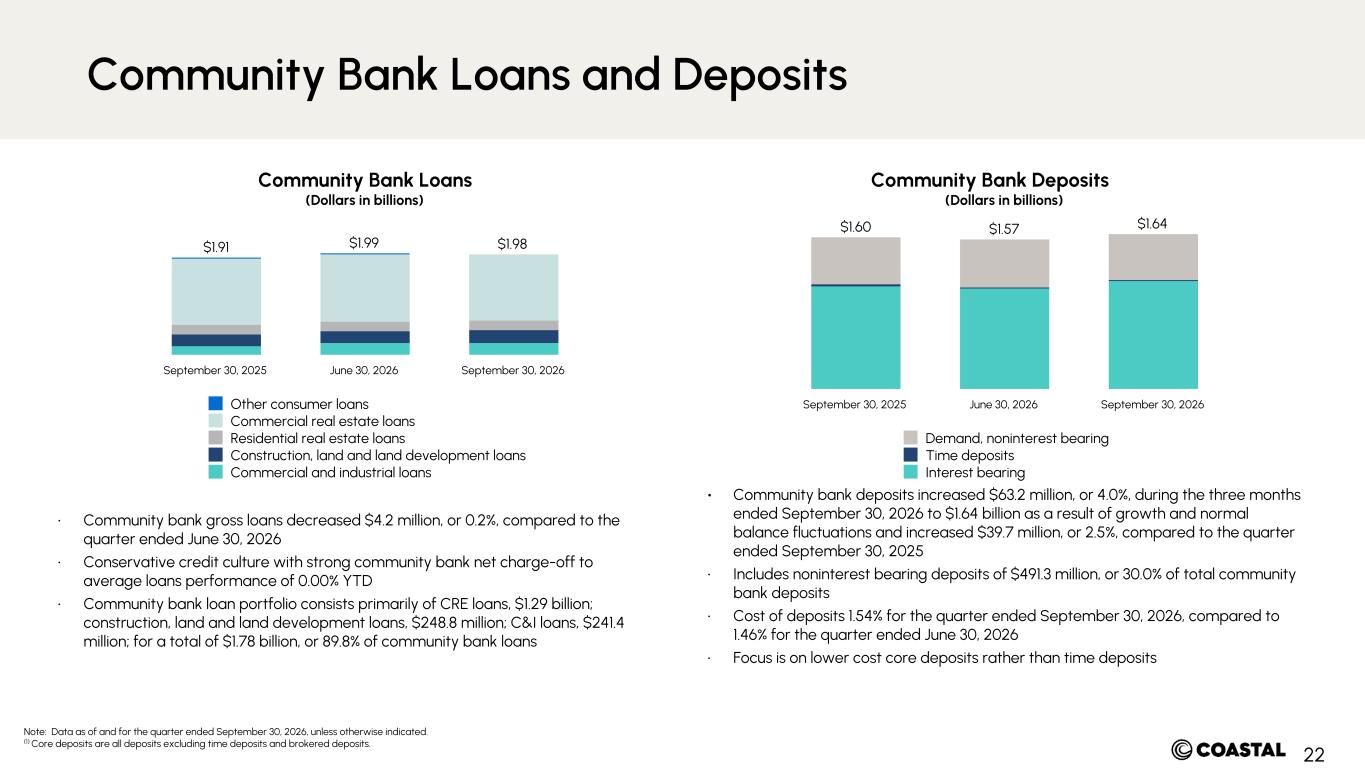
22 (Dollars in billions) $1.60 $1.57 $1.64 Demand, noninterest bearing Time deposits Interest bearing September 30, 2025 June 30, 2026 September 30, 2026 Community Bank Loans Community Bank Deposits Note: Data as of and for the quarter ended September 30, 2026, unless otherwise indicated. (1) Core deposits are all deposits excluding time deposits and brokered deposits. • Community bank gross loans decreased $4.2 million, or 0.2%, compared to the quarter ended June 30, 2026 • Conservative credit culture with strong community bank net charge-off to average loans performance of 0.00% YTD • Community bank loan portfolio consists primarily of CRE loans, $1.29 billion; construction, land and land development loans, $248.8 million; C&I loans, $241.4 million; for a total of $1.78 billion, or 89.8% of community bank loans • Community bank deposits increased $63.2 million, or 4.0%, during the three months ended September 30, 2026 to $1.64 billion as a result of growth and normal balance fluctuations and increased $39.7 million, or 2.5%, compared to the quarter ended September 30, 2025 • Includes noninterest bearing deposits of $491.3 million, or 30.0% of total community bank deposits • Cost of deposits 1.54% for the quarter ended September 30, 2026, compared to 1.46% for the quarter ended June 30, 2026 • Focus is on lower cost core deposits rather than time deposits (Dollars in billions) $1.91 $1.99 $1.98 Other consumer loans Commercial real estate loans Residential real estate loans Construction, land and land development loans Commercial and industrial loans September 30, 2025 June 30, 2026 September 30, 2026 Community Bank Loans and Deposits
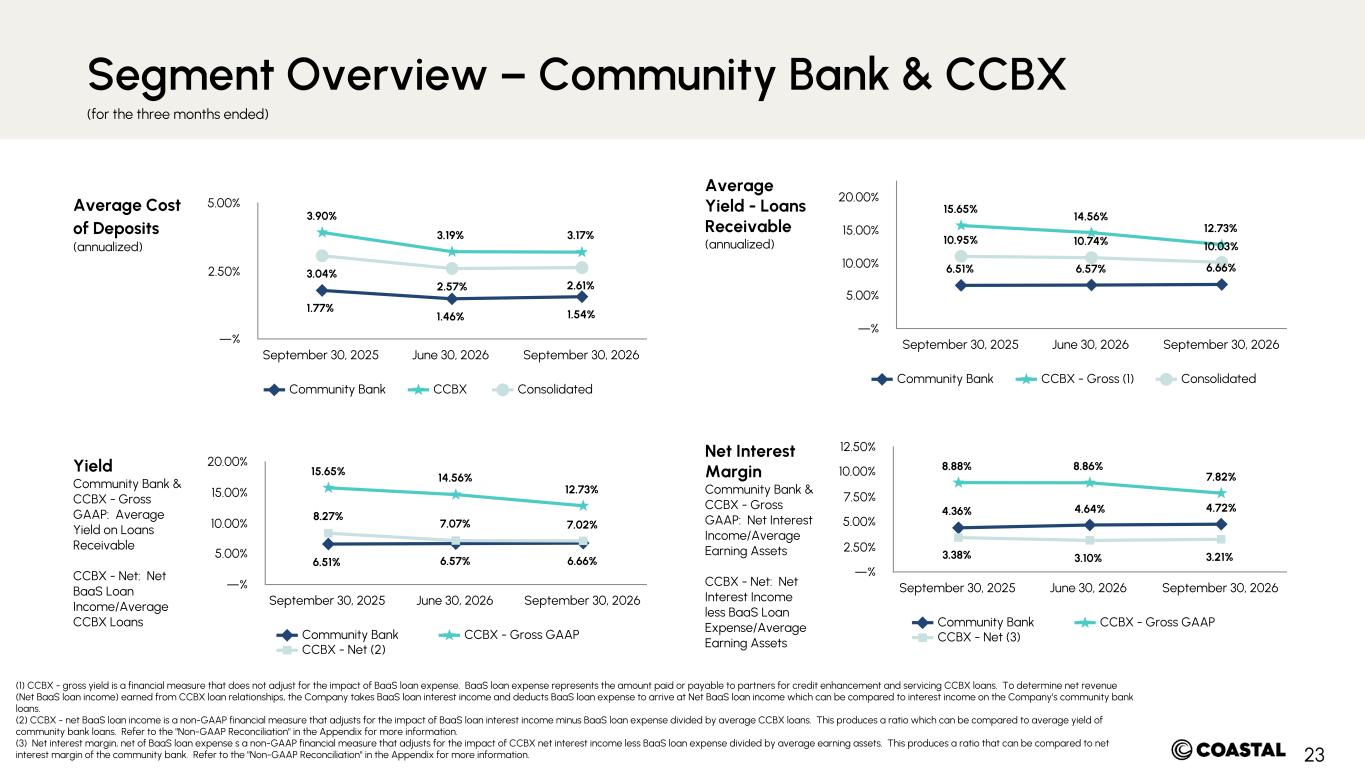
23 1.77% 1.46% 1.54% 3.90% 3.19% 3.17% 3.04% 2.57% 2.61% Community Bank CCBX Consolidated September 30, 2025 June 30, 2026 September 30, 2026 —% 2.50% 5.00%Average Cost of Deposits (annualized) 6.51% 6.57% 6.66% 15.65% 14.56% 12.73% 10.95% 10.74% 10.03% Community Bank CCBX - Gross (1) Consolidated September 30, 2025 June 30, 2026 September 30, 2026 —% 5.00% 10.00% 15.00% 20.00% Average Yield - Loans Receivable (annualized) Yield Community Bank & CCBX - Gross GAAP: Average Yield on Loans Receivable CCBX - Net: Net BaaS Loan Income/Average CCBX Loans 6.51% 6.57% 6.66% 15.65% 14.56% 12.73% 8.27% 7.07% 7.02% Community Bank CCBX - Gross GAAP CCBX - Net (2) September 30, 2025 June 30, 2026 September 30, 2026 —% 5.00% 10.00% 15.00% 20.00% 4.36% 4.64% 4.72% 8.88% 8.86% 7.82% 3.38% 3.10% 3.21% Community Bank CCBX - Gross GAAP CCBX - Net (3) September 30, 2025 June 30, 2026 September 30, 2026 —% 2.50% 5.00% 7.50% 10.00% 12.50%Net Interest Margin Community Bank & CCBX - Gross GAAP: Net Interest Income/Average Earning Assets CCBX - Net: Net Interest Income less BaaS Loan Expense/Average Earning Assets (1) CCBX - gross yield is a financial measure that does not adjust for the impact of BaaS loan expense. BaaS loan expense represents the amount paid or payable to partners for credit enhancement and servicing CCBX loans. To determine net revenue (Net BaaS loan income) earned from CCBX loan relationships, the Company takes BaaS loan interest income and deducts BaaS loan expense to arrive at Net BaaS loan income which can be compared to interest income on the Company’s community bank loans. (2) CCBX - net BaaS loan income is a non-GAAP financial measure that adjusts for the impact of BaaS loan interest income minus BaaS loan expense divided by average CCBX loans. This produces a ratio which can be compared to average yield of community bank loans. Refer to the "Non-GAAP Reconciliation" in the Appendix for more information. (3) Net interest margin, net of BaaS loan expense s a non-GAAP financial measure that adjusts for the impact of CCBX net interest income less BaaS loan expense divided by average earning assets. This produces a ratio that can be compared to net interest margin of the community bank. Refer to the "Non-GAAP Reconciliation" in the Appendix for more information. Segment Overview – Community Bank & CCBX (for the three months ended)
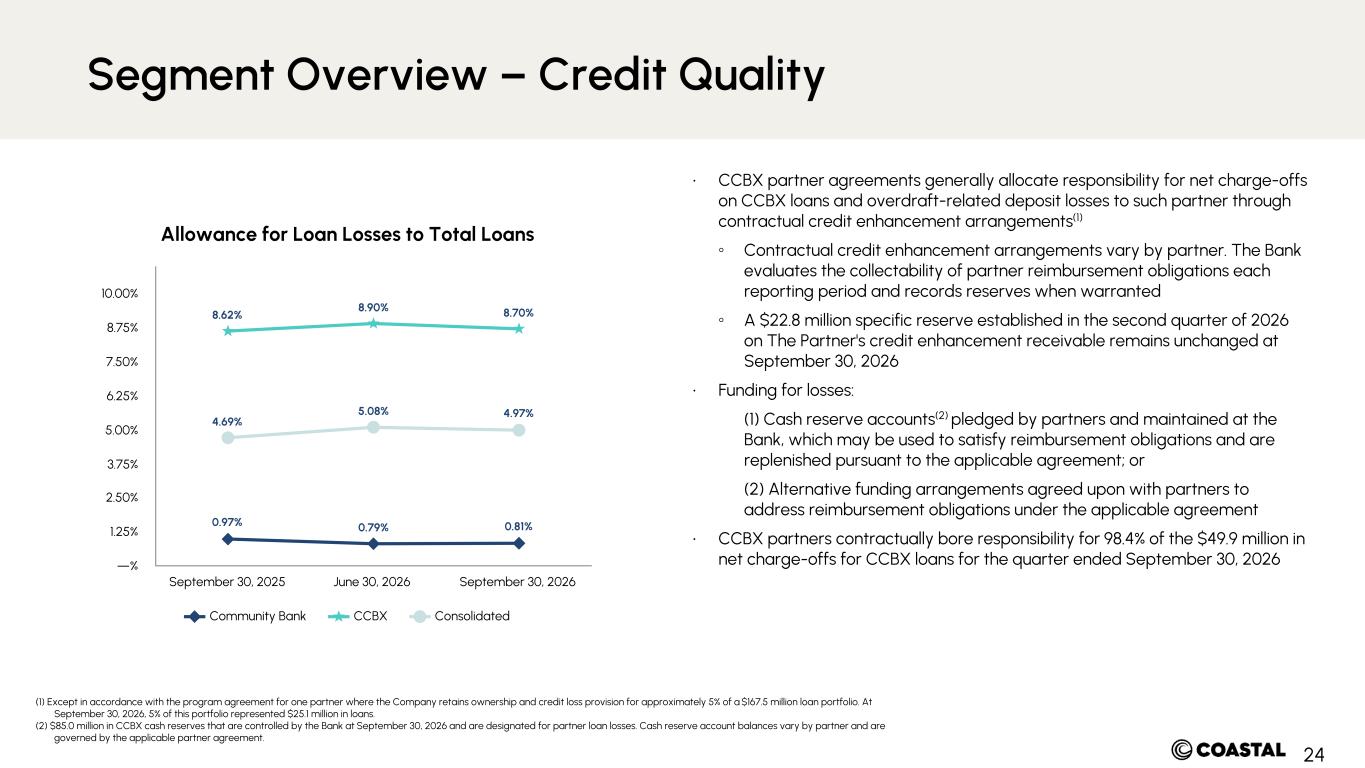
24 0.97% 0.79% 0.81% 8.62% 8.90% 8.70% 4.69% 5.08% 4.97% Community Bank CCBX Consolidated September 30, 2025 June 30, 2026 September 30, 2026 —% 1.25% 2.50% 3.75% 5.00% 6.25% 7.50% 8.75% 10.00% Allowance for Loan Losses to Total Loans (1) Except in accordance with the program agreement for one partner where the Company retains ownership and credit loss provision for approximately 5% of a $167.5 million loan portfolio. At September 30, 2026, 5% of this portfolio represented $25.1 million in loans. (2) $85.0 million in CCBX cash reserves that are controlled by the Bank at September 30, 2026 and are designated for partner loan losses. Cash reserve account balances vary by partner and are governed by the applicable partner agreement. • CCBX partner agreements generally allocate responsibility for net charge-offs on CCBX loans and overdraft-related deposit losses to such partner through contractual credit enhancement arrangements(1) ◦ Contractual credit enhancement arrangements vary by partner. The Bank evaluates the collectability of partner reimbursement obligations each reporting period and records reserves when warranted ◦ A $22.8 million specific reserve established in the second quarter of 2026 on The Partner's credit enhancement receivable remains unchanged at September 30, 2026 • Funding for losses: (1) Cash reserve accounts(2) pledged by partners and maintained at the Bank, which may be used to satisfy reimbursement obligations and are replenished pursuant to the applicable agreement; or (2) Alternative funding arrangements agreed upon with partners to address reimbursement obligations under the applicable agreement • CCBX partners contractually bore responsibility for 98.4% of the $49.9 million in net charge-offs for CCBX loans for the quarter ended September 30, 2026 Segment Overview – Credit Quality

Appendix
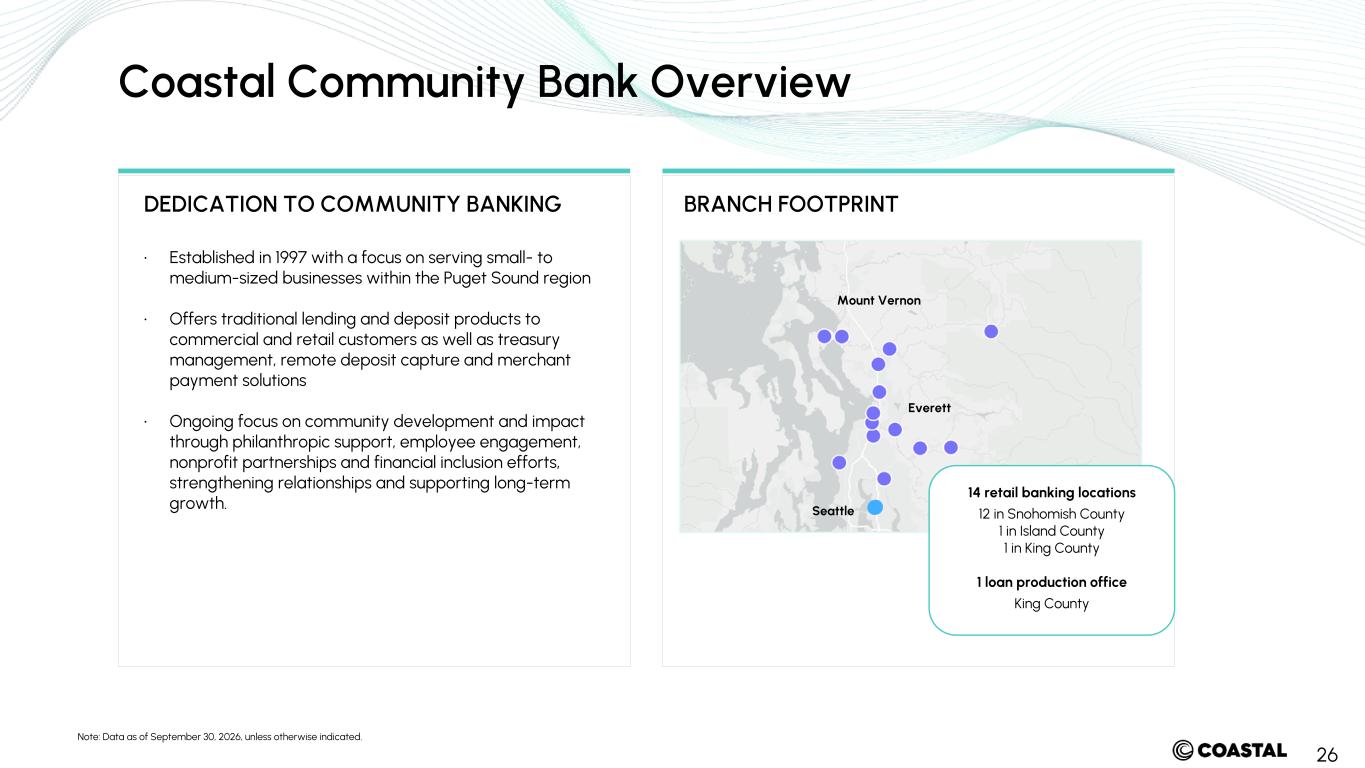
26 • Established in 1997 with a focus on serving small- to medium-sized businesses within the Puget Sound region • Offers traditional lending and deposit products to commercial and retail customers as well as treasury management, remote deposit capture and merchant payment solutions • Ongoing focus on community development and impact through philanthropic support, employee engagement, nonprofit partnerships and financial inclusion efforts, strengthening relationships and supporting long-term growth. Note: Data as of September 30, 2026, unless otherwise indicated. Mount Vernon Everett Seattle 14 retail banking locations 12 in Snohomish County 1 in Island County 1 in King County 1 loan production office King County Coastal Community Bank Overview DEDICATION TO COMMUNITY BANKING BRANCH FOOTPRINT
27 Accolades and Recognitions Stanwood & Camano News “Best Bank” 2013 - 2026 Note: Data as of September 30, 2026, unless otherwise indicated. Raymond James “Community Bankers Cup Award” 2019-2024 Piper Sandler "Bank and Thrift Sm-All Stars" 2019 -2023 Everett Herald Readers Choice 2025 - "Best Bank Finalist" 2024 - “Best Bank" "Best Place to Work" "3rd Place Mortgage" 2023 - “Best Bank" "Best Mortgage" "Best Place to Work" Hovde Group “Hovde's High Performers” 2022 - 2024 Notable Regional Employers "Corporate Philanthropist" Puget Sound Business Journal 2022-2026 "Fastest Growing Mid-Market Company in the Northwest" Puget Sound Business Journal 2023 KBW Bank Honor Roll Award 2024, 2025, 2026 Newsweek "America's Greatest Companies" 2025 Time "America's Growth Leaders of 2026" Coastal Community Bank Overview Seattle Times “Best in the PNW” 2025-2026
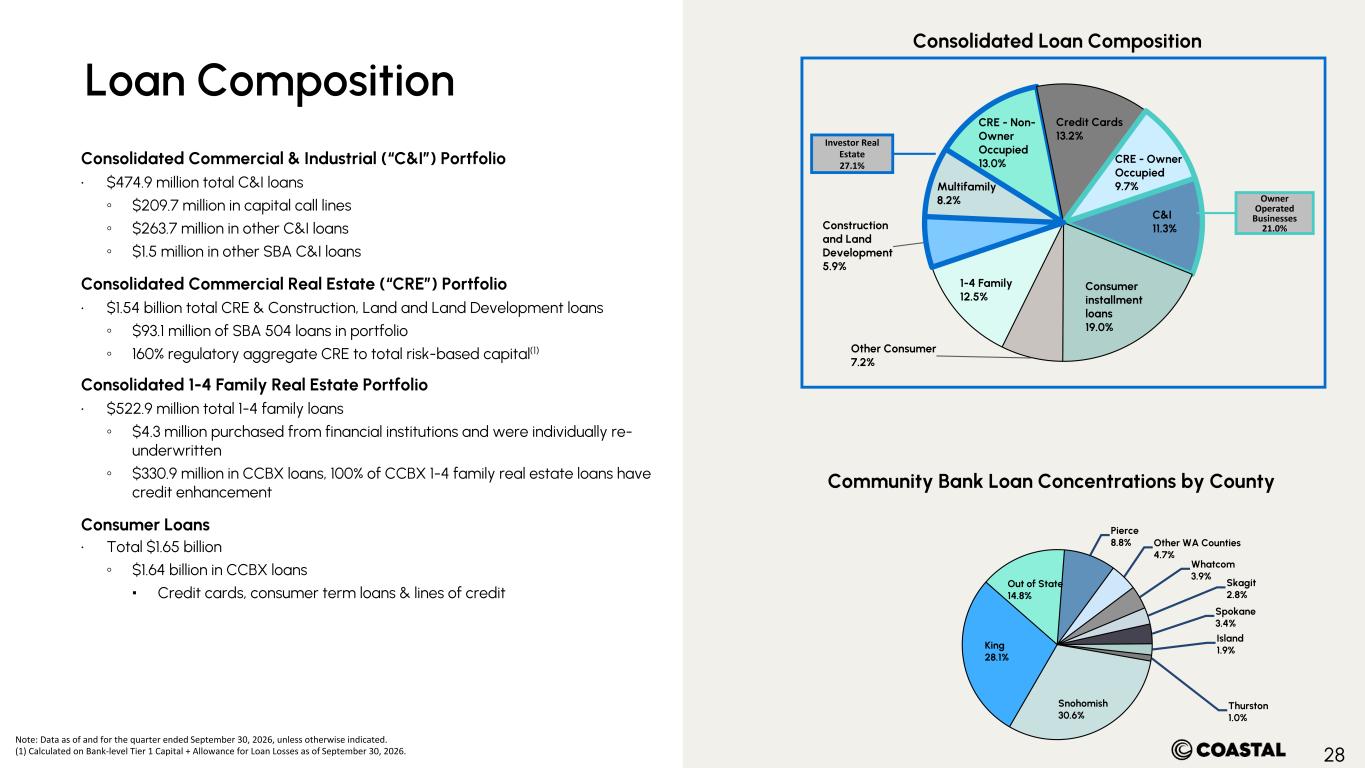
28 CRE - Non- Owner Occupied 13.0% Credit Cards 13.2% CRE - Owner Occupied 9.7% C&I 11.3% Consumer installment loans 19.0% Other Consumer 7.2% 1-4 Family 12.5% Construction and Land Development 5.9% Multifamily 8.2% Consolidated Loan Composition Community Bank Loan Concentrations by County Consolidated Commercial & Industrial (“C&I”) Portfolio • $474.9 million total C&I loans ◦ $209.7 million in capital call lines ◦ $263.7 million in other C&I loans ◦ $1.5 million in other SBA C&I loans Consolidated Commercial Real Estate (“CRE”) Portfolio • $1.54 billion total CRE & Construction, Land and Land Development loans ◦ $93.1 million of SBA 504 loans in portfolio ◦ 160% regulatory aggregate CRE to total risk-based capital(1) Consolidated 1-4 Family Real Estate Portfolio • $522.9 million total 1-4 family loans ◦ $4.3 million purchased from financial institutions and were individually re- underwritten ◦ $330.9 million in CCBX loans, 100% of CCBX 1-4 family real estate loans have credit enhancement Consumer Loans • Total $1.65 billion ◦ $1.64 billion in CCBX loans ▪ Credit cards, consumer term loans & lines of credit Note: Data as of and for the quarter ended September 30, 2026, unless otherwise indicated. (1) Calculated on Bank-level Tier 1 Capital + Allowance for Loan Losses as of September 30, 2026. Investor Real Estate 27.1% Owner Operated Businesses 21.0% Snohomish 30.6% King 28.1% Out of State 14.8% Pierce 8.8% Other WA Counties 4.7% Whatcom 3.9% Skagit 2.8% Spokane 3.4% Island 1.9% Thurston 1.0% Loan Composition
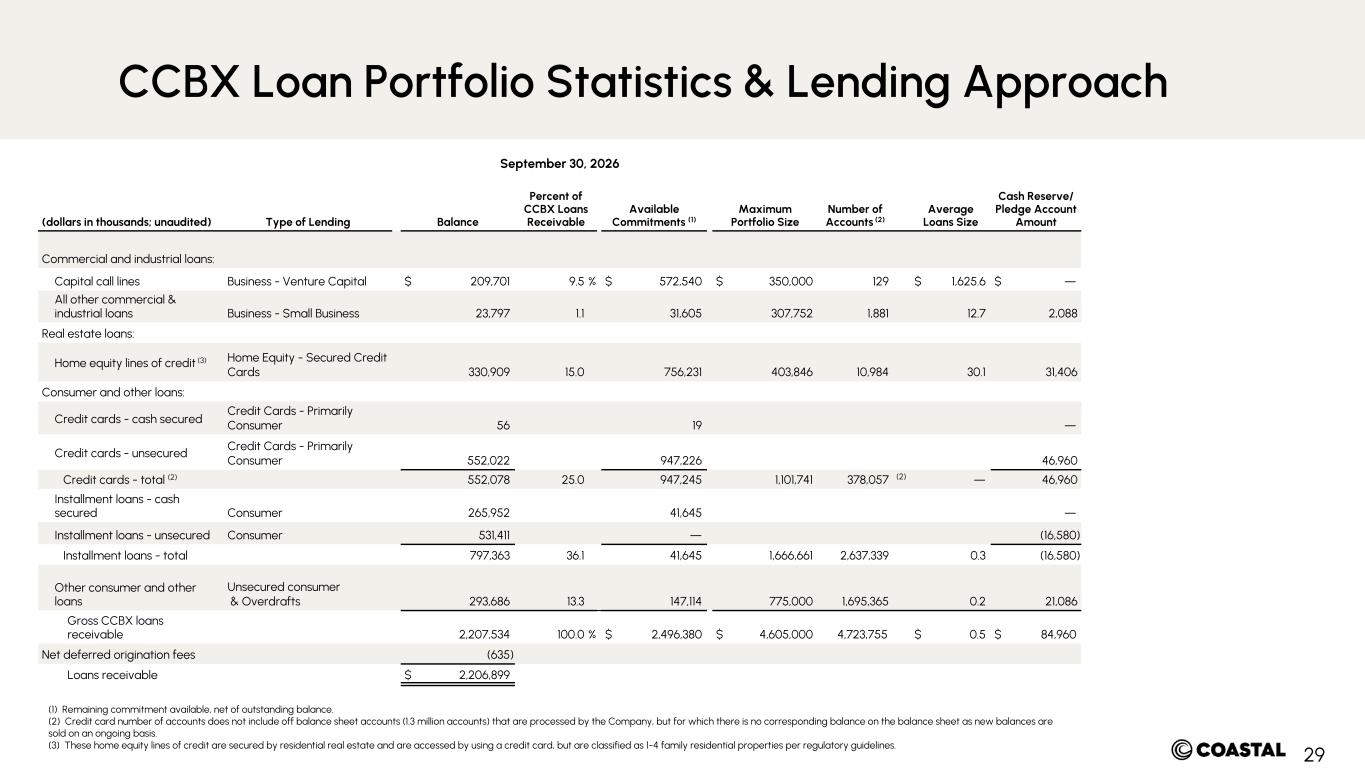
29 September 30, 2026 (dollars in thousands; unaudited) Type of Lending Balance Percent of CCBX Loans Receivable Available Commitments (1) Maximum Portfolio Size Number of Accounts (2) Average Loans Size Cash Reserve/ Pledge Account Amount Commercial and industrial loans: Capital call lines Business - Venture Capital $ 209,701 9.5 % $ 572,540 $ 350,000 129 $ 1,625.6 $ — All other commercial & industrial loans Business - Small Business 23,797 1.1 31,605 307,752 1,881 12.7 2,088 Real estate loans: Home equity lines of credit (3) Home Equity - Secured Credit Cards 330,909 15.0 756,231 403,846 10,984 30.1 31,406 Consumer and other loans: Credit cards - cash secured Credit Cards - Primarily Consumer 56 19 — Credit cards - unsecured Credit Cards - Primarily Consumer 552,022 947,226 46,960 Credit cards - total (2) 552,078 25.0 947,245 1,101,741 378,057 (2) — 46,960 Installment loans - cash secured Consumer 265,952 41,645 — Installment loans - unsecured Consumer 531,411 — (16,580) Installment loans - total 797,363 36.1 41,645 1,666,661 2,637,339 0.3 (16,580) Other consumer and other loans Unsecured consumer & Overdrafts 293,686 13.3 147,114 775,000 1,695,365 0.2 21,086 Gross CCBX loans receivable 2,207,534 100.0 % $ 2,496,380 $ 4,605,000 4,723,755 $ 0.5 $ 84,960 Net deferred origination fees (635) Loans receivable $ 2,206,899 (1) Remaining commitment available, net of outstanding balance. (2) Credit card number of accounts does not include off balance sheet accounts (1.3 million accounts) that are processed by the Company, but for which there is no corresponding balance on the balance sheet as new balances are sold on an ongoing basis. (3) These home equity lines of credit are secured by residential real estate and are accessed by using a credit card, but are classified as 1-4 family residential properties per regulatory guidelines. CCBX Loan Portfolio Statistics & Lending Approach
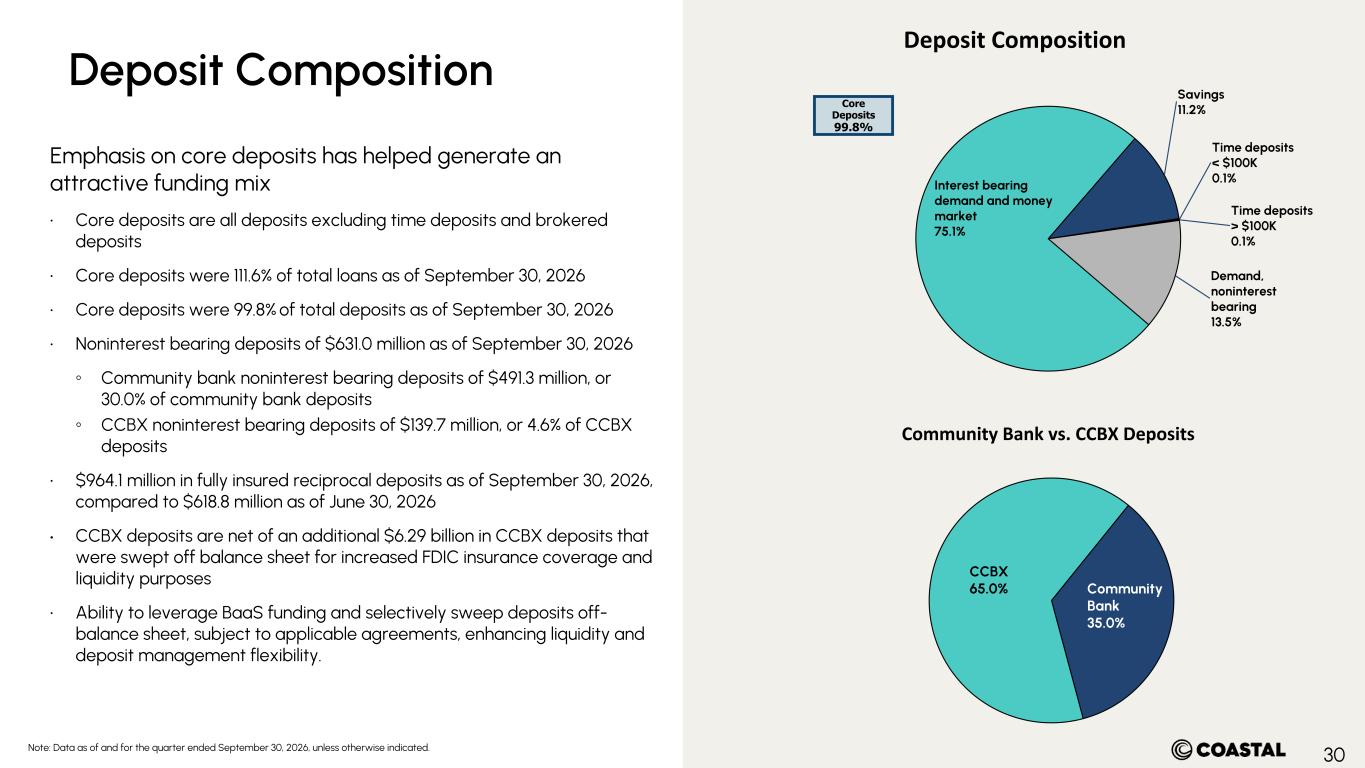
30 Demand, noninterest bearing 13.5% Interest bearing demand and money market 75.1% Savings 11.2% Time deposits < $100K 0.1% Time deposits > $100K 0.1% Deposit Composition Emphasis on core deposits has helped generate an attractive funding mix • Core deposits are all deposits excluding time deposits and brokered deposits • Core deposits were 111.6% of total loans as of September 30, 2026 • Core deposits were 99.8% of total deposits as of September 30, 2026 • Noninterest bearing deposits of $631.0 million as of September 30, 2026 ◦ Community bank noninterest bearing deposits of $491.3 million, or 30.0% of community bank deposits ◦ CCBX noninterest bearing deposits of $139.7 million, or 4.6% of CCBX deposits • $964.1 million in fully insured reciprocal deposits as of September 30, 2026, compared to $618.8 million as of June 30, 2026 • CCBX deposits are net of an additional $6.29 billion in CCBX deposits that were swept off balance sheet for increased FDIC insurance coverage and liquidity purposes • Ability to leverage BaaS funding and selectively sweep deposits off- balance sheet, subject to applicable agreements, enhancing liquidity and deposit management flexibility. Note: Data as of and for the quarter ended September 30, 2026, unless otherwise indicated. Core Deposits 99.8% Community Bank vs. CCBX Deposits CCBX 65.0% Community Bank 35.0% Deposit Composition
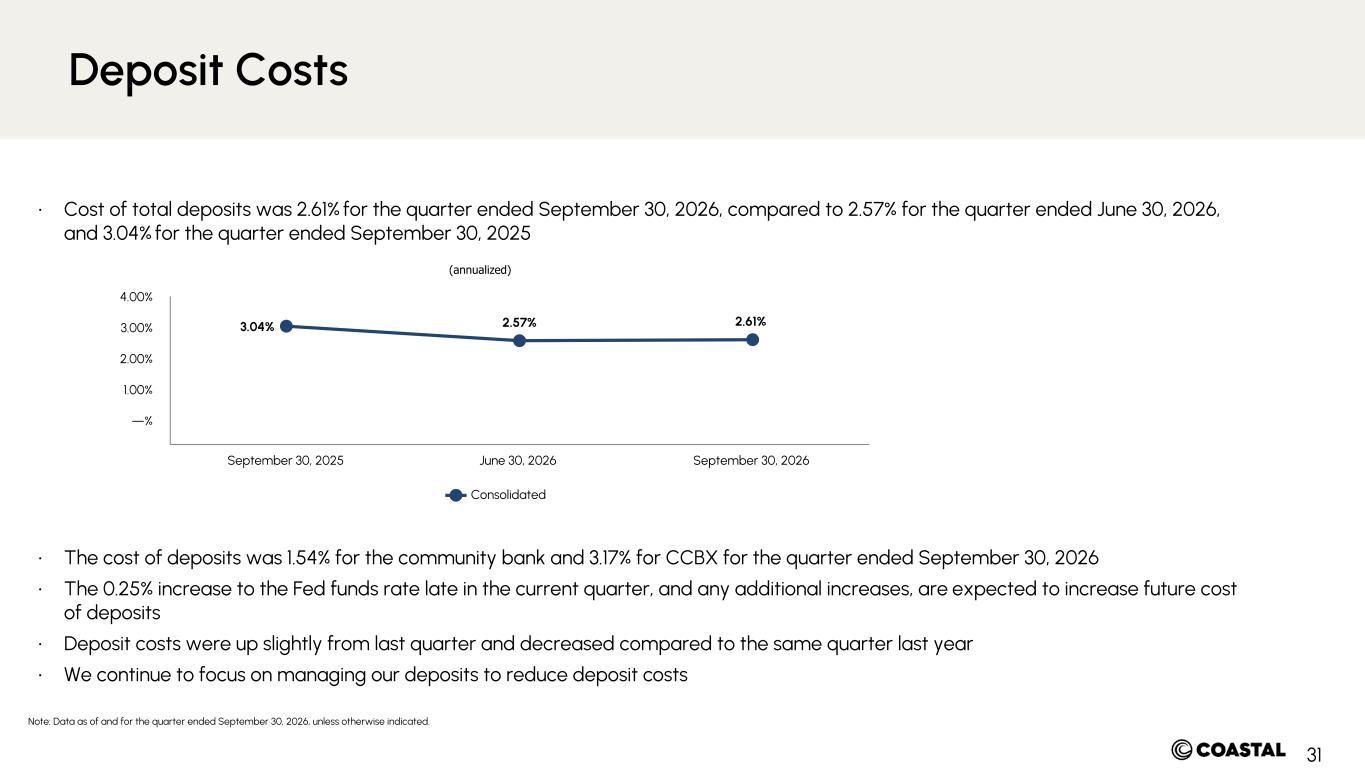
31 • Cost of total deposits was 2.61% for the quarter ended September 30, 2026, compared to 2.57% for the quarter ended June 30, 2026, and 3.04% for the quarter ended September 30, 2025 • The cost of deposits was 1.54% for the community bank and 3.17% for CCBX for the quarter ended September 30, 2026 • The 0.25% increase to the Fed funds rate late in the current quarter, and any additional increases, are expected to increase future cost of deposits • Deposit costs were up slightly from last quarter and decreased compared to the same quarter last year • We continue to focus on managing our deposits to reduce deposit costs Note: Data as of and for the quarter ended September 30, 2026, unless otherwise indicated. 3.04% 2.57% 2.61% Consolidated September 30, 2025 June 30, 2026 September 30, 2026 —% 1.00% 2.00% 3.00% 4.00% (annualized) Deposit Costs
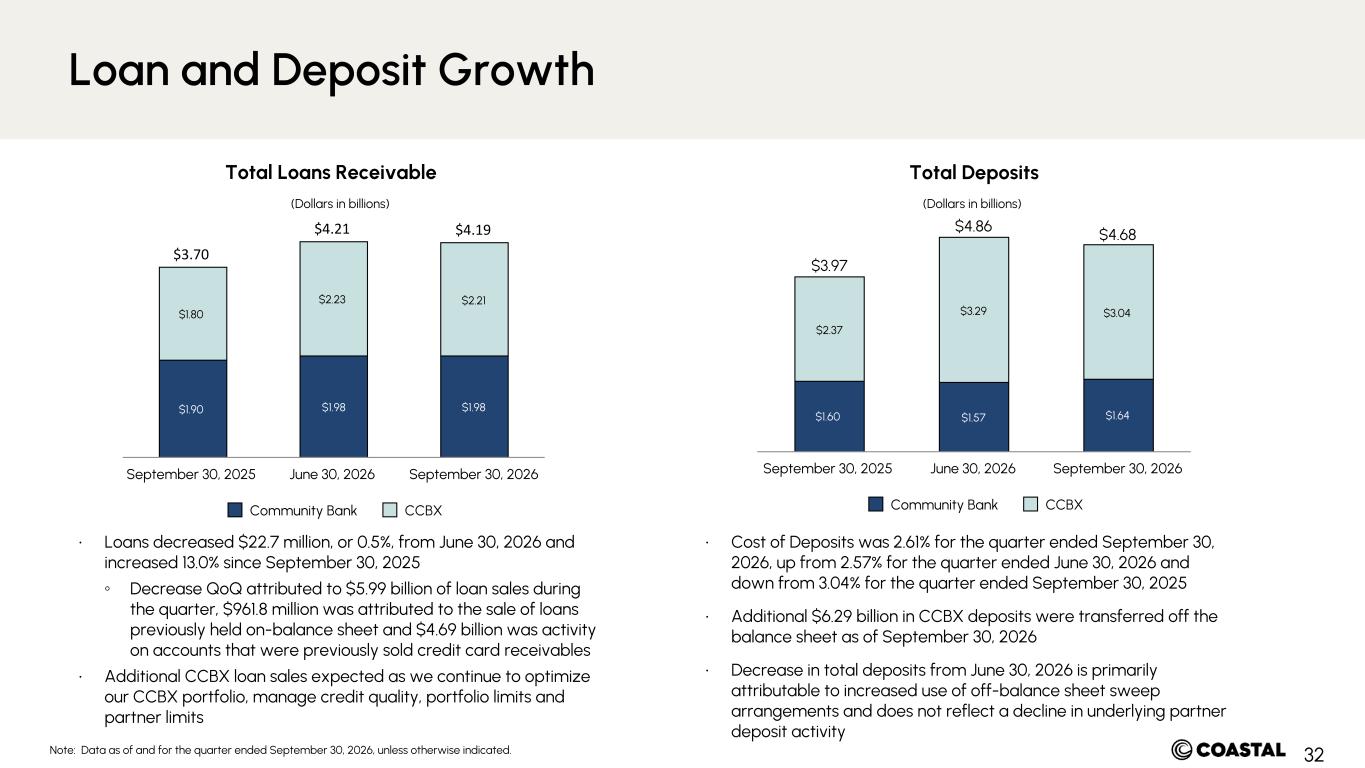
32 $3.70 $4.21 $4.19 $1.90 $1.98 $1.98 $1.80 $2.23 $2.21 Community Bank CCBX September 30, 2025 June 30, 2026 September 30, 2026 • Loans decreased $22.7 million, or 0.5%, from June 30, 2026 and increased 13.0% since September 30, 2025 ◦ Decrease QoQ attributed to $5.99 billion of loan sales during the quarter, $961.8 million was attributed to the sale of loans previously held on-balance sheet and $4.69 billion was activity on accounts that were previously sold credit card receivables • Additional CCBX loan sales expected as we continue to optimize our CCBX portfolio, manage credit quality, portfolio limits and partner limits $3.97 $4.86 $4.68 $1.60 $1.57 $1.64 $2.37 $3.29 $3.04 Community Bank CCBX September 30, 2025 June 30, 2026 September 30, 2026 (Dollars in billions) (Dollars in billions) • Cost of Deposits was 2.61% for the quarter ended September 30, 2026, up from 2.57% for the quarter ended June 30, 2026 and down from 3.04% for the quarter ended September 30, 2025 • Additional $6.29 billion in CCBX deposits were transferred off the balance sheet as of September 30, 2026 • Decrease in total deposits from June 30, 2026 is primarily attributable to increased use of off-balance sheet sweep arrangements and does not reflect a decline in underlying partner deposit activity Total DepositsTotal Loans Receivable Note: Data as of and for the quarter ended September 30, 2026, unless otherwise indicated. Loan and Deposit Growth
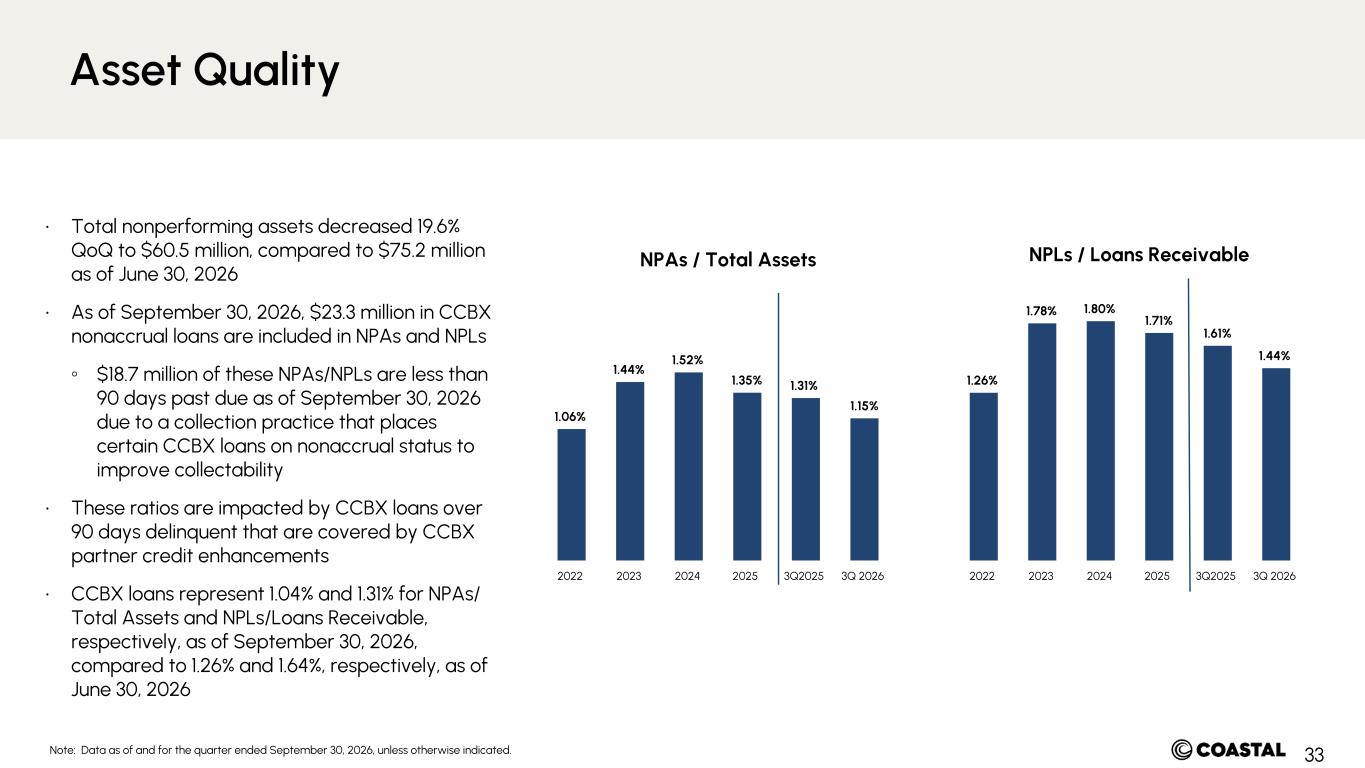
33 NPAs / Total Assets NPLs / Loans Receivable 1.06% 1.44% 1.52% 1.35% 1.31% 1.15% 2022 2023 2024 2025 3Q2025 3Q 2026 1.26% 1.78% 1.80% 1.71% 1.61% 1.44% 2022 2023 2024 2025 3Q2025 3Q 2026 • Total nonperforming assets decreased 19.6% QoQ to $60.5 million, compared to $75.2 million as of June 30, 2026 • As of September 30, 2026, $23.3 million in CCBX nonaccrual loans are included in NPAs and NPLs ◦ $18.7 million of these NPAs/NPLs are less than 90 days past due as of September 30, 2026 due to a collection practice that places certain CCBX loans on nonaccrual status to improve collectability • These ratios are impacted by CCBX loans over 90 days delinquent that are covered by CCBX partner credit enhancements • CCBX loans represent 1.04% and 1.31% for NPAs/ Total Assets and NPLs/Loans Receivable, respectively, as of September 30, 2026, compared to 1.26% and 1.64%, respectively, as of June 30, 2026 Asset Quality Note: Data as of and for the quarter ended September 30, 2026, unless otherwise indicated.
34 The Company uses certain non-GAAP financial measures to provide meaningful supplemental information regarding the Company’s operational performance and to enhance investors’ overall understanding of such financial performance. However, these non-GAAP financial measures are supplemental and are not a substitute for an analysis based on GAAP measures. As other companies may use different calculations for these adjusted measures, this presentation may not be comparable to other similarly titled adjusted measures reported by other companies. The following non-GAAP financial measure is presented to illustrate the impact of BaaS loan expense on CCBX net loan income and yield on CCBX loans. • Net BaaS loan income divided by average CCBX loans is a non-GAAP financial measure adjusts for the impact BaaS loan expense on net BaaS loan income and the yield on CCBX loans. The most directly comparable GAAP measure is yield on CCBX loans. • The following non-GAAP financial measure is presented to illustrate the impact of BaaS loan expense on net interest income and net interest margin. • CCBX net interest income net of BaaS loan expense is a non-GAAP financial measure adjusts for the impact BaaS loan expense on CCBX net interest income. The most directly comparable GAAP measure is CCBX net interest income. • CCBX net interest margin, net of BaaS loan expense is a non-GAAP financial measure adjusts for the impact of BaaS loan expense on CCBX net interest rate margin. The most directly comparable GAAP measure is CCBX net interest margin. Reconciliations of the GAAP and non-GAAP financial measures are presented on the next slide. (1) Annualized for periods presented. Non-GAAP Reconciliation CCBX Net Interest Margin, Net of BaaS Loan Expense
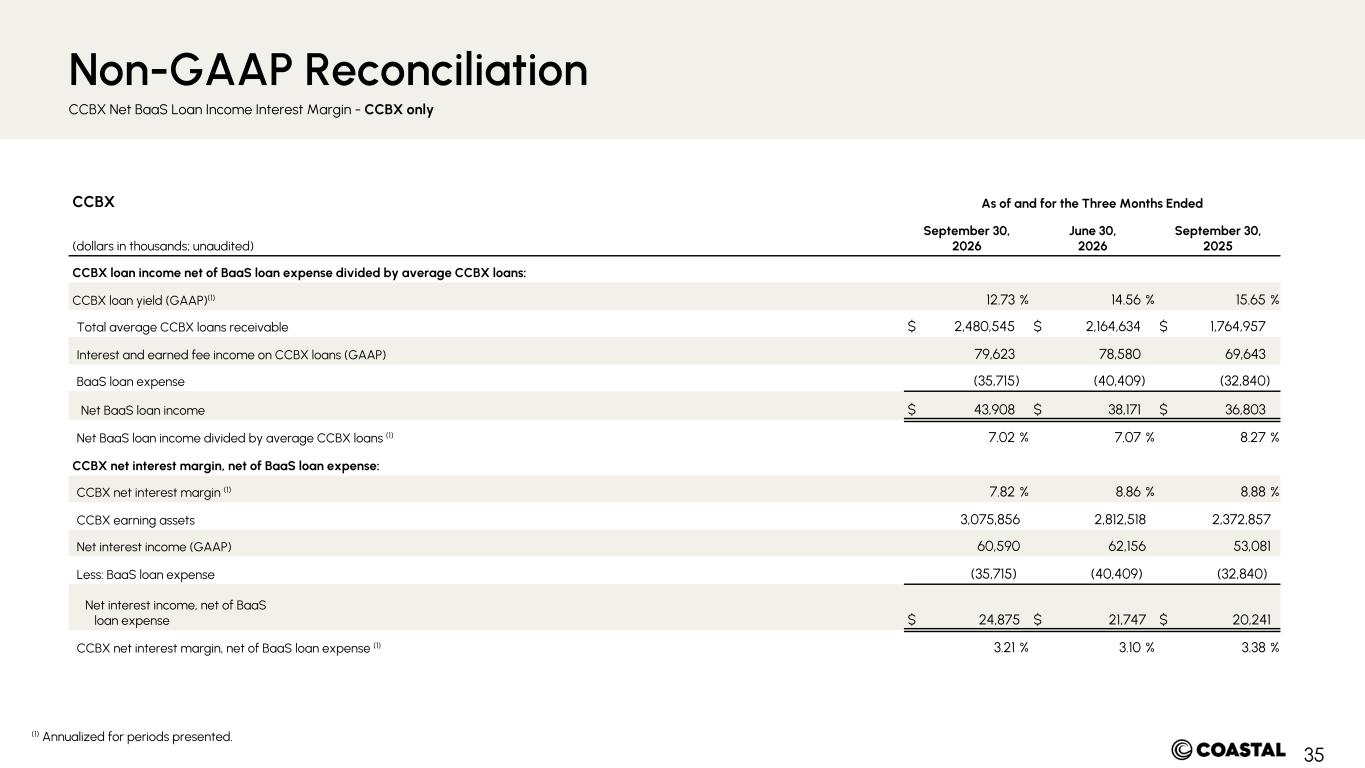
35 CCBX As of and for the Three Months Ended (dollars in thousands; unaudited) September 30, 2026 June 30, 2026 September 30, 2025 CCBX loan income net of BaaS loan expense divided by average CCBX loans: CCBX loan yield (GAAP)(1) 12.73 % 14.56 % 15.65 % Total average CCBX loans receivable $ 2,480,545 $ 2,164,634 $ 1,764,957 Interest and earned fee income on CCBX loans (GAAP) 79,623 78,580 69,643 BaaS loan expense (35,715) (40,409) (32,840) Net BaaS loan income $ 43,908 $ 38,171 $ 36,803 Net BaaS loan income divided by average CCBX loans (1) 7.02 % 7.07 % 8.27 % CCBX net interest margin, net of BaaS loan expense: CCBX net interest margin (1) 7.82 % 8.86 % 8.88 % CCBX earning assets 3,075,856 2,812,518 2,372,857 Net interest income (GAAP) 60,590 62,156 53,081 Less: BaaS loan expense (35,715) (40,409) (32,840) Net interest income, net of BaaS loan expense $ 24,875 $ 21,747 $ 20,241 CCBX net interest margin, net of BaaS loan expense (1) 3.21 % 3.10 % 3.38 % (1) Annualized for periods presented. Non-GAAP Reconciliation CCBX Net BaaS Loan Income Interest Margin - CCBX only
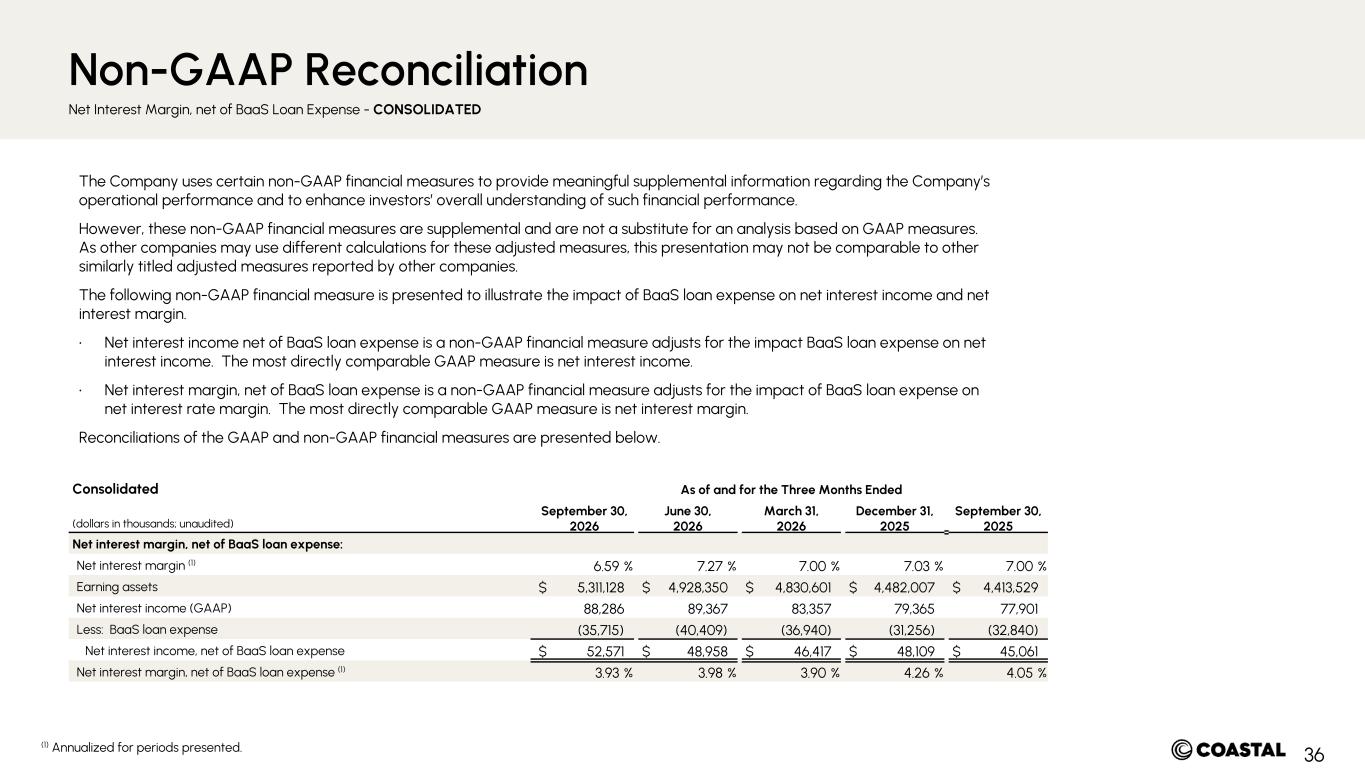
36 The Company uses certain non-GAAP financial measures to provide meaningful supplemental information regarding the Company’s operational performance and to enhance investors’ overall understanding of such financial performance. However, these non-GAAP financial measures are supplemental and are not a substitute for an analysis based on GAAP measures. As other companies may use different calculations for these adjusted measures, this presentation may not be comparable to other similarly titled adjusted measures reported by other companies. The following non-GAAP financial measure is presented to illustrate the impact of BaaS loan expense on net interest income and net interest margin. • Net interest income net of BaaS loan expense is a non-GAAP financial measure adjusts for the impact BaaS loan expense on net interest income. The most directly comparable GAAP measure is net interest income. • Net interest margin, net of BaaS loan expense is a non-GAAP financial measure adjusts for the impact of BaaS loan expense on net interest rate margin. The most directly comparable GAAP measure is net interest margin. Reconciliations of the GAAP and non-GAAP financial measures are presented below. Consolidated As of and for the Three Months Ended (dollars in thousands; unaudited) September 30, 2026 June 30, 2026 March 31, 2026 December 31, 2025 September 30, 2025 Net interest margin, net of BaaS loan expense: Net interest margin (1) 6.59 % 7.27 % 7.00 % 7.03 % 7.00 % Earning assets $ 5,311,128 $ 4,928,350 $ 4,830,601 $ 4,482,007 $ 4,413,529 Net interest income (GAAP) 88,286 89,367 83,357 79,365 77,901 Less: BaaS loan expense (35,715) (40,409) (36,940) (31,256) (32,840) Net interest income, net of BaaS loan expense $ 52,571 $ 48,958 $ 46,417 $ 48,109 $ 45,061 Net interest margin, net of BaaS loan expense (1) 3.93 % 3.98 % 3.90 % 4.26 % 4.05 % (1) Annualized for periods presented. Non-GAAP Reconciliation Net Interest Margin, net of BaaS Loan Expense - CONSOLIDATED
37 The Company uses certain non-GAAP financial measures to provide meaningful supplemental information regarding the Company’s operational performance and to enhance investors’ overall understanding of such financial performance. However, these non-GAAP financial measures are supplemental and are not a substitute for an analysis based on GAAP measures. As other companies may use different calculations for these adjusted measures, this presentation may not be comparable to other similarly titled adjusted measures reported by other companies. • Core expenses is presented to illustrate the impact of BaaS loan expense, BaaS fraud expenses and reimbursement of expenses (BaaS) have on noninterest expense. The most directly comparable GAAP measure is noninterest expense. • Pre-tax, pre-provision net revenue ("PPNR") is presented to illustrate the impact of provision for income tax, provision for credit losses, BaaS credit and fraud indemnification income and BaaS fraud expense, net of BaaS loan expense have on net income. The most directly comparable GAAP measure is net income. Reconciliations of the GAAP and non-GAAP financial measures are presented on the next slide. Non-GAAP Reconciliation Core Expense & PPNR
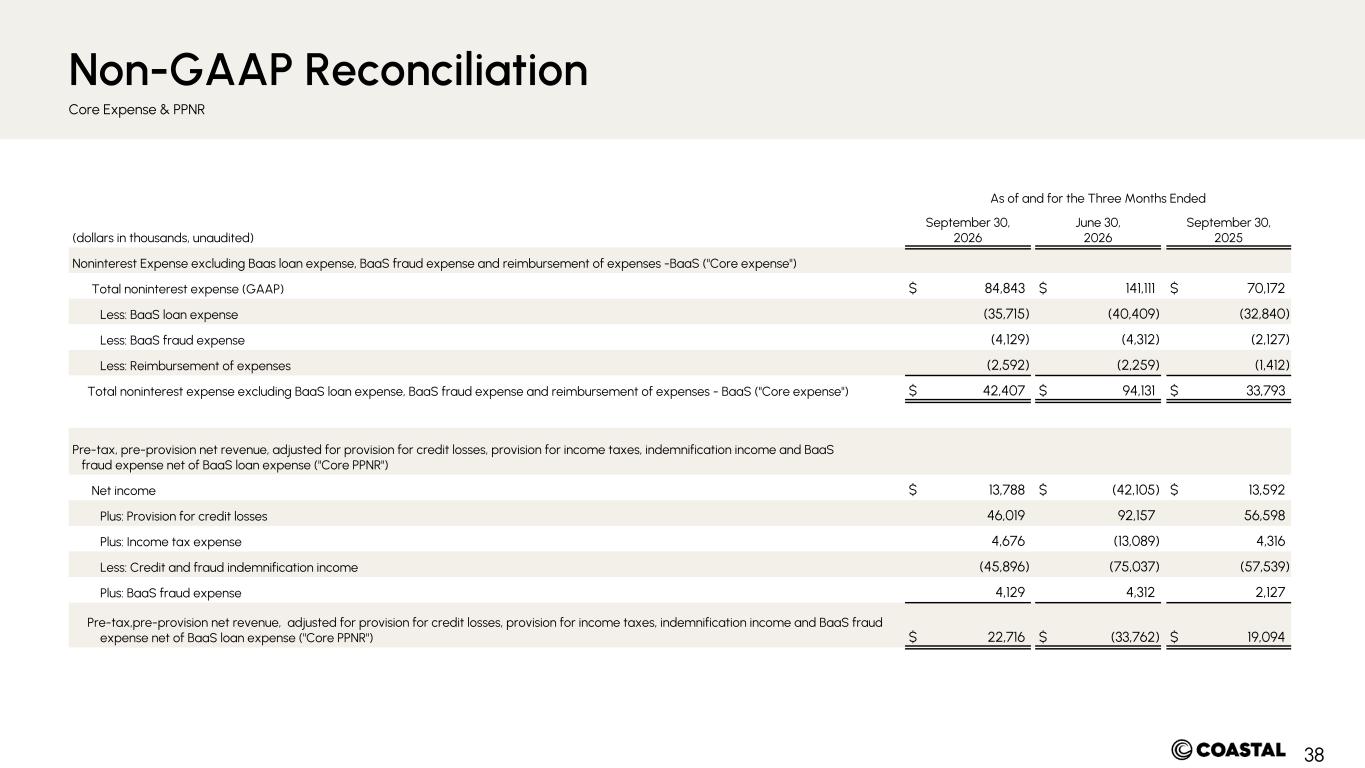
38 As of and for the Three Months Ended (dollars in thousands, unaudited) September 30, 2026 June 30, 2026 September 30, 2025 Noninterest Expense excluding Baas loan expense, BaaS fraud expense and reimbursement of expenses -BaaS ("Core expense") Total noninterest expense (GAAP) $ 84,843 $ 141,111 $ 70,172 Less: BaaS loan expense (35,715) (40,409) (32,840) Less: BaaS fraud expense (4,129) (4,312) (2,127) Less: Reimbursement of expenses (2,592) (2,259) (1,412) Total noninterest expense excluding BaaS loan expense, BaaS fraud expense and reimbursement of expenses - BaaS ("Core expense") $ 42,407 $ 94,131 $ 33,793 Pre-tax, pre-provision net revenue, adjusted for provision for credit losses, provision for income taxes, indemnification income and BaaS fraud expense net of BaaS loan expense ("Core PPNR") Net income $ 13,788 $ (42,105) $ 13,592 Plus: Provision for credit losses 46,019 92,157 56,598 Plus: Income tax expense 4,676 (13,089) 4,316 Less: Credit and fraud indemnification income (45,896) (75,037) (57,539) Plus: BaaS fraud expense 4,129 4,312 2,127 Pre-tax,pre-provision net revenue, adjusted for provision for credit losses, provision for income taxes, indemnification income and BaaS fraud expense net of BaaS loan expense ("Core PPNR") $ 22,716 $ (33,762) $ 19,094 Non-GAAP Reconciliation Core Expense & PPNR
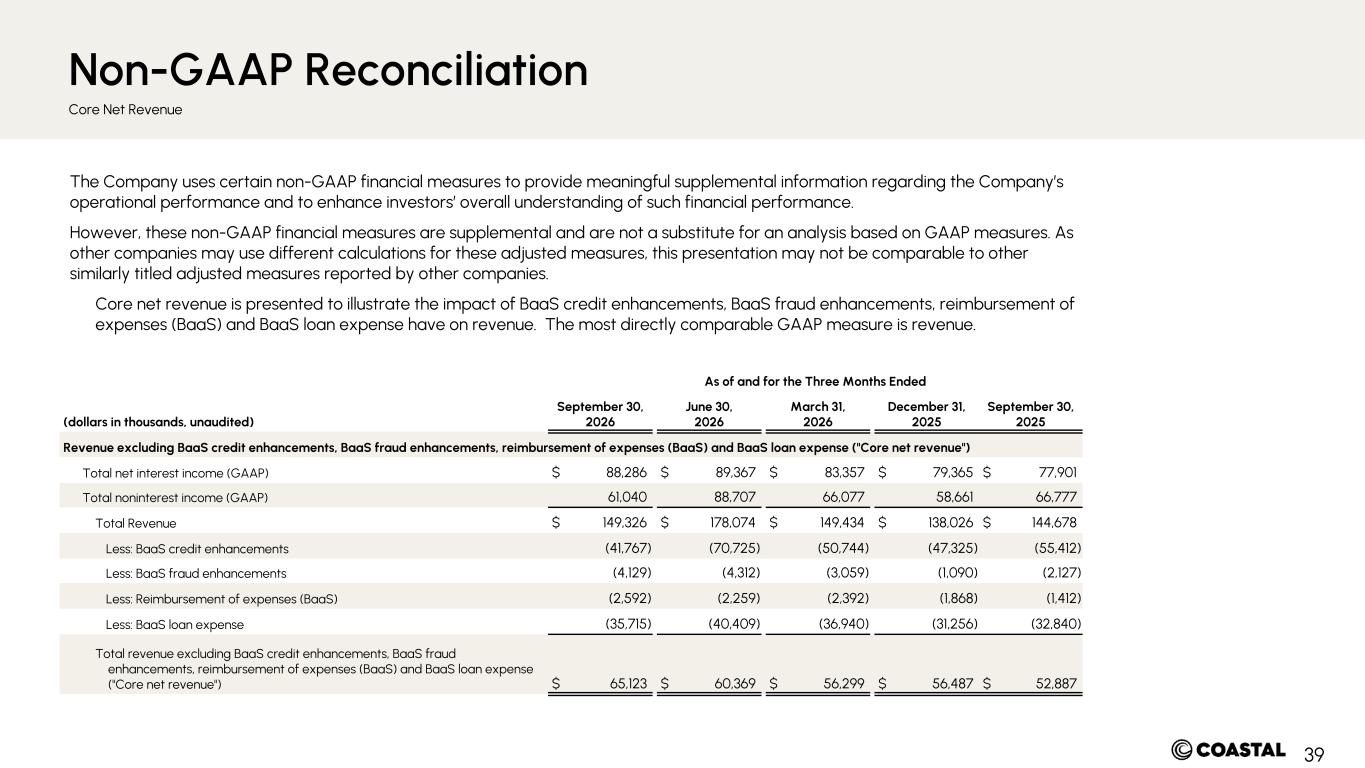
39 The Company uses certain non-GAAP financial measures to provide meaningful supplemental information regarding the Company’s operational performance and to enhance investors’ overall understanding of such financial performance. However, these non-GAAP financial measures are supplemental and are not a substitute for an analysis based on GAAP measures. As other companies may use different calculations for these adjusted measures, this presentation may not be comparable to other similarly titled adjusted measures reported by other companies. Core net revenue is presented to illustrate the impact of BaaS credit enhancements, BaaS fraud enhancements, reimbursement of expenses (BaaS) and BaaS loan expense have on revenue. The most directly comparable GAAP measure is revenue. As of and for the Three Months Ended (dollars in thousands, unaudited) September 30, 2026 June 30, 2026 March 31, 2026 December 31, 2025 September 30, 2025 Revenue excluding BaaS credit enhancements, BaaS fraud enhancements, reimbursement of expenses (BaaS) and BaaS loan expense ("Core net revenue") Total net interest income (GAAP) $ 88,286 $ 89,367 $ 83,357 $ 79,365 $ 77,901 Total noninterest income (GAAP) 61,040 88,707 66,077 58,661 66,777 Total Revenue $ 149,326 $ 178,074 $ 149,434 $ 138,026 $ 144,678 Less: BaaS credit enhancements (41,767) (70,725) (50,744) (47,325) (55,412) Less: BaaS fraud enhancements (4,129) (4,312) (3,059) (1,090) (2,127) Less: Reimbursement of expenses (BaaS) (2,592) (2,259) (2,392) (1,868) (1,412) Less: BaaS loan expense (35,715) (40,409) (36,940) (31,256) (32,840) Total revenue excluding BaaS credit enhancements, BaaS fraud enhancements, reimbursement of expenses (BaaS) and BaaS loan expense ("Core net revenue") $ 65,123 $ 60,369 $ 56,299 $ 56,487 $ 52,887 Non-GAAP Reconciliation Core Net Revenue
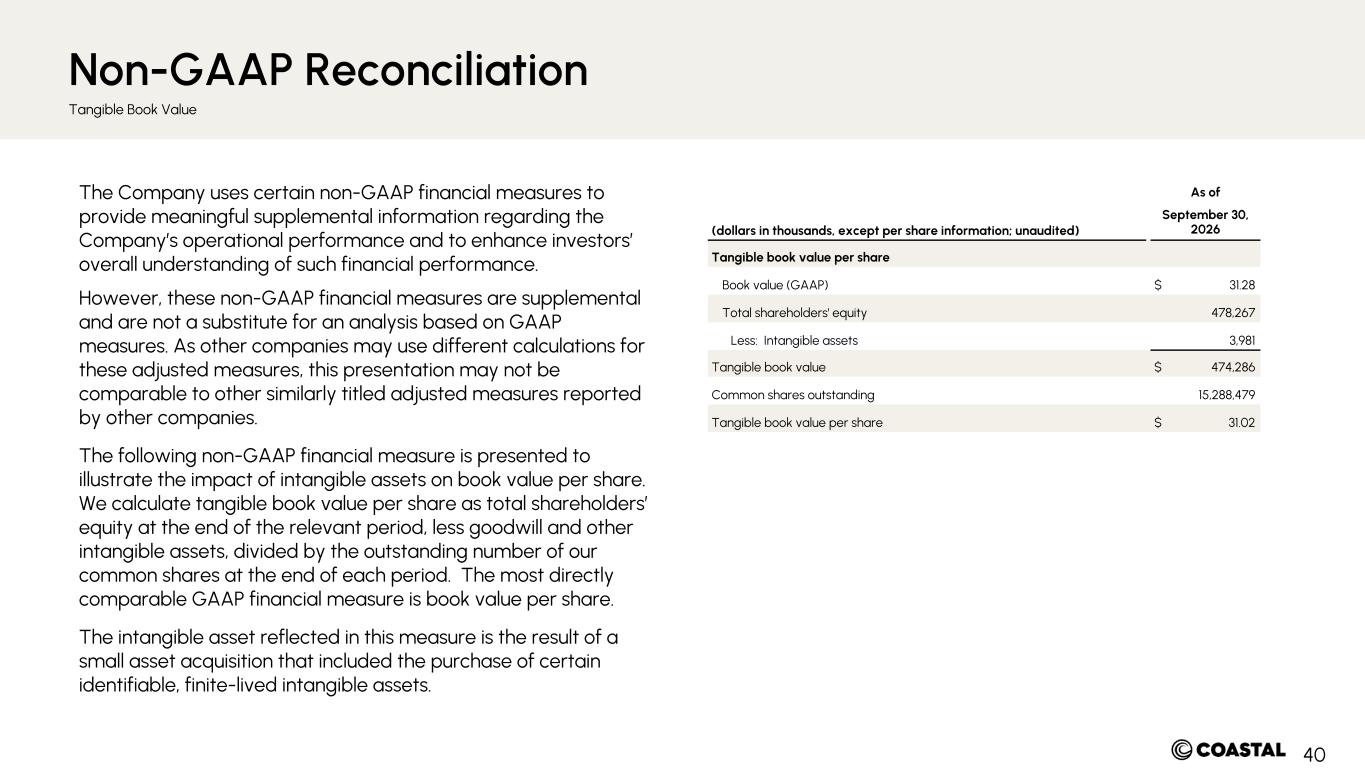
40 The Company uses certain non-GAAP financial measures to provide meaningful supplemental information regarding the Company’s operational performance and to enhance investors’ overall understanding of such financial performance. However, these non-GAAP financial measures are supplemental and are not a substitute for an analysis based on GAAP measures. As other companies may use different calculations for these adjusted measures, this presentation may not be comparable to other similarly titled adjusted measures reported by other companies. The following non-GAAP financial measure is presented to illustrate the impact of intangible assets on book value per share. We calculate tangible book value per share as total shareholders’ equity at the end of the relevant period, less goodwill and other intangible assets, divided by the outstanding number of our common shares at the end of each period. The most directly comparable GAAP financial measure is book value per share. The intangible asset reflected in this measure is the result of a small asset acquisition that included the purchase of certain identifiable, finite-lived intangible assets. As of (dollars in thousands, except per share information; unaudited) September 30, 2026 Tangible book value per share Book value (GAAP) $ 31.28 Total shareholders' equity 478,267 Less: Intangible assets 3,981 Tangible book value $ 474,286 Common shares outstanding 15,288,479 Tangible book value per share $ 31.02 Non-GAAP Reconciliation Tangible Book Value