Shareholder Report
|
12 Months Ended |
|
Aug. 31, 2026
USD ($)
Holding
|
|---|
| Shareholder Report [Line Items] |
|
| Document Type |
N-CSR
|
| Amendment Flag |
false
|
| Registrant Name |
MORGAN STANLEY PATHWAY FUNDS
|
| Entity Central Index Key |
0000875186
|
| Entity Investment Company Type |
N-1A
|
| Document Period End Date |
Aug. 31, 2026
|
| C000023137 |
|
| Shareholder Report [Line Items] |
|
| No Trading Symbol [Flag] |
true
|
| Annual or Semi-Annual Statement [Text Block] |
This annual shareholder report contains important information about Morgan Stanley Pathway Large Cap Equity ETF for the period of September 1, 2025 to August 31, 2026.
|
| Shareholder Report Annual or Semi-Annual |
Annual Shareholder Report
|
| Additional Information [Text Block] |
You can find additional information about the fund at www.morganstanley.com/wealth-investmentsolutions/cgcm. You can also request this information by contacting us at 1-800-869-3326
|
| Material Fund Change Notice [Text Block] |
This report describes changes to the Fund that occurred during the reporting period.
|
| Additional Information Phone Number |
1-800-869-3326
|
| Additional Information Website |
www.morganstanley.com/wealth-investmentsolutions/cgcm
|
| Expenses [Text Block] |
What were the Fund costs for the last year?(based on hypothetical $10,000 investment)
Table Summary
Fund name |
Cost of a $10,000 investment |
Cost paid as a % of a $10,000 investment |
Morgan Stanley Pathway Large Cap Equity ETF |
$40 |
0.37% | |
| Expenses Paid, Amount |
$ 40
|
| Expense Ratio, Percent |
0.37%
|
| Factors Affecting Performance [Text Block] |
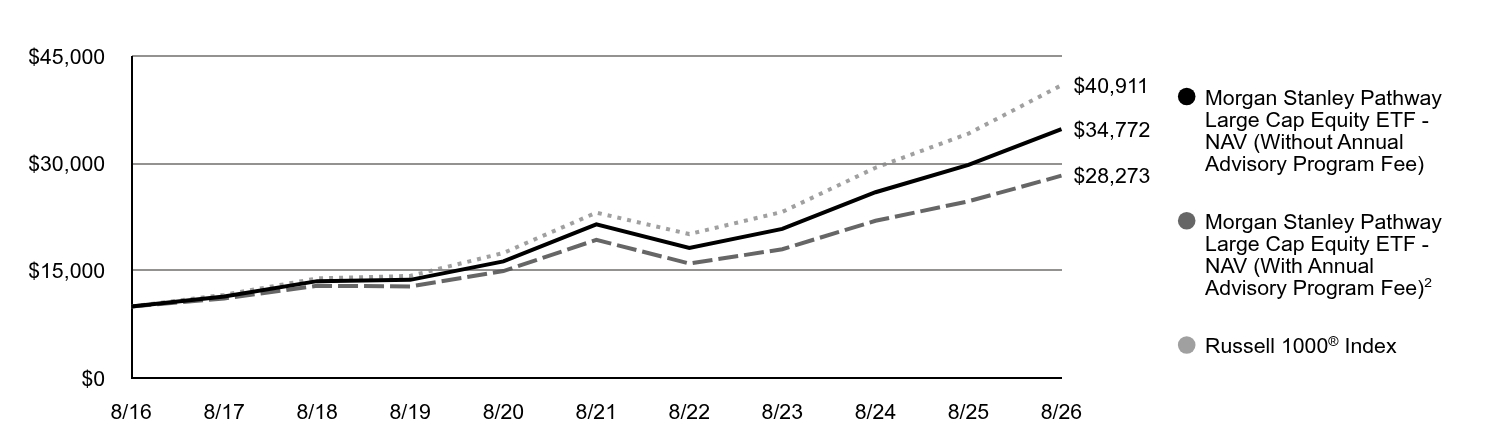
How did the fund perform last year?Key contributors to and detractors from performance relative to the Russell 1000® Index: Contributors: Positioning within the consumer discretionary sector contributed positively to relative performance during the period. Holdings in consumer services were the largest source of the sector’s contribution, as favorable security selection and exposure to stronger-performing companies helped the fund outperform the benchmark within this segment. Underweight consumer staples also benefited relative performance, as the sector lagged the broader market during a period when investors favored higher-growth areas. The fund’s lower exposure reduced the effect of the sector’s relative weakness and provided an additional contribution to results.
Detractors: The underweight allocation to information technology detracted from relative performance during the period. In particular, lower exposure to semiconductors and technology hardware was a key headwind, as both industries were among the strongest-performing areas of the market. Positioning within the health care sector also weighed on relative performance during the period. Holdings in pharmaceuticals, biotechnology and health care equipment underperformed their benchmark counterparts, reflecting unfavorable security selection across these industries.
|
| Performance Past Does Not Indicate Future [Text] |
THE FUND'S PAST PERFORMANCE IS NO GUARANTEE OF FUTURE RESULTS.
|
| Line Graph [Table Text Block] |
Table Summary
|
Morgan Stanley Pathway Large Cap Equity ETF - NAV (Without Annual Advisory Program Fee) |
Morgan Stanley Pathway Large Cap Equity ETF - NAV (With Annual Advisory Program FeeFootnote Reference2) |
Russell 1000® Index |
8/16 |
$10,000 |
$10,000 |
$10,000 |
8/17 |
$11,386 |
$11,106 |
$11,616 |
8/18 |
$13,537 |
$12,886 |
$13,918 |
8/19 |
$13,716 |
$12,800 |
$14,265 |
8/20 |
$16,301 |
$14,941 |
$17,474 |
8/21 |
$21,483 |
$19,309 |
$23,110 |
8/22 |
$18,166 |
$15,999 |
$20,114 |
8/23 |
$20,839 |
$17,992 |
$23,212 |
8/24 |
$25,958 |
$21,967 |
$29,386 |
8/25 |
$29,772 |
$24,696 |
$34,157 |
8/26 |
$34,772 |
$28,273 |
$40,911 |
|
| Average Annual Return [Table Text Block] |
Table Summary
|
1 Year |
5 Years |
10 Years |
Morgan Stanley Pathway Large Cap Equity ETF - NAV (Without Annual Advisory Program Fee) |
16.80% |
10.11% |
13.27% |
Morgan Stanley Pathway Large Cap Equity ETF - NAV (With Annual Advisory Program Fee)Footnote Reference2 |
14.48% |
7.93% |
10.75% |
Russell 1000® Index |
19.77% |
12.10% |
15.13% | |
| No Deduction of Taxes [Text Block] |
Performance does not reflect the deduction of taxes that a shareholder would pay on Fund distributions or redemption of Fund shares
|
| AssetsNet |
$ 4,071,442,629
|
| Holdings Count | Holding |
793
|
| Advisory Fees Paid, Amount |
$ 11,125,834
|
| InvestmentCompanyPortfolioTurnover |
18.00%
|
| Additional Fund Statistics [Text Block] |
Table Summary
Total Net Assets |
$4,071,442,629 |
# of Portfolio Holdings |
793 |
Portfolio Turnover Rate |
18% |
Advisory Fees Paid |
$11,125,834 | |
| Holdings [Text Block] |
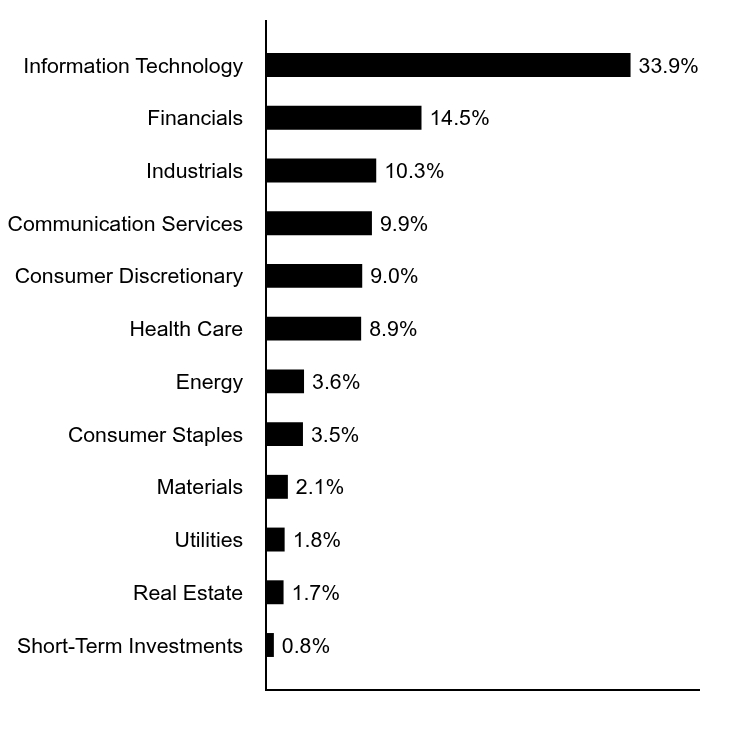
Sector Allocation (% of Investments)
Table Summary
Value |
Value |
Short-Term Investments |
0.8% |
Real Estate |
1.7% |
Utilities |
1.8% |
Materials |
2.1% |
Consumer Staples |
3.5% |
Energy |
3.6% |
Health Care |
8.9% |
Consumer Discretionary |
9.0% |
Communication Services |
9.9% |
Industrials |
10.3% |
Financials |
14.5% |
Information Technology |
33.9% | |
| Largest Holdings [Text Block] |
Top Ten Holdings (% of Investments)Footnote Referencea
Table Summary
NVIDIA Corp. |
7.0% |
Microsoft Corp. |
5.7% |
Apple Inc. |
5.5% |
Amazon.com Inc. |
4.1% |
Alphabet Inc., Class A Shares |
3.2% |
Broadcom Inc. |
2.5% |
Meta Platforms Inc., Class A Shares |
2.0% |
Alphabet Inc., Class C Shares |
1.9% |
JPMorgan Chase & Co. |
1.6% |
Micron Technology Inc. |
1.6% |
Total |
35.1% |
| Footnote |
Description |
Footnotea |
Excludes cash equivalents. | |
| Material Fund Change [Text Block] |
This is a summary of certain changes to the Fund since August 31, 2025. For more complete information, you may review the Fund’s next prospectus, which we expect to be available by January 1, 2027 at www.morganstanley.com/wealth-investmentsolutions/cgcm or upon request by contacting us at 1-800-869-3326. Effective March 23, 2026, Blackrock Financial Management, Inc. is no longer an investment sub-adviser of the Fund and O’Shaughnessy Asset Management, LLC commenced as a new investment sub-adviser of the Fund. Effective August 19, 2026, ClearBridge Investments, LLC is no longer an investment sub-adviser of the Fund and Westfield Capital Management Company, L.P. commenced as a new investment sub-adviser of the Fund. Consulting Group Advisory Services, LLC continues to serve as the adviser of the Fund. |
| C000023141 |
|
| Shareholder Report [Line Items] |
|
| No Trading Symbol [Flag] |
true
|
| Annual or Semi-Annual Statement [Text Block] |
This annual shareholder report contains important information about Morgan Stanley Pathway Small-Mid Cap Equity ETF for the period of September 1, 2025 to August 31, 2026.
|
| Shareholder Report Annual or Semi-Annual |
Annual Shareholder Report
|
| Additional Information [Text Block] |
You can find additional information about the fund at www.morganstanley.com/wealth-investmentsolutions/cgcm. You can also request this information by contacting us at 1-800-869-3326
|
| Material Fund Change Notice [Text Block] |
This report describes changes to the Fund that occurred during the reporting period.
|
| Additional Information Phone Number |
1-800-869-3326
|
| Additional Information Website |
www.morganstanley.com/wealth-investmentsolutions/cgcm
|
| Expenses [Text Block] |
What were the Fund costs for the last year?(based on hypothetical $10,000 investment)
Table Summary
Fund name |
Cost of a $10,000 investment |
Cost paid as a % of a $10,000 investment |
Morgan Stanley Pathway Small-Mid Cap Equity ETF |
$69 |
0.62% | |
| Expenses Paid, Amount |
$ 69
|
| Expense Ratio, Percent |
0.62%
|
| Factors Affecting Performance [Text Block] |
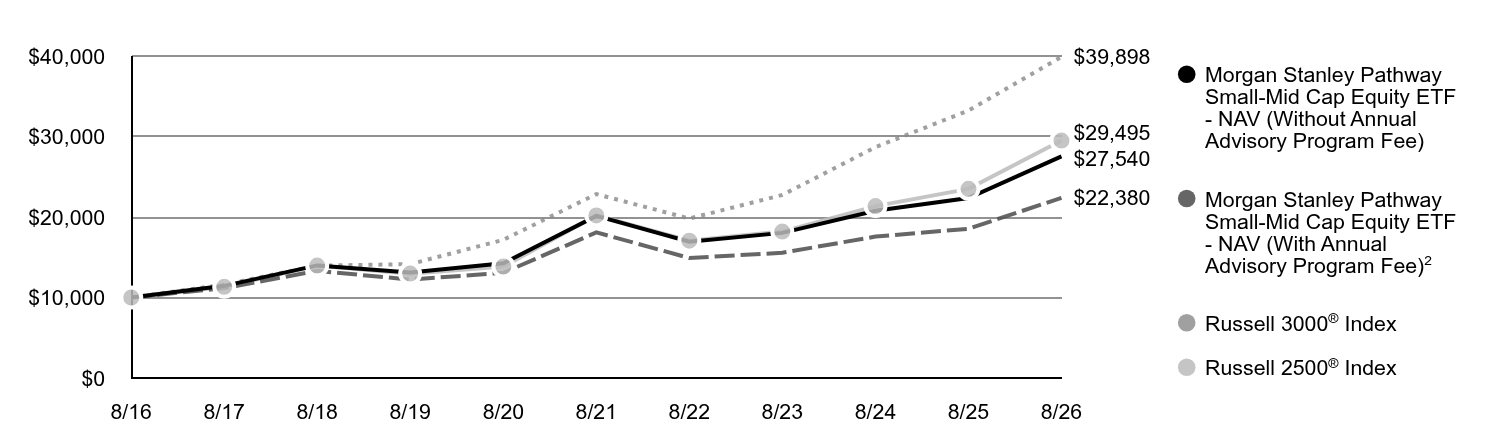
How did the fund perform last year?Key contributors to and detractors from performance relative to the Russell 2500® Index: Contributors: The fund’s underweight allocation to real estate contributed positively to relative performance during the period, as the sector lagged the broader benchmark. Positioning within the sector provided an additional benefit, with the fund’s individual real estate holdings outperforming their benchmark counterparts. Together, the lower allocation and favorable security selection made real estate a meaningful contributor to relative returns. Positioning within the industrials sector also contributed positively to relative performance during the period. Electrical equipment was the primary driver, as favorable stock selection and exposure to stronger-performing companies within this subsector added to the fund’s performance.
Detractors: Positioning within the health care sector detracted from relative performance during the period, primarily due to stock selection within biotechnology. Although the biotechnology industry generated strong absolute gains, the fund’s holdings did not keep pace with the strongest-performing benchmark constituents. As a result, the portfolio captured less of the industry’s advance, creating a headwind to relative returns. Positioning within the information technology sector also weighed on relative performance during the period. Although the fund’s overweight allocation to the sector contributed positively, that benefit was more than offset by unfavorable stock selection, particularly within communications equipment. Holdings in that subsector lagged their benchmark counterparts, limiting participation in stronger-performing technology names and creating a net headwind to relative returns.
|
| Performance Past Does Not Indicate Future [Text] |
THE FUND'S PAST PERFORMANCE IS NO GUARANTEE OF FUTURE RESULTS.
|
| Line Graph [Table Text Block] |
Table Summary
|
Morgan Stanley Pathway Small-Mid Cap Equity ETF - NAV (Without Annual Advisory Program Fee) |
Morgan Stanley Pathway Small-Mid Cap Equity ETF - NAV (With Annual Advisory Program FeeFootnote Reference2) |
Russell 3000® Index |
Russell 2500® Index |
8/16 |
$10,000 |
$10,000 |
$10,000 |
$10,000 |
8/17 |
$11,449 |
$11,166 |
$11,606 |
$11,322 |
8/18 |
$13,987 |
$13,309 |
$13,956 |
$13,964 |
8/19 |
$13,113 |
$12,231 |
$14,139 |
$12,966 |
8/20 |
$14,264 |
$13,066 |
$17,171 |
$13,847 |
8/21 |
$20,132 |
$18,086 |
$22,845 |
$20,198 |
8/22 |
$16,932 |
$14,905 |
$19,810 |
$17,058 |
8/23 |
$18,028 |
$15,557 |
$22,734 |
$18,191 |
8/24 |
$20,766 |
$17,564 |
$28,677 |
$21,351 |
8/25 |
$22,360 |
$18,537 |
$33,220 |
$23,494 |
8/26 |
$27,540 |
$22,380 |
$39,898 |
$29,495 |
|
| Average Annual Return [Table Text Block] |
Table Summary
|
1 Year |
5 Years |
10 Years |
Morgan Stanley Pathway Small-Mid Cap Equity ETF - NAV (Without Annual Advisory Program Fee) |
23.17% |
6.47% |
10.66% |
Morgan Stanley Pathway Small-Mid Cap Equity ETF - NAV (With Annual Advisory Program Fee)Footnote Reference2 |
20.73% |
4.36% |
8.20% |
Russell 3000® Index |
20.10% |
11.80% |
14.84% |
Russell 2500® Index |
25.54% |
7.87% |
11.42% | |
| No Deduction of Taxes [Text Block] |
Performance does not reflect the deduction of taxes that a shareholder would pay on Fund distributions or redemption of Fund shares
|
| AssetsNet |
$ 712,749,276
|
| Holdings Count | Holding |
1,839
|
| Advisory Fees Paid, Amount |
$ 3,486,857
|
| InvestmentCompanyPortfolioTurnover |
53.00%
|
| Additional Fund Statistics [Text Block] |
Table Summary
Total Net Assets |
$712,749,276 |
# of Portfolio Holdings |
1,839 |
Portfolio Turnover Rate |
53% |
Advisory Fees Paid |
$3,486,857 | |
| Holdings [Text Block] |
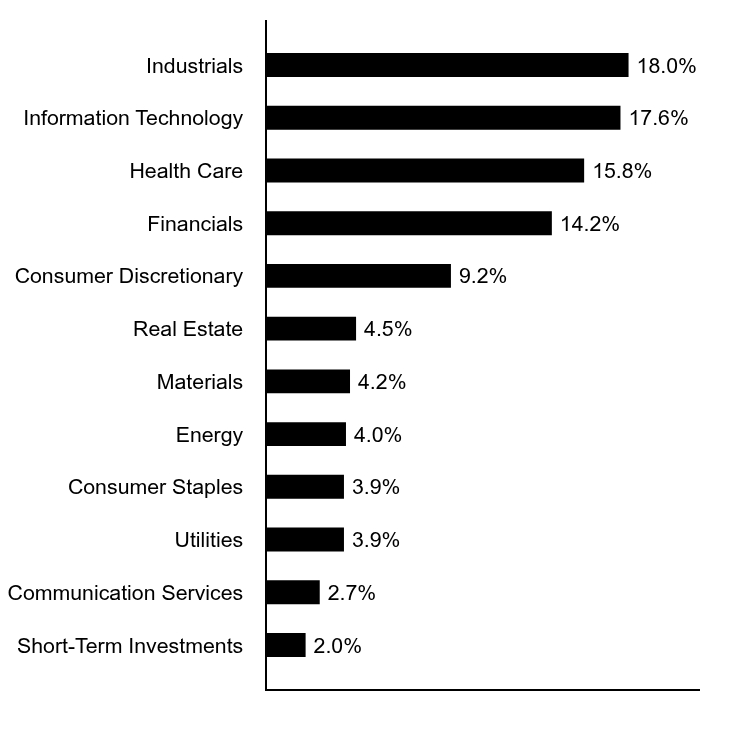
Sector Allocation (% of Investments)
Table Summary
Value |
Value |
Short-Term Investments |
2.0% |
Communication Services |
2.7% |
Utilities |
3.9% |
Consumer Staples |
3.9% |
Energy |
4.0% |
Materials |
4.2% |
Real Estate |
4.5% |
Consumer Discretionary |
9.2% |
Financials |
14.2% |
Health Care |
15.8% |
Information Technology |
17.6% |
Industrials |
18.0% | |
| Largest Holdings [Text Block] |
Top Ten Holdings (% of Investments)Footnote Referencea
Table Summary
Ascendis Pharma AS, ADR |
0.9% |
Dynatrace Inc. |
0.8% |
TechnipFMC PLC |
0.7% |
ViaSat Inc. |
0.6% |
KBR Inc. |
0.6% |
Regal Rexnord Corp. |
0.6% |
Avient Corp. |
0.5% |
IMAX Corp. |
0.5% |
Sprouts Farmers Market Inc. |
0.5% |
Veeco Instruments Inc. |
0.5% |
Total |
6.2% |
| Footnote |
Description |
Footnotea |
Excludes cash equivalents. | |
| Material Fund Change [Text Block] |
This is a summary of certain changes to the Fund since August 31, 2025. For more complete information, you may review the Fund’s next prospectus, which we expect to be available by January 1, 2027 at www.morganstanley.com/wealth-investmentsolutions/cgcm or upon request by contacting us at 1-800-869-3326. Effective March 23, 2026, Blackrock Financial Management, Inc. is no longer an investment sub-adviser of the Fund and O’Shaughnessy Asset Management, LLC commenced as a new investment sub-adviser of the Fund. Consulting Group Advisory Services, LLC continues to serve as the adviser of the Fund. |
| C000023143 |
|
| Shareholder Report [Line Items] |
|
| Fund Name |
International Equity Fund
|
| Trading Symbol |
TIEUX
|
| Annual or Semi-Annual Statement [Text Block] |
This annual shareholder report contains important information about Morgan Stanley Pathway Funds - International Equity Fund for the period of September 1, 2025 to August 31, 2026.
|
| Shareholder Report Annual or Semi-Annual |
Annual Shareholder Report
|
| Additional Information [Text Block] |
You can find additional information about the fund at www.morganstanley.com/wealth-investmentsolutions/cgcm. You can also request this information by contacting us at 1-800-869-3326
|
| Material Fund Change Notice [Text Block] |
This report describes changes to the Fund that occurred during the reporting period.
|
| Additional Information Phone Number |
1-800-869-3326
|
| Additional Information Website |
www.morganstanley.com/wealth-investmentsolutions/cgcm
|
| Expenses [Text Block] |
What were the Fund costs for the last year?(based on hypothetical $10,000 investment)
Table Summary
Fund name |
Cost of a $10,000 investment |
Cost paid as a % of a $10,000 investment |
International Equity Fund |
$66 |
0.60% | |
| Expenses Paid, Amount |
$ 66
|
| Expense Ratio, Percent |
0.60%
|
| Factors Affecting Performance [Text Block] |
How did the fund perform last year?Key contributors to and detractors from performance relative to MSCI EAFE® Index (Net): Contributors: The fund’s overweight allocation to information technology contributed positively to relative performance during the period, as the sector was among the strongest-performing areas of the market. Favorable stock selection within technology hardware provided an additional benefit, with the fund’s holdings outperforming their benchmark counterparts. Positioning within the industrials sector provided an additional positive contribution to relative performance during the period. Capital goods were the primary driver, as the fund’s holdings outperformed both their benchmark counterparts within the subsector and the broader industrials sector.
Detractors: The fund’s overweight allocation to consumer discretionary detracted from relative performance during the period, as the sector underperformed the broader benchmark. Unfavorable stock selection compounded the allocation effect, particularly within consumer services and consumer durables & apparel, where the fund’s holdings lagged their benchmark counterparts. Together, the larger sector exposure and weaker security selection detracted from relative returns. The fund’s overweight allocation to health care detracted from relative performance during the period, as the sector lagged the broader benchmark. Unfavorable stock selection within biotechnology and pharmaceuticals created an additional headwind, with the fund’s holdings in these industries underperforming their benchmark counterparts. Together, the larger sector exposure and weaker security selection negatively impacted relative returns.
|
| Performance Past Does Not Indicate Future [Text] |
THE FUND'S PAST PERFORMANCE IS NO GUARANTEE OF FUTURE RESULTS.
|
| Average Annual Return [Table Text Block] |
Table Summary
|
1 Year |
5 Years |
10 Years |
International Equity Fund (Without Annual Advisory Program Fee) |
20.27% |
8.73% |
9.29% |
International Equity Fund (With Annual Advisory Program Fee)Footnote Reference1 |
17.88% |
6.57% |
6.86% |
MSCI EAFE® Index (Net) |
21.62% |
9.35% |
9.54% | |
| No Deduction of Taxes [Text Block] |
Performance does not reflect the deduction of taxes that a shareholder would pay on Fund distributions or redemption of Fund shares
|
| AssetsNet |
$ 1,377,853,026
|
| Holdings Count | Holding |
955
|
| Advisory Fees Paid, Amount |
$ 6,028,567
|
| InvestmentCompanyPortfolioTurnover |
40.00%
|
| Additional Fund Statistics [Text Block] |
Table Summary
Total Net Assets |
$1,377,853,026 |
# of Portfolio Holdings |
955 |
Portfolio Turnover Rate |
40% |
Advisory Fees Paid |
$6,028,567 | |
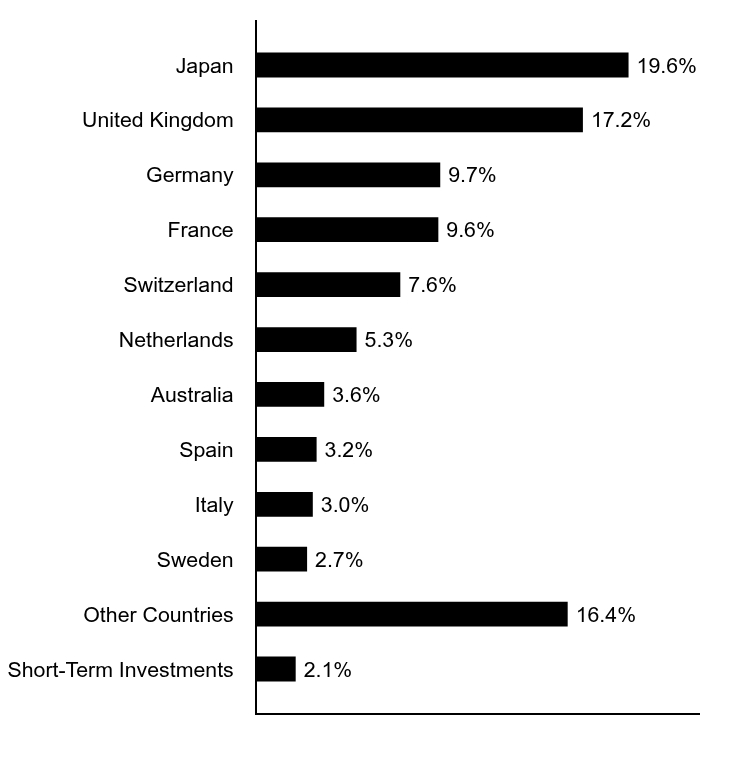
| Holdings [Text Block] |
Country Allocation (% of Investments)
Table Summary
Value |
Value |
Short-Term Investments |
2.1% |
Other Countries |
16.4% |
Sweden |
2.7% |
Italy |
3.0% |
Spain |
3.2% |
Australia |
3.6% |
Netherlands |
5.3% |
Switzerland |
7.6% |
France |
9.6% |
Germany |
9.7% |
United Kingdom |
17.2% |
Japan |
19.6% | |
| Largest Holdings [Text Block] |
Top Ten Holdings (% of Investments)Footnote Referencea
Table Summary
ASML Holding NV |
2.1% |
SAP SE |
1.7% |
Roche Holding AG |
1.6% |
AstraZeneca PLC |
1.5% |
Siemens AG, Class Registered Shares |
1.4% |
Rolls-Royce Holdings PLC |
1.1% |
Kering SA |
1.1% |
Sumitomo Mitsui Financial Group Inc. |
1.0% |
LVMH Moët Hennessy Louis Vuitton SE |
0.9% |
Reckitt Benckiser Group PLC |
0.9% |
Total |
13.3% |
| Footnote |
Description |
Footnotea |
Excludes cash equivalents. | |
| Material Fund Change [Text Block] |
This is a summary of certain changes to the Fund since August 31, 2025. For more complete information, you may review the Fund’s next prospectus, which we expect to be available by January 1, 2027 at www.morganstanley.com/wealth-investmentsolutions/cgcm or upon request by contacting us at 1-800-869-3326. Effective May 7, 2026, Blackrock Financial Management, Inc. is no longer an investment sub-adviser of the Fund and O’Shaughnessy Asset Management, LLC commenced as a new investment sub-adviser of the Fund. Effective August 19, 2026, Walter Scott & Partners Limited is no longer an investment sub-adviser of the Fund. Consulting Group Advisory Services, LLC continues to serve as the adviser of the Fund. |
| C000023144 |
|
| Shareholder Report [Line Items] |
|
| Fund Name |
Emerging Markets Equity Fund
|
| Trading Symbol |
TEMUX
|
| Annual or Semi-Annual Statement [Text Block] |
This annual shareholder report contains important information about Morgan Stanley Pathway Funds - Emerging Markets Equity Fund for the period of September 1, 2025 to August 31, 2026.
|
| Shareholder Report Annual or Semi-Annual |
Annual Shareholder Report
|
| Additional Information [Text Block] |
You can find additional information about the fund at www.morganstanley.com/wealth-investmentsolutions/cgcm. You can also request this information by contacting us at 1-800-869-3326
|
| Material Fund Change Notice [Text Block] |
This report describes changes to the Fund that occurred during the reporting period.
|
| Additional Information Phone Number |
1-800-869-3326
|
| Additional Information Website |
www.morganstanley.com/wealth-investmentsolutions/cgcm
|
| Expenses [Text Block] |
What were the Fund costs for the last year?(based on hypothetical $10,000 investment)
Table Summary
Fund name |
Cost of a $10,000 investment |
Cost paid as a % of a $10,000 investment |
Emerging Markets Equity Fund |
$90 |
0.75% | |
| Expenses Paid, Amount |
$ 90
|
| Expense Ratio, Percent |
0.75%
|
| Factors Affecting Performance [Text Block] |
How did the fund perform last year?Key contributors to and detractors from performance relative to MSCI Emerging Markets Index (Net): Contributors: The fund’s positioning within information technology contributed positively to relative performance during the period. Security selection was particularly favorable within semiconductors and technology hardware, where portfolio holdings participated in the strong appreciation across both subsectors. In addition, the fund’s slight overweight allocation to information technology enhanced relative returns, as the sector ranked among the strongest-performing areas of the market. The underweight allocation to communication services contributed positively to relative performance, as the sector underperformed the broader benchmark during the period. Within the sector, an underweight allocation to media and entertainment also generated a positive allocation effect, reflecting the subsector’s relative underperformance.
Detractors: The overweight allocation to consumer discretionary detracted from relative performance, as the sector underperformed the broader benchmark during the period. Within the sector, unfavorable security selection in broadline retail generated an additional negative selection effect, as the fund’s holdings underperformed their benchmark counterparts. Positioning within the materials sector detracted from relative performance during the period. Despite the sector’s strong absolute return, unfavorable security selection within the chemicals subsector and construction materials generated a negative selection effect, as the fund’s holdings underperformed their benchmark counterparts.
|
| Performance Past Does Not Indicate Future [Text] |
THE FUND'S PAST PERFORMANCE IS NO GUARANTEE OF FUTURE RESULTS.
|
| Average Annual Return [Table Text Block] |
Table Summary
|
1 Year |
5 Years |
10 Years |
Emerging Markets Equity Fund (Without Annual Advisory Program Fee) |
39.65% |
7.22% |
8.03% |
Emerging Markets Equity Fund (With Annual Advisory Program Fee)Footnote Reference1 |
36.89% |
5.09% |
5.63% |
MSCI Emerging Markets Index (Net) |
39.25% |
8.18% |
9.29% | |
| No Deduction of Taxes [Text Block] |
Performance does not reflect the deduction of taxes that a shareholder would pay on Fund distributions or redemption of Fund shares
|
| AssetsNet |
$ 826,403,208
|
| Holdings Count | Holding |
1,075
|
| Advisory Fees Paid, Amount |
$ 4,249,985
|
| InvestmentCompanyPortfolioTurnover |
31.00%
|
| Additional Fund Statistics [Text Block] |
Table Summary
Total Net Assets |
$826,403,208 |
# of Portfolio Holdings |
1,075 |
Portfolio Turnover Rate |
31% |
Advisory Fees Paid |
$4,249,985 | |
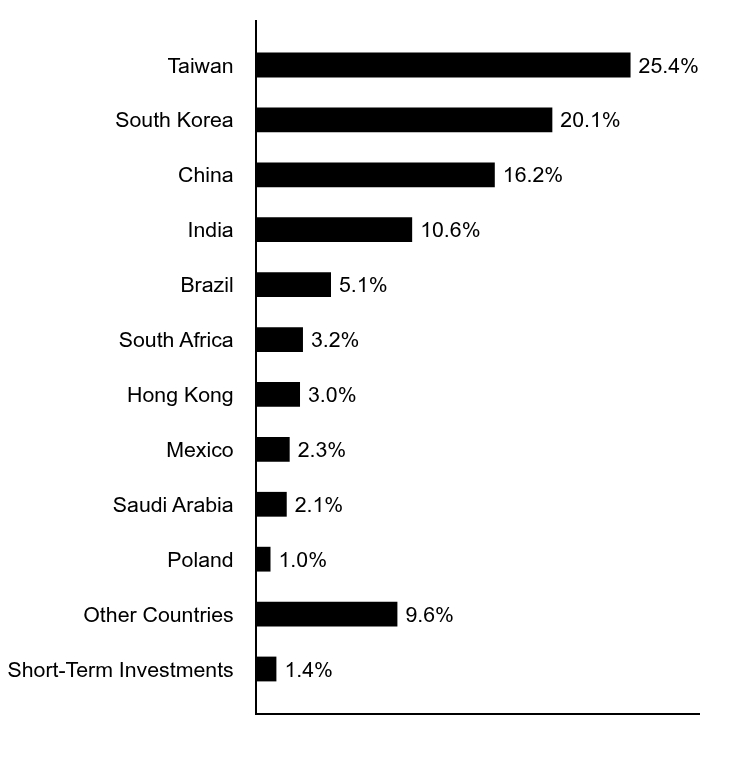
| Holdings [Text Block] |
Country Allocation (% of Investments)
Table Summary
Value |
Value |
Short-Term Investments |
1.4% |
Other Countries |
9.6% |
Poland |
1.0% |
Saudi Arabia |
2.1% |
Mexico |
2.3% |
Hong Kong |
3.0% |
South Africa |
3.2% |
Brazil |
5.1% |
India |
10.6% |
China |
16.2% |
South Korea |
20.1% |
Taiwan |
25.4% | |
| Largest Holdings [Text Block] |
Top Ten Holdings (% of Investments)Footnote Referencea
Table Summary
Taiwan Semiconductor Manufacturing Co., Ltd. |
13.4% |
Samsung Electronics Co., Ltd. |
6.4% |
SK hynix Inc. |
5.9% |
Tencent Holdings Ltd. |
3.4% |
MediaTek Inc. |
1.8% |
Delta Electronics Inc. |
1.4% |
Alibaba Group Holding Ltd. |
1.3% |
Samsung Electronics Co., Ltd., Class Preferred Shares |
1.3% |
Shinhan Financial Group Co., Ltd. |
1.2% |
Taiwan Semiconductor Manufacturing Co., Ltd., ADR |
1.1% |
Total |
37.2% |
| Footnote |
Description |
Footnotea |
Excludes cash equivalents. | |
| Material Fund Change [Text Block] |
This is a summary of certain changes to the Fund since August 31, 2025. For more complete information, you may review the Fund’s next prospectus, which we expect to be available by January 1, 2027 at www.morganstanley.com/wealth-investmentsolutions/cgcm or upon request by contacting us at 1-800-869-3326. Effective May 7, 2026, Blackrock Financial Management, Inc. is no longer an investment sub-adviser of the Fund and O’Shaughnessy Asset Management, LLC commenced as a new investment sub-adviser of the Fund. Effective September 21, 2026, Van Eck Associates Corporation is no longer an investment sub-adviser of the Fund and PanAgora Asset Management, Inc. commenced as a new investment sub-adviser of the Fund. Consulting Group Advisory Services, LLC continues to serve as the adviser of the Fund. |
| C000023145 |
|
| Shareholder Report [Line Items] |
|
| Fund Name |
Core Fixed Income Fund
|
| Trading Symbol |
TIIUX
|
| Annual or Semi-Annual Statement [Text Block] |
This annual shareholder report contains important information about Morgan Stanley Pathway Funds - Core Fixed Income Fund for the period of September 1, 2025 to August 31, 2026.
|
| Shareholder Report Annual or Semi-Annual |
Annual Shareholder Report
|
| Additional Information [Text Block] |
You can find additional information about the fund at www.morganstanley.com/wealth-investmentsolutions/cgcm. You can also request this information by contacting us at 1-800-869-3326
|
| Additional Information Phone Number |
1-800-869-3326
|
| Additional Information Website |
www.morganstanley.com/wealth-investmentsolutions/cgcm
|
| Expenses [Text Block] |
What were the Fund costs for the last year?(based on hypothetical $10,000 investment)
Table Summary
Fund name |
Cost of a $10,000 investment |
Cost paid as a % of a $10,000 investment |
Core Fixed Income Fund |
$45 |
0.45% | |
| Expenses Paid, Amount |
$ 45
|
| Expense Ratio, Percent |
0.45%
|
| Factors Affecting Performance [Text Block] |
How did the fund perform last year?Key contributors to and detractors from performance relative to the Bloomberg U.S. Aggregate Bond™ Index: Contributors: Credit-quality allocation enhanced relative performance by emphasizing segments of the market that generated stronger returns than the benchmark during the period. Exposure to premium mortgage-backed securities further supported relative performance, as these higher-coupon holdings delivered favorable income and return characteristics relative to the benchmark.
Detractors:
|
| Performance Past Does Not Indicate Future [Text] |
THE FUND'S PAST PERFORMANCE IS NO GUARANTEE OF FUTURE RESULTS.
|
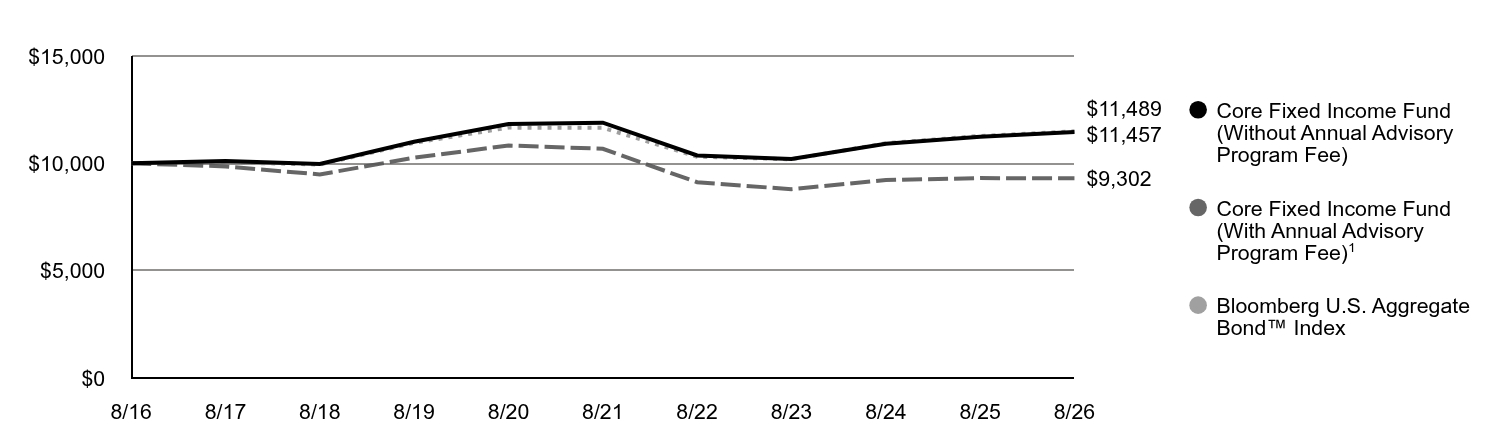
| Line Graph [Table Text Block] |
Table Summary
|
Core Fixed Income Fund (Without Annual Advisory Program Fee) |
Core Fixed Income Fund (With Annual Advisory Program FeeFootnote Reference1) |
Bloomberg U.S. Aggregate Bond™ Index |
8/16 |
$10,000 |
$10,000 |
$10,000 |
8/17 |
$10,107 |
$9,857 |
$10,049 |
8/18 |
$9,971 |
$9,482 |
$9,944 |
8/19 |
$11,006 |
$10,260 |
$10,955 |
8/20 |
$11,827 |
$10,831 |
$11,664 |
8/21 |
$11,896 |
$10,678 |
$11,654 |
8/22 |
$10,367 |
$9,119 |
$10,312 |
8/23 |
$10,201 |
$8,795 |
$10,189 |
8/24 |
$10,912 |
$9,221 |
$10,933 |
8/25 |
$11,242 |
$9,312 |
$11,276 |
8/26 |
$11,457 |
$9,302 |
$11,489 |
|
| Average Annual Return [Table Text Block] |
Table Summary
|
1 Year |
5 Years |
10 Years |
Core Fixed Income Fund (Without Annual Advisory Program Fee) |
1.91% |
-0.75% |
1.37% |
Core Fixed Income Fund (With Annual Advisory Program Fee)Footnote Reference1 |
-0.10% |
-2.71% |
-0.89% |
Bloomberg U.S. Aggregate Bond™ Index |
1.89% |
-0.29% |
1.40% | |
| No Deduction of Taxes [Text Block] |
Performance does not reflect the deduction of taxes that a shareholder would pay on Fund distributions or redemption of Fund shares
|
| AssetsNet |
$ 2,018,369,502
|
| Holdings Count | Holding |
3,729
|
| Advisory Fees Paid, Amount |
$ 5,802,359
|
| InvestmentCompanyPortfolioTurnover |
92.00%
|
| Additional Fund Statistics [Text Block] |
Table Summary
Total Net Assets |
$2,018,369,502 |
# of Portfolio Holdings |
3,729 |
Portfolio Turnover Rate |
92% |
Advisory Fees Paid |
$5,802,359 | |
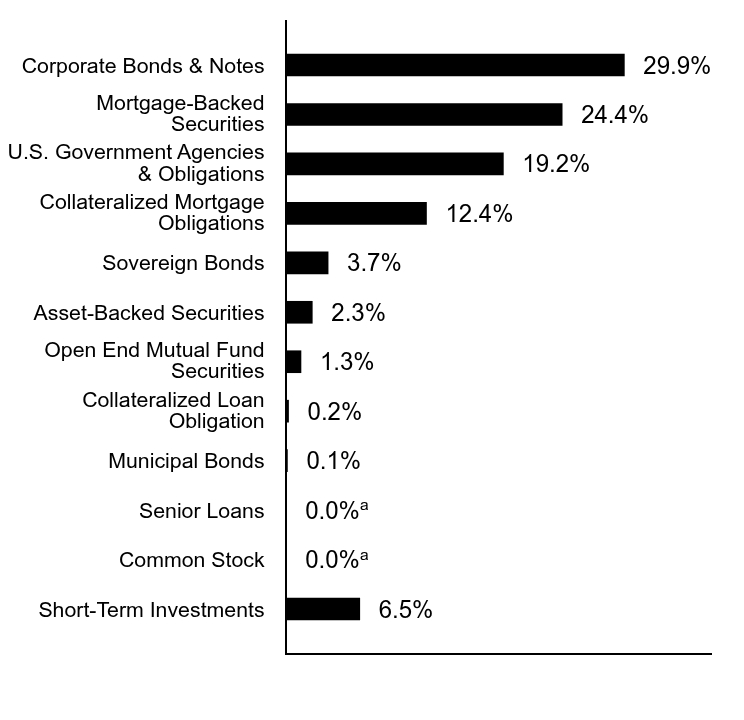
| Holdings [Text Block] |
Asset Allocation (% of Investments)
Table Summary
Value |
Value |
Short-Term Investments |
6.5% |
Common Stock |
0.0%Footnote Referencea |
Senior Loans |
0.0%Footnote Referencea |
Municipal Bonds |
0.1% |
Collateralized Loan Obligation |
0.2% |
Open End Mutual Fund Securities |
1.3% |
Asset-Backed Securities |
2.3% |
Sovereign Bonds |
3.7% |
Collateralized Mortgage Obligations |
12.4% |
U.S. Government Agencies & Obligations |
19.2% |
Mortgage-Backed Securities |
24.4% |
Corporate Bonds & Notes |
29.9% |
| Footnote |
Description |
Footnotea |
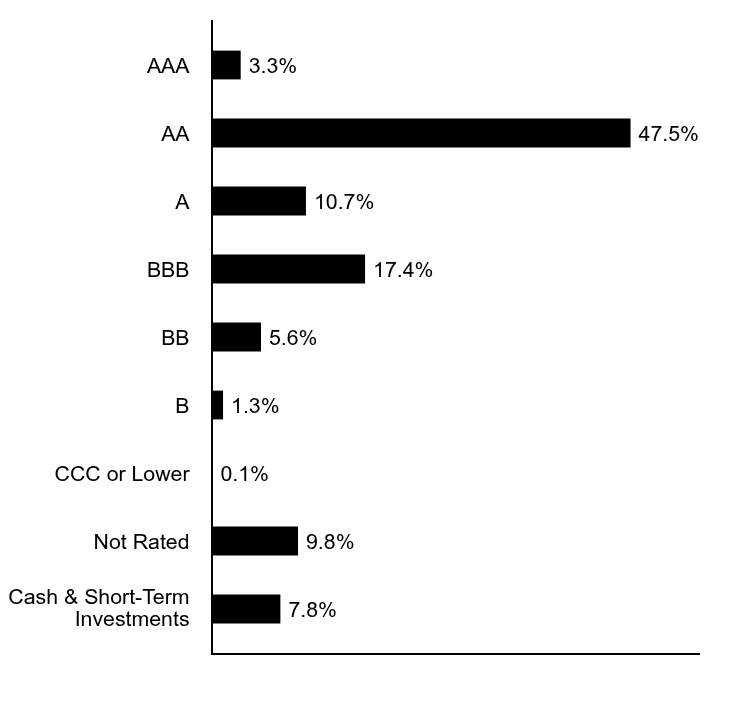
Less than 0.05%. | Credit Quality Allocation (% of net assets)Footnote Reference*
Table Summary
Value |
Value |
Cash & Short-Term Investments |
7.8% |
Not Rated |
9.8% |
CCC or Lower |
0.1% |
B |
1.3% |
BB |
5.6% |
BBB |
17.4% |
A |
10.7% |
AA |
47.5% |
AAA |
3.3% |
| Footnote |
Description |
Footnote* |
Security ratings disclosed with the exception for those labeled "not rated" is an aggregation of the highest security level rating amongst Standard & Poor's Ratings Service ("S&P"), Moody's Investors Services ("Moody's") and Fitch Ratings Service ("Fitch"), each a Nationally Recognized Statistical Ratings Organization ("NRSRO"). These rating agencies are independent, nationally recognized statistical rating organizations and are widely used. | |
| Material Fund Change Adviser [Text Block] |
There were no material changes to the Fund. |
| C000023146 |
|
| Shareholder Report [Line Items] |
|
| Fund Name |
High Yield Fund
|
| Trading Symbol |
THYUX
|
| Annual or Semi-Annual Statement [Text Block] |
This annual shareholder report contains important information about Morgan Stanley Pathway Funds - High Yield Fund for the period of September 1, 2025 to August 31, 2026.
|
| Shareholder Report Annual or Semi-Annual |
Annual Shareholder Report
|
| Additional Information [Text Block] |
You can find additional information about the fund at www.morganstanley.com/wealth-investmentsolutions/cgcm. You can also request this information by contacting us at 1-800-869-3326
|
| Additional Information Phone Number |
1-800-869-3326
|
| Additional Information Website |
www.morganstanley.com/wealth-investmentsolutions/cgcm
|
| Expenses [Text Block] |
What were the Fund costs for the last year?(based on hypothetical $10,000 investment)
Table Summary
Fund name |
Cost of a $10,000 investment |
Cost paid as a % of a $10,000 investment |
High Yield Fund |
$76 |
0.75% | |
| Expenses Paid, Amount |
$ 76
|
| Expense Ratio, Percent |
0.75%
|
| Factors Affecting Performance [Text Block] |
How did the fund perform last year?Key contributors to and detractors from performance relative to the Bloomberg U.S. Corporate High Yield Bond Index: Contributors: Security selection within the basic industry, consumer cyclical and technology sectors contributed positively to relative performance. Sector allocation also enhanced relative performance, with the overweight position in energy and underweight allocation to capital goods both contributing favorably.
Detractors: Security selection within the communications and REIT sectors detracted from relative performance during the period. The underweight allocation to the consumer non-cyclicals sector also weighed on relative performance during the period.
|
| Performance Past Does Not Indicate Future [Text] |
THE FUND'S PAST PERFORMANCE IS NO GUARANTEE OF FUTURE RESULTS.
|
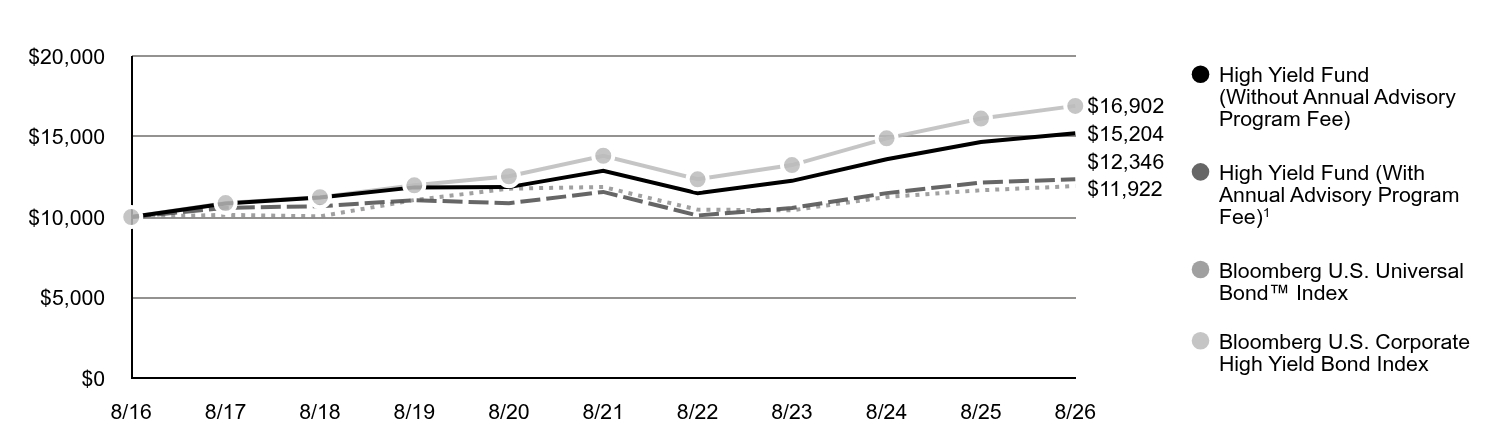
| Line Graph [Table Text Block] |
Table Summary
|
High Yield Fund (Without Annual Advisory Program Fee) |
High Yield Fund (With Annual Advisory Program FeeFootnote Reference1) |
Bloomberg U.S. Universal Bond™ Index |
Bloomberg U.S. Corporate High Yield Bond Index |
8/16 |
$10,000 |
$10,000 |
$10,000 |
$10,000 |
8/17 |
$10,838 |
$10,572 |
$10,134 |
$10,863 |
8/18 |
$11,214 |
$10,670 |
$10,040 |
$11,232 |
8/19 |
$11,840 |
$11,044 |
$11,052 |
$11,969 |
8/20 |
$11,856 |
$10,855 |
$11,761 |
$12,532 |
8/21 |
$12,876 |
$11,557 |
$11,865 |
$13,804 |
8/22 |
$11,476 |
$10,094 |
$10,458 |
$12,341 |
8/23 |
$12,245 |
$10,559 |
$10,417 |
$13,225 |
8/24 |
$13,588 |
$11,484 |
$11,243 |
$14,885 |
8/25 |
$14,655 |
$12,141 |
$11,661 |
$16,115 |
8/26 |
$15,204 |
$12,346 |
$11,922 |
$16,902 |
|
| Average Annual Return [Table Text Block] |
Table Summary
|
1 Year |
5 Years |
10 Years |
High Yield Fund (Without Annual Advisory Program Fee) |
3.74% |
3.38% |
4.28% |
High Yield Fund (With Annual Advisory Program Fee)Footnote Reference1 |
1.69% |
1.33% |
1.96% |
Bloomberg U.S. Universal Bond™ Index |
2.23% |
0.10% |
1.77% |
Bloomberg U.S. Corporate High Yield Bond Index |
4.88% |
4.13% |
5.39% | |
| No Deduction of Taxes [Text Block] |
Performance does not reflect the deduction of taxes that a shareholder would pay on Fund distributions or redemption of Fund shares
|
| AssetsNet |
$ 166,663,262
|
| Holdings Count | Holding |
290
|
| Advisory Fees Paid, Amount |
$ 764,452
|
| InvestmentCompanyPortfolioTurnover |
58.00%
|
| Additional Fund Statistics [Text Block] |
Table Summary
Total Net Assets |
$166,663,262 |
# of Portfolio Holdings |
290 |
Portfolio Turnover Rate |
58% |
Advisory Fees Paid |
$764,452 | |
| Holdings [Text Block] |
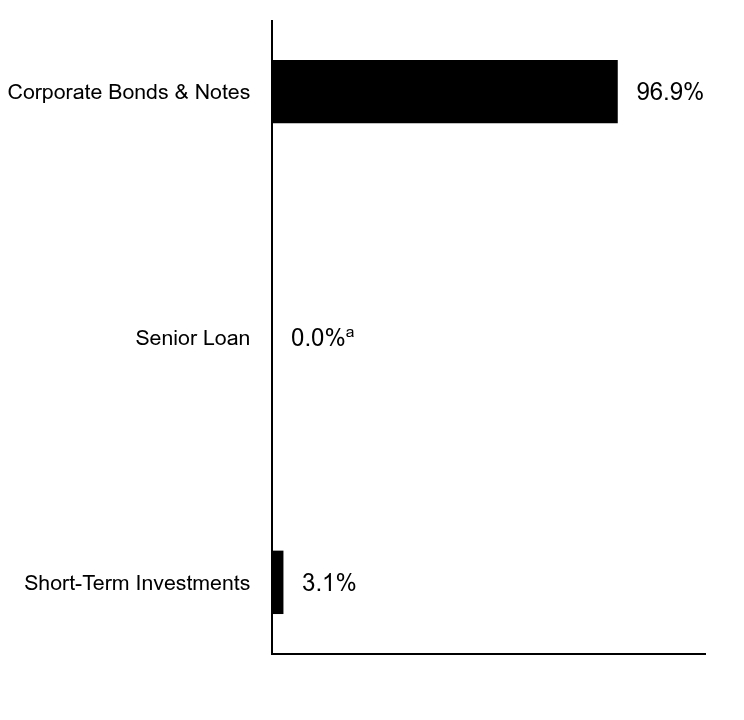
Asset Allocation (% of Investments)
Table Summary
Value |
Value |
Short-Term Investments |
3.1% |
Senior Loan |
0.0%Footnote Referencea |
Corporate Bonds & Notes |
96.9% |
| Footnote |
Description |
Footnotea |
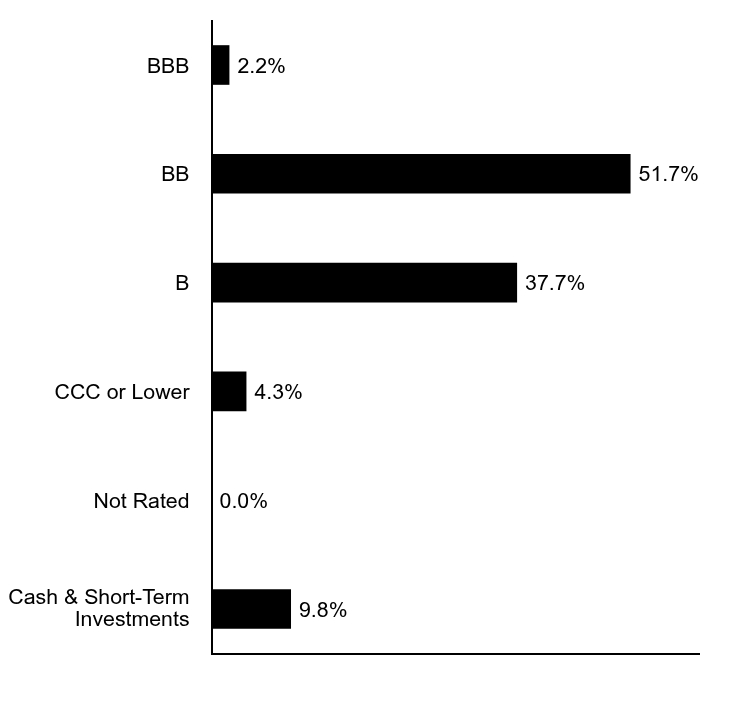
Less than 0.05%. | Credit Quality Allocation (% of net assets)Footnote Reference*
Table Summary
Value |
Value |
Cash & Short-Term Investments |
9.8% |
Not Rated |
0.0% |
CCC or Lower |
4.3% |
B |
37.7% |
BB |
51.7% |
BBB |
2.2% |
| Footnote |
Description |
Footnote* |
Security ratings disclosed with the exception for those labeled "not rated" is an aggregation of the highest security level rating amongst Standard & Poor's Ratings Service ("S&P"), Moody's Investors Services ("Moody's") and Fitch Ratings Service ("Fitch"), each a Nationally Recognized Statistical Ratings Organization ("NRSRO"). These rating agencies are independent, nationally recognized statistical rating organizations and are widely used. | |
| Material Fund Change Adviser [Text Block] |
There were no material changes to the Fund. |
| C000023147 |
|
| Shareholder Report [Line Items] |
|
| Fund Name |
International Fixed Income Fund
|
| Trading Symbol |
TIFUX
|
| Annual or Semi-Annual Statement [Text Block] |
This annual shareholder report contains important information about Morgan Stanley Pathway Funds - International Fixed Income Fund for the period of September 1, 2025 to August 31, 2026.
|
| Shareholder Report Annual or Semi-Annual |
Annual Shareholder Report
|
| Additional Information [Text Block] |
You can find additional information about the fund at www.morganstanley.com/wealth-investmentsolutions/cgcm. You can also request this information by contacting us at 1-800-869-3326
|
| Material Fund Change Notice [Text Block] |
This report describes changes to the Fund that occurred during the reporting period.
|
| Additional Information Phone Number |
1-800-869-3326
|
| Additional Information Website |
www.morganstanley.com/wealth-investmentsolutions/cgcm
|
| Expenses [Text Block] |
What were the Fund costs for the last year?(based on hypothetical $10,000 investment)
Table Summary
Fund name |
Cost of a $10,000 investment |
Cost paid as a % of a $10,000 investment |
International Fixed Income Fund |
$106 |
1.06% | |
| Expenses Paid, Amount |
$ 106
|
| Expense Ratio, Percent |
1.06%
|
| Factors Affecting Performance [Text Block] |
How did the fund perform last year?Key contributors to and detractors from performance relative to the FTSE Non-U.S. WGBI (USD) - Hedged: Contributors: Positioning across select emerging-market interest-rate markets, including South Africa, Singapore, and South Korea, contributed positively to relative performance. Allocations to agency and non-agency mortgage-backed securities, along with collateralized loan obligations, also supported relative performance. Emerging-market currency positions, particularly long exposure to the Brazilian real and Mexican peso, provided an additional contribution to relative returns.
Detractors: Interest-rate positioning across the U.S., euro bloc and U.K. detracted from relative performance. Long exposure to the Japanese yen also weighed on relative performance during the period. Short exposure to the euro and select dollar-bloc currencies, including the Australian dollar, further detracted from relative returns.
|
| Performance Past Does Not Indicate Future [Text] |
THE FUND'S PAST PERFORMANCE IS NO GUARANTEE OF FUTURE RESULTS.
|
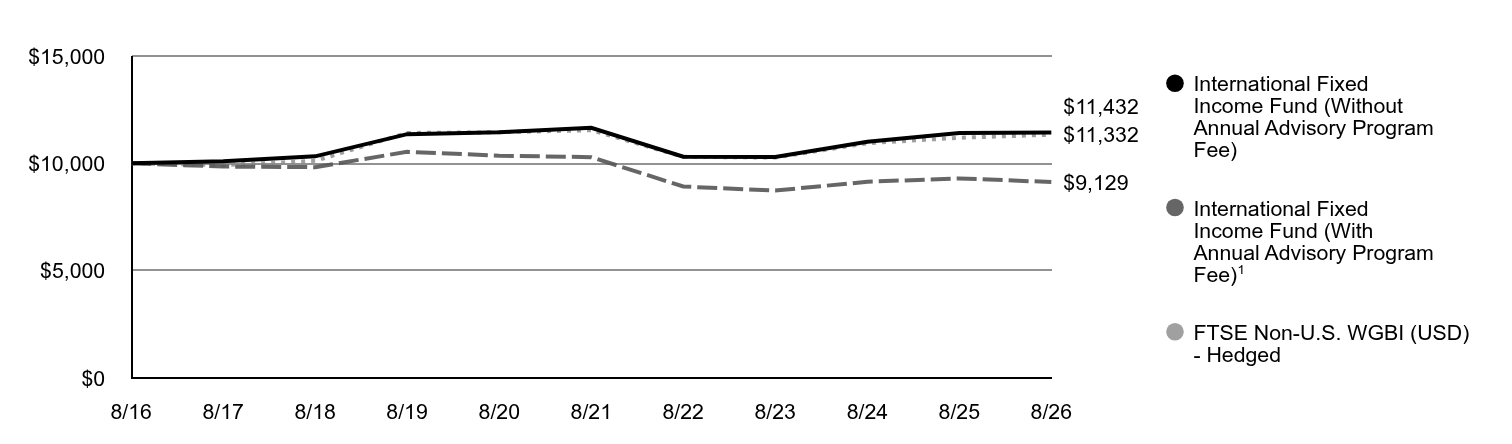
| Line Graph [Table Text Block] |
Table Summary
|
International Fixed Income Fund (Without Annual Advisory Program Fee) |
International Fixed Income Fund (With Annual Advisory Program FeeFootnote Reference1) |
FTSE Non-U.S. WGBI (USD) - Hedged |
8/16 |
$10,000 |
$10,000 |
$10,000 |
8/17 |
$10,098 |
$9,849 |
$9,921 |
8/18 |
$10,326 |
$9,822 |
$10,115 |
8/19 |
$11,359 |
$10,538 |
$11,415 |
8/20 |
$11,445 |
$10,355 |
$11,447 |
8/21 |
$11,657 |
$10,287 |
$11,545 |
8/22 |
$10,312 |
$8,920 |
$10,303 |
8/23 |
$10,296 |
$8,730 |
$10,267 |
8/24 |
$11,001 |
$9,143 |
$10,937 |
8/25 |
$11,413 |
$9,298 |
$11,192 |
8/26 |
$11,432 |
$9,129 |
$11,332 |
|
| Average Annual Return [Table Text Block] |
Table Summary
|
1 Year |
5 Years |
10 Years |
International Fixed Income Fund (Without Annual Advisory Program Fee) |
0.16% |
-0.39% |
1.35% |
International Fixed Income Fund (With Annual Advisory Program Fee)Footnote Reference1 |
-1.82% |
-2.36% |
-0.91% |
FTSE Non-U.S. WGBI (USD) - Hedged |
1.25% |
-0.37% |
1.26% | |
| No Deduction of Taxes [Text Block] |
Performance does not reflect the deduction of taxes that a shareholder would pay on Fund distributions or redemption of Fund shares
|
| AssetsNet |
$ 203,845,785
|
| Holdings Count | Holding |
404
|
| Advisory Fees Paid, Amount |
$ 853,413
|
| InvestmentCompanyPortfolioTurnover |
310.00%
|
| Additional Fund Statistics [Text Block] |
Table Summary
Total Net Assets |
$203,845,785 |
# of Portfolio Holdings |
404 |
Portfolio Turnover Rate |
310% |
Advisory Fees Paid |
$853,413 | |
| Holdings [Text Block] |
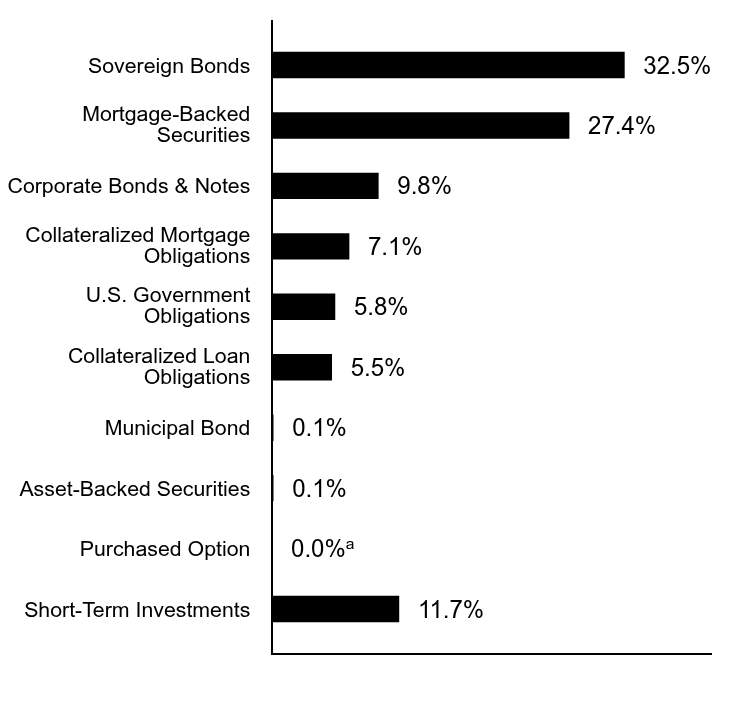
Asset Allocation (% of Investments)
Table Summary
Value |
Value |
Short-Term Investments |
11.7% |
Purchased Option |
0.0%Footnote Referencea |
Asset-Backed Securities |
0.1% |
Municipal Bond |
0.1% |
Collateralized Loan Obligations |
5.5% |
U.S. Government Obligations |
5.8% |
Collateralized Mortgage Obligations |
7.1% |
Corporate Bonds & Notes |
9.8% |
Mortgage-Backed Securities |
27.4% |
Sovereign Bonds |
32.5% |
| Footnote |
Description |
Footnotea |
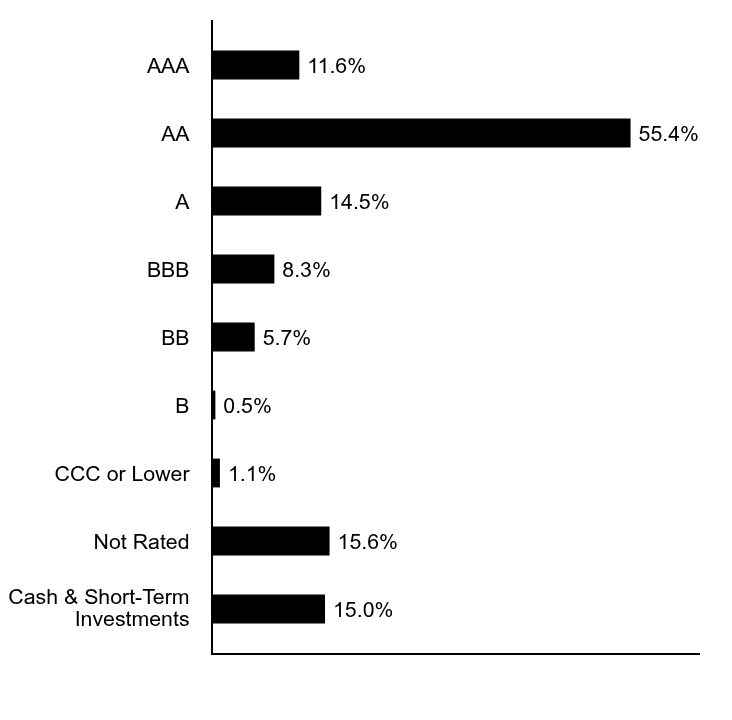
Less than 0.05%. | Credit Quality Allocation (% of net assets)Footnote Reference*
Table Summary
Value |
Value |
Cash & Short-Term Investments |
15.0% |
Not Rated |
15.6% |
CCC or Lower |
1.1% |
B |
0.5% |
BB |
5.7% |
BBB |
8.3% |
A |
14.5% |
AA |
55.4% |
AAA |
11.6% |
| Footnote |
Description |
Footnote* |
Security ratings disclosed with the exception for those labeled "not rated" is an aggregation of the highest security level rating amongst Standard & Poor's Ratings Service ("S&P"), Moody's Investors Services ("Moody's") and Fitch Ratings Service ("Fitch"), each a Nationally Recognized Statistical Ratings Organization ("NRSRO"). These rating agencies are independent, nationally recognized statistical rating organizations and are widely used. | |
| Material Fund Change Adviser [Text Block] |
This is a summary of certain changes to the Fund since August 31, 2025. For more complete information, you may review the Fund’s next prospectus, which we expect to be available by January 1, 2027 at www.morganstanley.com/wealth-investmentsolutions/cgcm or upon request by contacting us at 1-800-869-3326. The net expense ratio decreased from the prior fiscal year primarily due to a decrease in expenses related to financing activities. |
| C000023138 |
|
| Shareholder Report [Line Items] |
|
| Fund Name |
Municipal Bond Fund
|
| Trading Symbol |
TMUUX
|
| Annual or Semi-Annual Statement [Text Block] |
This annual shareholder report contains important information about Morgan Stanley Pathway Funds - Municipal Bond Fund for the period of September 1, 2025 to August 31, 2026.
|
| Shareholder Report Annual or Semi-Annual |
Annual Shareholder Report
|
| Additional Information [Text Block] |
You can find additional information about the fund at www.morganstanley.com/wealth-investmentsolutions/cgcm. You can also request this information by contacting us at 1-800-869-3326
|
| Additional Information Phone Number |
1-800-869-3326
|
| Additional Information Website |
www.morganstanley.com/wealth-investmentsolutions/cgcm
|
| Expenses [Text Block] |
What were the Fund costs for the last year?(based on hypothetical $10,000 investment)
Table Summary
Fund name |
Cost of a $10,000 investment |
Cost paid as a % of a $10,000 investment |
Municipal Bond Fund |
$74 |
0.73% | |
| Expenses Paid, Amount |
$ 74
|
| Expense Ratio, Percent |
0.73%
|
| Factors Affecting Performance [Text Block] |
How did the fund perform last year?Key contributors to and detractors from performance relative to the Bloomberg U.S. Municipal Bond™ Index: Contributors: The overweight allocation to 15- to 25-year maturities contributed positively to relative performance. The portfolio’s longer-duration stance provided additional support to relative performance during the period. The overweight position in the utilities sector further enhanced relative returns.
Detractors: The underweight allocation to maturities beyond 25 years detracted from relative performance during the period. The underweight position in BBB-rated credits also weighed on relative returns during the period.
|
| Performance Past Does Not Indicate Future [Text] |
THE FUND'S PAST PERFORMANCE IS NO GUARANTEE OF FUTURE RESULTS.
|
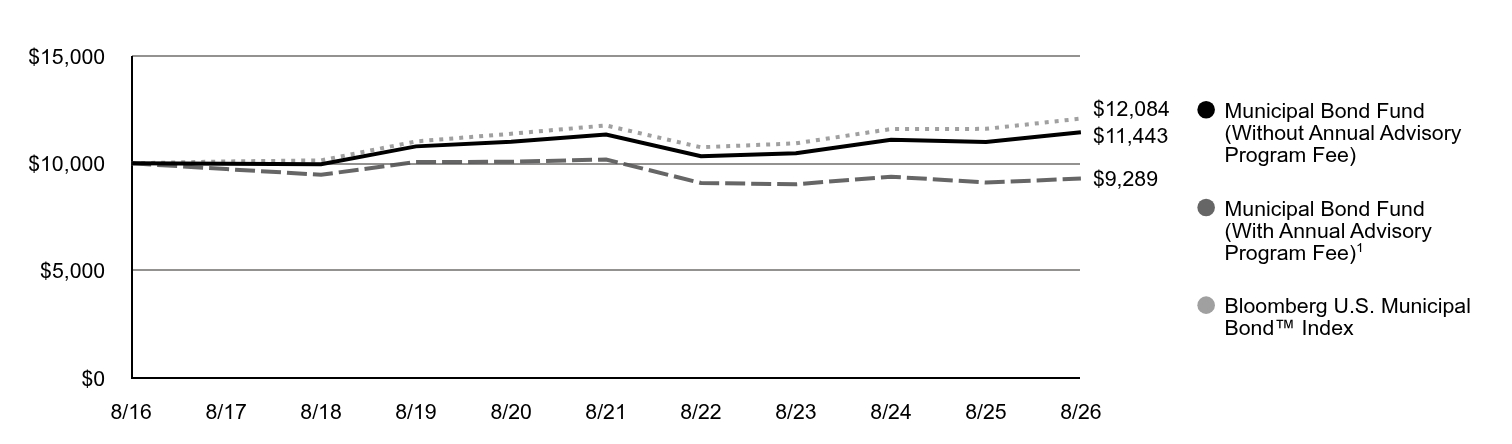
| Line Graph [Table Text Block] |
Table Summary
|
Municipal Bond Fund (Without Annual Advisory Program Fee) |
Municipal Bond Fund (With Annual Advisory Program FeeFootnote Reference1) |
Bloomberg U.S. Municipal Bond™ Index |
8/16 |
$10,000 |
$10,000 |
$10,000 |
8/17 |
$9,978 |
$9,731 |
$10,088 |
8/18 |
$9,956 |
$9,469 |
$10,137 |
8/19 |
$10,790 |
$10,059 |
$11,021 |
8/20 |
$11,005 |
$10,074 |
$11,378 |
8/21 |
$11,343 |
$10,178 |
$11,764 |
8/22 |
$10,332 |
$9,086 |
$10,749 |
8/23 |
$10,472 |
$9,026 |
$10,932 |
8/24 |
$11,102 |
$9,379 |
$11,597 |
8/25 |
$10,997 |
$9,107 |
$11,606 |
8/26 |
$11,443 |
$9,289 |
$12,084 |
|
| Average Annual Return [Table Text Block] |
Table Summary
|
1 Year |
5 Years |
10 Years |
Municipal Bond Fund (Without Annual Advisory Program Fee) |
4.05% |
0.18% |
1.36% |
Municipal Bond Fund (With Annual Advisory Program Fee)Footnote Reference1 |
1.99% |
-1.81% |
-0.90% |
Bloomberg U.S. Municipal Bond™ Index |
4.12% |
0.54% |
1.91% | |
| No Deduction of Taxes [Text Block] |
Performance does not reflect the deduction of taxes that a shareholder would pay on Fund distributions or redemption of Fund shares
|
| AssetsNet |
$ 93,646,702
|
| Holdings Count | Holding |
167
|
| Advisory Fees Paid, Amount |
$ 345,945
|
| InvestmentCompanyPortfolioTurnover |
12.00%
|
| Additional Fund Statistics [Text Block] |
Table Summary
Total Net Assets |
$93,646,702 |
# of Portfolio Holdings |
167 |
Portfolio Turnover Rate |
12% |
Advisory Fees Paid |
$345,945 | |
| Holdings [Text Block] |
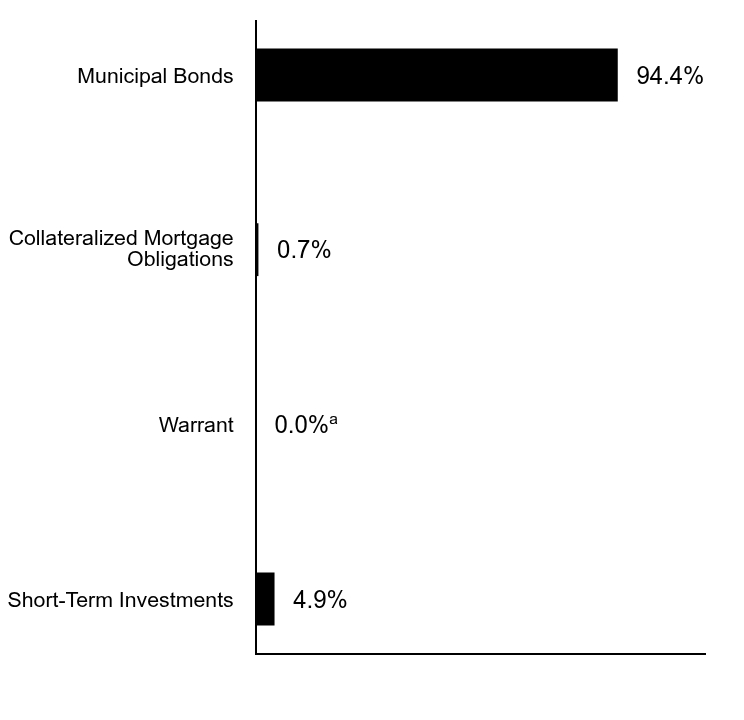
Asset Allocation (% of Investments)
Table Summary
Value |
Value |
Short-Term Investments |
4.9% |
Warrant |
0.0%Footnote Referencea |
Collateralized Mortgage Obligations |
0.7% |
Municipal Bonds |
94.4% |
| Footnote |
Description |
Footnotea |
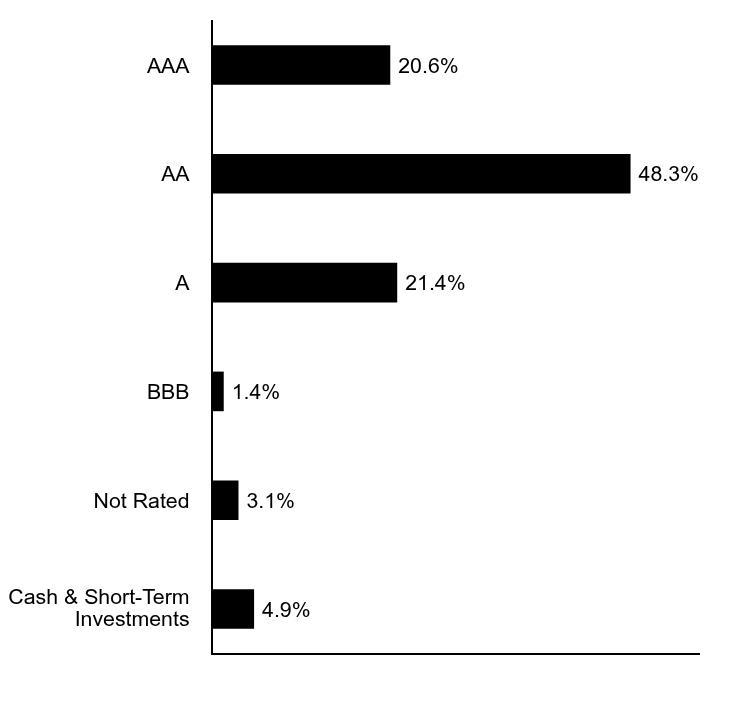
Less than 0.05%. | Credit Quality Allocation (% of net assets)Footnote Reference*
Table Summary
Value |
Value |
Cash & Short-Term Investments |
4.9% |
Not Rated |
3.1% |
BBB |
1.4% |
A |
21.4% |
AA |
48.3% |
AAA |
20.6% |
| Footnote |
Description |
Footnote* |
Security ratings disclosed with the exception for those labeled "not rated" is an aggregation of the highest security level rating amongst Standard & Poor's Ratings Service ("S&P"), Moody's Investors Services ("Moody's") and Fitch Ratings Service ("Fitch"), each a Nationally Recognized Statistical Ratings Organization ("NRSRO"). These rating agencies are independent, nationally recognized statistical rating organizations and are widely used. | |
| Material Fund Change Adviser [Text Block] |
There were no material changes to the Fund. |
| C000164312 |
|
| Shareholder Report [Line Items] |
|
| Fund Name |
Inflation-Linked Fixed Income Fund
|
| Trading Symbol |
TILUX
|
| Annual or Semi-Annual Statement [Text Block] |
This annual shareholder report contains important information about Morgan Stanley Pathway Funds - Inflation-Linked Fixed Income Fund for the period of September 1, 2025 to August 31, 2026.
|
| Shareholder Report Annual or Semi-Annual |
Annual Shareholder Report
|
| Additional Information [Text Block] |
You can find additional information about the fund at www.morganstanley.com/wealth-investmentsolutions/cgcm. You can also request this information by contacting us at 1-800-869-3326
|
| Additional Information Phone Number |
1-800-869-3326
|
| Additional Information Website |
www.morganstanley.com/wealth-investmentsolutions/cgcm
|
| Expenses [Text Block] |
What were the Fund costs for the last year?(based on hypothetical $10,000 investment)
Table Summary
Fund name |
Cost of a $10,000 investment |
Cost paid as a % of a $10,000 investment |
Inflation-Linked Fixed Income Fund |
$228 |
2.27% | |
| Expenses Paid, Amount |
$ 228
|
| Expense Ratio, Percent |
2.27%
|
| Factors Affecting Performance [Text Block] |
How did the fund perform last year?Key contributors to and detractors from performance relative to the Bloomberg U.S. Treasury Inflation Protected Securities (TIPS) Index: Contributors: Breakeven inflation strategies in Europe and Japan contributed positively to relative performance. Exposure to agency and non-agency mortgage-backed securities, as well as collateralized loan obligations, provided additional support to relative performance. Active currency strategies, particularly long exposure to the Brazilian real and Mexican peso, also enhanced relative returns during the period.
Detractors: Interest-rate strategies across the U.S., Europe and U.K. detracted from relative performance during the period. Short exposure to dollar-bloc currencies also weighed on relative returns during the period.
|
| Performance Past Does Not Indicate Future [Text] |
THE FUND'S PAST PERFORMANCE IS NO GUARANTEE OF FUTURE RESULTS.
|
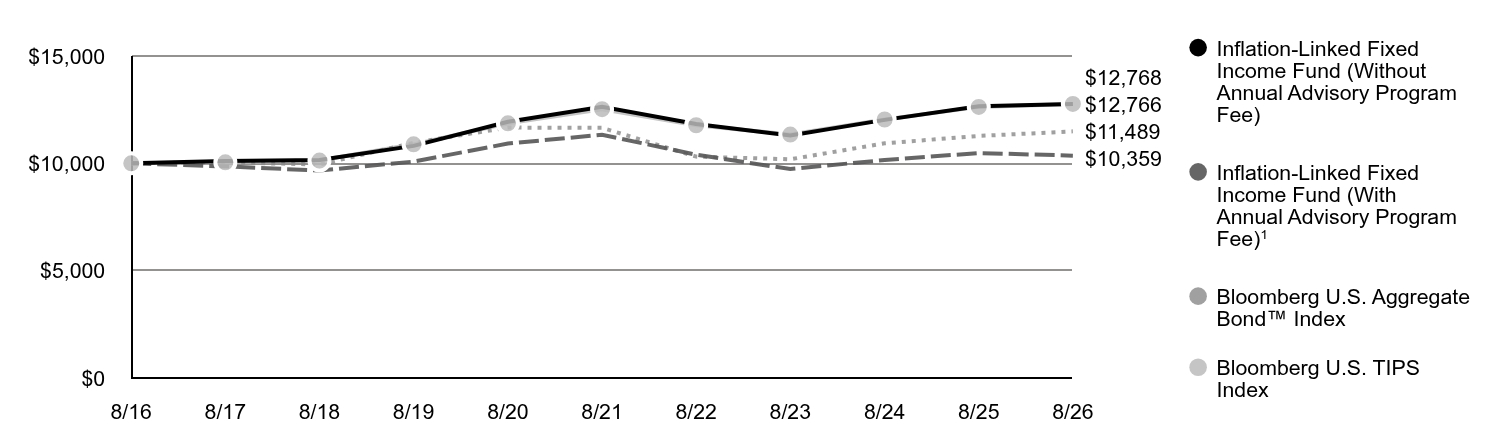
| Line Graph [Table Text Block] |
Table Summary
|
Inflation-Linked Fixed Income Fund (Without Annual Advisory Program Fee) |
Inflation-Linked Fixed Income Fund (With Annual Advisory Program FeeFootnote Reference1) |
Bloomberg U.S. Aggregate Bond™ Index |
Bloomberg U.S. TIPS Index |
8/16 |
$10,000 |
$10,000 |
$10,000 |
$10,000 |
8/17 |
$10,105 |
$9,856 |
$10,049 |
$10,046 |
8/18 |
$10,160 |
$9,664 |
$9,944 |
$10,129 |
8/19 |
$10,813 |
$10,081 |
$10,955 |
$10,885 |
8/20 |
$11,935 |
$10,920 |
$11,665 |
$11,863 |
8/21 |
$12,636 |
$11,333 |
$11,655 |
$12,522 |
8/22 |
$11,831 |
$10,400 |
$10,313 |
$11,773 |
8/23 |
$11,297 |
$9,733 |
$10,189 |
$11,341 |
8/24 |
$12,025 |
$10,154 |
$10,933 |
$12,041 |
8/25 |
$12,661 |
$10,480 |
$11,276 |
$12,630 |
8/26 |
$12,768 |
$10,359 |
$11,489 |
$12,766 |
|
| Average Annual Return [Table Text Block] |
Table Summary
|
1 Year |
5 Years |
10 Years |
Inflation-Linked Fixed Income Fund (Without Annual Advisory Program Fee) |
0.84% |
0.21% |
2.47% |
Inflation-Linked Fixed Income Fund (With Annual Advisory Program Fee)Footnote Reference1 |
-1.16% |
-1.78% |
0.19% |
Bloomberg U.S. Aggregate Bond™ Index |
1.89% |
-0.29% |
1.40% |
Bloomberg U.S. TIPS Index |
1.08% |
0.39% |
2.47% | |
| No Deduction of Taxes [Text Block] |
Performance does not reflect the deduction of taxes that a shareholder would pay on Fund distributions or redemption of Fund shares
|
| AssetsNet |
$ 128,498,022
|
| Holdings Count | Holding |
165
|
| Advisory Fees Paid, Amount |
$ 608,699
|
| InvestmentCompanyPortfolioTurnover |
97.00%
|
| Additional Fund Statistics [Text Block] |
Table Summary
Total Net Assets |
$128,498,022 |
# of Portfolio Holdings |
165 |
Portfolio Turnover Rate |
97% |
Advisory Fees Paid |
$608,699 | |
| Holdings [Text Block] |
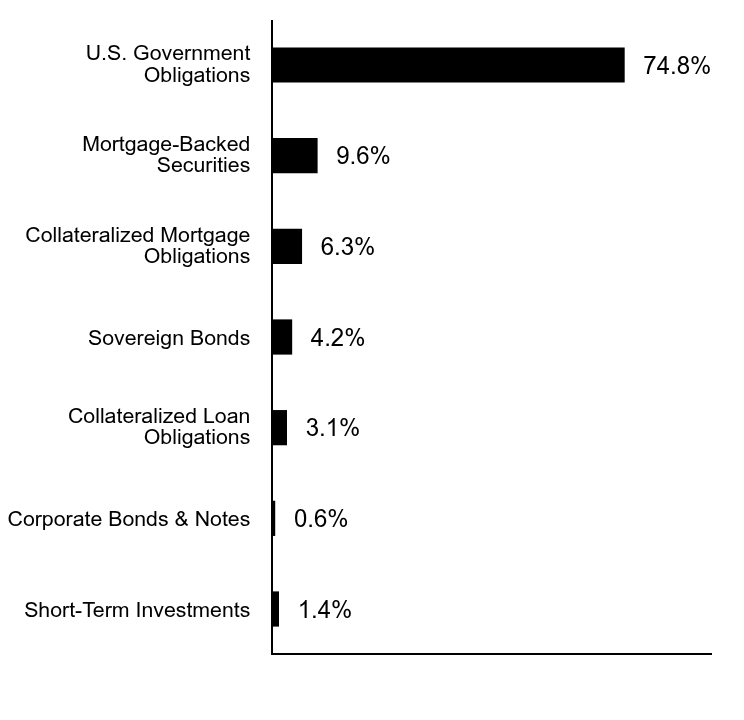
Asset Allocation (% of Investments)
Table Summary
Value |
Value |
Short-Term Investments |
1.4% |
Corporate Bonds & Notes |
0.6% |
Collateralized Loan Obligations |
3.1% |
Sovereign Bonds |
4.2% |
Collateralized Mortgage Obligations |
6.3% |
Mortgage-Backed Securities |
9.6% |
U.S. Government Obligations |
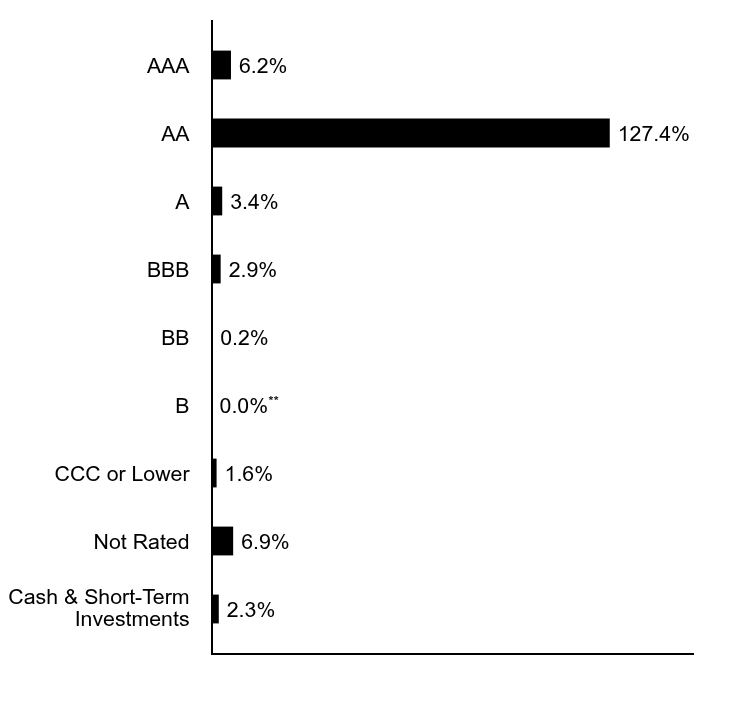
74.8% | Credit Quality Allocation (% of net assets)Footnote Reference*
Table Summary
Value |
Value |
Cash & Short-Term Investments |
2.3% |
Not Rated |
6.9% |
CCC or Lower |
1.6% |
B |
0.0%Footnote Reference** |
BB |
0.2% |
BBB |
2.9% |
A |
3.4% |
AA |
127.4% |
AAA |
6.2% |
| Footnote |
Description |
Footnote* |
Security ratings disclosed with the exception for those labeled "not rated" is an aggregation of the highest security level rating amongst Standard & Poor's Ratings Service ("S&P"), Moody's Investors Services ("Moody's") and Fitch Ratings Service ("Fitch"), each a Nationally Recognized Statistical Ratings Organization ("NRSRO"). These rating agencies are independent, nationally recognized statistical rating organizations and are widely used. |
Footnote** |
Less than 0.05%. | |
| Material Fund Change Adviser [Text Block] |
There were no material changes to the Fund. |
| C000164313 |
|
| Shareholder Report [Line Items] |
|
| Fund Name |
Ultra-Short Term Fixed Income Fund
|
| Trading Symbol |
TSDUX
|
| Annual or Semi-Annual Statement [Text Block] |
This annual shareholder report contains important information about Morgan Stanley Pathway Funds - Ultra-Short Term Fixed Income Fund for the period of September 1, 2025 to August 31, 2026.
|
| Shareholder Report Annual or Semi-Annual |
Annual Shareholder Report
|
| Additional Information [Text Block] |
You can find additional information about the fund at www.morganstanley.com/wealth-investmentsolutions/cgcm. You can also request this information by contacting us at 1-800-869-3326
|
| Material Fund Change Notice [Text Block] |
This report describes changes to the Fund that occurred during the reporting period.
|
| Additional Information Phone Number |
1-800-869-3326
|
| Additional Information Website |
www.morganstanley.com/wealth-investmentsolutions/cgcm
|
| Expenses [Text Block] |
What were the Fund costs for the last year?(based on hypothetical $10,000 investment)
Table Summary
Fund name |
Cost of a $10,000 investment |
Cost paid as a % of a $10,000 investment |
Ultra-Short Term Fixed Income Fund |
$70 |
0.68% | |
| Expenses Paid, Amount |
$ 70
|
| Expense Ratio, Percent |
0.68%
|
| Factors Affecting Performance [Text Block] |
How did the fund perform last year?Key contributors to and detractors from performance relative to the FTSE 3-Month U.S. Treasury Bill Index: Contributors: Holdings of investment-grade credit, particularly within the financial sector, contributed positively to relative performance. Select securitized credit holdings, including agency mortgage-backed securities, asset-backed securities and collateralized loan obligations, provided additional support to relative performance.
Detractors: The fund’s overweight exposure to U.S. duration detracted from relative performance during the period. Interest rates increased as inflation concerns prompted a repricing of the market’s monetary-policy expectations, placing downward pressure on interest-rate-sensitive securities. As a result, the portfolio’s greater duration exposure generated a negative duration effect relative to the shorter-duration benchmark.
|
| Performance Past Does Not Indicate Future [Text] |
THE FUND'S PAST PERFORMANCE IS NO GUARANTEE OF FUTURE RESULTS.
|
| Line Graph [Table Text Block] |
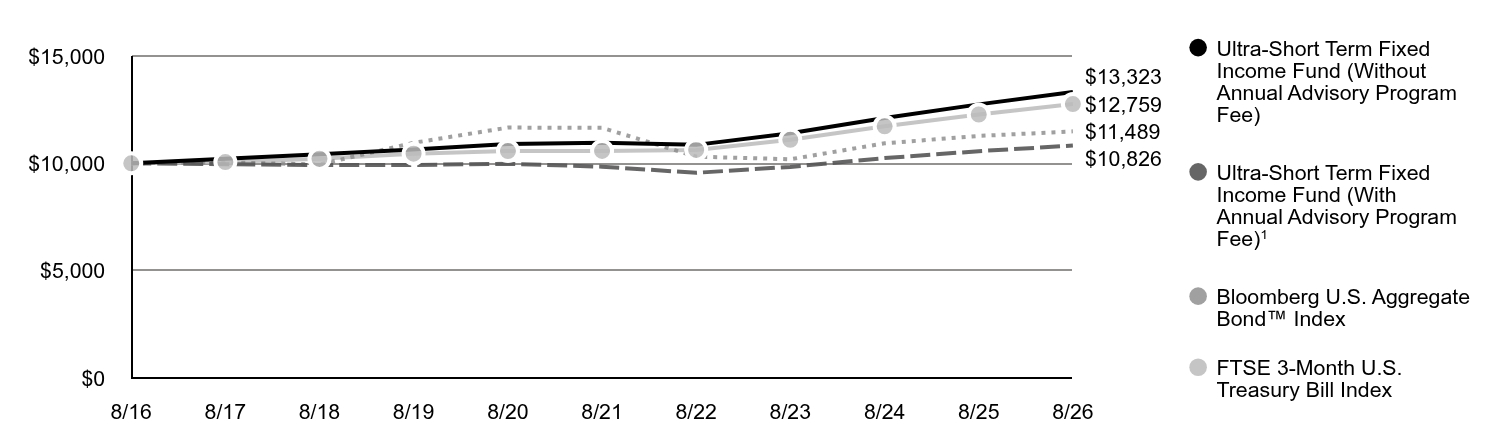
Table Summary
|
Ultra-Short Term Fixed Income Fund (Without Annual Advisory Program Fee) |
Ultra-Short Term Fixed Income Fund (With Annual Advisory Program FeeFootnote Reference1) |
Bloomberg U.S. Aggregate Bond™ Index |
FTSE 3-Month U.S. Treasury Bill Index |
8/16 |
$10,000 |
$10,000 |
$10,000 |
$10,000 |
8/17 |
$10,214 |
$9,962 |
$10,049 |
$10,058 |
8/18 |
$10,427 |
$9,919 |
$9,944 |
$10,208 |
8/19 |
$10,643 |
$9,924 |
$10,955 |
$10,448 |
8/20 |
$10,895 |
$9,982 |
$11,665 |
$10,572 |
8/21 |
$10,961 |
$9,844 |
$11,655 |
$10,579 |
8/22 |
$10,860 |
$9,559 |
$10,313 |
$10,625 |
8/23 |
$11,397 |
$9,834 |
$10,189 |
$11,097 |
8/24 |
$12,113 |
$10,244 |
$10,933 |
$11,724 |
8/25 |
$12,747 |
$10,567 |
$11,276 |
$12,274 |
8/26 |
$13,323 |
$10,826 |
$11,489 |
$12,759 |
|
| Average Annual Return [Table Text Block] |
Table Summary
|
1 Year |
5 Years |
10 Years |
Ultra-Short Term Fixed Income Fund (Without Annual Advisory Program Fee) |
4.52% |
3.98% |
2.91% |
Ultra-Short Term Fixed Income Fund (With Annual Advisory Program Fee)Footnote Reference1 |
2.45% |
1.92% |
0.62% |
Bloomberg U.S. Aggregate Bond™ Index |
1.89% |
-0.29% |
1.40% |
FTSE 3-Month U.S. Treasury Bill Index |
3.95% |
3.82% |
2.47% | |
| No Deduction of Taxes [Text Block] |
Performance does not reflect the deduction of taxes that a shareholder would pay on Fund distributions or redemption of Fund shares
|
| AssetsNet |
$ 255,464,027
|
| Holdings Count | Holding |
391
|
| Advisory Fees Paid, Amount |
$ 1,091,417
|
| InvestmentCompanyPortfolioTurnover |
97.00%
|
| Additional Fund Statistics [Text Block] |
Table Summary
Total Net Assets |
$255,464,027 |
# of Portfolio Holdings |
391 |
Portfolio Turnover Rate |
97% |
Advisory Fees Paid |
$1,091,417 | |
| Holdings [Text Block] |
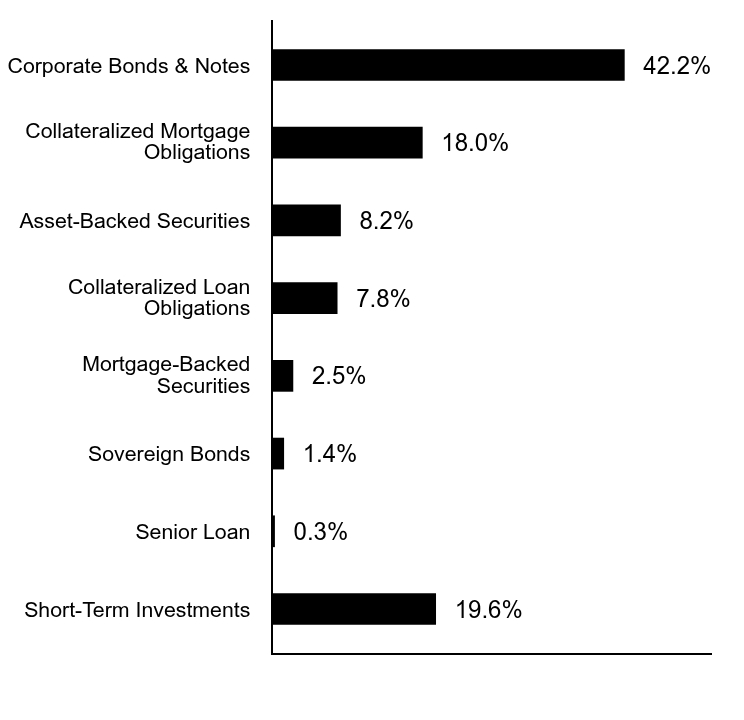
Asset Allocation (% of Investments)
Table Summary
Value |
Value |
Short-Term Investments |
19.6% |
Senior Loan |
0.3% |
Sovereign Bonds |
1.4% |
Mortgage-Backed Securities |
2.5% |
Collateralized Loan Obligations |
7.8% |
Asset-Backed Securities |
8.2% |
Collateralized Mortgage Obligations |
18.0% |
Corporate Bonds & Notes |
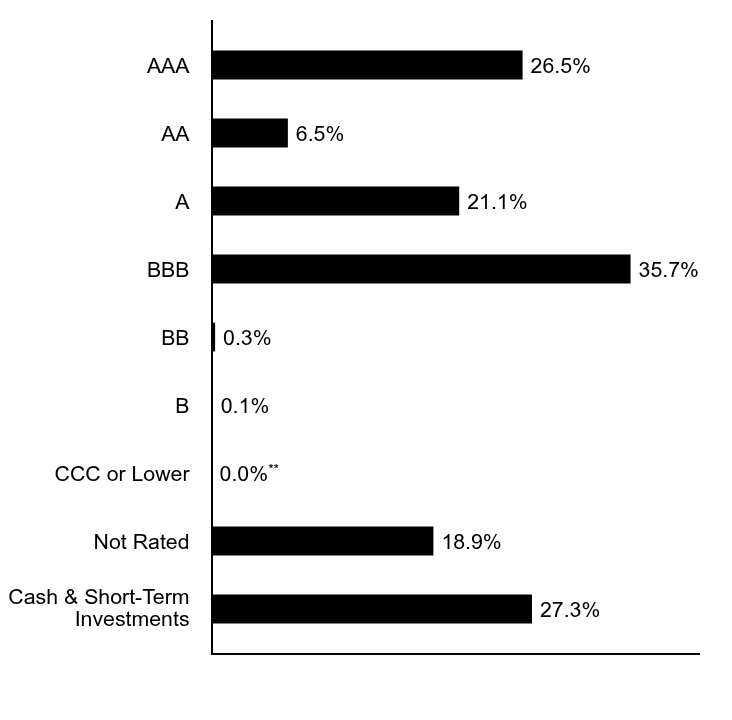
42.2% | Credit Quality Allocation (% of net assets)Footnote Reference*
Table Summary
Value |
Value |
Cash & Short-Term Investments |
27.3% |
Not Rated |
18.9% |
CCC or Lower |
0.0%Footnote Reference** |
B |
0.1% |
BB |
0.3% |
BBB |
35.7% |
A |
21.1% |
AA |
6.5% |
AAA |
26.5% |
| Footnote |
Description |
Footnote* |
Security ratings disclosed with the exception for those labeled "not rated" is an aggregation of the highest security level rating amongst Standard & Poor's Ratings Service ("S&P"), Moody's Investors Services ("Moody's") and Fitch Ratings Service ("Fitch"), each a Nationally Recognized Statistical Ratings Organization ("NRSRO"). These rating agencies are independent, nationally recognized statistical rating organizations and are widely used. |
Footnote** |
Less than 0.05%. | |
| Material Fund Change Adviser [Text Block] |
This is a summary of certain changes to the Fund since August 31, 2025. For more complete information, you may review the Fund’s next prospectus, which we expect to be available by January 1, 2027 at www.morganstanley.com/wealth-investmentsolutions/cgcm or upon request by contacting us at 1-800-869-3326. The net expense ratio increased from the prior fiscal year primarily due to an increase in expenses related to financing activities. |
| C000196891 |
|
| Shareholder Report [Line Items] |
|
| Fund Name |
Alternative Strategies Fund
|
| Trading Symbol |
TALTX
|
| Annual or Semi-Annual Statement [Text Block] |
This annual shareholder report contains important information about Morgan Stanley Pathway Funds - Alternative Strategies Fund for the period of September 1, 2025 to August 31, 2026.
|
| Shareholder Report Annual or Semi-Annual |
Annual Shareholder Report
|
| Additional Information [Text Block] |
You can find additional information about the fund at www.morganstanley.com/wealth-investmentsolutions/cgcm. You can also request this information by contacting us at 1-800-869-3326
|
| Additional Information Phone Number |
1-800-869-3326
|
| Additional Information Website |
www.morganstanley.com/wealth-investmentsolutions/cgcm
|
| Expenses [Text Block] |
What were the Fund costs for the last year?(based on hypothetical $10,000 investment)
Table Summary
Fund name |
Cost of a $10,000 investment |
Cost paid as a % of a $10,000 investment |
Alternative Strategies Fund |
$42 |
0.40% | |
| Expenses Paid, Amount |
$ 42
|
| Expense Ratio, Percent |
0.40%
|
| Factors Affecting Performance [Text Block] |
How did the fund perform last year?Key contributors to and detractors from performance relative to the HFRX Global Hedge Fund Index: Contributors: Positioning within absolute return strategies contributed positively to relative performance during the period as the fund saw strong performance in its market neutral holdings. Positioning within equity hedged strategies provided additional support to relative performance during the period as the fund’s managed futures and global macro strategies outperformed the benchmark.
Detractors:
|
| Performance Past Does Not Indicate Future [Text] |
THE FUND'S PAST PERFORMANCE IS NO GUARANTEE OF FUTURE RESULTS.
|
| Average Annual Return [Table Text Block] |
Table Summary
|
1 Year |
5 Years |
Since Inception |
Alternative Strategies Fund (Inception: February 16, 2018) (Without Annual Advisory Program Fee) |
8.08% |
3.93% |
3.99% |
Alternative Strategies Fund (Inception: February 16, 2018) (With Annual Advisory Program Fee)Footnote Reference1 |
5.94% |
1.87% |
1.72% |
Bloomberg U.S. Universal Bond™ Index |
2.23% |
0.10% |
2.02% |
HFRX Global Hedge Fund Index |
7.41% |
2.96% |
2.99% | |
| No Deduction of Taxes [Text Block] |
Performance does not reflect the deduction of taxes that a shareholder would pay on Fund distributions or redemption of Fund shares
|
| AssetsNet |
$ 216,223,972
|
| Holdings Count | Holding |
16
|
| Advisory Fees Paid, Amount |
$ 404,573
|
| InvestmentCompanyPortfolioTurnover |
4.00%
|
| Additional Fund Statistics [Text Block] |
Table Summary
Total Net Assets |
$216,223,972 |
# of Portfolio Holdings |
16 |
Portfolio Turnover Rate |
4% |
Advisory Fees Paid |
$404,573 | |
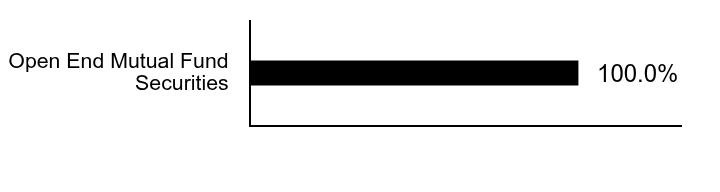
| Holdings [Text Block] |
Asset Allocation (% of Investments)
Table Summary
Value |
Value |
Open End Mutual Fund Securities |
100.0% | |
| Largest Holdings [Text Block] |
Top Ten Holdings (% of Investments)Footnote Referencea
Table Summary
BlackRock Systematic Multi-Strategy Fund, Institutional Class |
9.8% |
PIMCO Mortgage Opportunities and Bond Fund, Class I2 |
9.8% |
Abbey Capital Futures Strategy Fund, Class I |
9.0% |
John Hancock Diversified Macro Fund, Class I |
8.3% |
BlackRock Event Driven Equity Fund, Institutional Class |
7.9% |
BNY Mellon Global Real Return Fund, Class Y |
7.0% |
Neuberger Long Short Fund, Institutional Class |
6.9% |
PIMCO Credit Opportunities Bond Fund, Institutional Class |
6.5% |
Calamos Market Neutral Income Fund, Class I |
6.0% |
Touchstone Flexible Income Fund, Institutional Class |
5.8% |
Total |
77.0% |
| Footnote |
Description |
Footnotea |
Excludes cash equivalents. | |
| Material Fund Change [Text Block] |
There were no material changes to the Fund. |