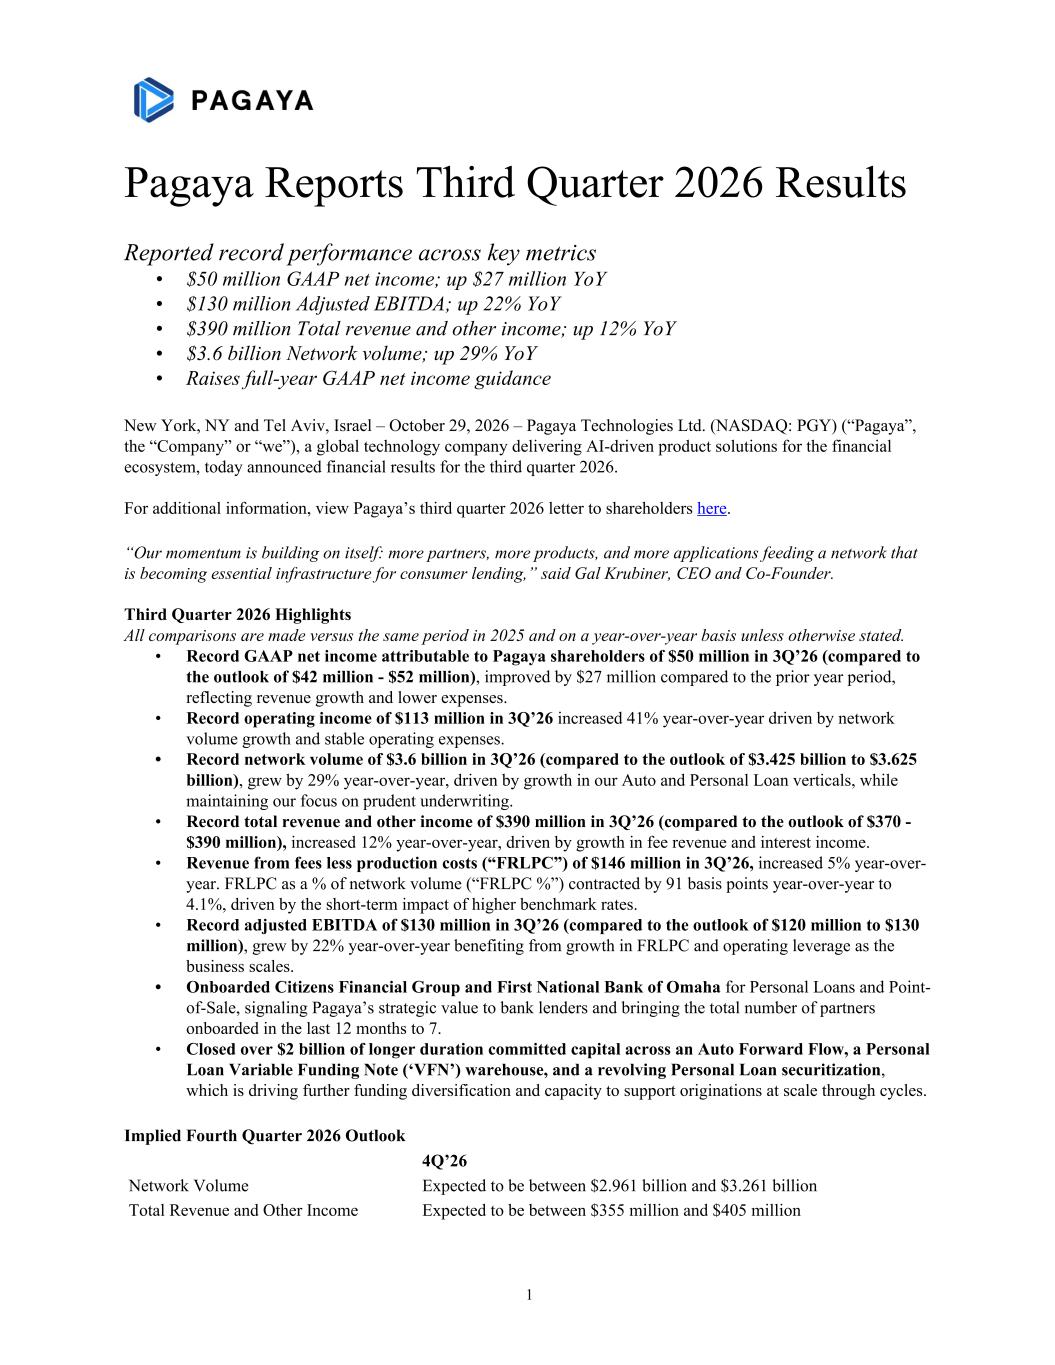
Pagaya Reports Third Quarter 2026 Results Reported record performance across key metrics • $50 million GAAP net income; up $27 million YoY • $130 million Adjusted EBITDA; up 22% YoY • $390 million Total revenue and other income; up 12% YoY • $3.6 billion Network volume; up 29% YoY • Raises full-year GAAP net income guidance New York, NY and Tel Aviv, Israel – October 29, 2026 – Pagaya Technologies Ltd. (NASDAQ: PGY) (“Pagaya”, the “Company” or “we”), a global technology company delivering AI-driven product solutions for the financial ecosystem, today announced financial results for the third quarter 2026. For additional information, view Pagaya’s third quarter 2026 letter to shareholders here. “Our momentum is building on itself: more partners, more products, and more applications feeding a network that is becoming essential infrastructure for consumer lending,” said Gal Krubiner, CEO and Co-Founder. Third Quarter 2026 Highlights All comparisons are made versus the same period in 2025 and on a year-over-year basis unless otherwise stated. • Record GAAP net income attributable to Pagaya shareholders of $50 million in 3Q’26 (compared to the outlook of $42 million - $52 million), improved by $27 million compared to the prior year period, reflecting revenue growth and lower expenses. • Record operating income of $113 million in 3Q’26 increased 41% year-over-year driven by network volume growth and stable operating expenses. • Record network volume of $3.6 billion in 3Q’26 (compared to the outlook of $3.425 billion to $3.625 billion), grew by 29% year-over-year, driven by growth in our Auto and Personal Loan verticals, while maintaining our focus on prudent underwriting. • Record total revenue and other income of $390 million in 3Q’26 (compared to the outlook of $370 - $390 million), increased 12% year-over-year, driven by growth in fee revenue and interest income. • Revenue from fees less production costs (“FRLPC”) of $146 million in 3Q’26, increased 5% year-over- year. FRLPC as a % of network volume (“FRLPC %”) contracted by 91 basis points year-over-year to 4.1%, driven by the short-term impact of higher benchmark rates. • Record adjusted EBITDA of $130 million in 3Q’26 (compared to the outlook of $120 million to $130 million), grew by 22% year-over-year benefiting from growth in FRLPC and operating leverage as the business scales. • Onboarded Citizens Financial Group and First National Bank of Omaha for Personal Loans and Point- of-Sale, signaling Pagaya’s strategic value to bank lenders and bringing the total number of partners onboarded in the last 12 months to 7. • Closed over $2 billion of longer duration committed capital across an Auto Forward Flow, a Personal Loan Variable Funding Note (‘VFN’) warehouse, and a revolving Personal Loan securitization, which is driving further funding diversification and capacity to support originations at scale through cycles. Implied Fourth Quarter 2026 Outlook 4Q’26 Network Volume Expected to be between $2.961 billion and $3.261 billion Total Revenue and Other Income Expected to be between $355 million and $405 million 1
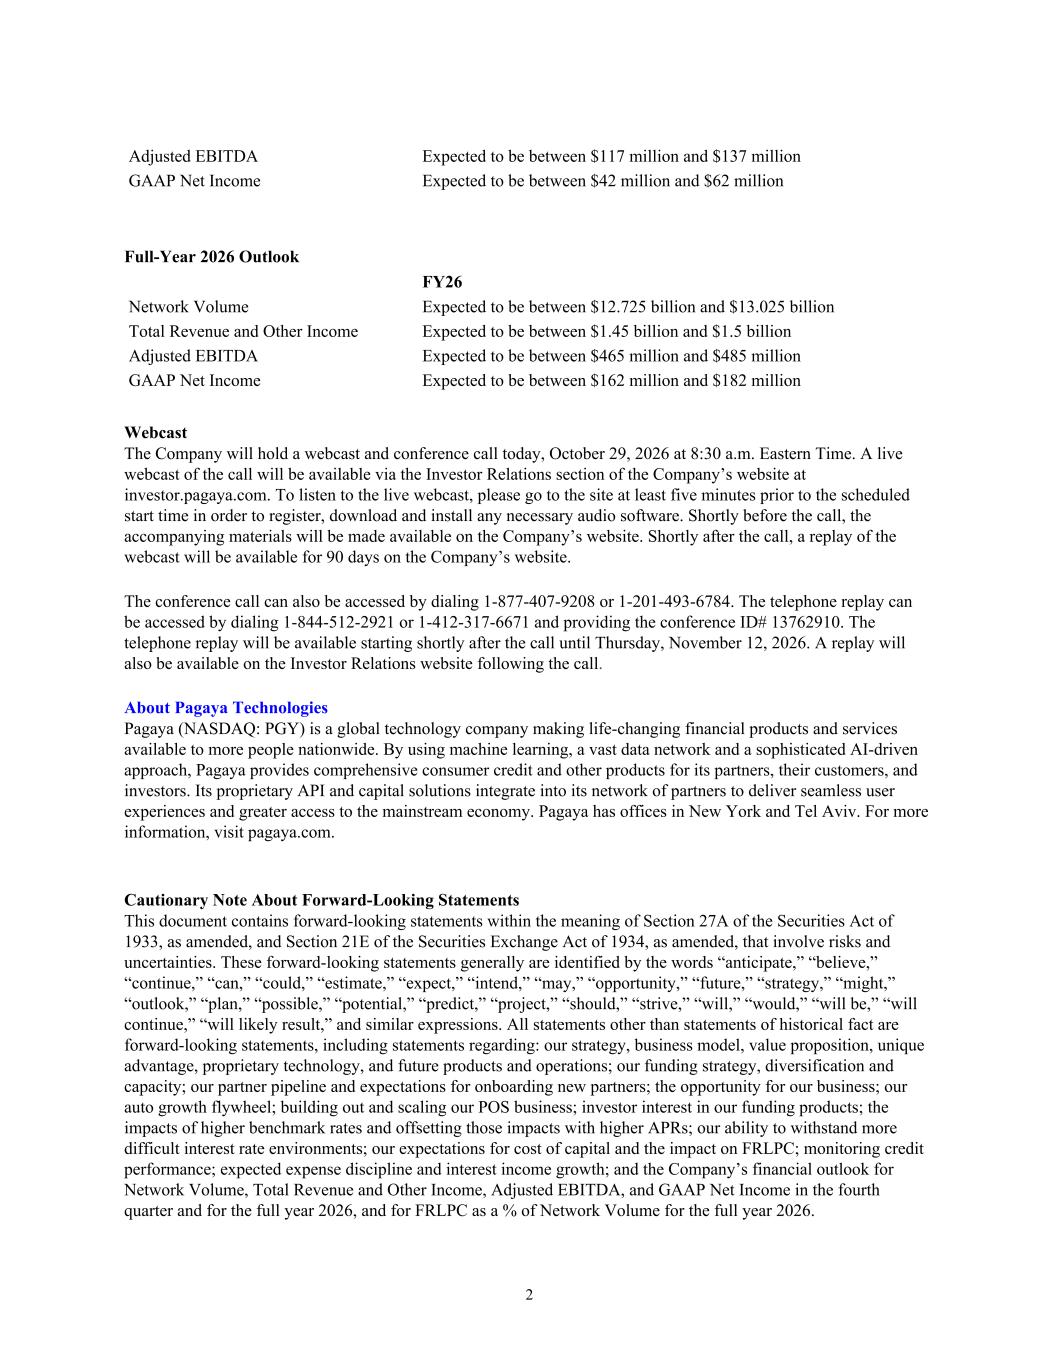
Adjusted EBITDA Expected to be between $117 million and $137 million GAAP Net Income Expected to be between $42 million and $62 million Full-Year 2026 Outlook FY26 Network Volume Expected to be between $12.725 billion and $13.025 billion Total Revenue and Other Income Expected to be between $1.45 billion and $1.5 billion Adjusted EBITDA Expected to be between $465 million and $485 million GAAP Net Income Expected to be between $162 million and $182 million Webcast The Company will hold a webcast and conference call today, October 29, 2026 at 8:30 a.m. Eastern Time. A live webcast of the call will be available via the Investor Relations section of the Company’s website at investor.pagaya.com. To listen to the live webcast, please go to the site at least five minutes prior to the scheduled start time in order to register, download and install any necessary audio software. Shortly before the call, the accompanying materials will be made available on the Company’s website. Shortly after the call, a replay of the webcast will be available for 90 days on the Company’s website. The conference call can also be accessed by dialing 1-877-407-9208 or 1-201-493-6784. The telephone replay can be accessed by dialing 1-844-512-2921 or 1-412-317-6671 and providing the conference ID# 13762910. The telephone replay will be available starting shortly after the call until Thursday, November 12, 2026. A replay will also be available on the Investor Relations website following the call. About Pagaya Technologies Pagaya (NASDAQ: PGY) is a global technology company making life-changing financial products and services available to more people nationwide. By using machine learning, a vast data network and a sophisticated AI-driven approach, Pagaya provides comprehensive consumer credit and other products for its partners, their customers, and investors. Its proprietary API and capital solutions integrate into its network of partners to deliver seamless user experiences and greater access to the mainstream economy. Pagaya has offices in New York and Tel Aviv. For more information, visit pagaya.com. Cautionary Note About Forward-Looking Statements This document contains forward-looking statements within the meaning of Section 27A of the Securities Act of 1933, as amended, and Section 21E of the Securities Exchange Act of 1934, as amended, that involve risks and uncertainties. These forward-looking statements generally are identified by the words “anticipate,” “believe,” “continue,” “can,” “could,” “estimate,” “expect,” “intend,” “may,” “opportunity,” “future,” “strategy,” “might,” “outlook,” “plan,” “possible,” “potential,” “predict,” “project,” “should,” “strive,” “will,” “would,” “will be,” “will continue,” “will likely result,” and similar expressions. All statements other than statements of historical fact are forward-looking statements, including statements regarding: our strategy, business model, value proposition, unique advantage, proprietary technology, and future products and operations; our funding strategy, diversification and capacity; our partner pipeline and expectations for onboarding new partners; the opportunity for our business; our auto growth flywheel; building out and scaling our POS business; investor interest in our funding products; the impacts of higher benchmark rates and offsetting those impacts with higher APRs; our ability to withstand more difficult interest rate environments; our expectations for cost of capital and the impact on FRLPC; monitoring credit performance; expected expense discipline and interest income growth; and the Company’s financial outlook for Network Volume, Total Revenue and Other Income, Adjusted EBITDA, and GAAP Net Income in the fourth quarter and for the full year 2026, and for FRLPC as a % of Network Volume for the full year 2026. 2
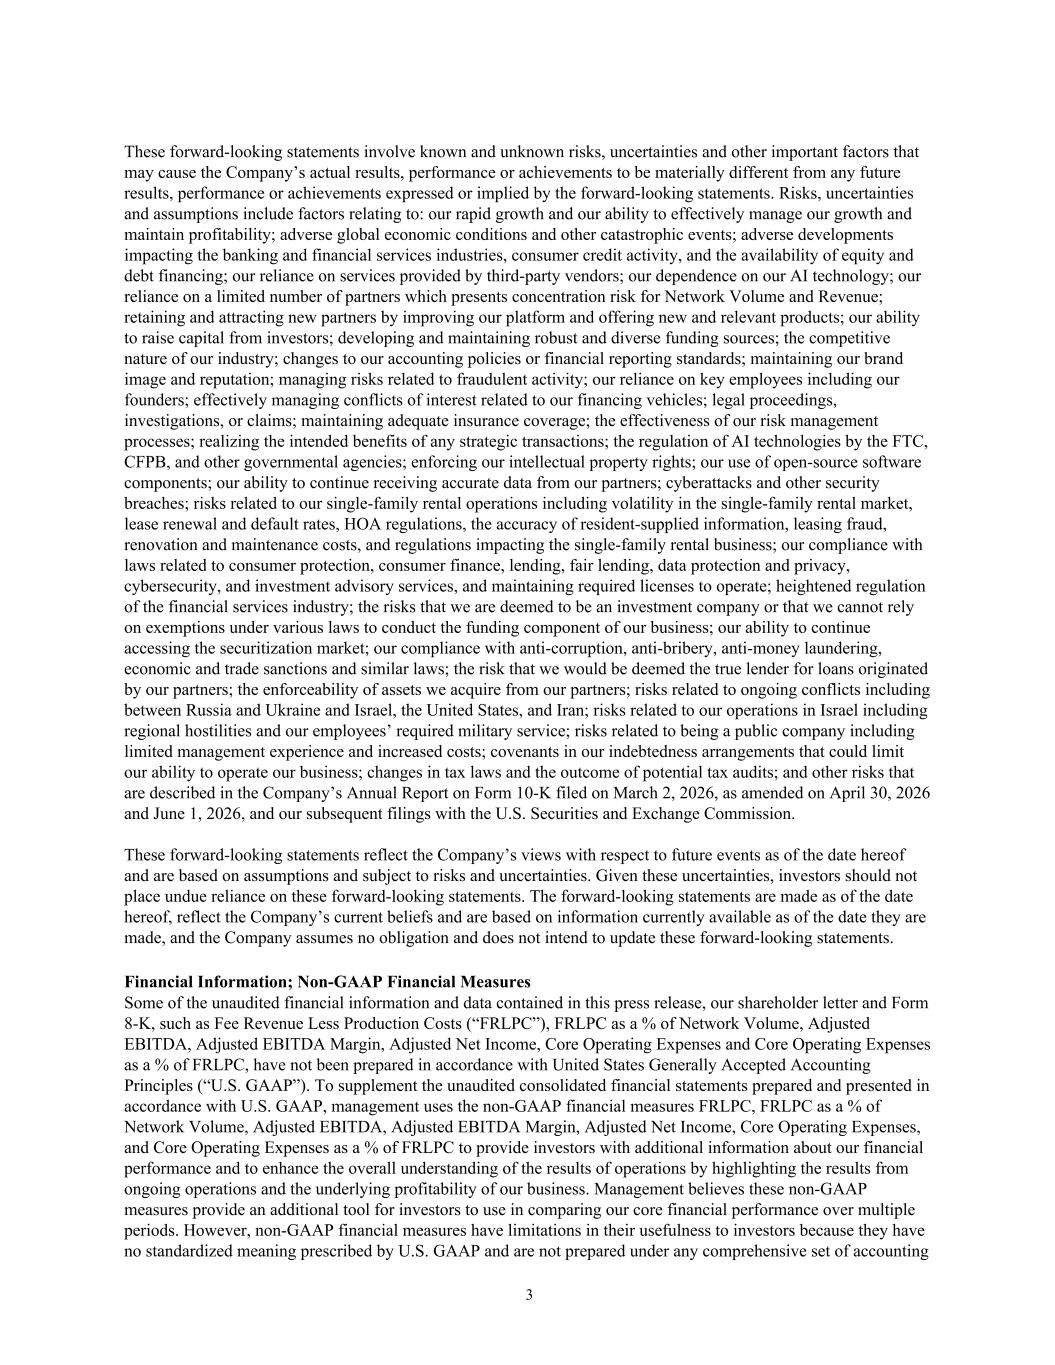
These forward-looking statements involve known and unknown risks, uncertainties and other important factors that may cause the Company’s actual results, performance or achievements to be materially different from any future results, performance or achievements expressed or implied by the forward-looking statements. Risks, uncertainties and assumptions include factors relating to: our rapid growth and our ability to effectively manage our growth and maintain profitability; adverse global economic conditions and other catastrophic events; adverse developments impacting the banking and financial services industries, consumer credit activity, and the availability of equity and debt financing; our reliance on services provided by third-party vendors; our dependence on our AI technology; our reliance on a limited number of partners which presents concentration risk for Network Volume and Revenue; retaining and attracting new partners by improving our platform and offering new and relevant products; our ability to raise capital from investors; developing and maintaining robust and diverse funding sources; the competitive nature of our industry; changes to our accounting policies or financial reporting standards; maintaining our brand image and reputation; managing risks related to fraudulent activity; our reliance on key employees including our founders; effectively managing conflicts of interest related to our financing vehicles; legal proceedings, investigations, or claims; maintaining adequate insurance coverage; the effectiveness of our risk management processes; realizing the intended benefits of any strategic transactions; the regulation of AI technologies by the FTC, CFPB, and other governmental agencies; enforcing our intellectual property rights; our use of open-source software components; our ability to continue receiving accurate data from our partners; cyberattacks and other security breaches; risks related to our single-family rental operations including volatility in the single-family rental market, lease renewal and default rates, HOA regulations, the accuracy of resident-supplied information, leasing fraud, renovation and maintenance costs, and regulations impacting the single-family rental business; our compliance with laws related to consumer protection, consumer finance, lending, fair lending, data protection and privacy, cybersecurity, and investment advisory services, and maintaining required licenses to operate; heightened regulation of the financial services industry; the risks that we are deemed to be an investment company or that we cannot rely on exemptions under various laws to conduct the funding component of our business; our ability to continue accessing the securitization market; our compliance with anti-corruption, anti-bribery, anti-money laundering, economic and trade sanctions and similar laws; the risk that we would be deemed the true lender for loans originated by our partners; the enforceability of assets we acquire from our partners; risks related to ongoing conflicts including between Russia and Ukraine and Israel, the United States, and Iran; risks related to our operations in Israel including regional hostilities and our employees’ required military service; risks related to being a public company including limited management experience and increased costs; covenants in our indebtedness arrangements that could limit our ability to operate our business; changes in tax laws and the outcome of potential tax audits; and other risks that are described in the Company’s Annual Report on Form 10-K filed on March 2, 2026, as amended on April 30, 2026 and June 1, 2026, and our subsequent filings with the U.S. Securities and Exchange Commission. These forward-looking statements reflect the Company’s views with respect to future events as of the date hereof and are based on assumptions and subject to risks and uncertainties. Given these uncertainties, investors should not place undue reliance on these forward-looking statements. The forward-looking statements are made as of the date hereof, reflect the Company’s current beliefs and are based on information currently available as of the date they are made, and the Company assumes no obligation and does not intend to update these forward-looking statements. Financial Information; Non-GAAP Financial Measures Some of the unaudited financial information and data contained in this press release, our shareholder letter and Form 8-K, such as Fee Revenue Less Production Costs (“FRLPC”), FRLPC as a % of Network Volume, Adjusted EBITDA, Adjusted EBITDA Margin, Adjusted Net Income, Core Operating Expenses and Core Operating Expenses as a % of FRLPC, have not been prepared in accordance with United States Generally Accepted Accounting Principles (“U.S. GAAP”). To supplement the unaudited consolidated financial statements prepared and presented in accordance with U.S. GAAP, management uses the non-GAAP financial measures FRLPC, FRLPC as a % of Network Volume, Adjusted EBITDA, Adjusted EBITDA Margin, Adjusted Net Income, Core Operating Expenses, and Core Operating Expenses as a % of FRLPC to provide investors with additional information about our financial performance and to enhance the overall understanding of the results of operations by highlighting the results from ongoing operations and the underlying profitability of our business. Management believes these non-GAAP measures provide an additional tool for investors to use in comparing our core financial performance over multiple periods. However, non-GAAP financial measures have limitations in their usefulness to investors because they have no standardized meaning prescribed by U.S. GAAP and are not prepared under any comprehensive set of accounting 3
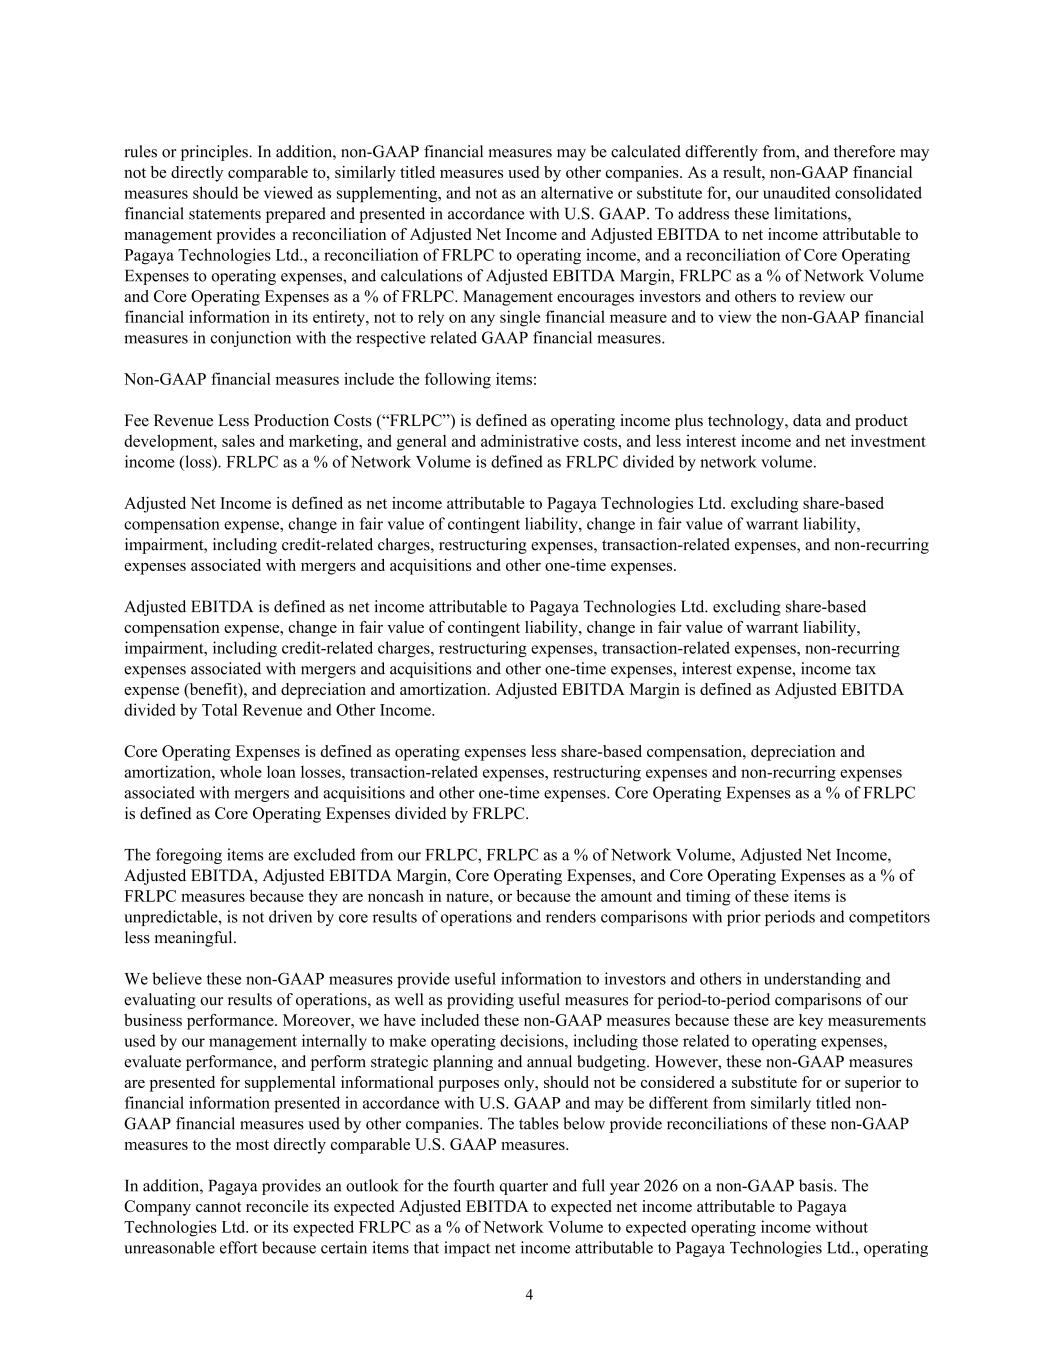
rules or principles. In addition, non-GAAP financial measures may be calculated differently from, and therefore may not be directly comparable to, similarly titled measures used by other companies. As a result, non-GAAP financial measures should be viewed as supplementing, and not as an alternative or substitute for, our unaudited consolidated financial statements prepared and presented in accordance with U.S. GAAP. To address these limitations, management provides a reconciliation of Adjusted Net Income and Adjusted EBITDA to net income attributable to Pagaya Technologies Ltd., a reconciliation of FRLPC to operating income, and a reconciliation of Core Operating Expenses to operating expenses, and calculations of Adjusted EBITDA Margin, FRLPC as a % of Network Volume and Core Operating Expenses as a % of FRLPC. Management encourages investors and others to review our financial information in its entirety, not to rely on any single financial measure and to view the non-GAAP financial measures in conjunction with the respective related GAAP financial measures. Non-GAAP financial measures include the following items: Fee Revenue Less Production Costs (“FRLPC”) is defined as operating income plus technology, data and product development, sales and marketing, and general and administrative costs, and less interest income and net investment income (loss). FRLPC as a % of Network Volume is defined as FRLPC divided by network volume. Adjusted Net Income is defined as net income attributable to Pagaya Technologies Ltd. excluding share-based compensation expense, change in fair value of contingent liability, change in fair value of warrant liability, impairment, including credit-related charges, restructuring expenses, transaction-related expenses, and non-recurring expenses associated with mergers and acquisitions and other one-time expenses. Adjusted EBITDA is defined as net income attributable to Pagaya Technologies Ltd. excluding share-based compensation expense, change in fair value of contingent liability, change in fair value of warrant liability, impairment, including credit-related charges, restructuring expenses, transaction-related expenses, non-recurring expenses associated with mergers and acquisitions and other one-time expenses, interest expense, income tax expense (benefit), and depreciation and amortization. Adjusted EBITDA Margin is defined as Adjusted EBITDA divided by Total Revenue and Other Income. Core Operating Expenses is defined as operating expenses less share-based compensation, depreciation and amortization, whole loan losses, transaction-related expenses, restructuring expenses and non-recurring expenses associated with mergers and acquisitions and other one-time expenses. Core Operating Expenses as a % of FRLPC is defined as Core Operating Expenses divided by FRLPC. The foregoing items are excluded from our FRLPC, FRLPC as a % of Network Volume, Adjusted Net Income, Adjusted EBITDA, Adjusted EBITDA Margin, Core Operating Expenses, and Core Operating Expenses as a % of FRLPC measures because they are noncash in nature, or because the amount and timing of these items is unpredictable, is not driven by core results of operations and renders comparisons with prior periods and competitors less meaningful. We believe these non-GAAP measures provide useful information to investors and others in understanding and evaluating our results of operations, as well as providing useful measures for period-to-period comparisons of our business performance. Moreover, we have included these non-GAAP measures because these are key measurements used by our management internally to make operating decisions, including those related to operating expenses, evaluate performance, and perform strategic planning and annual budgeting. However, these non-GAAP measures are presented for supplemental informational purposes only, should not be considered a substitute for or superior to financial information presented in accordance with U.S. GAAP and may be different from similarly titled non- GAAP financial measures used by other companies. The tables below provide reconciliations of these non-GAAP measures to the most directly comparable U.S. GAAP measures. In addition, Pagaya provides an outlook for the fourth quarter and full year 2026 on a non-GAAP basis. The Company cannot reconcile its expected Adjusted EBITDA to expected net income attributable to Pagaya Technologies Ltd. or its expected FRLPC as a % of Network Volume to expected operating income without unreasonable effort because certain items that impact net income attributable to Pagaya Technologies Ltd., operating 4

income, and other reconciling items are out of the Company’s control and/or cannot be reasonably predicted at this time, which unavailable information could have a significant impact on the Company’s U.S. GAAP financial results. Investors & Analysts Craig Smyth Investor Relations IR@pagaya.com Media & Press Emily Scheer Public Relations Press@pagaya.com 5
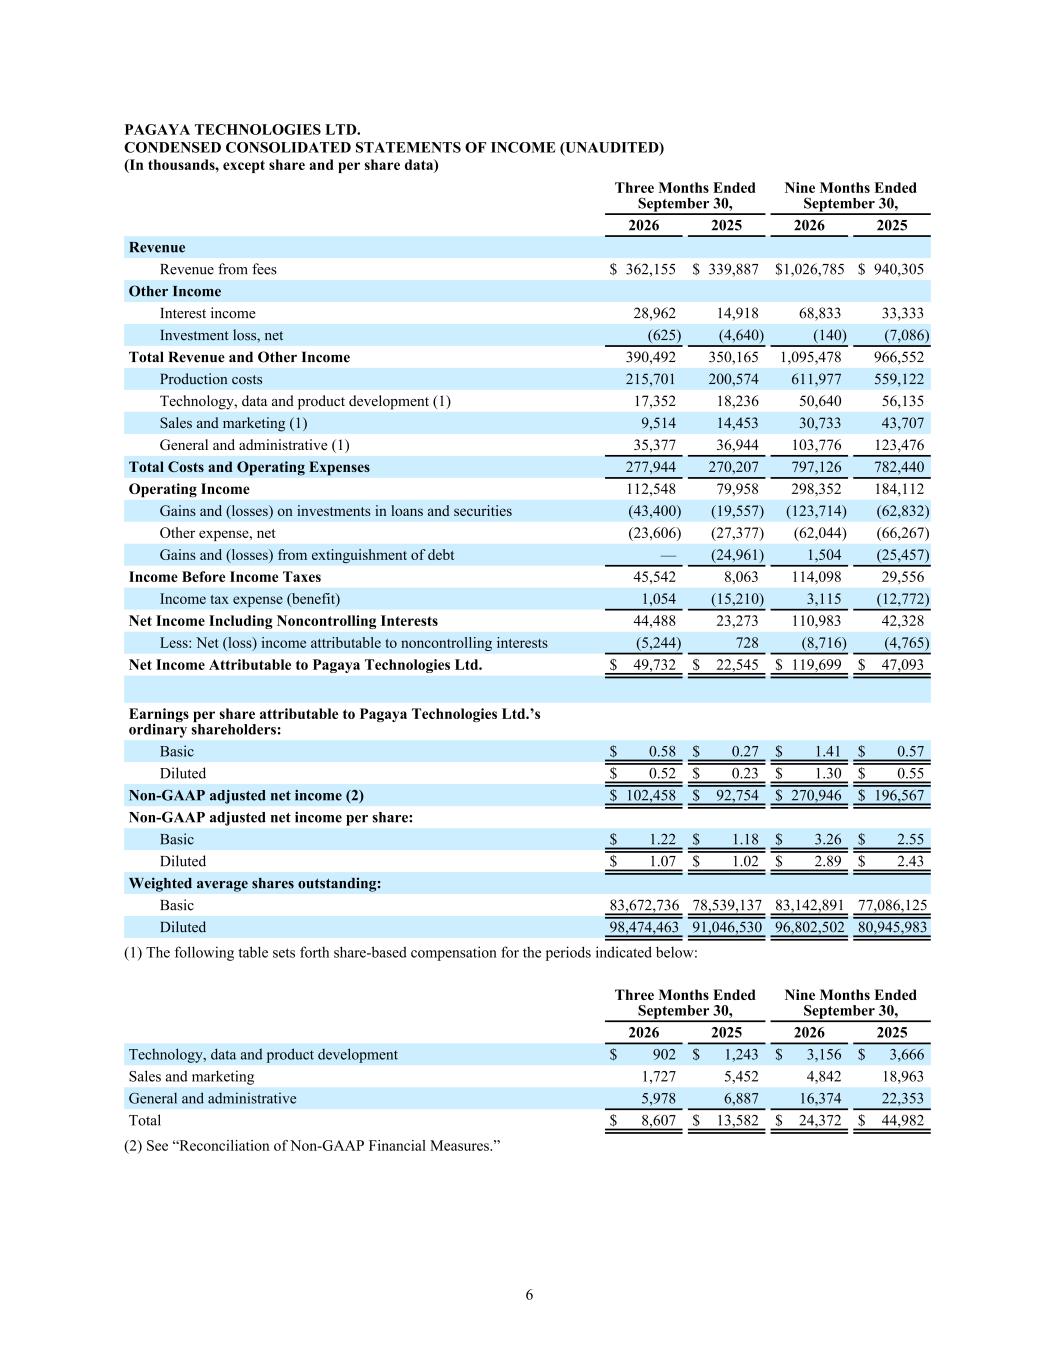
PAGAYA TECHNOLOGIES LTD. CONDENSED CONSOLIDATED STATEMENTS OF INCOME (UNAUDITED) (In thousands, except share and per share data) Three Months Ended September 30, Nine Months Ended September 30, 2026 2025 2026 2025 Revenue Revenue from fees $ 362,155 $ 339,887 $ 1,026,785 $ 940,305 Other Income Interest income 28,962 14,918 68,833 33,333 Investment loss, net (625) (4,640) (140) (7,086) Total Revenue and Other Income 390,492 350,165 1,095,478 966,552 Production costs 215,701 200,574 611,977 559,122 Technology, data and product development (1) 17,352 18,236 50,640 56,135 Sales and marketing (1) 9,514 14,453 30,733 43,707 General and administrative (1) 35,377 36,944 103,776 123,476 Total Costs and Operating Expenses 277,944 270,207 797,126 782,440 Operating Income 112,548 79,958 298,352 184,112 Gains and (losses) on investments in loans and securities (43,400) (19,557) (123,714) (62,832) Other expense, net (23,606) (27,377) (62,044) (66,267) Gains and (losses) from extinguishment of debt — (24,961) 1,504 (25,457) Income Before Income Taxes 45,542 8,063 114,098 29,556 Income tax expense (benefit) 1,054 (15,210) 3,115 (12,772) Net Income Including Noncontrolling Interests 44,488 23,273 110,983 42,328 Less: Net (loss) income attributable to noncontrolling interests (5,244) 728 (8,716) (4,765) Net Income Attributable to Pagaya Technologies Ltd. $ 49,732 $ 22,545 $ 119,699 $ 47,093 Earnings per share attributable to Pagaya Technologies Ltd.’s ordinary shareholders: Basic $ 0.58 $ 0.27 $ 1.41 $ 0.57 Diluted $ 0.52 $ 0.23 $ 1.30 $ 0.55 Non-GAAP adjusted net income (2) $ 102,458 $ 92,754 $ 270,946 $ 196,567 Non-GAAP adjusted net income per share: Basic $ 1.22 $ 1.18 $ 3.26 $ 2.55 Diluted $ 1.07 $ 1.02 $ 2.89 $ 2.43 Weighted average shares outstanding: Basic 83,672,736 78,539,137 83,142,891 77,086,125 Diluted 98,474,463 91,046,530 96,802,502 80,945,983 (1) The following table sets forth share-based compensation for the periods indicated below: Three Months Ended September 30, Nine Months Ended September 30, 2026 2025 2026 2025 Technology, data and product development $ 902 $ 1,243 $ 3,156 $ 3,666 Sales and marketing 1,727 5,452 4,842 18,963 General and administrative 5,978 6,887 16,374 22,353 Total $ 8,607 $ 13,582 $ 24,372 $ 44,982 (2) See “Reconciliation of Non-GAAP Financial Measures.” 6
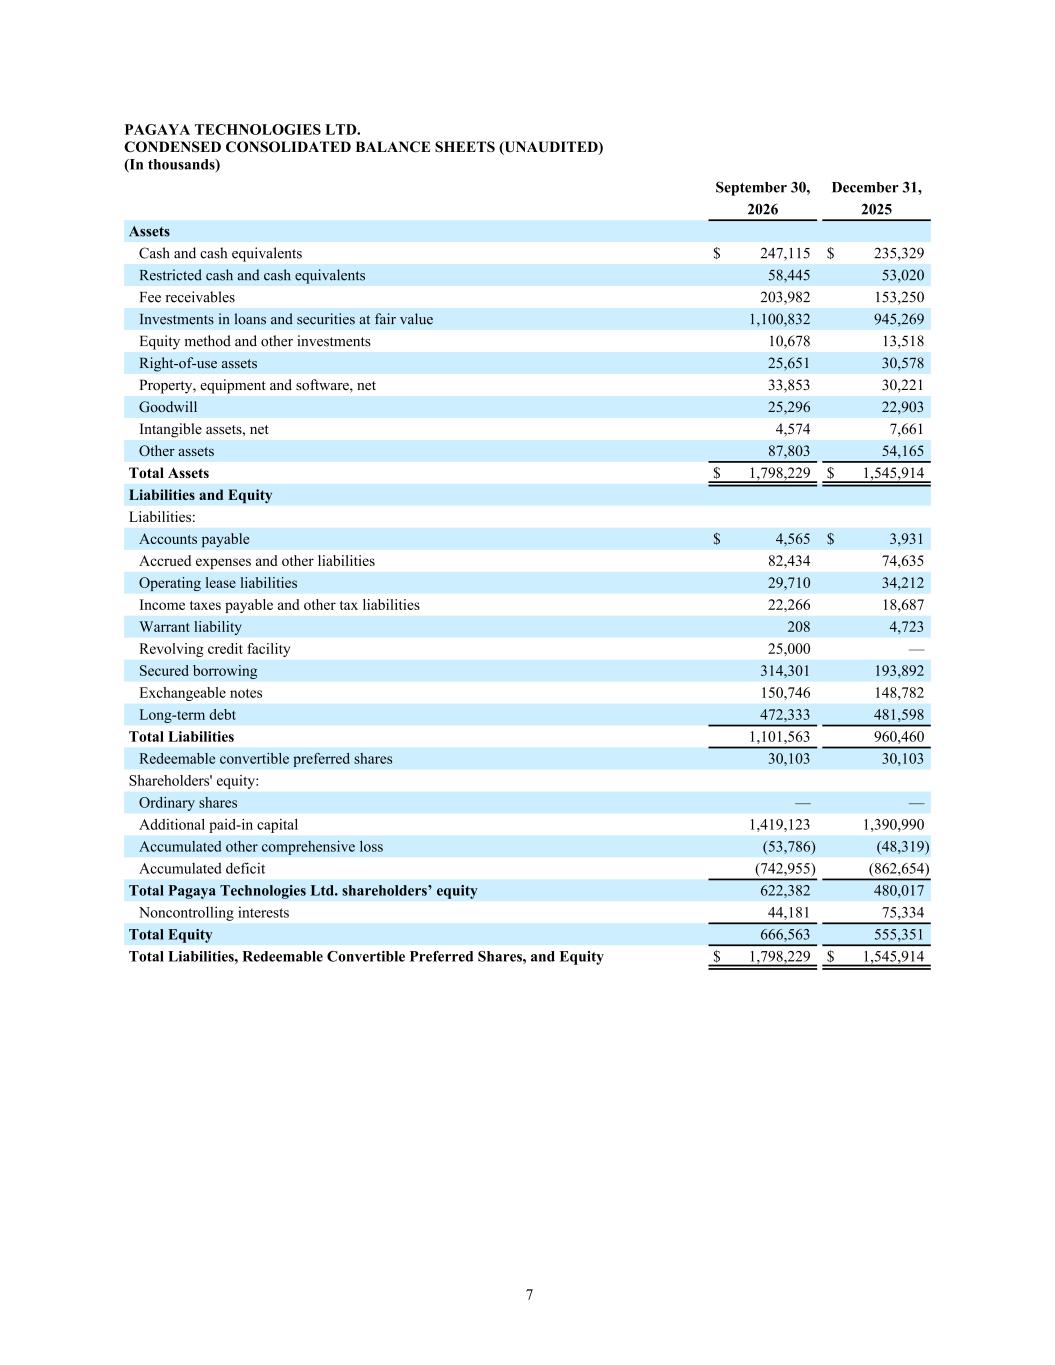
PAGAYA TECHNOLOGIES LTD. CONDENSED CONSOLIDATED BALANCE SHEETS (UNAUDITED) (In thousands) September 30, December 31, 2026 2025 Assets Cash and cash equivalents $ 247,115 $ 235,329 Restricted cash and cash equivalents 58,445 53,020 Fee receivables 203,982 153,250 Investments in loans and securities at fair value 1,100,832 945,269 Equity method and other investments 10,678 13,518 Right-of-use assets 25,651 30,578 Property, equipment and software, net 33,853 30,221 Goodwill 25,296 22,903 Intangible assets, net 4,574 7,661 Other assets 87,803 54,165 Total Assets $ 1,798,229 $ 1,545,914 Liabilities and Equity Liabilities: Accounts payable $ 4,565 $ 3,931 Accrued expenses and other liabilities 82,434 74,635 Operating lease liabilities 29,710 34,212 Income taxes payable and other tax liabilities 22,266 18,687 Warrant liability 208 4,723 Revolving credit facility 25,000 — Secured borrowing 314,301 193,892 Exchangeable notes 150,746 148,782 Long-term debt 472,333 481,598 Total Liabilities 1,101,563 960,460 Redeemable convertible preferred shares 30,103 30,103 Shareholders' equity: Ordinary shares — — Additional paid-in capital 1,419,123 1,390,990 Accumulated other comprehensive loss (53,786) (48,319) Accumulated deficit (742,955) (862,654) Total Pagaya Technologies Ltd. shareholders’ equity 622,382 480,017 Noncontrolling interests 44,181 75,334 Total Equity 666,563 555,351 Total Liabilities, Redeemable Convertible Preferred Shares, and Equity $ 1,798,229 $ 1,545,914 7
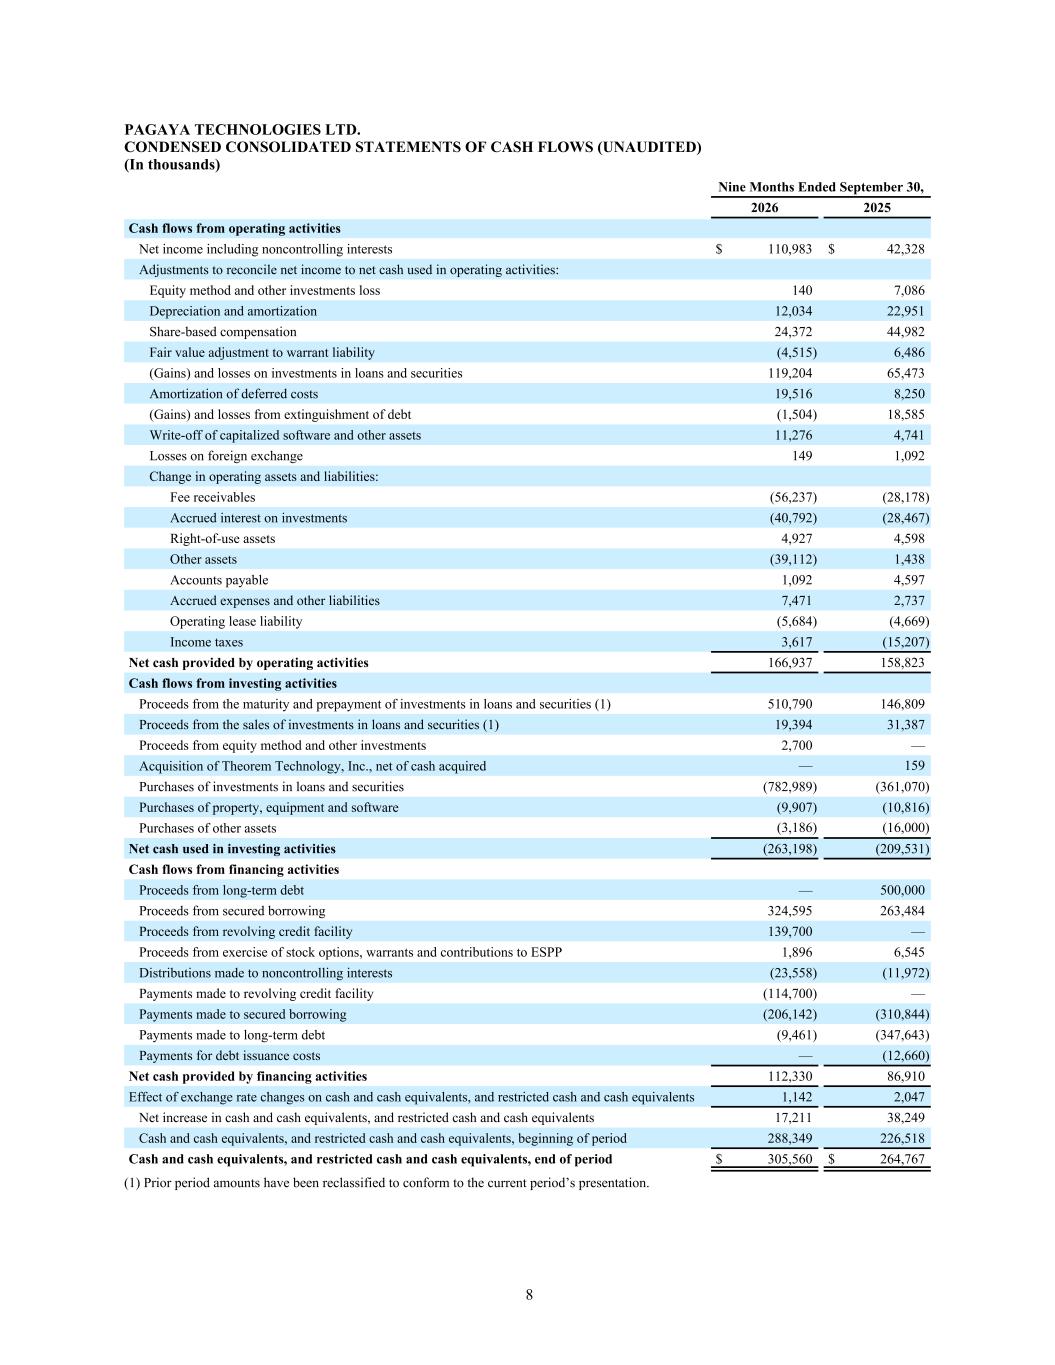
PAGAYA TECHNOLOGIES LTD. CONDENSED CONSOLIDATED STATEMENTS OF CASH FLOWS (UNAUDITED) (In thousands) Nine Months Ended September 30, 2026 2025 Cash flows from operating activities Net income including noncontrolling interests $ 110,983 $ 42,328 Adjustments to reconcile net income to net cash used in operating activities: Equity method and other investments loss 140 7,086 Depreciation and amortization 12,034 22,951 Share-based compensation 24,372 44,982 Fair value adjustment to warrant liability (4,515) 6,486 (Gains) and losses on investments in loans and securities 119,204 65,473 Amortization of deferred costs 19,516 8,250 (Gains) and losses from extinguishment of debt (1,504) 18,585 Write-off of capitalized software and other assets 11,276 4,741 Losses on foreign exchange 149 1,092 Change in operating assets and liabilities: Fee receivables (56,237) (28,178) Accrued interest on investments (40,792) (28,467) Right-of-use assets 4,927 4,598 Other assets (39,112) 1,438 Accounts payable 1,092 4,597 Accrued expenses and other liabilities 7,471 2,737 Operating lease liability (5,684) (4,669) Income taxes 3,617 (15,207) Net cash provided by operating activities 166,937 158,823 Cash flows from investing activities Proceeds from the maturity and prepayment of investments in loans and securities (1) 510,790 146,809 Proceeds from the sales of investments in loans and securities (1) 19,394 31,387 Proceeds from equity method and other investments 2,700 — Acquisition of Theorem Technology, Inc., net of cash acquired — 159 Purchases of investments in loans and securities (782,989) (361,070) Purchases of property, equipment and software (9,907) (10,816) Purchases of other assets (3,186) (16,000) Net cash used in investing activities (263,198) (209,531) Cash flows from financing activities Proceeds from long-term debt — 500,000 Proceeds from secured borrowing 324,595 263,484 Proceeds from revolving credit facility 139,700 — Proceeds from exercise of stock options, warrants and contributions to ESPP 1,896 6,545 Distributions made to noncontrolling interests (23,558) (11,972) Payments made to revolving credit facility (114,700) — Payments made to secured borrowing (206,142) (310,844) Payments made to long-term debt (9,461) (347,643) Payments for debt issuance costs — (12,660) Net cash provided by financing activities 112,330 86,910 Effect of exchange rate changes on cash and cash equivalents, and restricted cash and cash equivalents 1,142 2,047 Net increase in cash and cash equivalents, and restricted cash and cash equivalents 17,211 38,249 Cash and cash equivalents, and restricted cash and cash equivalents, beginning of period 288,349 226,518 Cash and cash equivalents, and restricted cash and cash equivalents, end of period $ 305,560 $ 264,767 (1) Prior period amounts have been reclassified to conform to the current period’s presentation. 8
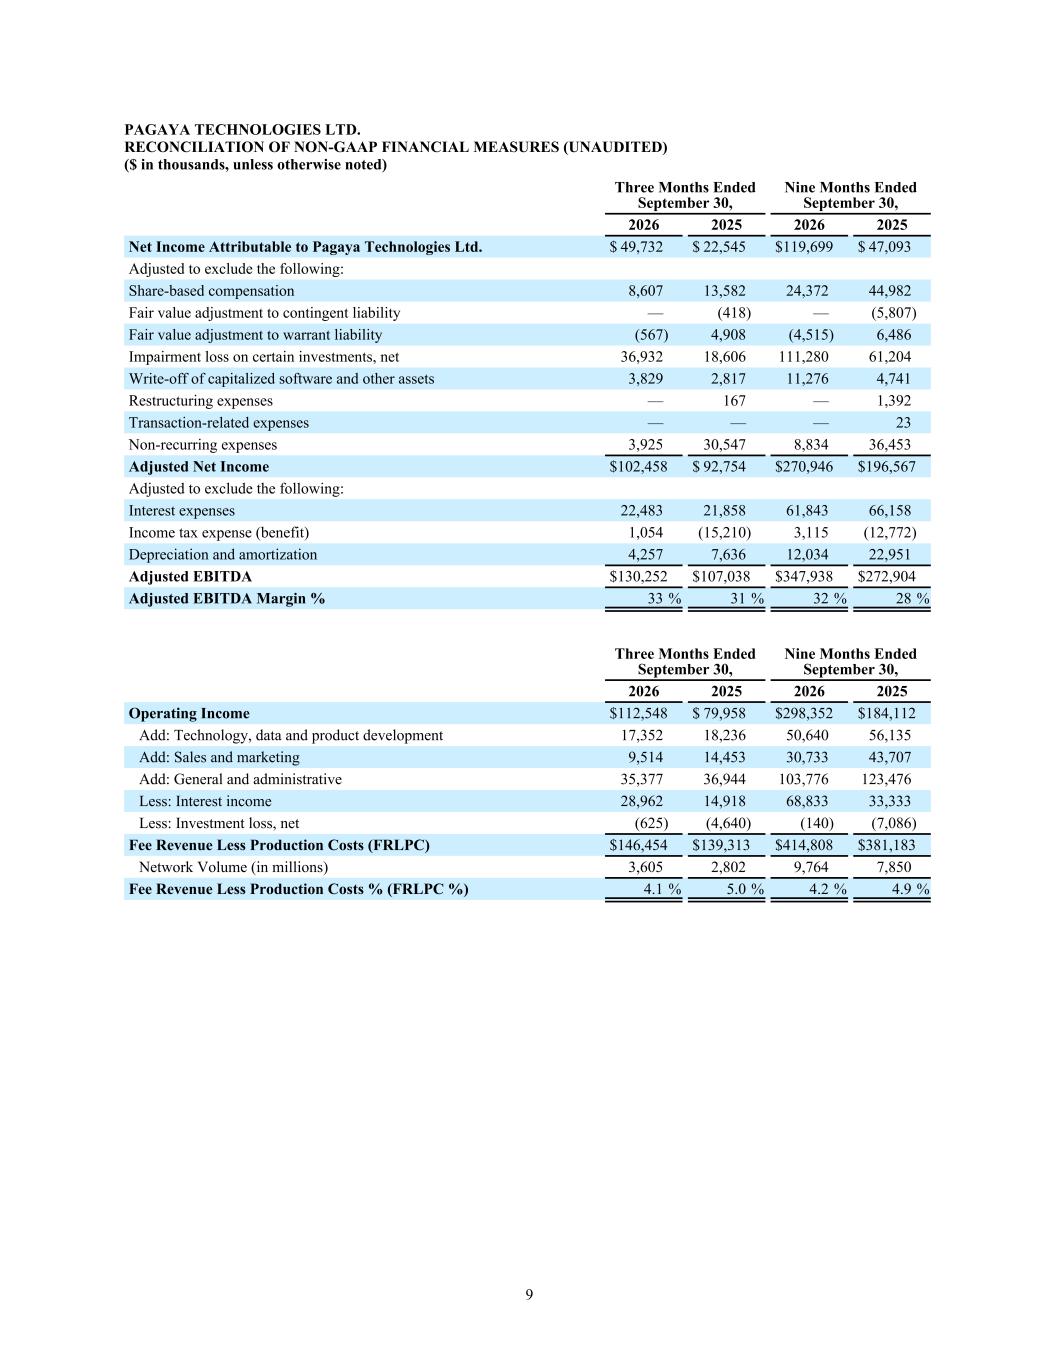
PAGAYA TECHNOLOGIES LTD. RECONCILIATION OF NON-GAAP FINANCIAL MEASURES (UNAUDITED) ($ in thousands, unless otherwise noted) Three Months Ended September 30, Nine Months Ended September 30, 2026 2025 2026 2025 Net Income Attributable to Pagaya Technologies Ltd. $ 49,732 $ 22,545 $ 119,699 $ 47,093 Adjusted to exclude the following: Share-based compensation 8,607 13,582 24,372 44,982 Fair value adjustment to contingent liability — (418) — (5,807) Fair value adjustment to warrant liability (567) 4,908 (4,515) 6,486 Impairment loss on certain investments, net 36,932 18,606 111,280 61,204 Write-off of capitalized software and other assets 3,829 2,817 11,276 4,741 Restructuring expenses — 167 — 1,392 Transaction-related expenses — — — 23 Non-recurring expenses 3,925 30,547 8,834 36,453 Adjusted Net Income $ 102,458 $ 92,754 $ 270,946 $ 196,567 Adjusted to exclude the following: Interest expenses 22,483 21,858 61,843 66,158 Income tax expense (benefit) 1,054 (15,210) 3,115 (12,772) Depreciation and amortization 4,257 7,636 12,034 22,951 Adjusted EBITDA $ 130,252 $ 107,038 $ 347,938 $ 272,904 Adjusted EBITDA Margin % 33 % 31 % 32 % 28 % Three Months Ended September 30, Nine Months Ended September 30, 2026 2025 2026 2025 Operating Income $ 112,548 $ 79,958 $ 298,352 $ 184,112 Add: Technology, data and product development 17,352 18,236 50,640 56,135 Add: Sales and marketing 9,514 14,453 30,733 43,707 Add: General and administrative 35,377 36,944 103,776 123,476 Less: Interest income 28,962 14,918 68,833 33,333 Less: Investment loss, net (625) (4,640) (140) (7,086) Fee Revenue Less Production Costs (FRLPC) $ 146,454 $ 139,313 $ 414,808 $ 381,183 Network Volume (in millions) 3,605 2,802 9,764 7,850 Fee Revenue Less Production Costs % (FRLPC %) 4.1 % 5.0 % 4.2 % 4.9 % 9
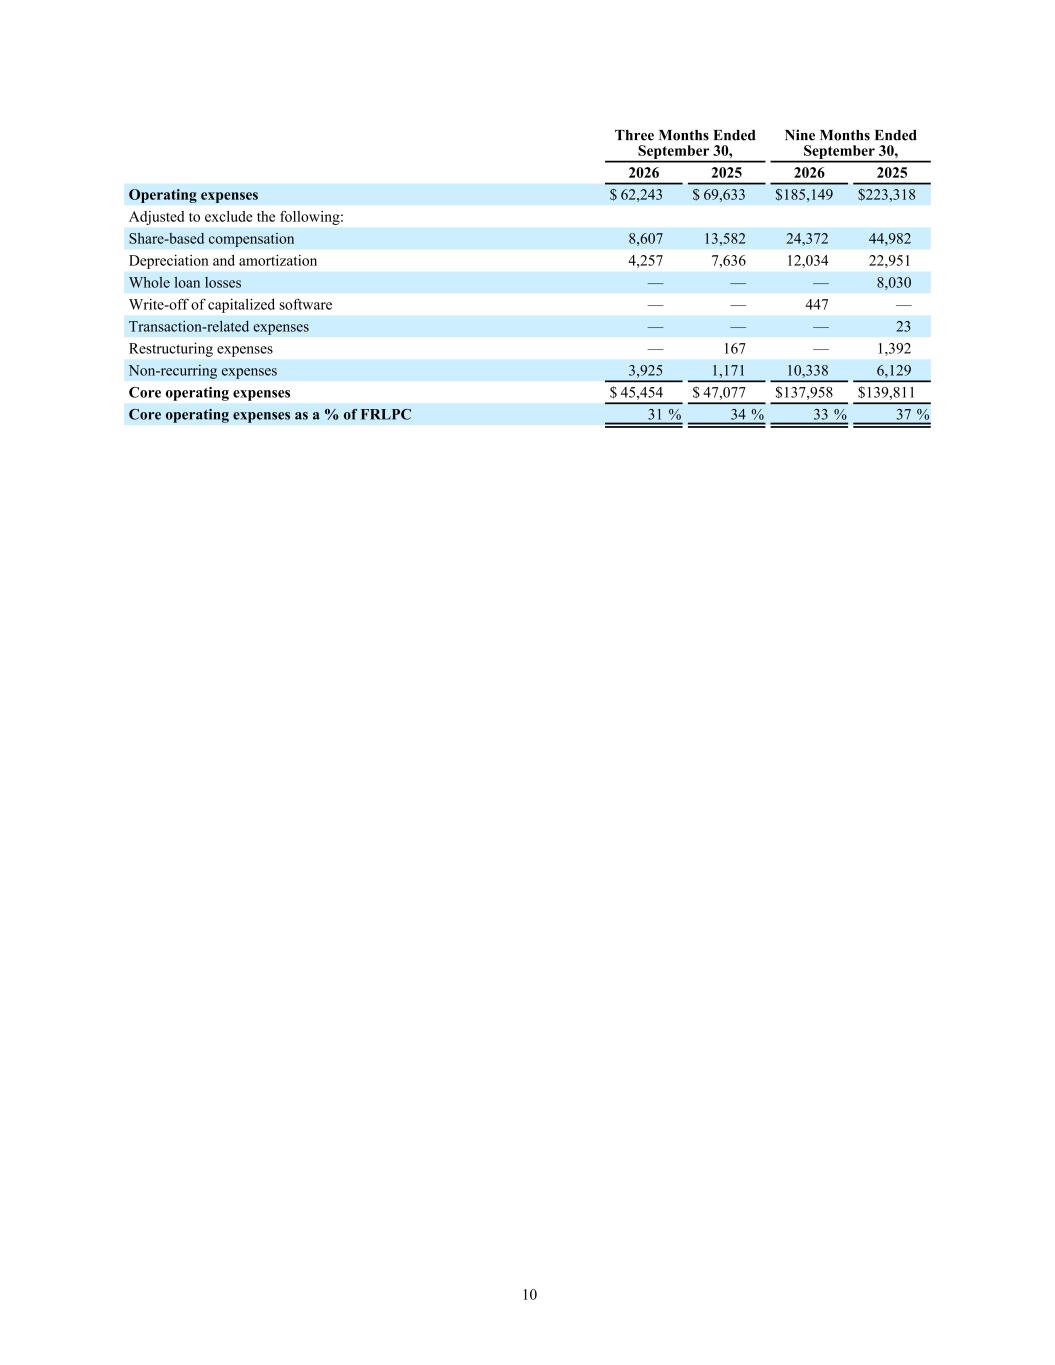
Three Months Ended September 30, Nine Months Ended September 30, 2026 2025 2026 2025 Operating expenses $ 62,243 $ 69,633 $ 185,149 $ 223,318 Adjusted to exclude the following: Share-based compensation 8,607 13,582 24,372 44,982 Depreciation and amortization 4,257 7,636 12,034 22,951 Whole loan losses — — — 8,030 Write-off of capitalized software — — 447 — Transaction-related expenses — — — 23 Restructuring expenses — 167 — 1,392 Non-recurring expenses 3,925 1,171 10,338 6,129 Core operating expenses $ 45,454 $ 47,077 $ 137,958 $ 139,811 Core operating expenses as a % of FRLPC 31 % 34 % 33 % 37 % 10