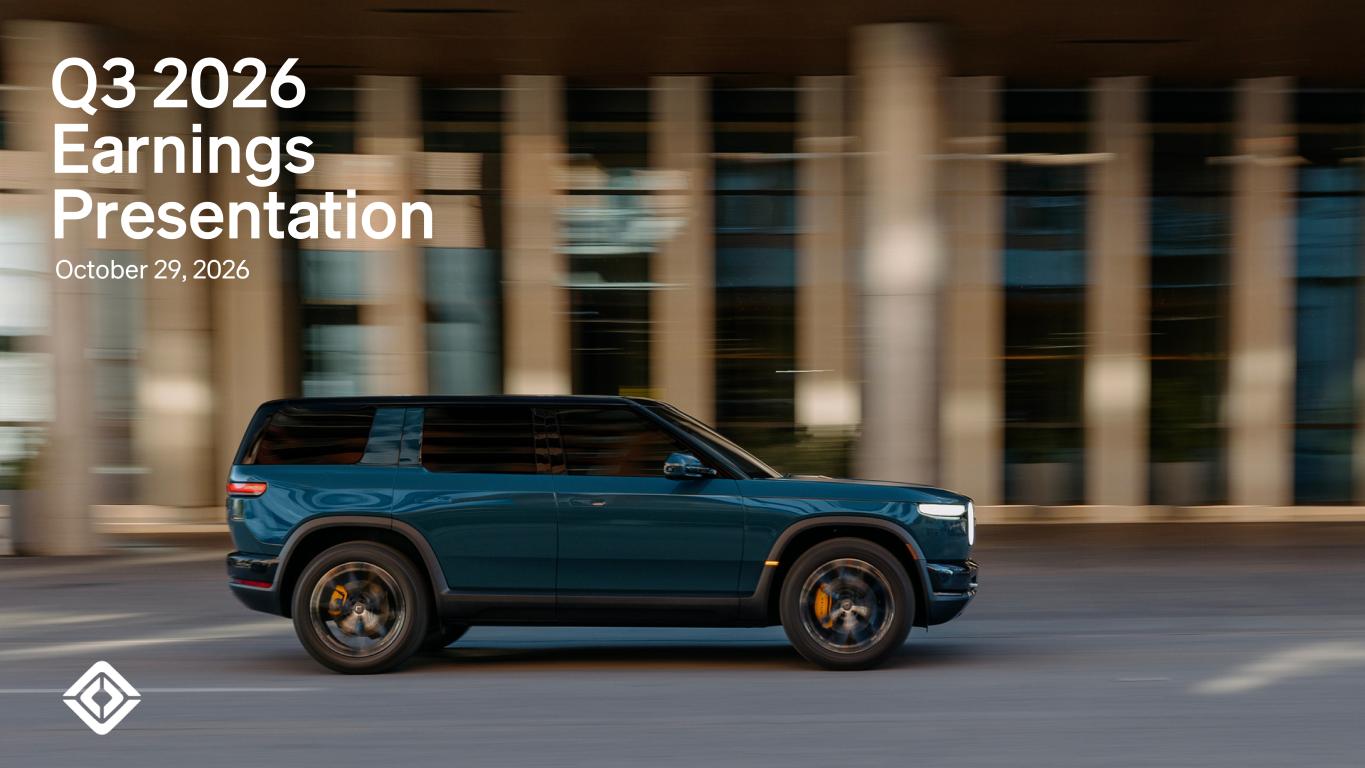
October 29, 2026 Q3 2026 Earnings Presentation
2Q3 2026 Earnings Presentation © 2026 Rivian. All rights reserved. Public Disclosure Statement Forward Looking Statements This earnings presentation and statements that are made on our earnings call contain forward-looking statements within the meaning of the Private Securities Litigation Reform Act of 1995. All statements contained in this earnings presentation and made on our earnings call that do not relate to matters of historical fact should be considered forward-looking statements, including without limitation statements regarding our future operations, initiatives and business strategy, including our future financial results, vehicle profitability and future gross profits, our future capital expenditures, the underlying trends in our business (including customer preferences and expectation), macroeconomic and policy conditions, including changes to the availability of government and economic incentives, including tax credits, for electric vehicles, our market opportunity, and our potential for growth, our production ramp and manufacturing capacity expansion and anticipated production levels, the timeline for construction activity at the Georgia plant, the timeline for drawing on our Department of Energy Loan, our expected future production and deliveries, our expected future products and technology and product enhancements, including enhanced performance features and pricing (including the timing of launches and customer deliveries), our roadmap and timeline for the release of our next-generation vehicle autonomy systems, hardware, and software architecture underpinned by artificial intelligence, including LDM, Rivian Assistant, Universal Hands-Free, RUI, and Point to Point, future revenue opportunities, including with respect to the emerging autonomous driving market, our joint venture with Volkswagen Group, including the expected benefits from the partnership and future Volkswagen Group investments, our partnership with Uber Technologies, Inc., including the expected benefits from the partnership and future Uber investments, the achievement of certain milestones and regulatory approval, the timeline, total purchase, and deployment plans for fully autonomous R2 robotaxis by Uber and its fleet partners, the expected benefits of the Third Dimension AI acquisition, and expected benefits from partnerships with other third parties. These statements are neither promises nor guarantees and involve known and unknown risks, uncertainties, and other important factors that may cause our actual results, performance, or achievements to be materially different from any future results, performance, or achievements expressed or implied by the forward-looking statements, including, but not limited to: our history of losses as a growth-stage company and our limited operating history; we may underestimate or not effectively manage the cost of revenues, operating expenses, and capital expenditures associated with our business and operations; that we will require additional financings to raise capital to support our business; our ability to attract and retain a large number of consumers and maintain strong demand for our vehicles, software and services; the highly competitive automotive and software and services markets in which we operate; demand for and consumers’ willingness to adopt electric vehicles; that our long-term results depend upon our ability to successfully introduce, integrate and market new products and services; that we have experienced and may in the future experience significant delays in the manufacture and delivery of our vehicles; risks associated with the development of complex software and hardware in coordination with our joint venture with Volkswagen Group and our other vendors and suppliers; risks associated with our joint venture with Volkswagen Group; risks associated with additional strategic alliances or acquisitions; we have experienced and could experience in the future cost increases and disruptions in supply of raw materials, components, or equipment used to produce our vehicles; our dependence on establishing and maintaining relationships with vendors and suppliers; our ability to accurately estimate the supply and demand for our vehicles and predict our manufacturing requirements; our ability to scale our business and manage future growth effectively; our ability to maintain our relationship with one customer that has generated a significant portion of our revenues; that we are highly dependent on the services and reputation of our Founder and Chief Executive Officer; the unavailability, reduction or elimination of government and economic incentives and credits for electric vehicles; that we may not be able to obtain or agree on acceptable terms and conditions for all or a significant portion of the government grants, loans, and other incentives, including regulatory credits, for which we apply or are approved for; risks associated with breaches in data security, failure of technology systems, cyber-attacks or other security or privacy-related incidents; risk of intellectual property infringement claims; effect of trade tariffs or other trade barriers; effects of export and import control laws; risks related to motor vehicle safety standards; delays, limitations and risks related to permits and other approvals required to build, operate or expand operations including the construction and development of facilities to support R2; and the other factors described in our filings with the SEC. These factors could cause actual results to differ materially from those indicated by the forward-looking statements made in this earnings presentation. Any such forward- looking statements represent management’s estimates as of the date of this earnings presentation. While we may elect to update such forward-looking statements at some point in the future, except as may be required by law, we disclaim any obligation to do so, even if subsequent events cause our views to change. Non-GAAP Financial Measures In addition to our results determined in accordance with generally accepted accounting principles in the United States (“GAAP”), we review financial measures that are not calculated and presented in accordance with GAAP (“non-GAAP financial measures”). We believe our non-GAAP financial measures are useful in evaluating our operating performance. We use the following non-GAAP financial information, collectively, to evaluate our ongoing operations and for internal planning and forecasting purposes. We believe that non-GAAP financial information, when taken collectively, may be helpful to investors, because it focuses on underlying operating results and trends, provides consistency and comparability with past financial performance, and assists in comparisons with other companies, some of which use similar non-GAAP financial information to supplement their GAAP results. The non-GAAP financial information is presented for supplemental informational purposes only, should not be considered a substitute for financial information presented in accordance with GAAP, and may be different from similarly titled non-GAAP measures used by other companies. A reconciliation of each historical non-GAAP financial measure to the most directly comparable financial measure stated in accordance with GAAP is provided in the appendix. Reconciliations of forward- looking non-GAAP financial measures are not provided because we are unable to provide such reconciliations without unreasonable effort due to the uncertainty regarding, and potential variability of, certain items, such as stock-based compensation expense and other costs and expenses that may be incurred in the future. Investors are encouraged to review the related GAAP financial measures and the reconciliation of these non-GAAP financial measures to their most directly comparable GAAP financial measures.
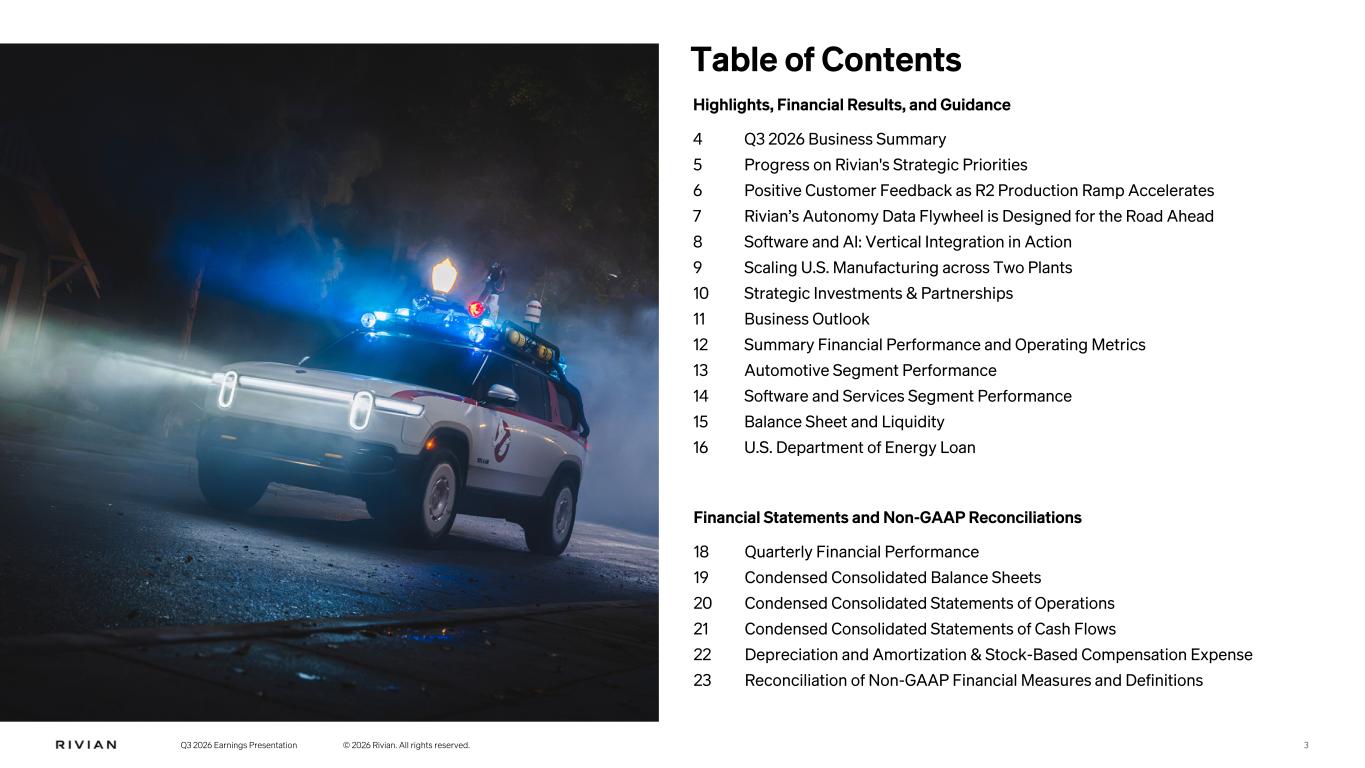
Highlights, Financial Results, and Guidance 4 Q3 2026 Business Summary 5 Progress on Rivian's Strategic Priorities 6 Positive Customer Feedback as R2 Production Ramp Accelerates 7 Rivian’s Autonomy Data Flywheel is Designed for the Road Ahead 8 Software and AI: Vertical Integration in Action 9 Scaling U.S. Manufacturing across Two Plants 10 Strategic Investments & Partnerships 11 Business Outlook 12 Summary Financial Performance and Operating Metrics 13 Automotive Segment Performance 14 Software and Services Segment Performance 15 Balance Sheet and Liquidity 16 U.S. Department of Energy Loan Financial Statements and Non-GAAP Reconciliations 18 Quarterly Financial Performance 19 Condensed Consolidated Balance Sheets 20 Condensed Consolidated Statements of Operations 21 Condensed Consolidated Statements of Cash Flows 22 Depreciation and Amortization & Stock-Based Compensation Expense 23 Reconciliation of Non-GAAP Financial Measures and Definitions 3Q3 2026 Earnings Presentation © 2026 Rivian. All rights reserved. Table of Contents
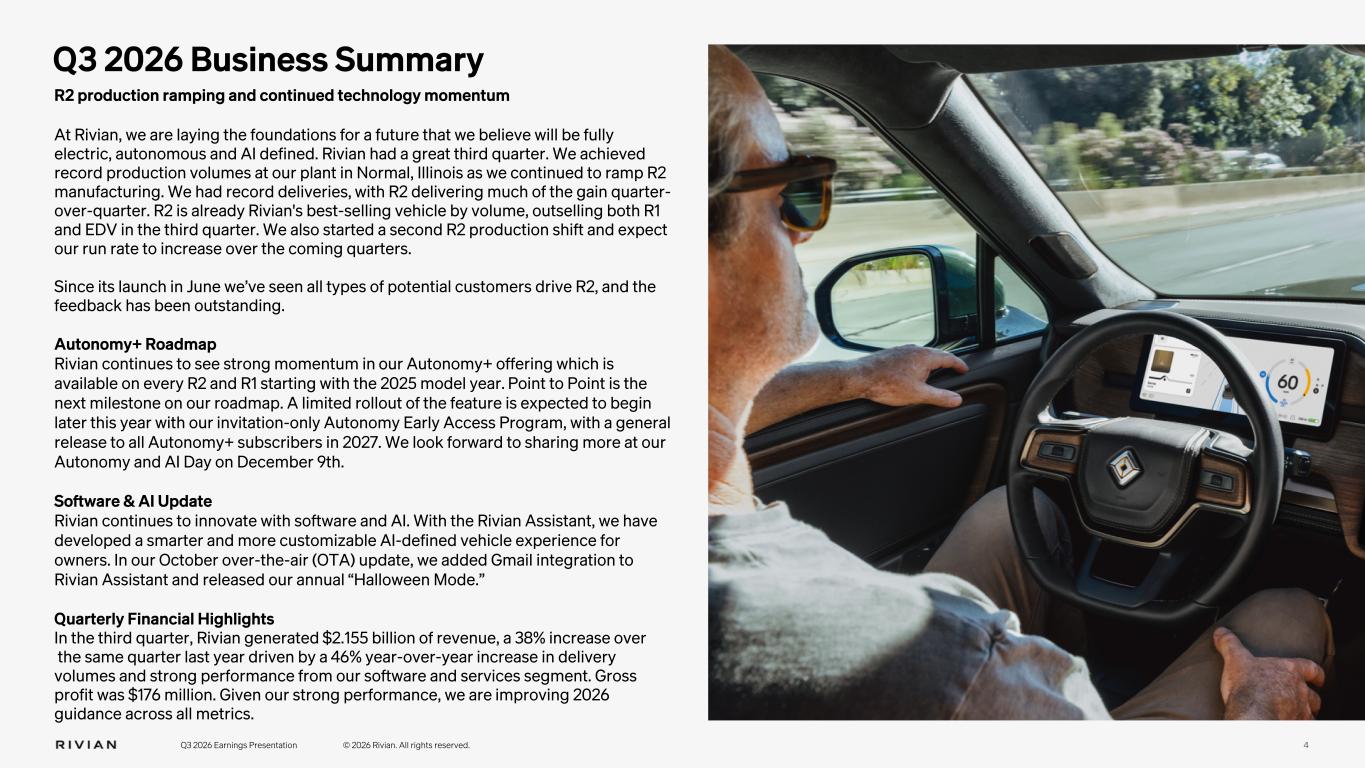
At Rivian, we are laying the foundations for a future that we believe will be fully electric, autonomous and AI defined. Rivian had a great third quarter. We achieved record production volumes at our plant in Normal, Illinois as we continued to ramp R2 manufacturing. We had record deliveries, with R2 delivering much of the gain quarter- over-quarter. R2 is already Rivian's best-selling vehicle by volume, outselling both R1 and EDV in the third quarter. We also started a second R2 production shift and expect our run rate to increase over the coming quarters. Since its launch in June we’ve seen all types of potential customers drive R2, and the feedback has been outstanding. Autonomy+ Roadmap Rivian continues to see strong momentum in our Autonomy+ offering which is available on every R2 and R1 starting with the 2025 model year. Point to Point is the next milestone on our roadmap. A limited rollout of the feature is expected to begin later this year with our invitation-only Autonomy Early Access Program, with a general release to all Autonomy+ subscribers in 2027. We look forward to sharing more at our Autonomy and AI Day on December 9th. Software & AI Update Rivian continues to innovate with software and AI. With the Rivian Assistant, we have developed a smarter and more customizable AI-defined vehicle experience for owners. In our October over-the-air (OTA) update, we added Gmail integration to Rivian Assistant and released our annual “Halloween Mode.” Quarterly Financial Highlights In the third quarter, Rivian generated $2.155 billion of revenue, a 38% increase over the same quarter last year driven by a 46% year-over-year increase in delivery volumes and strong performance from our software and services segment. Gross profit was $176 million. Given our strong performance, we are improving 2026 guidance across all metrics. 4Q3 2026 Earnings Presentation © 2026 Rivian. All rights reserved. R2 production ramping and continued technology momentum Q3 2026 Business Summary
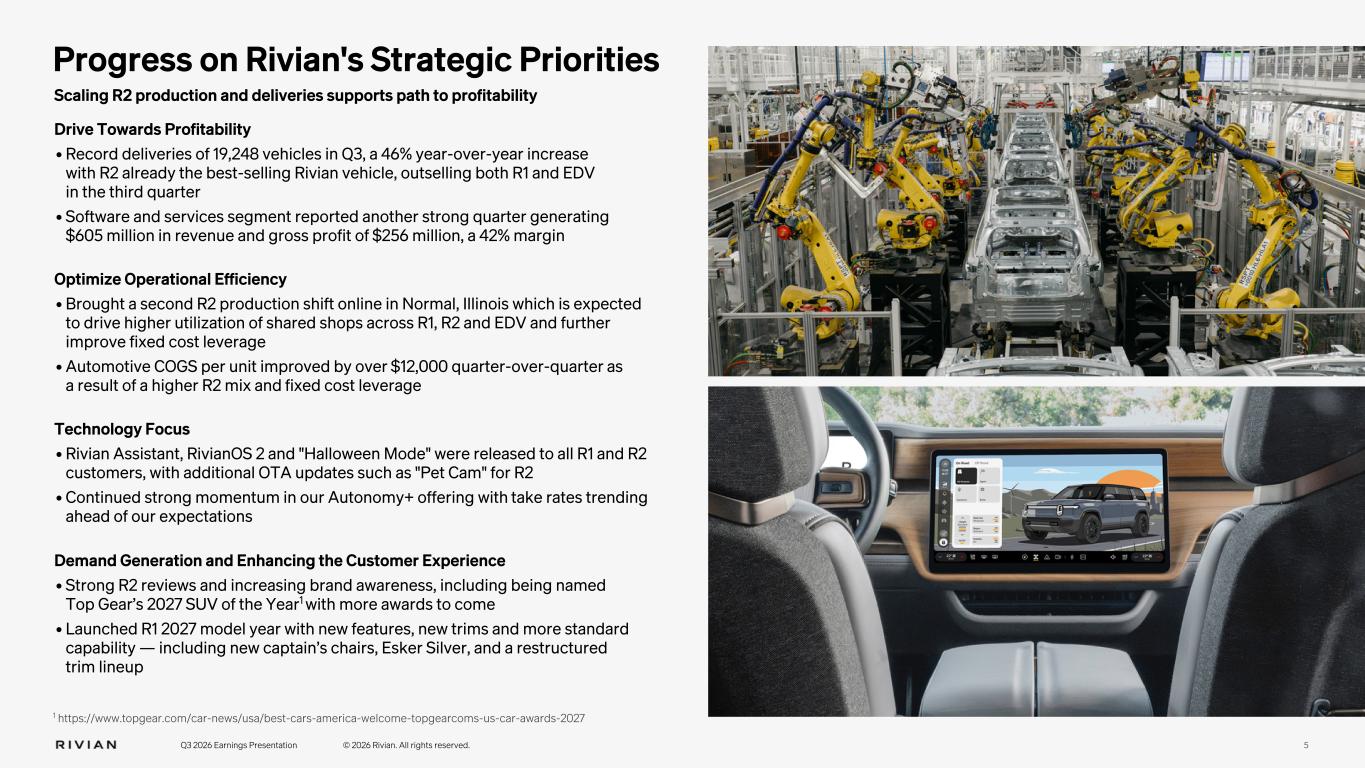
Drive Towards Profitability • Record deliveries of 19,248 vehicles in Q3, a 46% year-over-year increase with R2 already the best-selling Rivian vehicle, outselling both R1 and EDV in the third quarter • Software and services segment reported another strong quarter generating $605 million in revenue and gross profit of $256 million, a 42% margin Optimize Operational Efficiency • Brought a second R2 production shift online in Normal, Illinois which is expected to drive higher utilization of shared shops across R1, R2 and EDV and further improve fixed cost leverage • Automotive COGS per unit improved by over $12,000 quarter-over-quarter as a result of a higher R2 mix and fixed cost leverage Technology Focus • Rivian Assistant, RivianOS 2 and "Halloween Mode" were released to all R1 and R2 customers, with additional OTA updates such as "Pet Cam" for R2 • Continued strong momentum in our Autonomy+ offering with take rates trending ahead of our expectations Demand Generation and Enhancing the Customer Experience • Strong R2 reviews and increasing brand awareness, including being named Top Gear’s 2027 SUV of the Year1 with more awards to come • Launched R1 2027 model year with new features, new trims and more standard capability — including new captain’s chairs, Esker Silver, and a restructured trim lineup 1 https://www.topgear.com/car-news/usa/best-cars-america-welcome-topgearcoms-us-car-awards-2027 5Q3 2026 Earnings Presentation © 2026 Rivian. All rights reserved. Progress on Rivian's Strategic Priorities Scaling R2 production and deliveries supports path to profitability
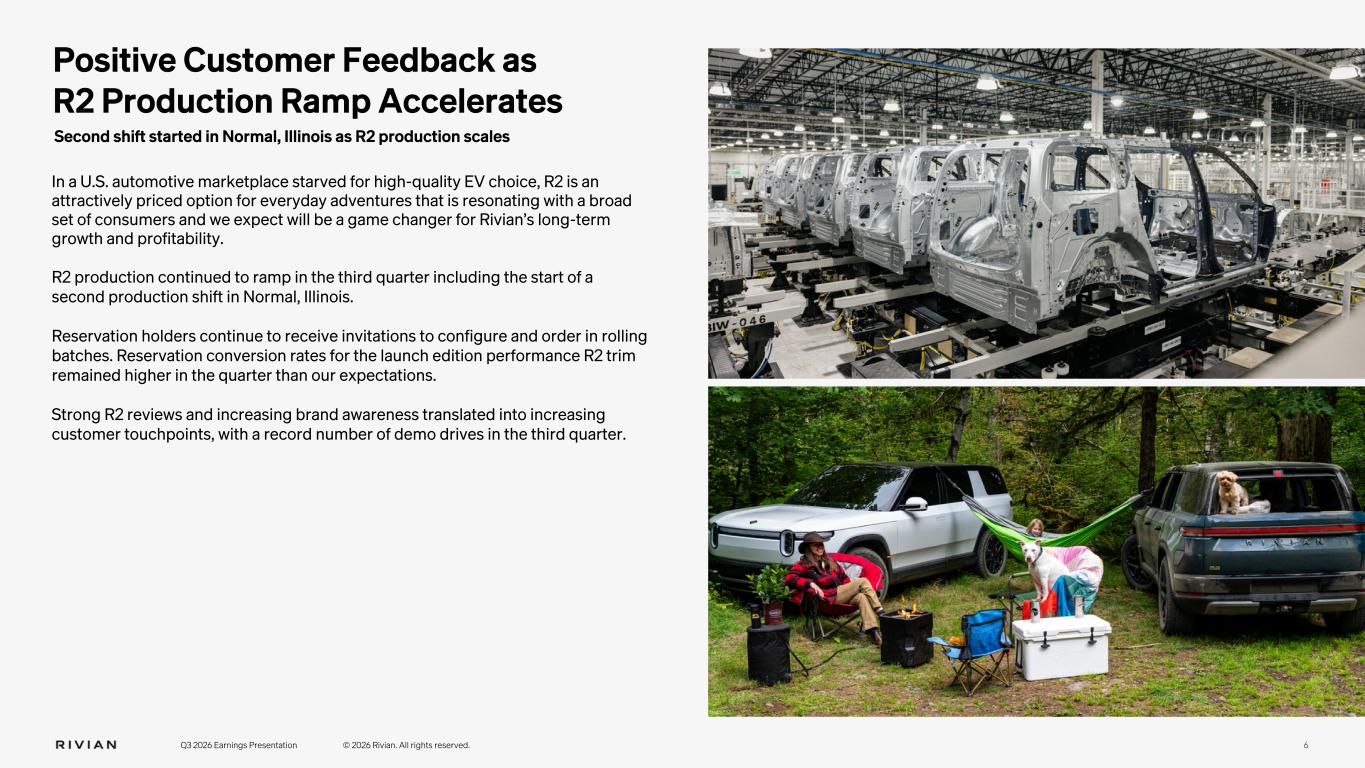
Positive Customer Feedback as R2 Production Ramp Accelerates Second shift started in Normal, Illinois as R2 production scales Q3 2026 Earnings Presentation © 2026 Rivian. All rights reserved. 6 In a U.S. automotive marketplace starved for high-quality EV choice, R2 is an attractively priced option for everyday adventures that is resonating with a broad set of consumers and we expect will be a game changer for Rivian’s long-term growth and profitability. R2 production continued to ramp in the third quarter including the start of a second production shift in Normal, Illinois. Reservation holders continue to receive invitations to configure and order in rolling batches. Reservation conversion rates for the launch edition performance R2 trim remained higher in the quarter than our expectations. Strong R2 reviews and increasing brand awareness translated into increasing customer touchpoints, with a record number of demo drives in the third quarter.
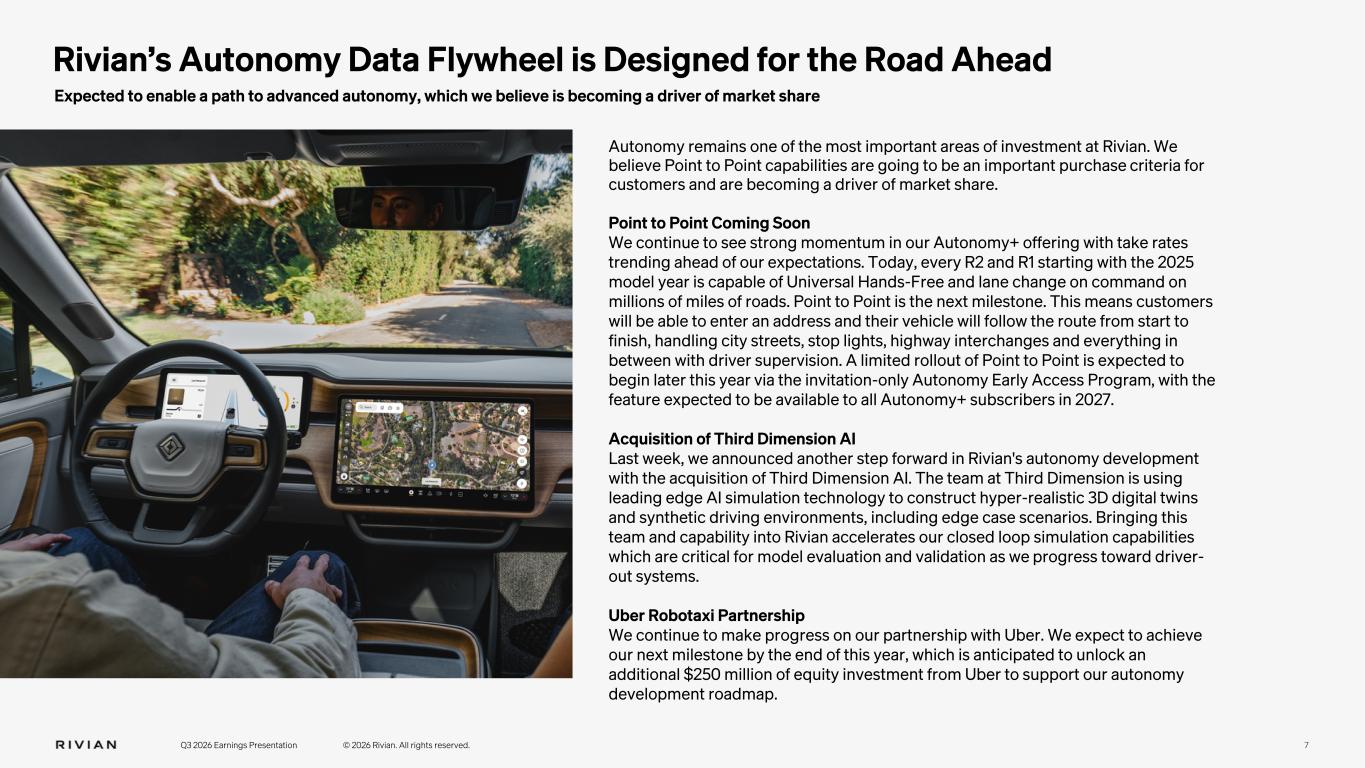
Rivian’s Autonomy Data Flywheel is Designed for the Road Ahead Expected to enable a path to advanced autonomy, which we believe is becoming a driver of market share Q3 2026 Earnings Presentation © 2026 Rivian. All rights reserved. 7 Autonomy remains one of the most important areas of investment at Rivian. We believe Point to Point capabilities are going to be an important purchase criteria for customers and are becoming a driver of market share. Point to Point Coming Soon We continue to see strong momentum in our Autonomy+ offering with take rates trending ahead of our expectations. Today, every R2 and R1 starting with the 2025 model year is capable of Universal Hands-Free and lane change on command on millions of miles of roads. Point to Point is the next milestone. This means customers will be able to enter an address and their vehicle will follow the route from start to finish, handling city streets, stop lights, highway interchanges and everything in between with driver supervision. A limited rollout of Point to Point is expected to begin later this year via the invitation-only Autonomy Early Access Program, with the feature expected to be available to all Autonomy+ subscribers in 2027. Acquisition of Third Dimension AI Last week, we announced another step forward in Rivian's autonomy development with the acquisition of Third Dimension AI. The team at Third Dimension is using leading edge AI simulation technology to construct hyper-realistic 3D digital twins and synthetic driving environments, including edge case scenarios. Bringing this team and capability into Rivian accelerates our closed loop simulation capabilities which are critical for model evaluation and validation as we progress toward driver- out systems. Uber Robotaxi Partnership We continue to make progress on our partnership with Uber. We expect to achieve our next milestone by the end of this year, which is anticipated to unlock an additional $250 million of equity investment from Uber to support our autonomy development roadmap.
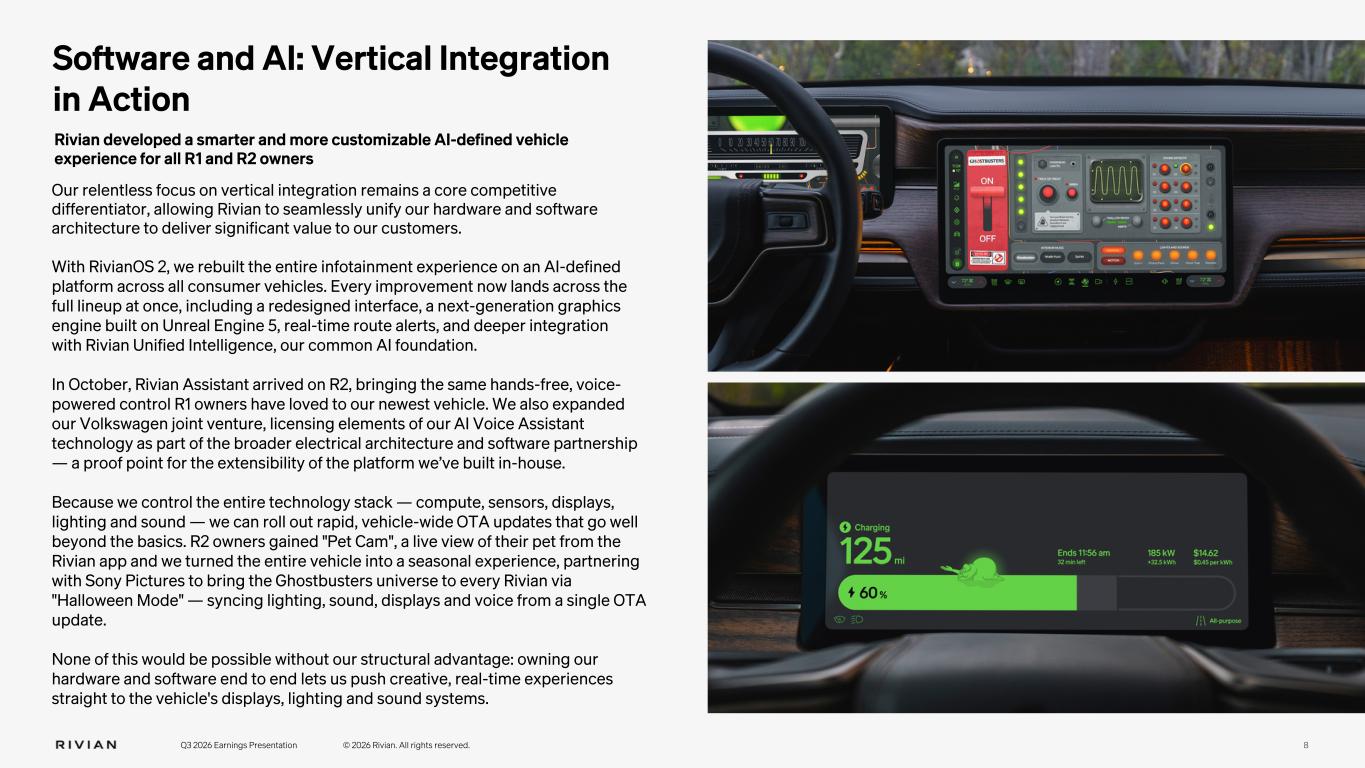
Software and AI: Vertical Integration in Action Rivian developed a smarter and more customizable AI-defined vehicle experience for all R1 and R2 owners Our relentless focus on vertical integration remains a core competitive differentiator, allowing Rivian to seamlessly unify our hardware and software architecture to deliver significant value to our customers. With RivianOS 2, we rebuilt the entire infotainment experience on an AI-defined platform across all consumer vehicles. Every improvement now lands across the full lineup at once, including a redesigned interface, a next-generation graphics engine built on Unreal Engine 5, real-time route alerts, and deeper integration with Rivian Unified Intelligence, our common AI foundation. In October, Rivian Assistant arrived on R2, bringing the same hands-free, voice- powered control R1 owners have loved to our newest vehicle. We also expanded our Volkswagen joint venture, licensing elements of our AI Voice Assistant technology as part of the broader electrical architecture and software partnership — a proof point for the extensibility of the platform we’ve built in-house. Because we control the entire technology stack — compute, sensors, displays, lighting and sound — we can roll out rapid, vehicle-wide OTA updates that go well beyond the basics. R2 owners gained "Pet Cam", a live view of their pet from the Rivian app and we turned the entire vehicle into a seasonal experience, partnering with Sony Pictures to bring the Ghostbusters universe to every Rivian via "Halloween Mode" — syncing lighting, sound, displays and voice from a single OTA update. None of this would be possible without our structural advantage: owning our hardware and software end to end lets us push creative, real-time experiences straight to the vehicle's displays, lighting and sound systems. Q3 2026 Earnings Presentation © 2026 Rivian. All rights reserved. 8
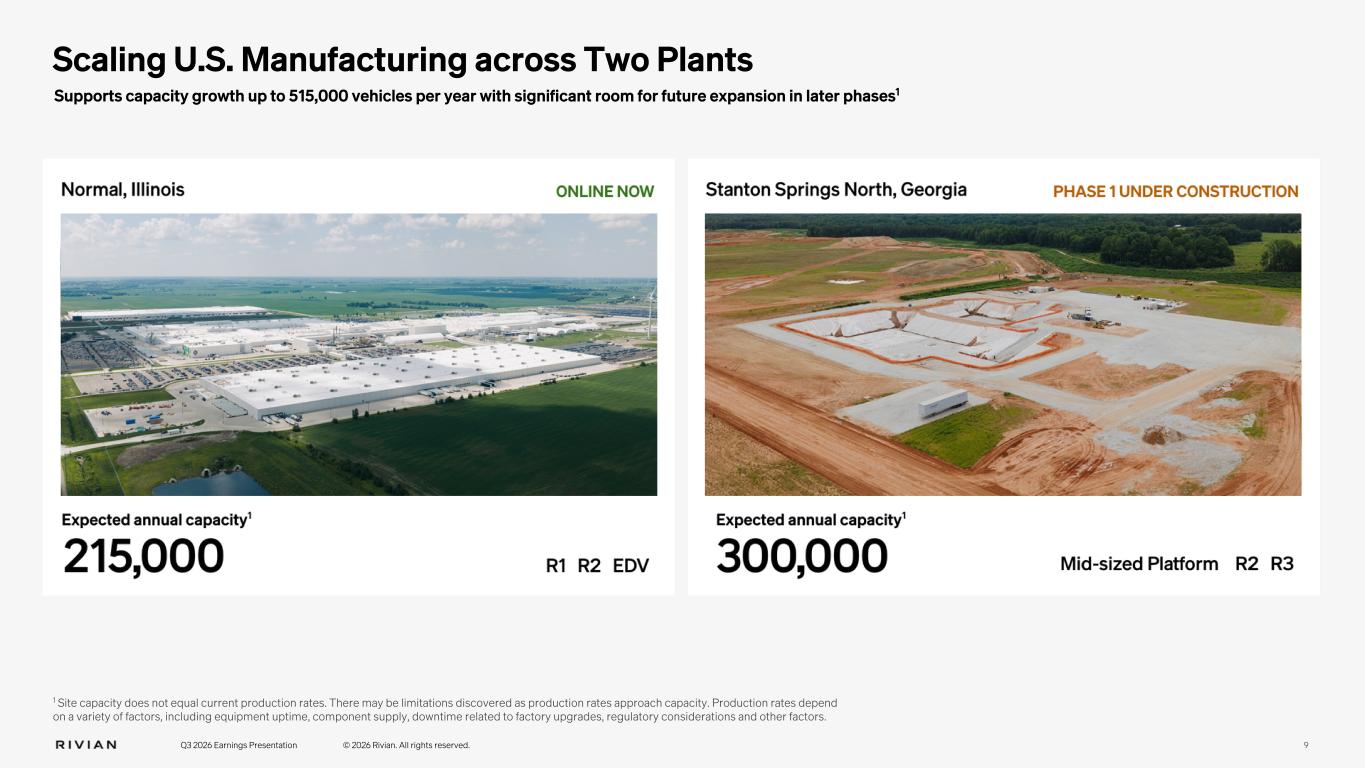
Scaling U.S. Manufacturing across Two Plants Supports capacity growth up to 515,000 vehicles per year with significant room for future expansion in later phases1 Q3 2026 Earnings Presentation © 2026 Rivian. All rights reserved. 9 1 Site capacity does not equal current production rates. There may be limitations discovered as production rates approach capacity. Production rates depend on a variety of factors, including equipment uptime, component supply, downtime related to factory upgrades, regulatory considerations and other factors.
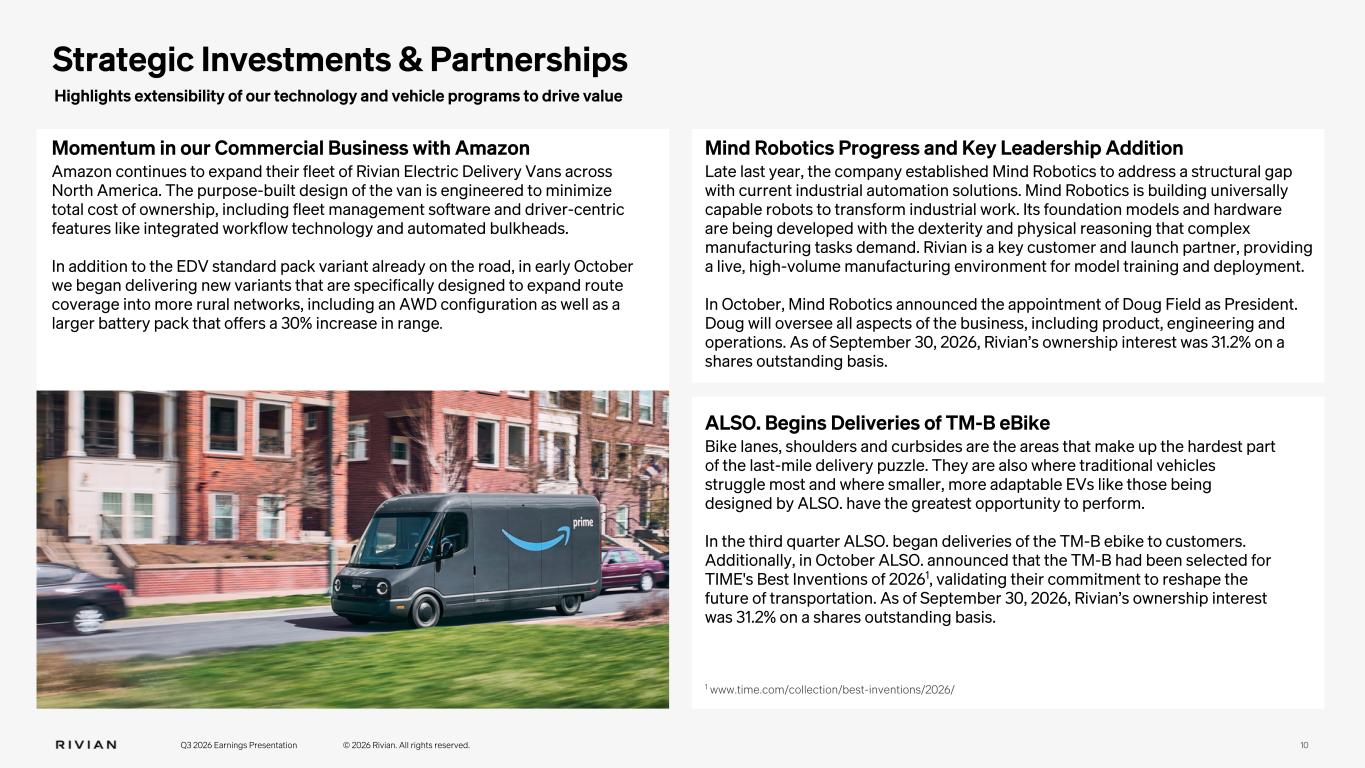
Q3 2026 Earnings Presentation © 2026 Rivian. All rights reserved. 10 Strategic Investments & Partnerships Highlights extensibility of our technology and vehicle programs to drive value Momentum in our Commercial Business with Amazon Amazon continues to expand their fleet of Rivian Electric Delivery Vans across North America. The purpose-built design of the van is engineered to minimize total cost of ownership, including fleet management software and driver-centric features like integrated workflow technology and automated bulkheads. In addition to the EDV standard pack variant already on the road, in early October we began delivering new variants that are specifically designed to expand route coverage into more rural networks, including an AWD configuration as well as a larger battery pack that offers a 30% increase in range. Mind Robotics Progress and Key Leadership Addition Late last year, the company established Mind Robotics to address a structural gap with current industrial automation solutions. Mind Robotics is building universally capable robots to transform industrial work. Its foundation models and hardware are being developed with the dexterity and physical reasoning that complex manufacturing tasks demand. Rivian is a key customer and launch partner, providing a live, high-volume manufacturing environment for model training and deployment. In October, Mind Robotics announced the appointment of Doug Field as President. Doug will oversee all aspects of the business, including product, engineering and operations. As of September 30, 2026, Rivian’s ownership interest was 31.2% on a shares outstanding basis. ALSO. Begins Deliveries of TM-B eBike Bike lanes, shoulders and curbsides are the areas that make up the hardest part of the last-mile delivery puzzle. They are also where traditional vehicles struggle most and where smaller, more adaptable EVs like those being designed by ALSO. have the greatest opportunity to perform. In the third quarter ALSO. began deliveries of the TM-B ebike to customers. Additionally, in October ALSO. announced that the TM-B had been selected for TIME's Best Inventions of 20261, validating their commitment to reshape the future of transportation. As of September 30, 2026, Rivian’s ownership interest was 31.2% on a shares outstanding basis. 1 www.time.com/collection/best-inventions/2026/
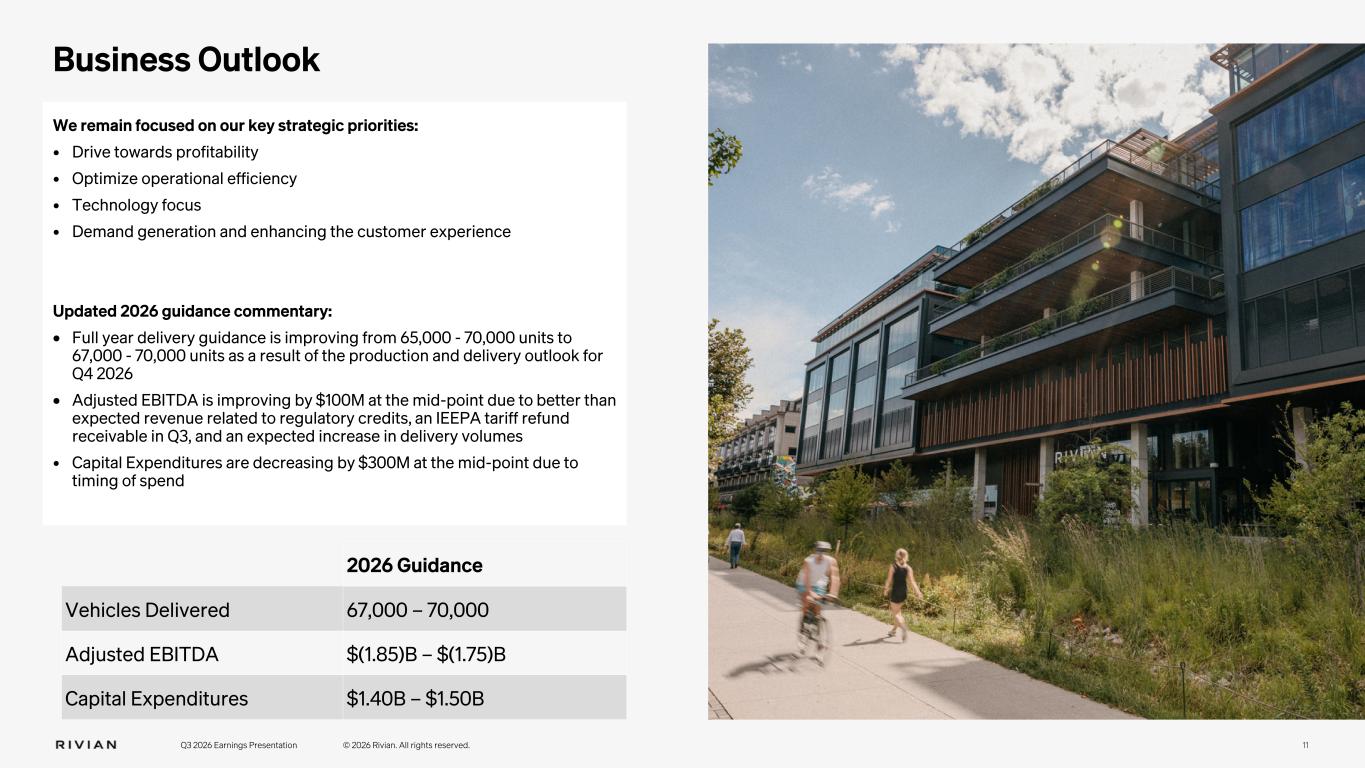
We remain focused on our key strategic priorities: • Drive towards profitability • Optimize operational efficiency • Technology focus • Demand generation and enhancing the customer experience Updated 2026 guidance commentary: • Full year delivery guidance is improving from 65,000 - 70,000 units to 67,000 - 70,000 units as a result of the production and delivery outlook for Q4 2026 • Adjusted EBITDA is improving by $100M at the mid-point due to better than expected revenue related to regulatory credits, an IEEPA tariff refund receivable in Q3, and an expected increase in delivery volumes • Capital Expenditures are decreasing by $300M at the mid-point due to timing of spend 11 2026 Guidance Vehicles Delivered 67,000 – 70,000 Adjusted EBITDA $(1.85)B – $(1.75)B Capital Expenditures $1.40B – $1.50B Q3 2026 Earnings Presentation © 2026 Rivian. All rights reserved. Business Outlook
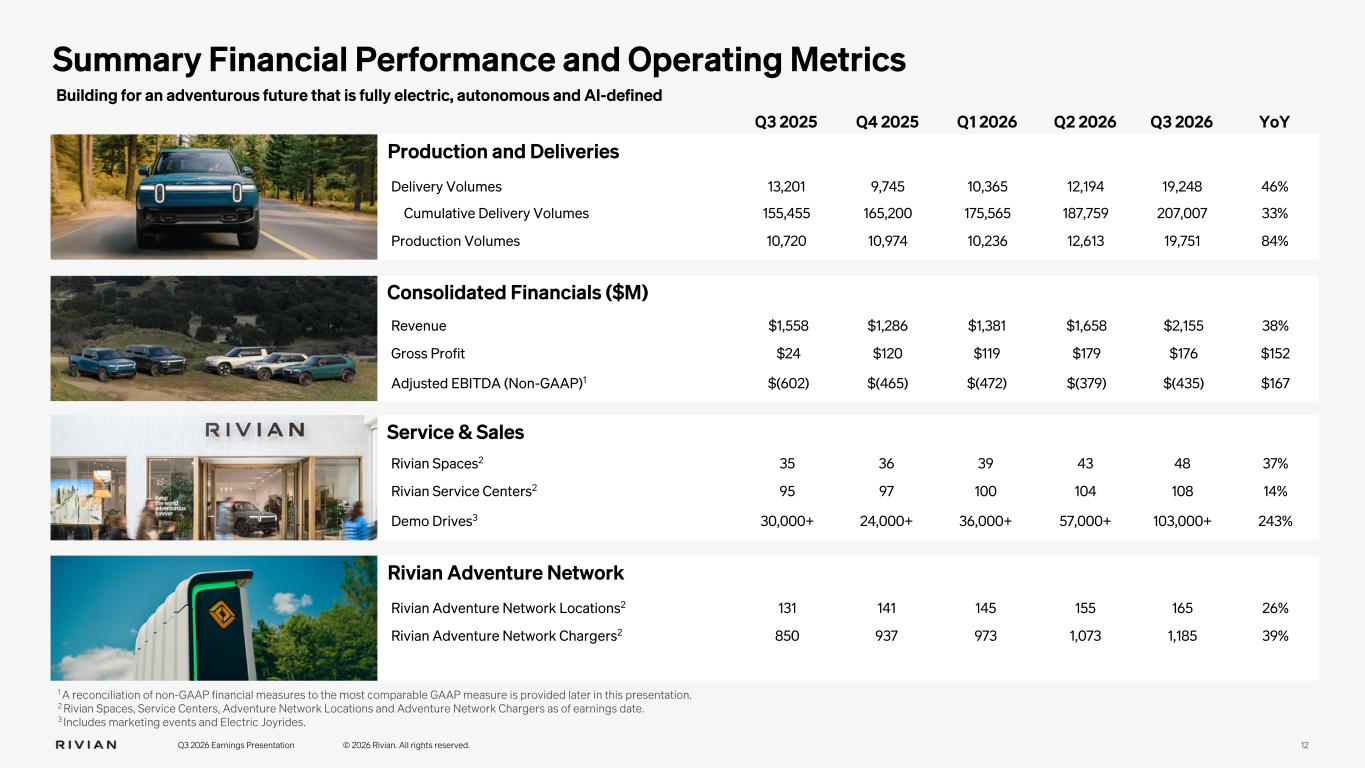
Q3 2025 Q4 2025 Q1 2026 Q2 2026 Q3 2026 YoY Production and Deliveries Consolidated Financials ($M) Building for an adventurous future that is fully electric, autonomous and AI-defined Rivian Adventure Network 12Q3 2026 Earnings Presentation © 2026 Rivian. All rights reserved. Delivery Volumes 13,201 9,745 10,365 12,194 19,248 46% Cumulative Delivery Volumes 155,455 165,200 175,565 187,759 207,007 33% Production Volumes 10,720 10,974 10,236 12,613 19,751 84% Revenue $1,558 $1,286 $1,381 $1,658 $2,155 38% Gross Profit $24 $120 $119 $179 $176 $152 Adjusted EBITDA (Non-GAAP)1 $(602) $(465) $(472) $(379) $(435) $167 1 A reconciliation of non-GAAP financial measures to the most comparable GAAP measure is provided later in this presentation. 2 Rivian Spaces, Service Centers, Adventure Network Locations and Adventure Network Chargers as of earnings date. 3 Includes marketing events and Electric Joyrides. Summary Financial Performance and Operating Metrics Service & Sales Rivian Spaces2 35 36 39 43 48 37% Rivian Service Centers2 95 97 100 104 108 14% Demo Drives3 30,000+ 24,000+ 36,000+ 57,000+ 103,000+ 243% Rivian Adventure Network Locations2 131 141 145 155 165 26% Rivian Adventure Network Chargers2 850 937 973 1,073 1,185 39%
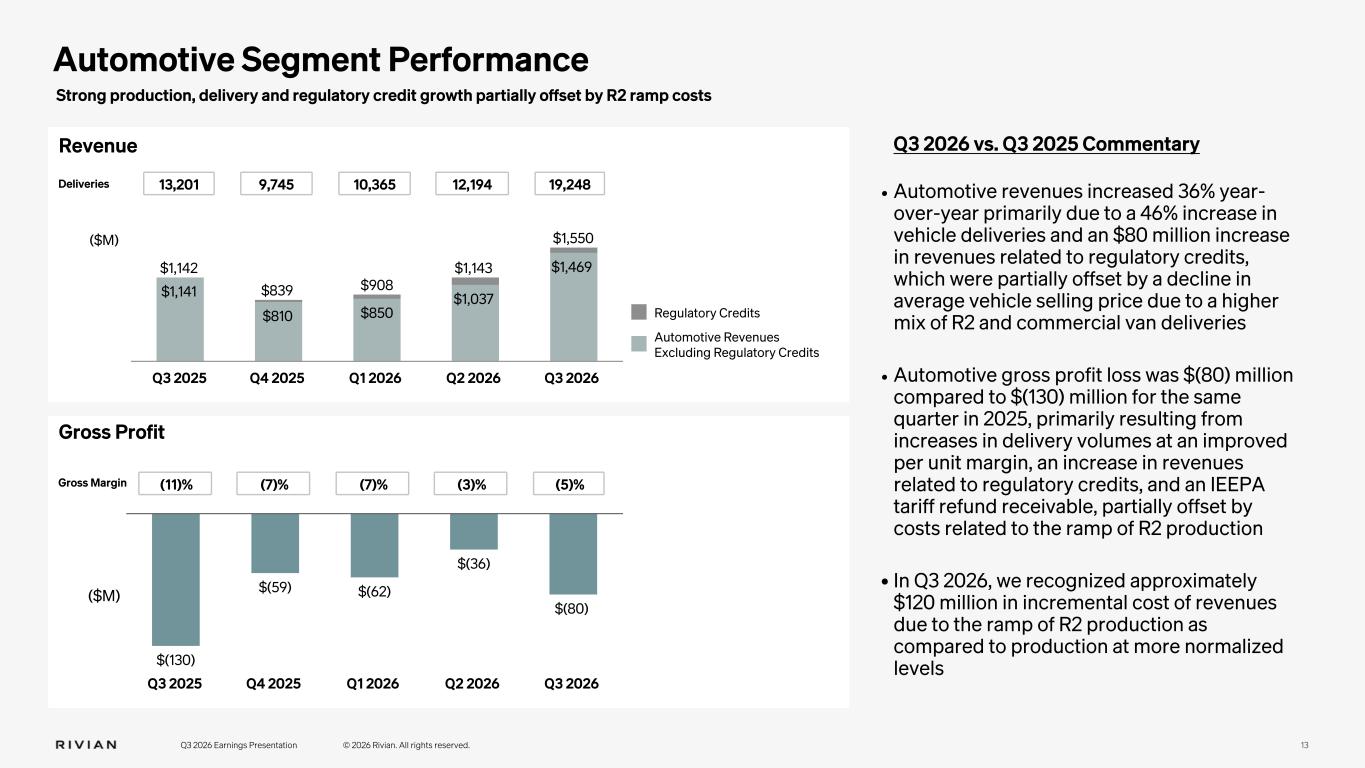
13 Deliveries Automotive Revenues Excluding Regulatory Credits Regulatory Credits Q3 2026 vs. Q3 2025 Commentary • Automotive revenues increased 36% year- over-year primarily due to a 46% increase in vehicle deliveries and an $80 million increase in revenues related to regulatory credits, which were partially offset by a decline in average vehicle selling price due to a higher mix of R2 and commercial van deliveries • Automotive gross profit loss was $(80) million compared to $(130) million for the same quarter in 2025, primarily resulting from increases in delivery volumes at an improved per unit margin, an increase in revenues related to regulatory credits, and an IEEPA tariff refund receivable, partially offset by costs related to the ramp of R2 production • In Q3 2026, we recognized approximately $120 million in incremental cost of revenues due to the ramp of R2 production as compared to production at more normalized levels Revenue Gross Profit Gross Margin Q3 2026 Earnings Presentation © 2026 Rivian. All rights reserved. $1,142 $839 $908 $1,143 $1,550 $1,141 $810 $850 $1,037 $1,469 Q3 2025 Q4 2025 Q1 2026 Q2 2026 Q3 2026 13,201 9,745 10,365 12,194 19,248 $(130) $(59) $(62) $(36) $(80) Q3 2025 Q4 2025 Q1 2026 Q2 2026 Q3 2026 (11)% (7)% (7)% (3)% (5)% Automotive Segment Performance Strong production, delivery and regulatory credit growth partially offset by R2 ramp costs ($M) ($M)
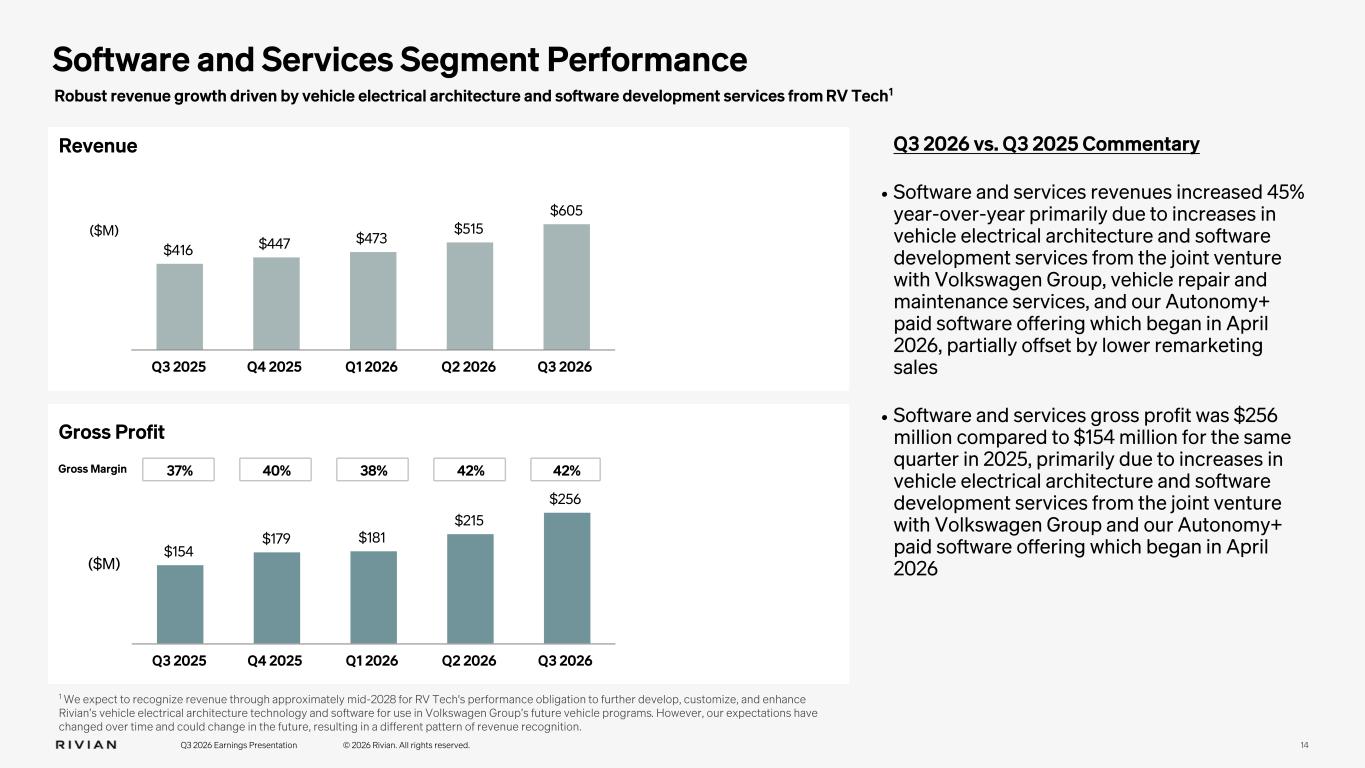
14 ($M) Q3 2026 vs. Q3 2025 Commentary • Software and services revenues increased 45% year-over-year primarily due to increases in vehicle electrical architecture and software development services from the joint venture with Volkswagen Group, vehicle repair and maintenance services, and our Autonomy+ paid software offering which began in April 2026, partially offset by lower remarketing sales • Software and services gross profit was $256 million compared to $154 million for the same quarter in 2025, primarily due to increases in vehicle electrical architecture and software development services from the joint venture with Volkswagen Group and our Autonomy+ paid software offering which began in April 2026 Q3 2026 Earnings Presentation © 2026 Rivian. All rights reserved. Robust revenue growth driven by vehicle electrical architecture and software development services from RV Tech1 $416 $447 $473 $515 $605 Q3 2025 Q4 2025 Q1 2026 Q2 2026 Q3 2026 $154 $179 $181 $215 $256 Q3 2025 Q4 2025 Q1 2026 Q2 2026 Q3 2026 37% 40% 38% 42% 42% Revenue Gross Profit Software and Services Segment Performance ($M) Gross Margin 1 We expect to recognize revenue through approximately mid-2028 for RV Tech's performance obligation to further develop, customize, and enhance Rivian’s vehicle electrical architecture technology and software for use in Volkswagen Group’s future vehicle programs. However, our expectations have changed over time and could change in the future, resulting in a different pattern of revenue recognition.
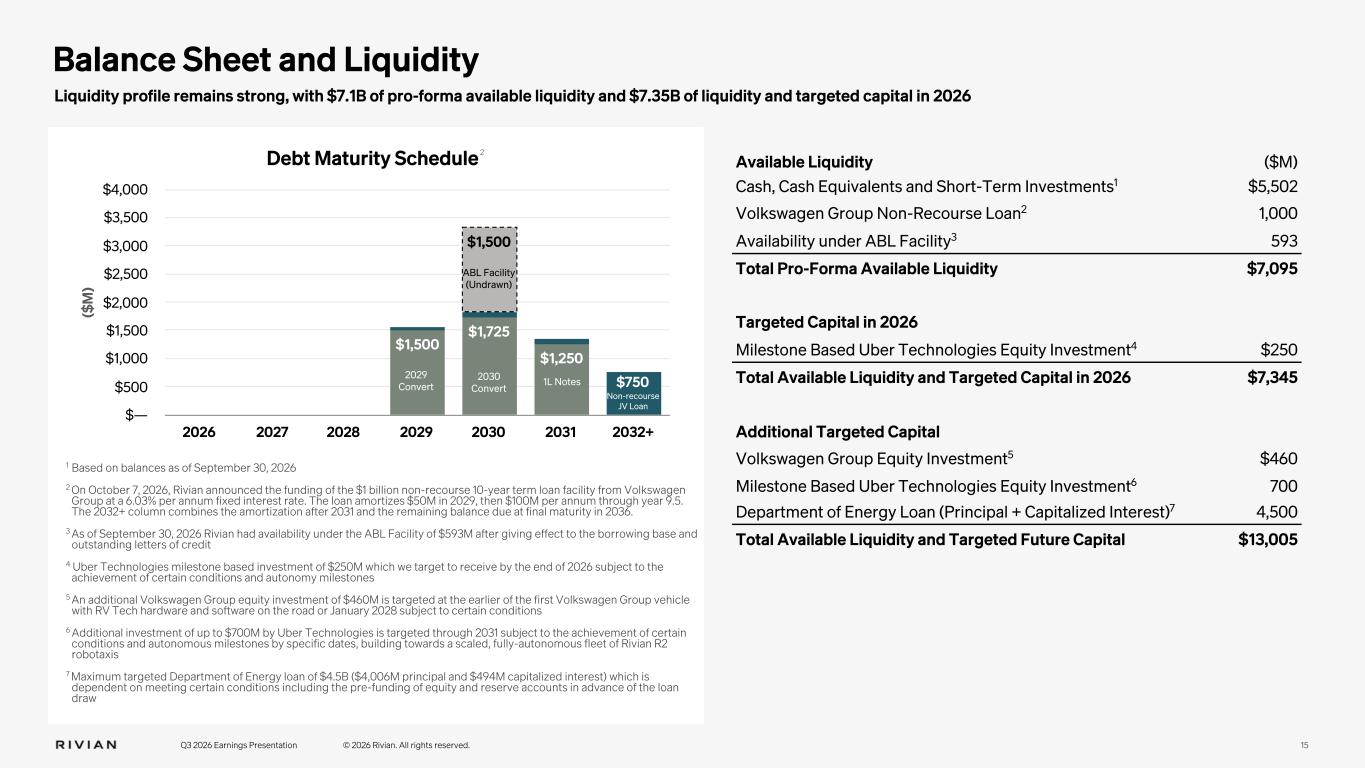
15 Liquidity profile remains strong, with $7.1B of pro-forma available liquidity and $7.35B of liquidity and targeted capital in 2026 Q3 2026 Earnings Presentation © 2026 Rivian. All rights reserved. 1 Based on balances as of September 30, 2026 2 On October 7, 2026, Rivian announced the funding of the $1 billion non-recourse 10-year term loan facility from Volkswagen Group at a 6.03% per annum fixed interest rate. The loan amortizes $50M in 2029, then $100M per annum through year 9.5. The 2032+ column combines the amortization after 2031 and the remaining balance due at final maturity in 2036. 3 As of September 30, 2026 Rivian had availability under the ABL Facility of $593M after giving effect to the borrowing base and outstanding letters of credit 4 Uber Technologies milestone based investment of $250M which we target to receive by the end of 2026 subject to the achievement of certain conditions and autonomy milestones 5 An additional Volkswagen Group equity investment of $460M is targeted at the earlier of the first Volkswagen Group vehicle with RV Tech hardware and software on the road or January 2028 subject to certain conditions 6 Additional investment of up to $700M by Uber Technologies is targeted through 2031 subject to the achievement of certain conditions and autonomous milestones by specific dates, building towards a scaled, fully-autonomous fleet of Rivian R2 robotaxis 7 Maximum targeted Department of Energy loan of $4.5B ($4,006M principal and $494M capitalized interest) which is dependent on meeting certain conditions including the pre-funding of equity and reserve accounts in advance of the loan draw Available Liquidity ($M) Cash, Cash Equivalents and Short-Term Investments1 $5,502 Volkswagen Group Non-Recourse Loan2 1,000 Availability under ABL Facility3 593 Total Pro-Forma Available Liquidity $7,095 Targeted Capital in 2026 Milestone Based Uber Technologies Equity Investment4 $250 Total Available Liquidity and Targeted Capital in 2026 $7,345 Additional Targeted Capital Volkswagen Group Equity Investment5 $460 Milestone Based Uber Technologies Equity Investment6 700 Department of Energy Loan (Principal + Capitalized Interest)7 4,500 Total Available Liquidity and Targeted Future Capital $13,005 Balance Sheet and Liquidity ($ M ) Debt Maturity Schedule $1,500 $1,725 $1,250 $1,500 2026 2027 2028 2029 2030 2031 2032+ $— $500 $1,000 $1,500 $2,000 $2,500 $3,000 $3,500 $4,000 2029 Convert 2030 Convert ABL Facility (Undrawn) 1L Notes Non-recourse JV Loan $750 2
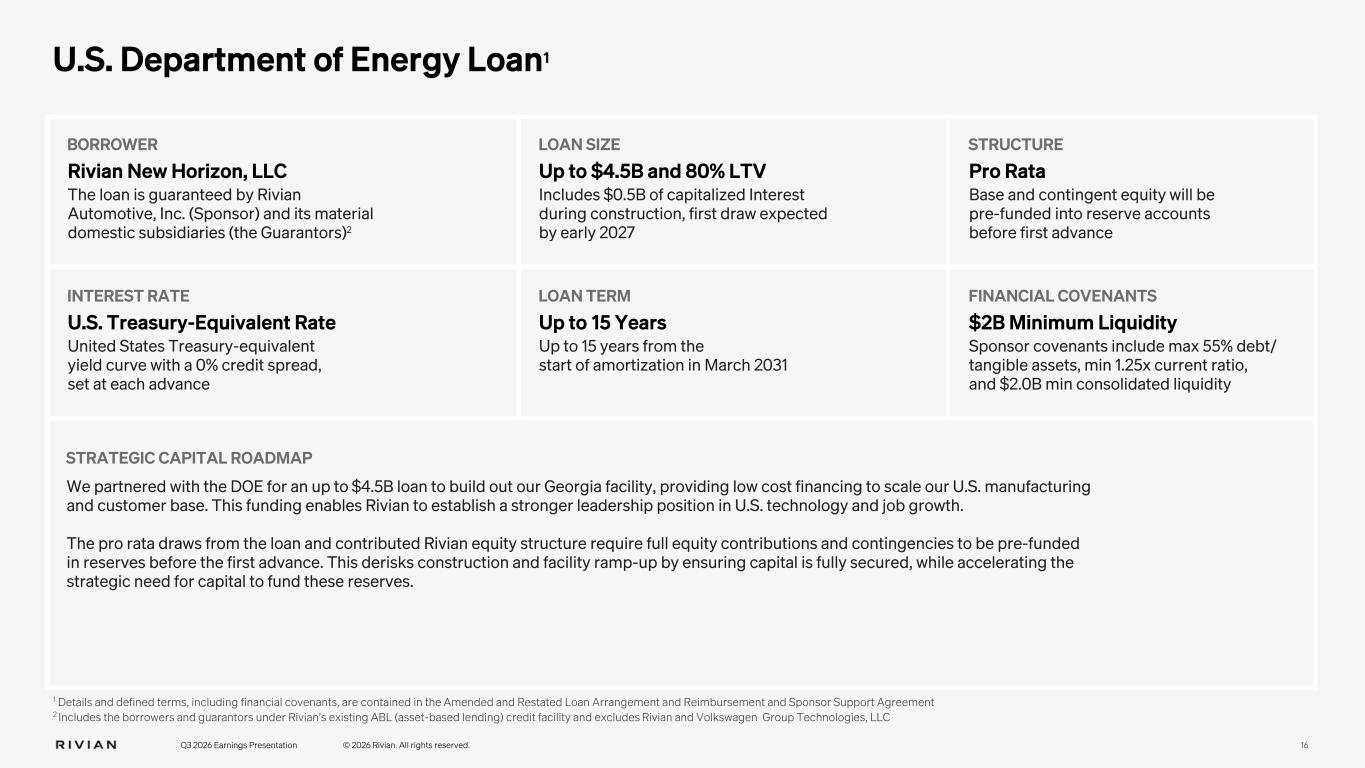
U.S. Department of Energy Loan1 BORROWER Rivian New Horizon, LLC The loan is guaranteed by Rivian Automotive, Inc. (Sponsor) and its material domestic subsidiaries (the Guarantors)2 Q3 2026 Earnings Presentation © 2026 Rivian. All rights reserved. 16 LOAN SIZE Up to $4.5B and 80% LTV Includes $0.5B of capitalized Interest during construction, first draw expected by early 2027 STRUCTURE Pro Rata Base and contingent equity will be pre-funded into reserve accounts before first advance INTEREST RATE U.S. Treasury-Equivalent Rate United States Treasury-equivalent yield curve with a 0% credit spread, set at each advance LOAN TERM Up to 15 Years Up to 15 years from the start of amortization in March 2031 FINANCIAL COVENANTS $2B Minimum Liquidity Sponsor covenants include max 55% debt/ tangible assets, min 1.25x current ratio, and $2.0B min consolidated liquidity STRATEGIC CAPITAL ROADMAP We partnered with the DOE for an up to $4.5B loan to build out our Georgia facility, providing low cost financing to scale our U.S. manufacturing and customer base. This funding enables Rivian to establish a stronger leadership position in U.S. technology and job growth. The pro rata draws from the loan and contributed Rivian equity structure require full equity contributions and contingencies to be pre-funded in reserves before the first advance. This derisks construction and facility ramp-up by ensuring capital is fully secured, while accelerating the strategic need for capital to fund these reserves. 1 Details and defined terms, including financial covenants, are contained in the Amended and Restated Loan Arrangement and Reimbursement and Sponsor Support Agreement 2 Includes the borrowers and guarantors under Rivian’s existing ABL (asset-based lending) credit facility and excludes Rivian and Volkswagen Group Technologies, LLC

17 Financial Statements and Non-GAAP Reconciliations Q3 2026 Earnings Presentation © 2026 Rivian. All rights reserved.
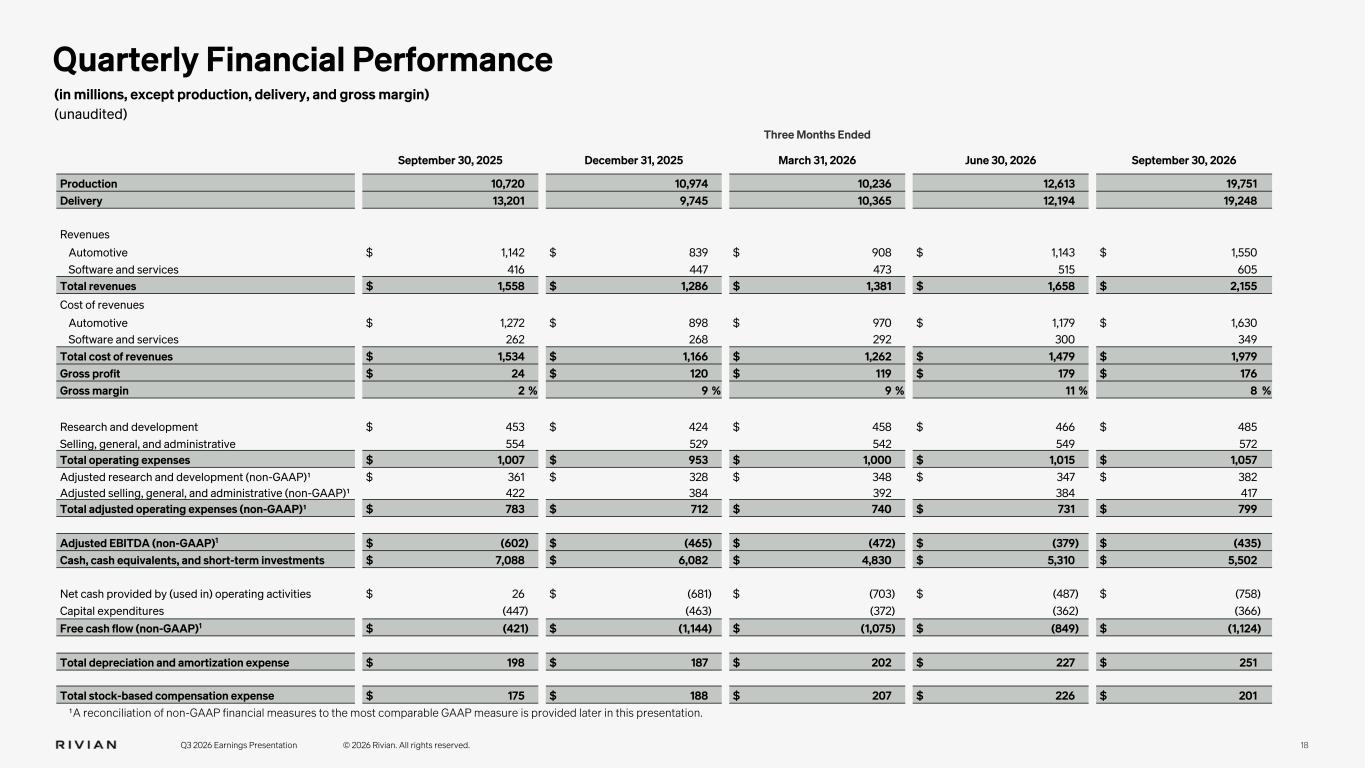
18 Quarterly Financial Performance (in millions, except production, delivery, and gross margin) (unaudited) Q3 2026 Earnings Presentation © 2026 Rivian. All rights reserved. Three Months Ended September 30, 2025 December 31, 2025 March 31, 2026 June 30, 2026 September 30, 2026 Production 10,720 10,974 10,236 12,613 19,751 Delivery 13,201 9,745 10,365 12,194 19,248 Revenues Automotive $ 1,142 $ 839 $ 908 $ 1,143 $ 1,550 Software and services 416 447 473 515 605 Total revenues $ 1,558 $ 1,286 $ 1,381 $ 1,658 $ 2,155 Cost of revenues Automotive $ 1,272 $ 898 $ 970 $ 1,179 $ 1,630 Software and services 262 268 292 300 349 Total cost of revenues $ 1,534 $ 1,166 $ 1,262 $ 1,479 $ 1,979 Gross profit $ 24 $ 120 $ 119 $ 179 $ 176 Gross margin 2 % 9 % 9 % 11 % 8 % Research and development $ 453 $ 424 $ 458 $ 466 $ 485 Selling, general, and administrative 554 529 542 549 572 Total operating expenses $ 1,007 $ 953 $ 1,000 $ 1,015 $ 1,057 Adjusted research and development (non-GAAP)¹ $ 361 $ 328 $ 348 $ 347 $ 382 Adjusted selling, general, and administrative (non-GAAP)¹ 422 384 392 384 417 Total adjusted operating expenses (non-GAAP)¹ $ 783 $ 712 $ 740 $ 731 $ 799 Adjusted EBITDA (non-GAAP)1 $ (602) $ (465) $ (472) $ (379) $ (435) Cash, cash equivalents, and short-term investments $ 7,088 $ 6,082 $ 4,830 $ 5,310 $ 5,502 Net cash provided by (used in) operating activities $ 26 $ (681) $ (703) $ (487) $ (758) Capital expenditures (447) (463) (372) (362) (366) Free cash flow (non-GAAP)1 $ (421) $ (1,144) $ (1,075) $ (849) $ (1,124) Total depreciation and amortization expense $ 198 $ 187 $ 202 $ 227 $ 251 Total stock-based compensation expense $ 175 $ 188 $ 207 $ 226 $ 201 ¹A reconciliation of non-GAAP financial measures to the most comparable GAAP measure is provided later in this presentation.
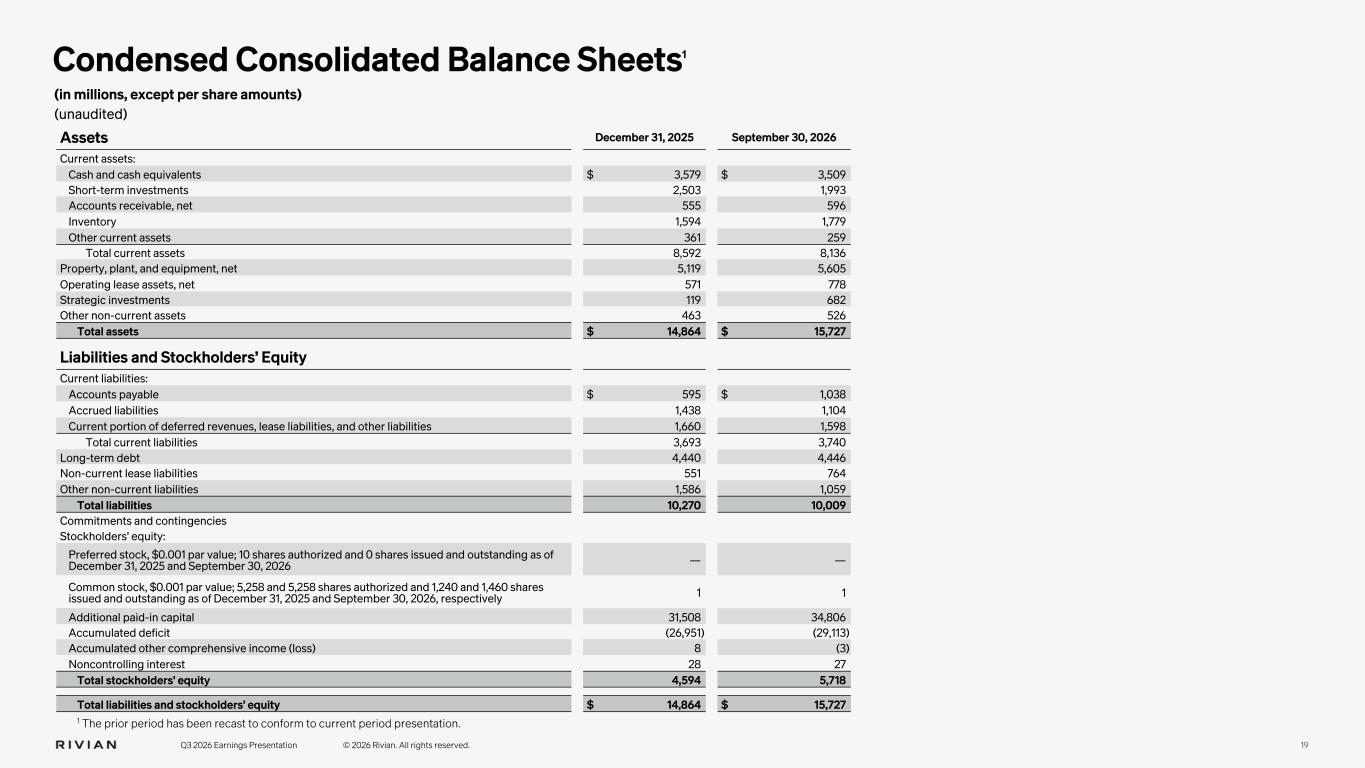
19 Condensed Consolidated Balance Sheets (in millions, except per share amounts) (unaudited) Q3 2026 Earnings Presentation © 2026 Rivian. All rights reserved. Assets December 31, 2025 September 30, 2026 Current assets: Cash and cash equivalents $ 3,579 $ 3,509 Short-term investments 2,503 1,993 Accounts receivable, net 555 596 Inventory 1,594 1,779 Other current assets 361 259 Total current assets 8,592 8,136 Property, plant, and equipment, net 5,119 5,605 Operating lease assets, net 571 778 Strategic investments 119 682 Other non-current assets 463 526 Total assets $ 14,864 $ 15,727 Liabilities and Stockholders’ Equity Current liabilities: Accounts payable $ 595 $ 1,038 Accrued liabilities 1,438 1,104 Current portion of deferred revenues, lease liabilities, and other liabilities 1,660 1,598 Total current liabilities 3,693 3,740 Long-term debt 4,440 4,446 Non-current lease liabilities 551 764 Other non-current liabilities 1,586 1,059 Total liabilities 10,270 10,009 Commitments and contingencies Stockholders' equity: Preferred stock, $0.001 par value; 10 shares authorized and 0 shares issued and outstanding as of December 31, 2025 and September 30, 2026 — — Common stock, $0.001 par value; 5,258 and 5,258 shares authorized and 1,240 and 1,460 shares issued and outstanding as of December 31, 2025 and September 30, 2026, respectively 1 1 Additional paid-in capital 31,508 34,806 Accumulated deficit (26,951) (29,113) Accumulated other comprehensive income (loss) 8 (3) Noncontrolling interest 28 27 Total stockholders' equity 4,594 5,718 Total liabilities and stockholders' equity $ 14,864 $ 15,727 1 The prior period has been recast to conform to current period presentation. 1
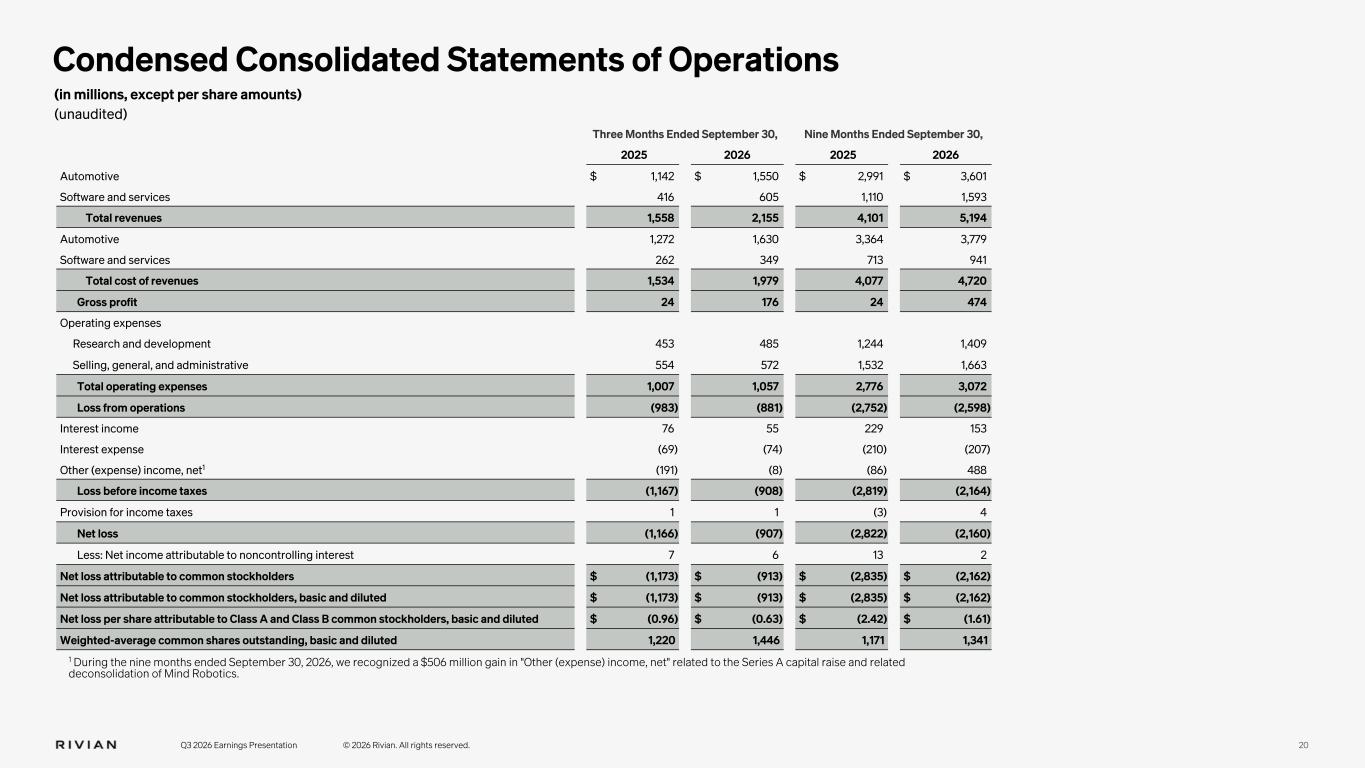
20 Condensed Consolidated Statements of Operations (in millions, except per share amounts) (unaudited) Q3 2026 Earnings Presentation © 2026 Rivian. All rights reserved. Three Months Ended September 30, Nine Months Ended September 30, 2025 2026 2025 2026 Automotive $ 1,142 $ 1,550 $ 2,991 $ 3,601 Software and services 416 605 1,110 1,593 Total revenues 1,558 2,155 4,101 5,194 Automotive 1,272 1,630 3,364 3,779 Software and services 262 349 713 941 Total cost of revenues 1,534 1,979 4,077 4,720 Gross profit 24 176 24 474 Operating expenses Research and development 453 485 1,244 1,409 Selling, general, and administrative 554 572 1,532 1,663 Total operating expenses 1,007 1,057 2,776 3,072 Loss from operations (983) (881) (2,752) (2,598) Interest income 76 55 229 153 Interest expense (69) (74) (210) (207) Other (expense) income, net1 (191) (8) (86) 488 Loss before income taxes (1,167) (908) (2,819) (2,164) Provision for income taxes 1 1 (3) 4 Net loss (1,166) (907) (2,822) (2,160) Less: Net income attributable to noncontrolling interest 7 6 13 2 Net loss attributable to common stockholders $ (1,173) $ (913) $ (2,835) $ (2,162) Net loss attributable to common stockholders, basic and diluted $ (1,173) $ (913) $ (2,835) $ (2,162) Net loss per share attributable to Class A and Class B common stockholders, basic and diluted $ (0.96) $ (0.63) $ (2.42) $ (1.61) Weighted-average common shares outstanding, basic and diluted 1,220 1,446 1,171 1,341 1 During the nine months ended September 30, 2026, we recognized a $506 million gain in "Other (expense) income, net" related to the Series A capital raise and related deconsolidation of Mind Robotics.
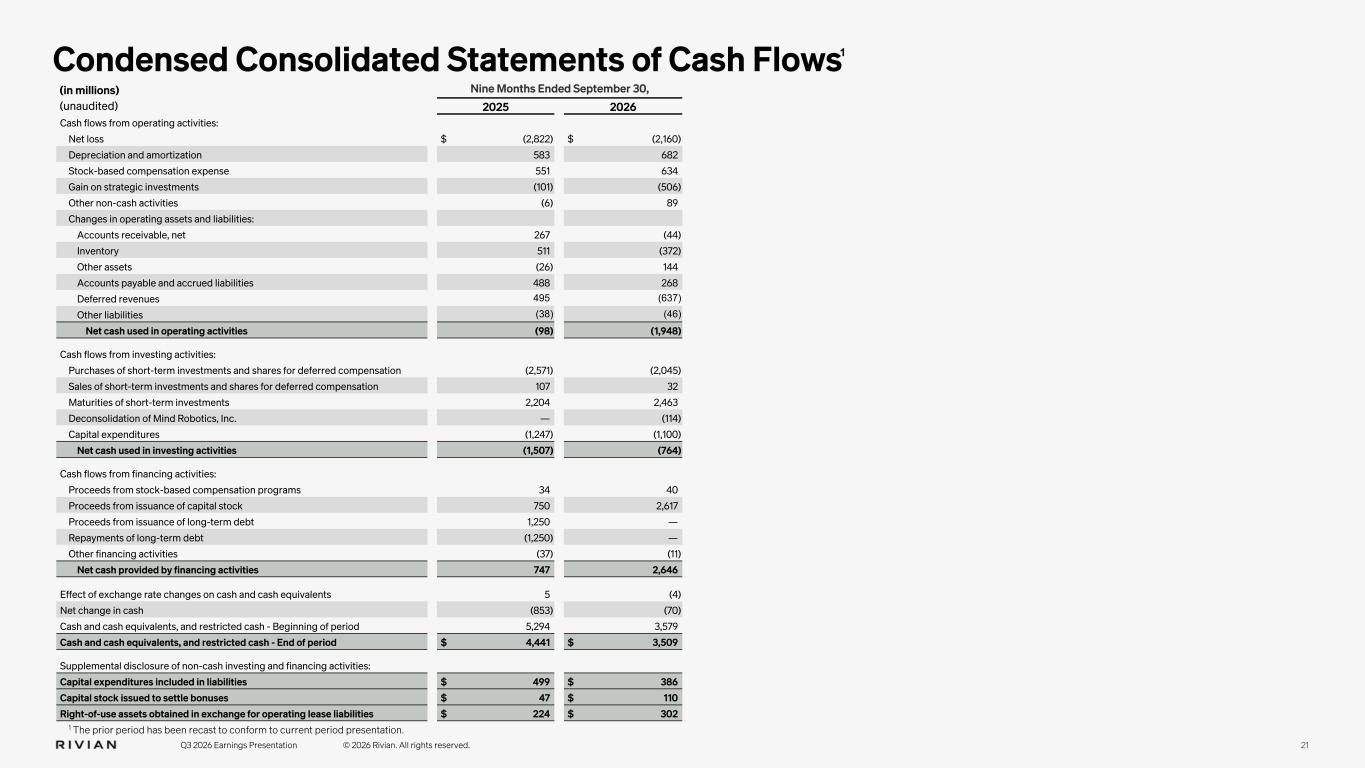
Nine Months Ended September 30, 2025 2026 Cash flows from operating activities: Net loss $ (2,822) $ (2,160) Depreciation and amortization 583 682 Stock-based compensation expense 551 634 Gain on strategic investments (101) (506) Other non-cash activities (6) 89 Changes in operating assets and liabilities: Accounts receivable, net 267 (44) Inventory 511 (372) Other assets (26) 144 Accounts payable and accrued liabilities 488 268 Deferred revenues 495 (637) Other liabilities (38) (46) Net cash used in operating activities (98) (1,948) Cash flows from investing activities: Purchases of short-term investments and shares for deferred compensation (2,571) (2,045) Sales of short-term investments and shares for deferred compensation 107 32 Maturities of short-term investments 2,204 2,463 Deconsolidation of Mind Robotics, Inc. — (114) Capital expenditures (1,247) (1,100) Net cash used in investing activities (1,507) (764) Cash flows from financing activities: Proceeds from stock-based compensation programs 34 40 Proceeds from issuance of capital stock 750 2,617 Proceeds from issuance of long-term debt 1,250 — Repayments of long-term debt (1,250) — Other financing activities (37) (11) Net cash provided by financing activities 747 2,646 Effect of exchange rate changes on cash and cash equivalents 5 (4) Net change in cash (853) (70) Cash and cash equivalents, and restricted cash - Beginning of period 5,294 3,579 Cash and cash equivalents, and restricted cash - End of period $ 4,441 $ 3,509 Supplemental disclosure of non-cash investing and financing activities: Capital expenditures included in liabilities $ 499 $ 386 Capital stock issued to settle bonuses $ 47 $ 110 Right-of-use assets obtained in exchange for operating lease liabilities $ 224 $ 302 1 The prior period has been recast to conform to current period presentation. 21 Condensed Consolidated Statements of Cash Flows (in millions) (unaudited) Q3 2026 Earnings Presentation © 2026 Rivian. All rights reserved. 1
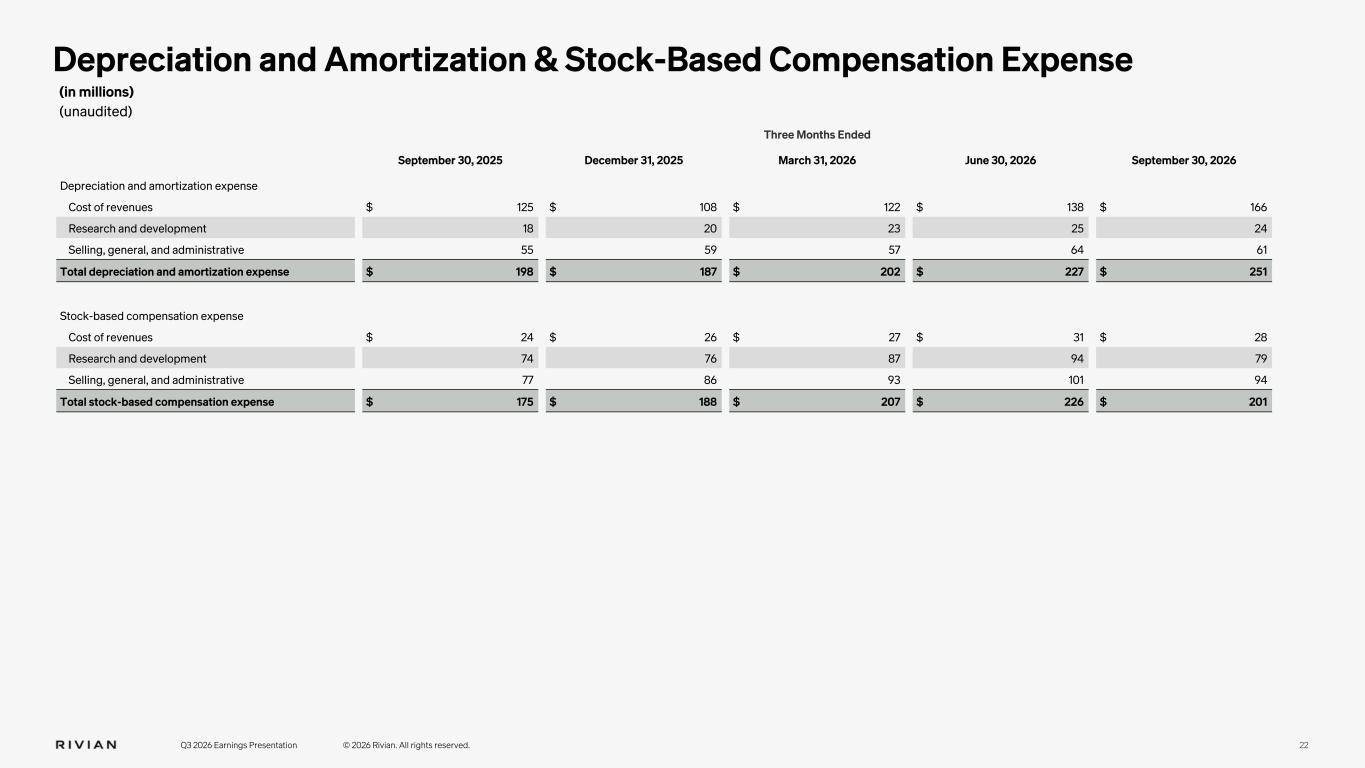
22 Depreciation and Amortization & Stock-Based Compensation Expense (in millions) (unaudited) Q3 2026 Earnings Presentation © 2026 Rivian. All rights reserved. Three Months Ended September 30, 2025 December 31, 2025 March 31, 2026 June 30, 2026 September 30, 2026 Depreciation and amortization expense Cost of revenues $ 125 $ 108 $ 122 $ 138 $ 166 Research and development 18 20 23 25 24 Selling, general, and administrative 55 59 57 64 61 Total depreciation and amortization expense $ 198 $ 187 $ 202 $ 227 $ 251 Stock-based compensation expense Cost of revenues $ 24 $ 26 $ 27 $ 31 $ 28 Research and development 74 76 87 94 79 Selling, general, and administrative 77 86 93 101 94 Total stock-based compensation expense $ 175 $ 188 $ 207 $ 226 $ 201
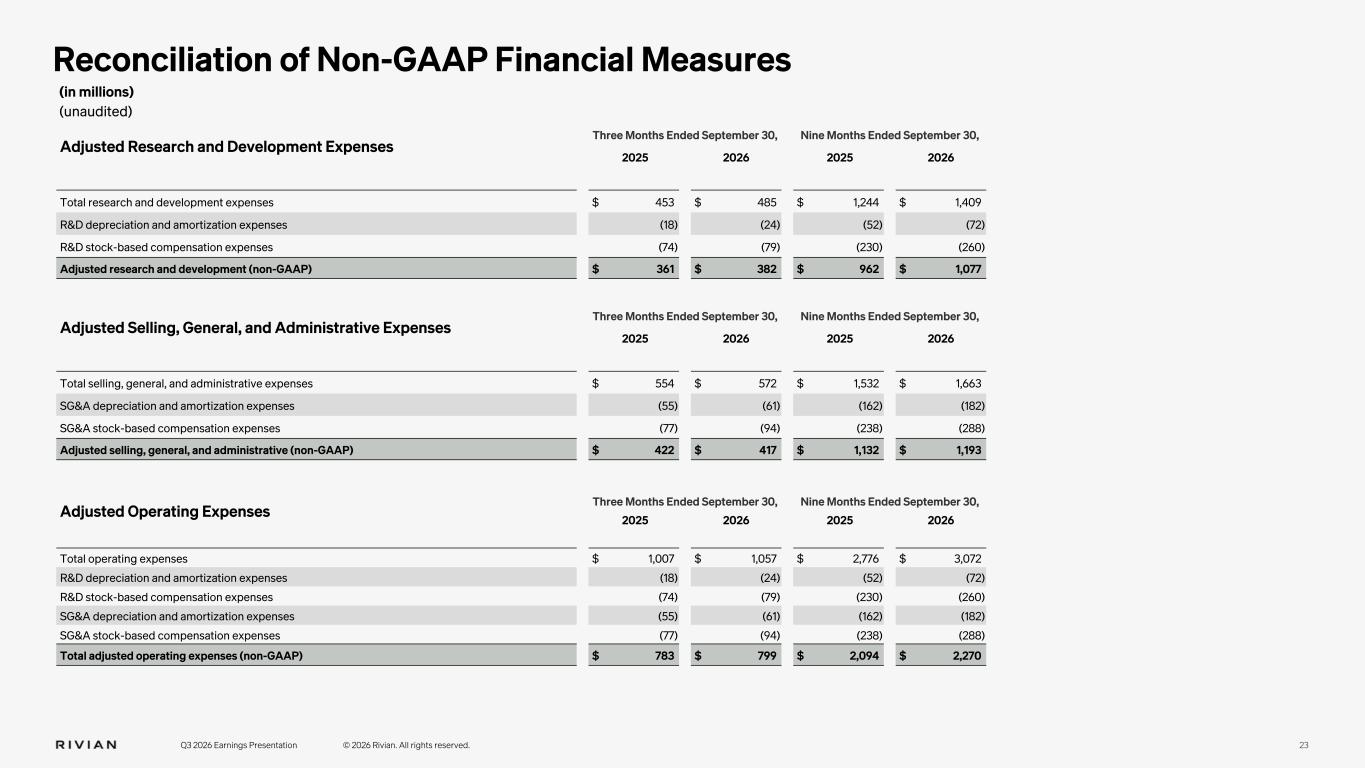
23 Reconciliation of Non-GAAP Financial Measures (in millions) (unaudited) Q3 2026 Earnings Presentation © 2026 Rivian. All rights reserved. Adjusted Research and Development Expenses Three Months Ended September 30, Nine Months Ended September 30, 2025 2026 2025 2026 Total research and development expenses $ 453 $ 485 $ 1,244 $ 1,409 R&D depreciation and amortization expenses (18) (24) (52) (72) R&D stock-based compensation expenses (74) (79) (230) (260) Adjusted research and development (non-GAAP) $ 361 $ 382 $ 962 $ 1,077 Adjusted Selling, General, and Administrative Expenses Three Months Ended September 30, Nine Months Ended September 30, 2025 2026 2025 2026 Total selling, general, and administrative expenses $ 554 $ 572 $ 1,532 $ 1,663 SG&A depreciation and amortization expenses (55) (61) (162) (182) SG&A stock-based compensation expenses (77) (94) (238) (288) Adjusted selling, general, and administrative (non-GAAP) $ 422 $ 417 $ 1,132 $ 1,193 Adjusted Operating Expenses Three Months Ended September 30, Nine Months Ended September 30, 2025 2026 2025 2026 Total operating expenses $ 1,007 $ 1,057 $ 2,776 $ 3,072 R&D depreciation and amortization expenses (18) (24) (52) (72) R&D stock-based compensation expenses (74) (79) (230) (260) SG&A depreciation and amortization expenses (55) (61) (162) (182) SG&A stock-based compensation expenses (77) (94) (238) (288) Total adjusted operating expenses (non-GAAP) $ 783 $ 799 $ 2,094 $ 2,270
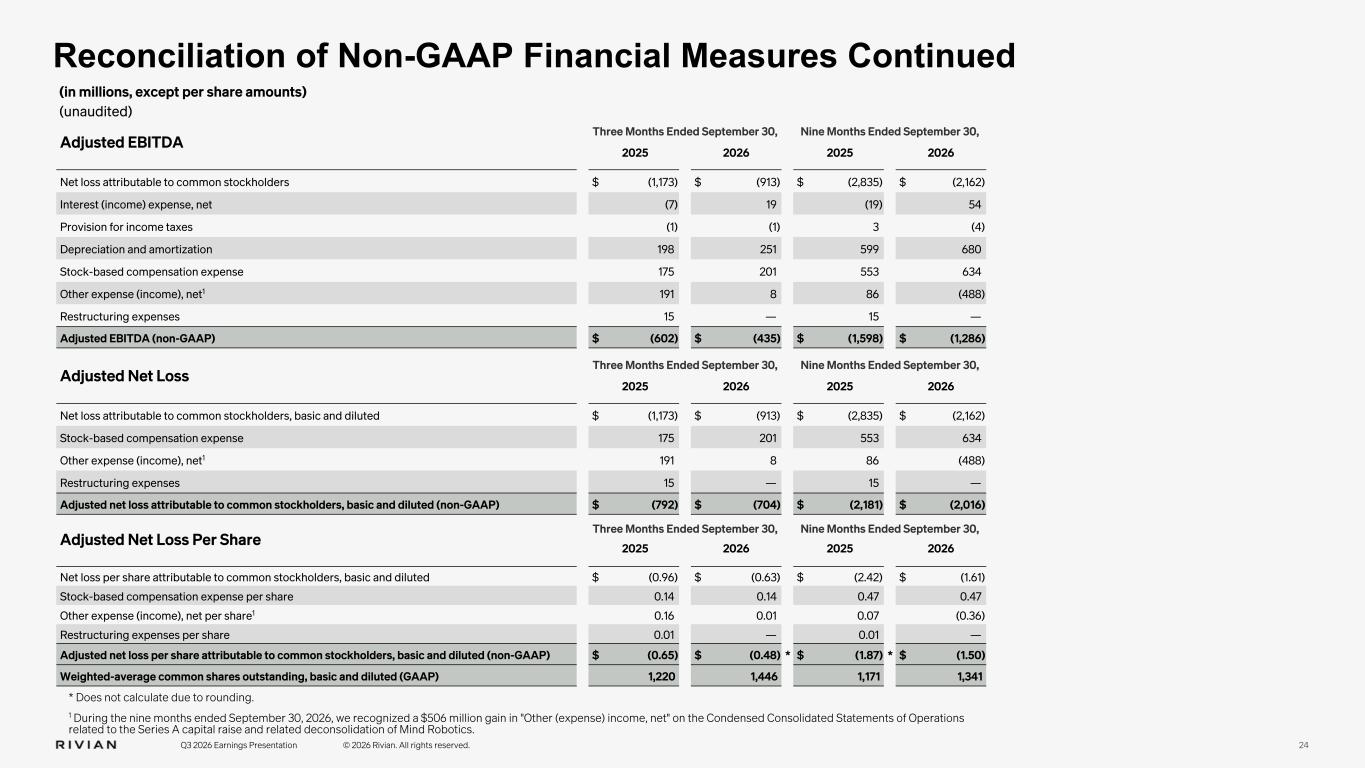
24 Reconciliation of Non-GAAP Financial Measures Continued (in millions, except per share amounts) (unaudited) Q3 2026 Earnings Presentation © 2026 Rivian. All rights reserved. Adjusted EBITDA Three Months Ended September 30, Nine Months Ended September 30, 2025 2026 2025 2026 Net loss attributable to common stockholders $ (1,173) $ (913) $ (2,835) $ (2,162) Interest (income) expense, net (7) 19 (19) 54 Provision for income taxes (1) (1) 3 (4) Depreciation and amortization 198 251 599 680 Stock-based compensation expense 175 201 553 634 Other expense (income), net1 191 8 86 (488) Restructuring expenses 15 — 15 — Adjusted EBITDA (non-GAAP) $ (602) $ (435) $ (1,598) $ (1,286) Adjusted Net Loss Three Months Ended September 30, Nine Months Ended September 30, 2025 2026 2025 2026 Net loss attributable to common stockholders, basic and diluted $ (1,173) $ (913) $ (2,835) $ (2,162) Stock-based compensation expense 175 201 553 634 Other expense (income), net1 191 8 86 (488) Restructuring expenses 15 — 15 — Adjusted net loss attributable to common stockholders, basic and diluted (non-GAAP) $ (792) $ (704) $ (2,181) $ (2,016) Adjusted Net Loss Per Share Three Months Ended September 30, Nine Months Ended September 30, 2025 2026 2025 2026 Net loss per share attributable to common stockholders, basic and diluted $ (0.96) $ (0.63) $ (2.42) $ (1.61) Stock-based compensation expense per share 0.14 0.14 0.47 0.47 Other expense (income), net per share1 0.16 0.01 0.07 (0.36) Restructuring expenses per share 0.01 — 0.01 — Adjusted net loss per share attributable to common stockholders, basic and diluted (non-GAAP) $ (0.65) $ (0.48) * $ (1.87) * $ (1.50) Weighted-average common shares outstanding, basic and diluted (GAAP) 1,220 1,446 1,171 1,341 * Does not calculate due to rounding. 1 During the nine months ended September 30, 2026, we recognized a $506 million gain in "Other (expense) income, net" on the Condensed Consolidated Statements of Operations related to the Series A capital raise and related deconsolidation of Mind Robotics.
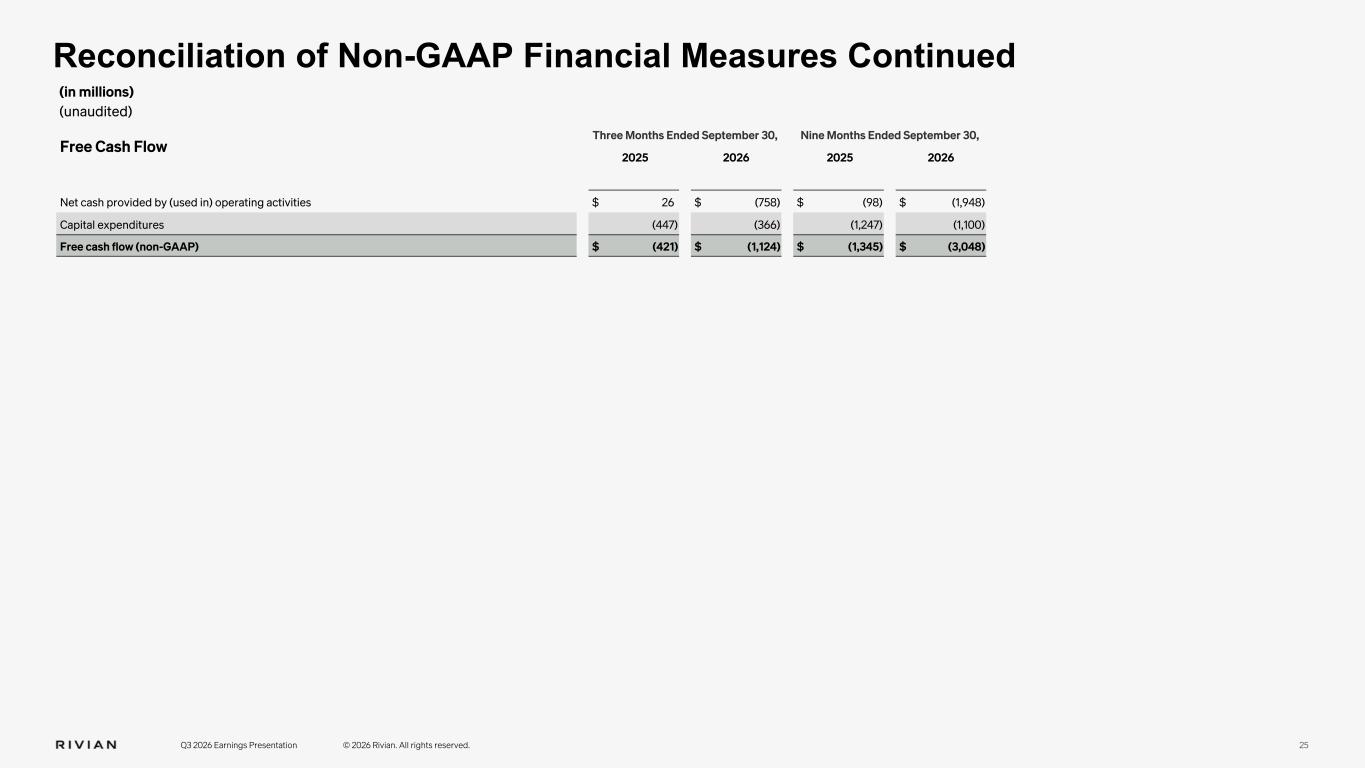
25 Reconciliation of Non-GAAP Financial Measures Continued (in millions) (unaudited) Q3 2026 Earnings Presentation © 2026 Rivian. All rights reserved. Free Cash Flow Three Months Ended September 30, Nine Months Ended September 30, 2025 2026 2025 2026 Net cash provided by (used in) operating activities $ 26 $ (758) $ (98) $ (1,948) Capital expenditures (447) (366) (1,247) (1,100) Free cash flow (non-GAAP) $ (421) $ (1,124) $ (1,345) $ (3,048)
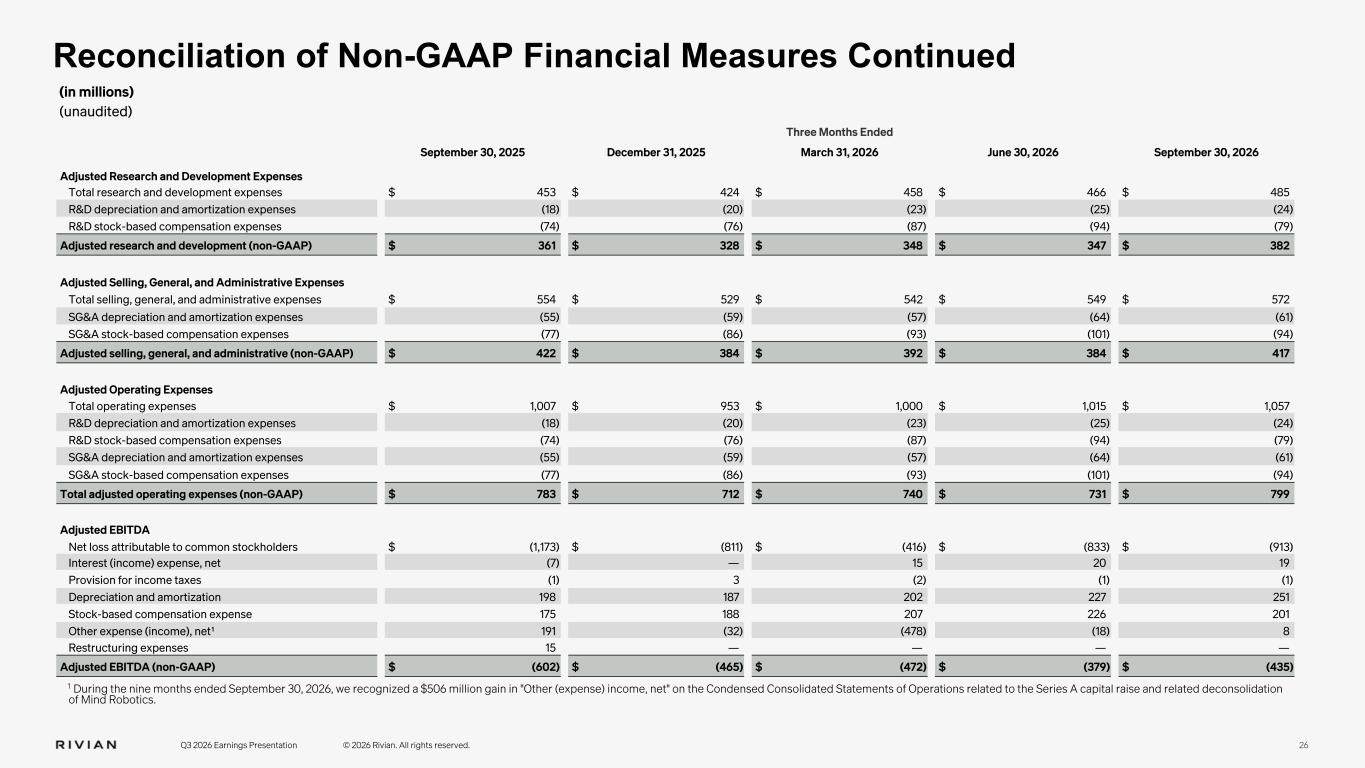
Three Months Ended September 30, 2025 December 31, 2025 March 31, 2026 June 30, 2026 September 30, 2026 Adjusted Research and Development Expenses Total research and development expenses $ 453 $ 424 $ 458 $ 466 $ 485 R&D depreciation and amortization expenses (18) (20) (23) (25) (24) R&D stock-based compensation expenses (74) (76) (87) (94) (79) Adjusted research and development (non-GAAP) $ 361 $ 328 $ 348 $ 347 $ 382 Adjusted Selling, General, and Administrative Expenses Total selling, general, and administrative expenses $ 554 $ 529 $ 542 $ 549 $ 572 SG&A depreciation and amortization expenses (55) (59) (57) (64) (61) SG&A stock-based compensation expenses (77) (86) (93) (101) (94) Adjusted selling, general, and administrative (non-GAAP) $ 422 $ 384 $ 392 $ 384 $ 417 Adjusted Operating Expenses Total operating expenses $ 1,007 $ 953 $ 1,000 $ 1,015 $ 1,057 R&D depreciation and amortization expenses (18) (20) (23) (25) (24) R&D stock-based compensation expenses (74) (76) (87) (94) (79) SG&A depreciation and amortization expenses (55) (59) (57) (64) (61) SG&A stock-based compensation expenses (77) (86) (93) (101) (94) Total adjusted operating expenses (non-GAAP) $ 783 $ 712 $ 740 $ 731 $ 799 Adjusted EBITDA Net loss attributable to common stockholders $ (1,173) $ (811) $ (416) $ (833) $ (913) Interest (income) expense, net (7) — 15 20 19 Provision for income taxes (1) 3 (2) (1) (1) Depreciation and amortization 198 187 202 227 251 Stock-based compensation expense 175 188 207 226 201 Other expense (income), net¹ 191 (32) (478) (18) 8 Restructuring expenses 15 — — — — Adjusted EBITDA (non-GAAP) $ (602) $ (465) $ (472) $ (379) $ (435) 1 During the nine months ended September 30, 2026, we recognized a $506 million gain in "Other (expense) income, net" on the Condensed Consolidated Statements of Operations related to the Series A capital raise and related deconsolidation of Mind Robotics. 26 Reconciliation of Non-GAAP Financial Measures Continued (in millions) (unaudited) Q3 2026 Earnings Presentation © 2026 Rivian. All rights reserved.
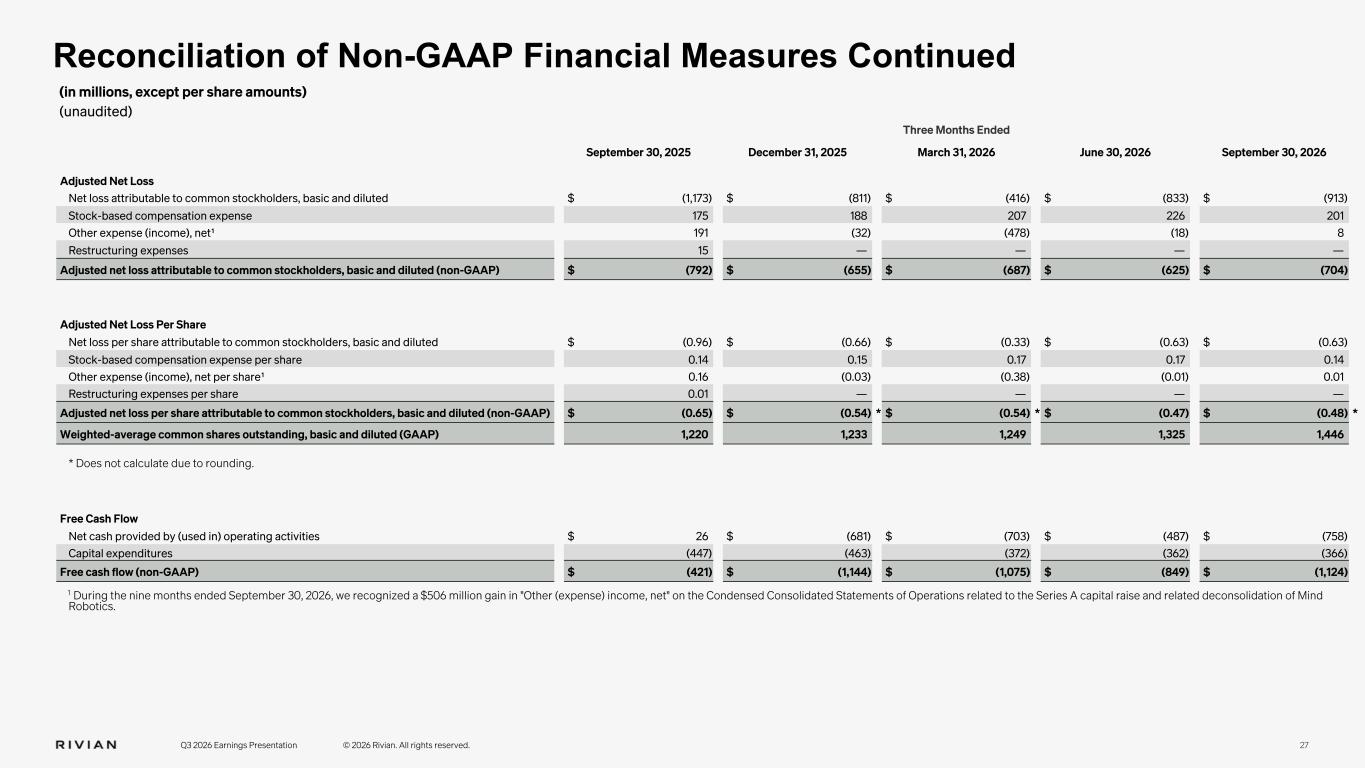
27 Reconciliation of Non-GAAP Financial Measures Continued (in millions, except per share amounts) (unaudited) Q3 2026 Earnings Presentation © 2026 Rivian. All rights reserved. Three Months Ended September 30, 2025 December 31, 2025 March 31, 2026 June 30, 2026 September 30, 2026 Adjusted Net Loss Net loss attributable to common stockholders, basic and diluted $ (1,173) $ (811) $ (416) $ (833) $ (913) Stock-based compensation expense 175 188 207 226 201 Other expense (income), net¹ 191 (32) (478) (18) 8 Restructuring expenses 15 — — — — Adjusted net loss attributable to common stockholders, basic and diluted (non-GAAP) $ (792) $ (655) $ (687) $ (625) $ (704) Adjusted Net Loss Per Share Net loss per share attributable to common stockholders, basic and diluted $ (0.96) $ (0.66) $ (0.33) $ (0.63) $ (0.63) Stock-based compensation expense per share 0.14 0.15 0.17 0.17 0.14 Other expense (income), net per share¹ 0.16 (0.03) (0.38) (0.01) 0.01 Restructuring expenses per share 0.01 — — — — Adjusted net loss per share attributable to common stockholders, basic and diluted (non-GAAP) $ (0.65) $ (0.54) * $ (0.54) * $ (0.47) $ (0.48) * Weighted-average common shares outstanding, basic and diluted (GAAP) 1,220 1,233 1,249 1,325 1,446 * Does not calculate due to rounding. Free Cash Flow Net cash provided by (used in) operating activities $ 26 $ (681) $ (703) $ (487) $ (758) Capital expenditures (447) (463) (372) (362) (366) Free cash flow (non-GAAP) $ (421) $ (1,144) $ (1,075) $ (849) $ (1,124) 1 During the nine months ended September 30, 2026, we recognized a $506 million gain in "Other (expense) income, net" on the Condensed Consolidated Statements of Operations related to the Series A capital raise and related deconsolidation of Mind Robotics.
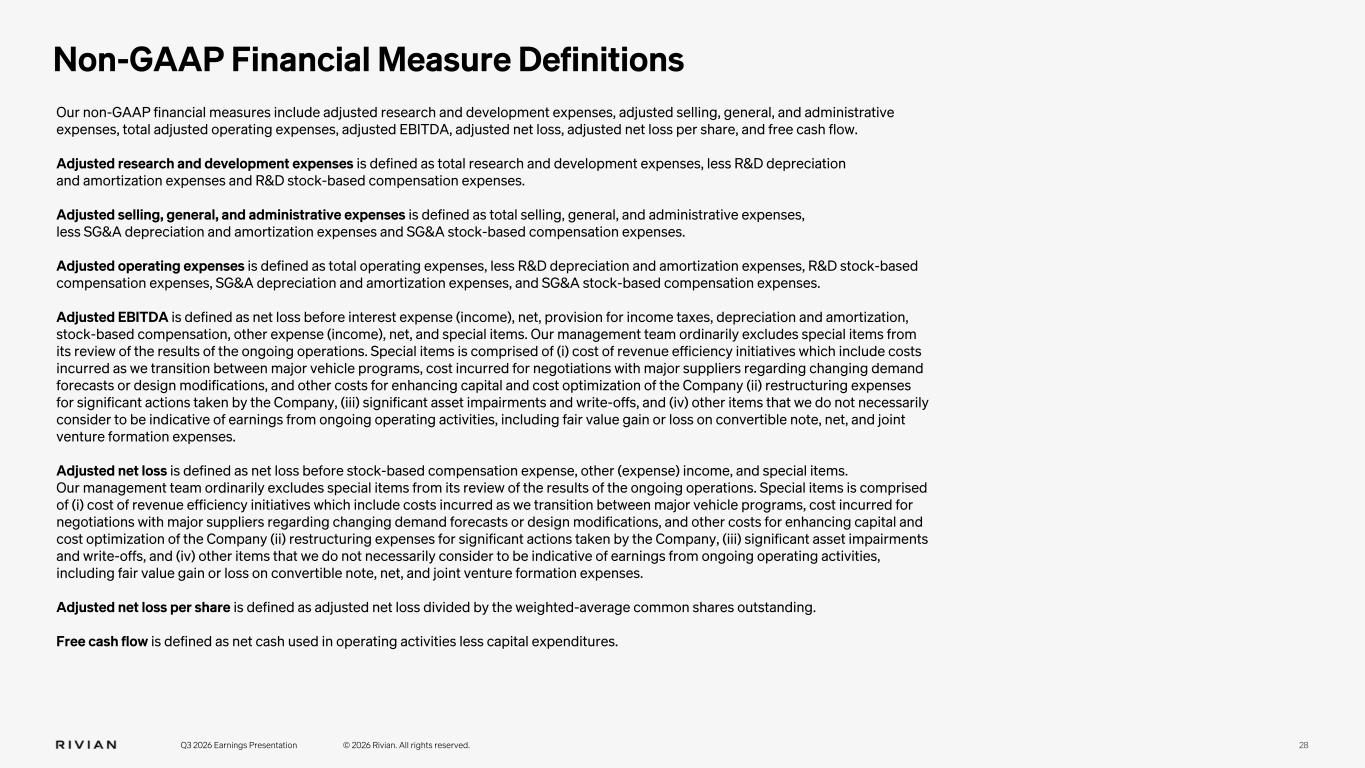
28 Non-GAAP Financial Measure Definitions Q3 2026 Earnings Presentation © 2026 Rivian. All rights reserved. Our non-GAAP financial measures include adjusted research and development expenses, adjusted selling, general, and administrative expenses, total adjusted operating expenses, adjusted EBITDA, adjusted net loss, adjusted net loss per share, and free cash flow. Adjusted research and development expenses is defined as total research and development expenses, less R&D depreciation and amortization expenses and R&D stock-based compensation expenses. Adjusted selling, general, and administrative expenses is defined as total selling, general, and administrative expenses, less SG&A depreciation and amortization expenses and SG&A stock-based compensation expenses. Adjusted operating expenses is defined as total operating expenses, less R&D depreciation and amortization expenses, R&D stock-based compensation expenses, SG&A depreciation and amortization expenses, and SG&A stock-based compensation expenses. Adjusted EBITDA is defined as net loss before interest expense (income), net, provision for income taxes, depreciation and amortization, stock-based compensation, other expense (income), net, and special items. Our management team ordinarily excludes special items from its review of the results of the ongoing operations. Special items is comprised of (i) cost of revenue efficiency initiatives which include costs incurred as we transition between major vehicle programs, cost incurred for negotiations with major suppliers regarding changing demand forecasts or design modifications, and other costs for enhancing capital and cost optimization of the Company (ii) restructuring expenses for significant actions taken by the Company, (iii) significant asset impairments and write-offs, and (iv) other items that we do not necessarily consider to be indicative of earnings from ongoing operating activities, including fair value gain or loss on convertible note, net, and joint venture formation expenses. Adjusted net loss is defined as net loss before stock-based compensation expense, other (expense) income, and special items. Our management team ordinarily excludes special items from its review of the results of the ongoing operations. Special items is comprised of (i) cost of revenue efficiency initiatives which include costs incurred as we transition between major vehicle programs, cost incurred for negotiations with major suppliers regarding changing demand forecasts or design modifications, and other costs for enhancing capital and cost optimization of the Company (ii) restructuring expenses for significant actions taken by the Company, (iii) significant asset impairments and write-offs, and (iv) other items that we do not necessarily consider to be indicative of earnings from ongoing operating activities, including fair value gain or loss on convertible note, net, and joint venture formation expenses. Adjusted net loss per share is defined as adjusted net loss divided by the weighted-average common shares outstanding. Free cash flow is defined as net cash used in operating activities less capital expenditures.

Q3 2026 Earnings Presentation © 2026 Rivian. All rights reserved. 29