PAY VERSUS PERFORMANCE
Pay Versus Performance Table
As required by Section 953(a) of the Dodd-Frank Wall Street Reform and Consumer Protection Act, and Item 402(v) of Regulation S-K, we are providing the following information about the relationship between executive compensation actually paid (as defined in Item 402(v) of Regulation S-K) and certain financial performance of the Company. We are also permitted to report as a “smaller reporting company” as defined under the U.S. federal securities laws. Accordingly, we have not included a tabular list of financial performance measures, and the table below does not include a column for a “Company-Selected Measure” as defined in Item 402(v) of Regulation S-K. The Compensation Committee did not consider the pay versus performance disclosure below in making its pay decisions for any of the years shown.
|
Year |
Summary |
Compensation |
Average |
Average |
Value of |
Net Loss |
||||||||||||||||||
|
(a) |
(b) |
(c) |
(d) |
(e) |
(f) |
(g) |
||||||||||||||||||
|
2025 |
1,442,121 | 1,034,611 | 659,670 | 506,727 | 6.56 | (19,864,902 | ) | |||||||||||||||||
|
2024 |
607,500 | 345,951 | 404,950 | 311,046 | 42.59 | (29,918,802 | ) | |||||||||||||||||
|
2023 |
2,764,747 | 2,271,344 | 1,248,778 | 1,077,236 | 121.18 | (39,260,837 | ) | |||||||||||||||||
(1) The dollar amounts reported in column (b) are the amounts of total compensation reported for Laxminarayan Bhat, PhD, the Company’s Chief Executive Officer for the 2025, 2024, and 2023 periods.
(2) The dollar amounts under column (c) represent the amount of "compensation actually paid" to Laxminarayan Bhat, as computed in accordance with Item 402(v) of Regulation S-K. The dollar amounts do not reflect the actual amount of compensation earned by or paid to Mr. Bhat during the applicable year. In accordance with the requirements of Item 402(v) of Regulation S-K, the adjustments in the table below were made to Dr. Bhat's total compensation for each year to determine the compensation actually paid.
(3) The dollar amounts reported in column (d) are based on the amounts of total compensation reported for non-PEO NEOs. The non-PEO NEO for the 2025, 2024, and 2023 periods was Narayan Prabhu, the Company’s Chief Financial Officer.
(4) The dollar amounts reported in column (e) represent the amount of "compensation actually paid" to Narayan Prabhu, the Non-PEO NEO within the applicable years, as computed in accordance with Item 402(v) of Regulation S-K. The dollar amounts do not reflect the actual amount of compensation earned by or paid to Mr. Prabhu during the applicable year. In accordance with the requirements of Item 402(v) of Regulation S-K, the adjustments in the table below were made to Mr. Prabhu's total compensation for each year to determine the compensation actually paid.
(5) Pursuant to the SEC rules, the total shareholder return ("TSR") figures assume an initial investment of $100 on December 31, 2022. Cumulative TSR is calculated by dividing the sum of the cumulative amount of dividends for the measurement period, assuming dividend reinvestment, and the difference between the Company’s share price at the end and the beginning of the measurement period by the Company’s share price at the beginning of the measurement period. The calculation of TSR was based upon the closing price of a share of our common stock on the last day of the Company’s 2025, 2024, 2023 and 2022 fiscal years (in each case as adjusted to give retrospective effect to the March 2026 Reverse Split), which prices were $5.58, $36.20, $103.00 and $85.00, respectively.
(6) The dollar amounts reported in column (g) represent the amount of net loss reflected in our consolidated audited financial statements for the applicable year.
PEO
|
Year |
2025 |
2024 |
2023 |
|||||||||
|
Summary Compensation Table Total |
$ | 1,442,121 | $ | 607,500 | $ | 2,764,747 | ||||||
|
Deduct: Option and Stock Awards Included in Summary Compensation Table (a) |
$ | (766,946 | ) | - | $ | (2,314,747 | ) | |||||
|
Add: Fair Value of Equity Awards Granted in Fiscal Year and Unvested as of Year-End (b) |
$ | 35,389 | - | $ | 553,369 | |||||||
|
Add: Fair Value of Equity Awards Granted in Fiscal Year and Vested as of Year-End (c) |
$ | 393,160 | $ | 157,512 | $ | 1,267,976 | ||||||
|
Add: Change in Fair Value of Outstanding and Unvested Equity Awards Granted in Prior Fiscal Years (d) |
$ | (47,875 | ) | $ | (246,166 | ) | - | |||||
|
Add: Change in Fair Value as of Vesting Date of Equity Awards Granted in Prior Years that Vested in Fiscal Year (e) |
$ | (21,238 | ) | $ | (172,895 | ) | - | |||||
|
Compensation Actually Paid |
$ | 1,034,611 | $ | 345,951 | $ | 2,271,344 | ||||||
Average Non-PEO NEOs
|
Year |
2025 |
2024 |
2023 |
|||||||||
|
Summary Compensation Table Total |
$ | 659,670 | $ | 404,950 | $ | 1,248,778 | ||||||
|
Deduct: Option and Stock Awards Included in Summary Compensation Table (a) |
$ | (287,050 | ) | - | $ | (923,788 | ) | |||||
|
Add: Fair Value of Equity Awards Granted in Fiscal Year and Unvested as of Year-End (b) |
$ | 13,214 | - | $ | 254,744 | |||||||
|
Add: Fair Value of Equity Awards Granted in Fiscal Year and Vested as of Year-End (c) |
$ | 147,430 | $ | 95,947 | $ | 485,301 | ||||||
|
Add: Change in Fair Value of Outstanding and Unvested Equity Awards Granted in Prior Fiscal Years (d) |
$ | (18,372 | ) | $ | (94,477 | ) | $ | 5,742 | ||||
|
Add: Change in Fair Value as of Vesting Date of Equity Awards Granted in Prior Years which Vested in Fiscal Year (e) |
$ | (8,165 | ) | $ | (95,374 | ) | $ | 6,449 | ||||
|
Compensation Actually Paid |
$ | 506,727 | $ | 311,046 | $ | 1,077,236 | ||||||
Analysis of the Information Presented in the Pay Versus Performance Table
As described in more detail above under “Executive Compensation,” the Company’s executive compensation program reflects a performance-driven compensation philosophy. While the Company utilizes several performance measures to align executive compensation with Company performance, those Company measures are not financial performance measures and are therefore not presented in the Pay Versus Performance table. Moreover, the Company generally seeks to incentivize long-term performance, and therefore does not specifically align the Company’s performance measures with “compensation actually paid” (as computed in accordance with Item 402(v) of Regulation S-K) for a particular year. In accordance with Item 402(v) of Regulation S-K, we are providing the following descriptions of the relationships between information presented in the Pay Versus Performance table above.
Compensation Actually Paid and Cumulative TSR
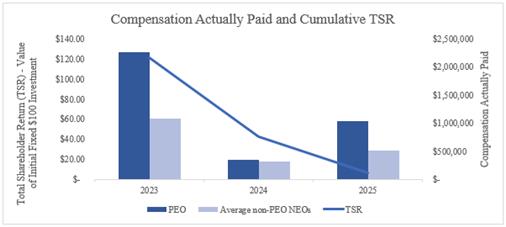
The chart below shows the relationship between the compensation actually paid to our PEO and the average compensation actually paid to our non-PEO NEOs, on the one hand, to the Company’s cumulative TSR over the three years presented in the table, on the other hand.
Compensation Actually Paid and Net Loss
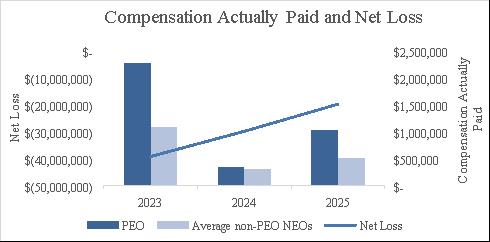
The chart below shows the relationship between the compensation actually paid to our PEO and the average compensation actually paid to our non-PEO NEOs, on the one hand, to the Company’s net loss, on the other hand.