| Third Quarter | |||||||||||
| ($ in billions except profit per share) | 2026 | 2025 | |||||||||
| Sales and Revenues | $20.7 | $17.6 | |||||||||
| Profit Per Share | $7.13 | $4.88 | |||||||||
| Adjusted Profit Per Share | $7.20 | $4.95 | |||||||||
Please see a reconciliation of GAAP to non-GAAP financial measures in the appendix on pages 12 and 13. | |||||||||||
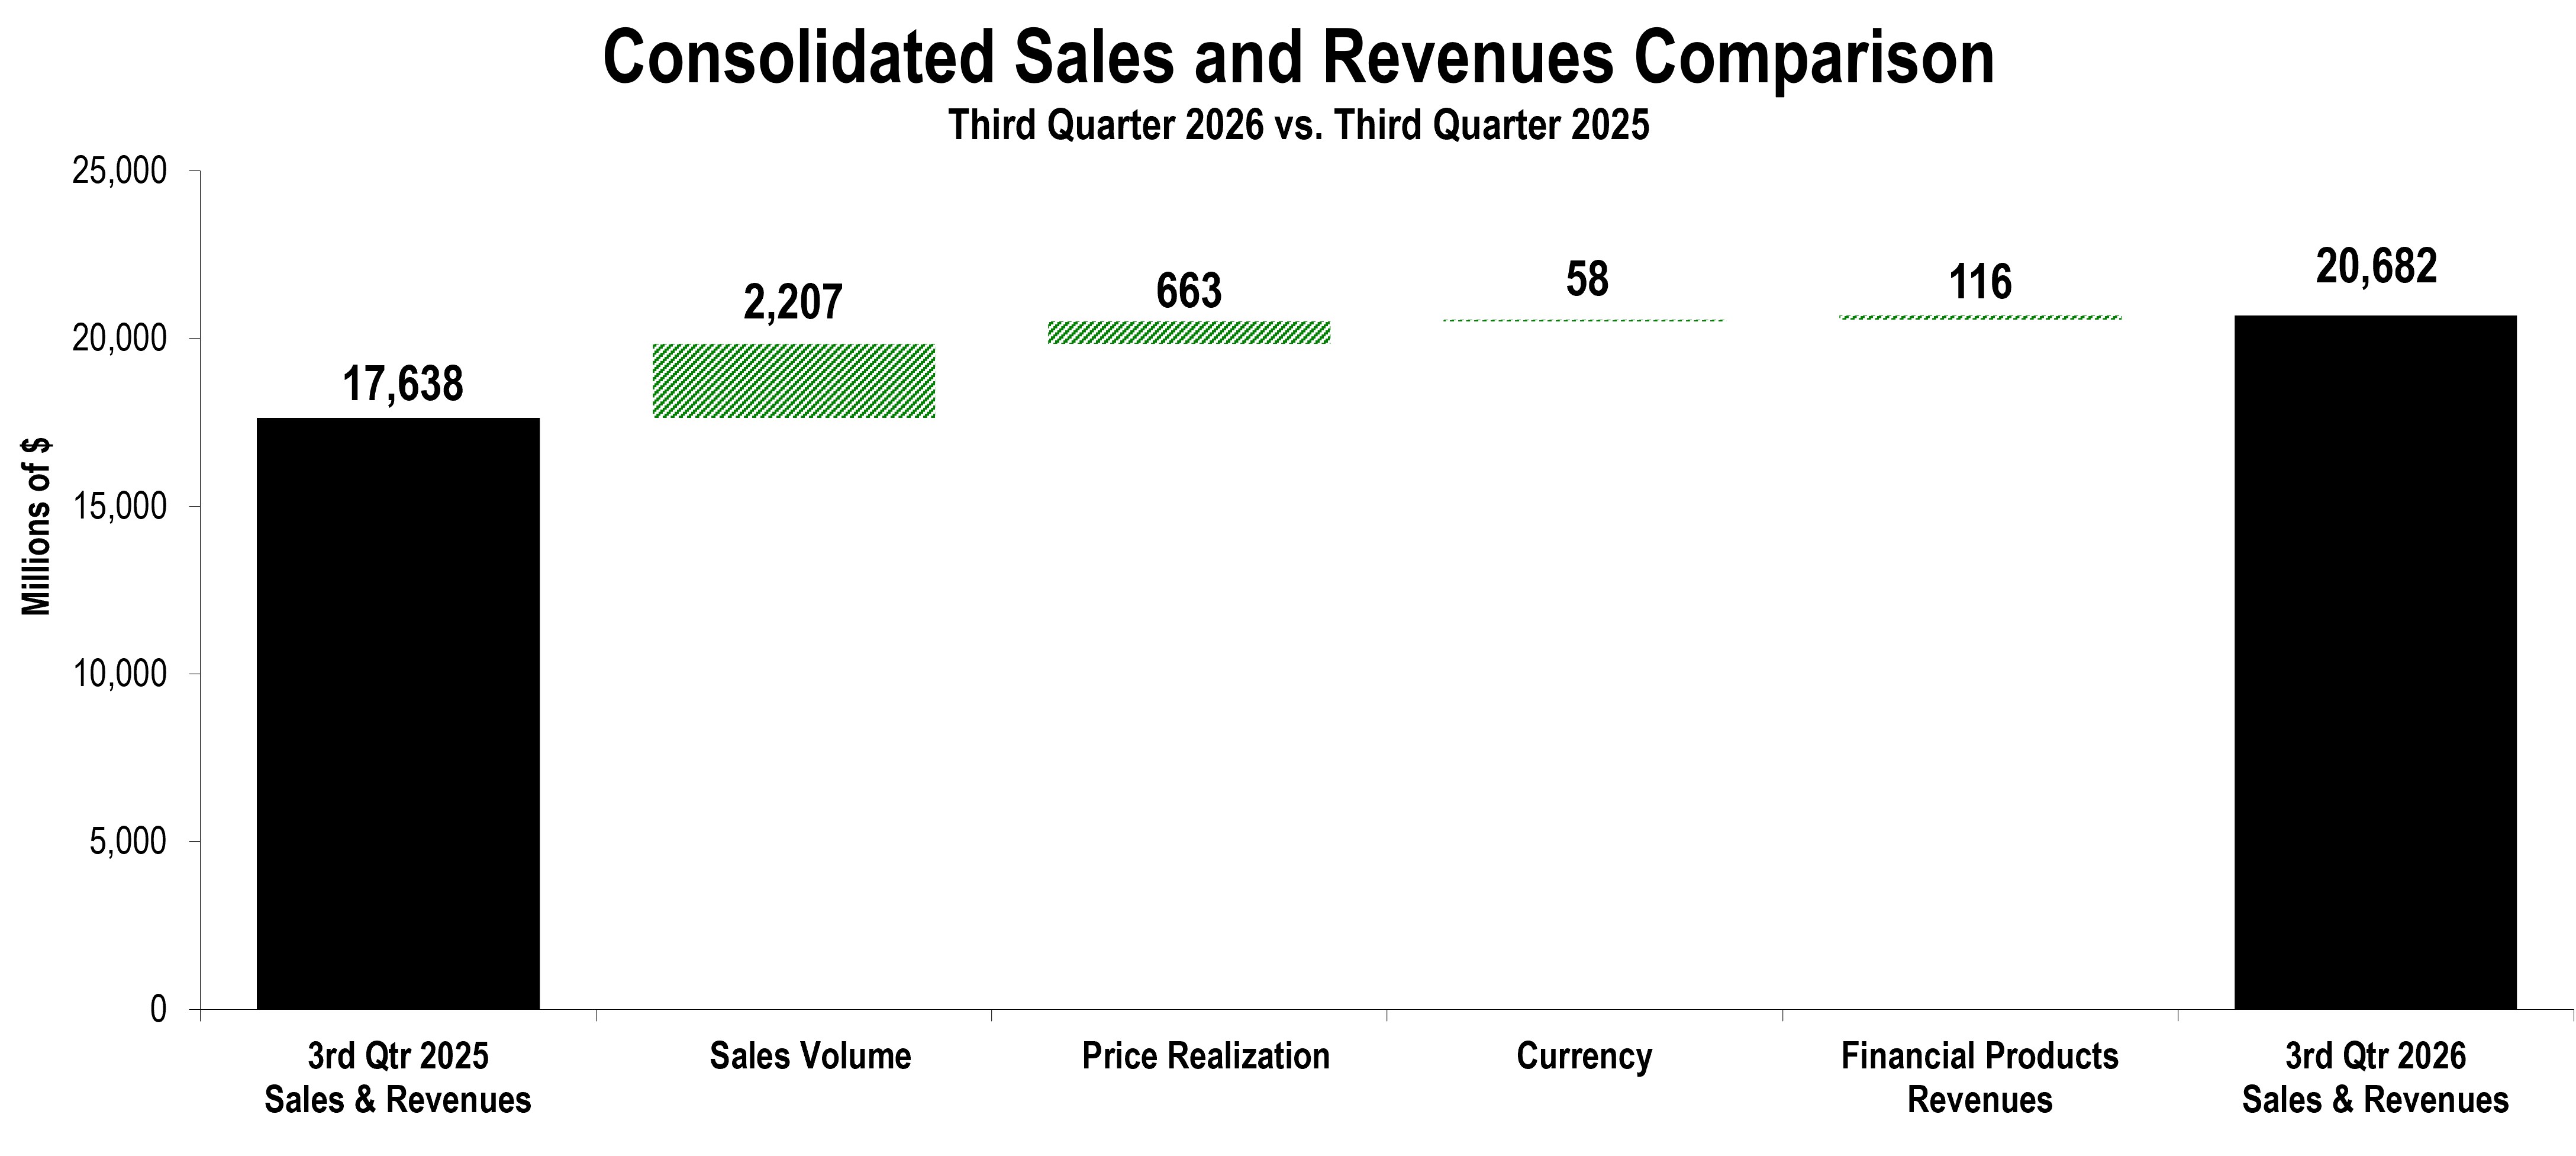
| ● | Third-quarter 2026 sales and revenues increased 17% to $20.7 billion | ||||
| ● | Third-quarter 2026 profit per share of $7.13; adjusted profit per share of $7.20 | ||||
| ● | Deployed $2.0 billion of cash for share repurchases and dividends in the third quarter | ||||
| Sales and Revenues by Segment | |||||||||||||||||||||||||||||||||||||||||||||||
| (Millions of dollars) | Third Quarter 2025 | Sales Volume | Price Realization | Currency | Inter-Segment / Other | Third Quarter 2026 | $ Change | % Change | |||||||||||||||||||||||||||||||||||||||
| Power & Energy | $ | 7,463 | $ | 879 | $ | 216 | $ | 12 | $ | 214 | $ | 8,784 | $ | 1,321 | 18% | ||||||||||||||||||||||||||||||||
| Construction Industries | 6,760 | 874 | 349 | 2 | (2) | 7,983 | 1,223 | 18% | |||||||||||||||||||||||||||||||||||||||
| Resource Industries | 3,999 | 478 | 96 | 40 | 2 | 4,615 | 616 | 15% | |||||||||||||||||||||||||||||||||||||||
| All Other Segment | 73 | 5 | — | — | (6) | 72 | (1) | (1%) | |||||||||||||||||||||||||||||||||||||||
| Corporate Items and Eliminations | (1,569) | (29) | 2 | 4 | (208) | (1,800) | (231) | ||||||||||||||||||||||||||||||||||||||||
| Machinery, Power & Energy | 16,726 | 2,207 | 663 | 58 | — | 19,654 | 2,928 | 18% | |||||||||||||||||||||||||||||||||||||||
| Financial Products Segment | 1,076 | — | — | — | 101 | 1,177 | 101 | 9% | |||||||||||||||||||||||||||||||||||||||
| Corporate Items and Eliminations | (164) | — | — | — | 15 | (149) | 15 | ||||||||||||||||||||||||||||||||||||||||
| Financial Products Revenues | 912 | — | — | — | 116 | 1,028 | 116 | 13% | |||||||||||||||||||||||||||||||||||||||
| Consolidated Sales and Revenues | $ | 17,638 | $ | 2,207 | $ | 663 | $ | 58 | $ | 116 | $ | 20,682 | $ | 3,044 | 17% | ||||||||||||||||||||||||||||||||
| Sales and Revenues by Geographic Region | |||||||||||||||||||||||||||||||||||||||||||||||||||||||||||||||||||||||||||||||||||
| North America | Latin America | EAME | Asia/Pacific | External Sales and Revenues | Inter-Segment | Total Sales and Revenues | |||||||||||||||||||||||||||||||||||||||||||||||||||||||||||||||||||||||||||||
| (Millions of dollars) | $ | % Chg | $ | % Chg | $ | % Chg | $ | % Chg | $ | % Chg | $ | % Chg | $ | % Chg | |||||||||||||||||||||||||||||||||||||||||||||||||||||||||||||||||||||
| Third Quarter 2026 | |||||||||||||||||||||||||||||||||||||||||||||||||||||||||||||||||||||||||||||||||||
| Power & Energy | $ | 4,395 | 26% | $ | 435 | (12%) | $ | 1,580 | 22% | $ | 878 | (4%) | $ | 7,288 | 18% | $ | 1,496 | 17% | $ | 8,784 | 18% | ||||||||||||||||||||||||||||||||||||||||||||||||||||||||||||||
| Construction Industries | 4,796 | 23% | 825 | 26% | 1,366 | 12% | 925 | 2% | 7,912 | 18% | 71 | (3%) | 7,983 | 18% | |||||||||||||||||||||||||||||||||||||||||||||||||||||||||||||||||||||
| Resource Industries | 2,180 | 27% | 759 | 25% | 674 | 10% | 916 | (6%) | 4,529 | 16% | 86 | 2% | 4,615 | 15% | |||||||||||||||||||||||||||||||||||||||||||||||||||||||||||||||||||||
| All Other Segment | 9 | 80% | — | —% | 3 | 50% | 3 | —% | 15 | 50% | 57 | (10%) | 72 | (1%) | |||||||||||||||||||||||||||||||||||||||||||||||||||||||||||||||||||||
| Corporate Items and Eliminations | (81) | 2 | (4) | (7) | (90) | (1,710) | (1,800) | ||||||||||||||||||||||||||||||||||||||||||||||||||||||||||||||||||||||||||||
| Machinery, Power & Energy | 11,299 | 25% | 2,021 | 15% | 3,619 | 16% | 2,715 | (3%) | 19,654 | 18% | — | —% | 19,654 | 18% | |||||||||||||||||||||||||||||||||||||||||||||||||||||||||||||||||||||
| Financial Products Segment | 780 | 8% | 132 | 12% | 142 | 9% | 123 | 16% | 1,177 | 9% | — | —% | 1,177 | 9% | |||||||||||||||||||||||||||||||||||||||||||||||||||||||||||||||||||||
| Corporate Items and Eliminations | (62) | (29) | (33) | (25) | (149) | — | (149) | ||||||||||||||||||||||||||||||||||||||||||||||||||||||||||||||||||||||||||||
| Financial Products Revenues | 718 | 15% | 103 | 12% | 109 | 2% | 98 | 13% | 1,028 | 13% | — | —% | 1,028 | 13% | |||||||||||||||||||||||||||||||||||||||||||||||||||||||||||||||||||||
| Consolidated Sales and Revenues | $ | 12,017 | 24% | $ | 2,124 | 15% | $ | 3,728 | 15% | $ | 2,813 | (2%) | $ | 20,682 | 17% | $ | — | —% | $ | 20,682 | 17% | ||||||||||||||||||||||||||||||||||||||||||||||||||||||||||||||
| Third Quarter 2025 | |||||||||||||||||||||||||||||||||||||||||||||||||||||||||||||||||||||||||||||||||||
| Power & Energy | $ | 3,478 | $ | 496 | $ | 1,296 | $ | 911 | $ | 6,181 | $ | 1,282 | $ | 7,463 | |||||||||||||||||||||||||||||||||||||||||||||||||||||||||||||||||||||
| Construction Industries | 3,912 | 654 | 1,217 | 904 | 6,687 | 73 | 6,760 | ||||||||||||||||||||||||||||||||||||||||||||||||||||||||||||||||||||||||||||
| Resource Industries | 1,721 | 605 | 612 | 977 | 3,915 | 84 | 3,999 | ||||||||||||||||||||||||||||||||||||||||||||||||||||||||||||||||||||||||||||
| All Other Segment | 5 | — | 2 | 3 | 10 | 63 | 73 | ||||||||||||||||||||||||||||||||||||||||||||||||||||||||||||||||||||||||||||
| Corporate Items and Eliminations | (61) | 3 | (3) | (6) | (67) | (1,502) | (1,569) | ||||||||||||||||||||||||||||||||||||||||||||||||||||||||||||||||||||||||||||
| Machinery, Power & Energy | 9,055 | 1,758 | 3,124 | 2,789 | 16,726 | — | 16,726 | ||||||||||||||||||||||||||||||||||||||||||||||||||||||||||||||||||||||||||||
| Financial Products Segment | 722 | 118 | 130 | 106 | 1,076 | — | 1,076 | ||||||||||||||||||||||||||||||||||||||||||||||||||||||||||||||||||||||||||||
| Corporate Items and Eliminations | (96) | (26) | (23) | (19) | (164) | — | (164) | ||||||||||||||||||||||||||||||||||||||||||||||||||||||||||||||||||||||||||||
| Financial Products Revenues | 626 | 92 | 107 | 87 | 912 | — | 912 | ||||||||||||||||||||||||||||||||||||||||||||||||||||||||||||||||||||||||||||
| Consolidated Sales and Revenues | $ | 9,681 | $ | 1,850 | $ | 3,231 | $ | 2,876 | $ | 17,638 | $ | — | $ | 17,638 | |||||||||||||||||||||||||||||||||||||||||||||||||||||||||||||||||||||
| Profit (Loss) by Segment | |||||||||||||||||||||||
| (Millions of dollars) | Third Quarter 2026 | Third Quarter 2025 | $ Change | % Change | |||||||||||||||||||
| Power & Energy | $ | 2,143 | $ | 1,633 | $ | 510 | 31 | % | |||||||||||||||
| Construction Industries | 1,831 | 1,377 | 454 | 33 | % | ||||||||||||||||||
| Resource Industries | 622 | 544 | 78 | 14 | % | ||||||||||||||||||
| All Other Segment | (2) | (6) | 4 | 67 | % | ||||||||||||||||||
| Corporate Items and Eliminations | (450) | (546) | 96 | ||||||||||||||||||||
| Machinery, Power & Energy | 4,144 | 3,002 | 1,142 | 38 | % | ||||||||||||||||||
| Financial Products Segment | 264 | 241 | 23 | 10 | % | ||||||||||||||||||
| Corporate Items and Eliminations | (3) | (38) | 35 | ||||||||||||||||||||
| Financial Products | 261 | 203 | 58 | 29 | % | ||||||||||||||||||
| Consolidating Adjustments | (191) | (153) | (38) | ||||||||||||||||||||
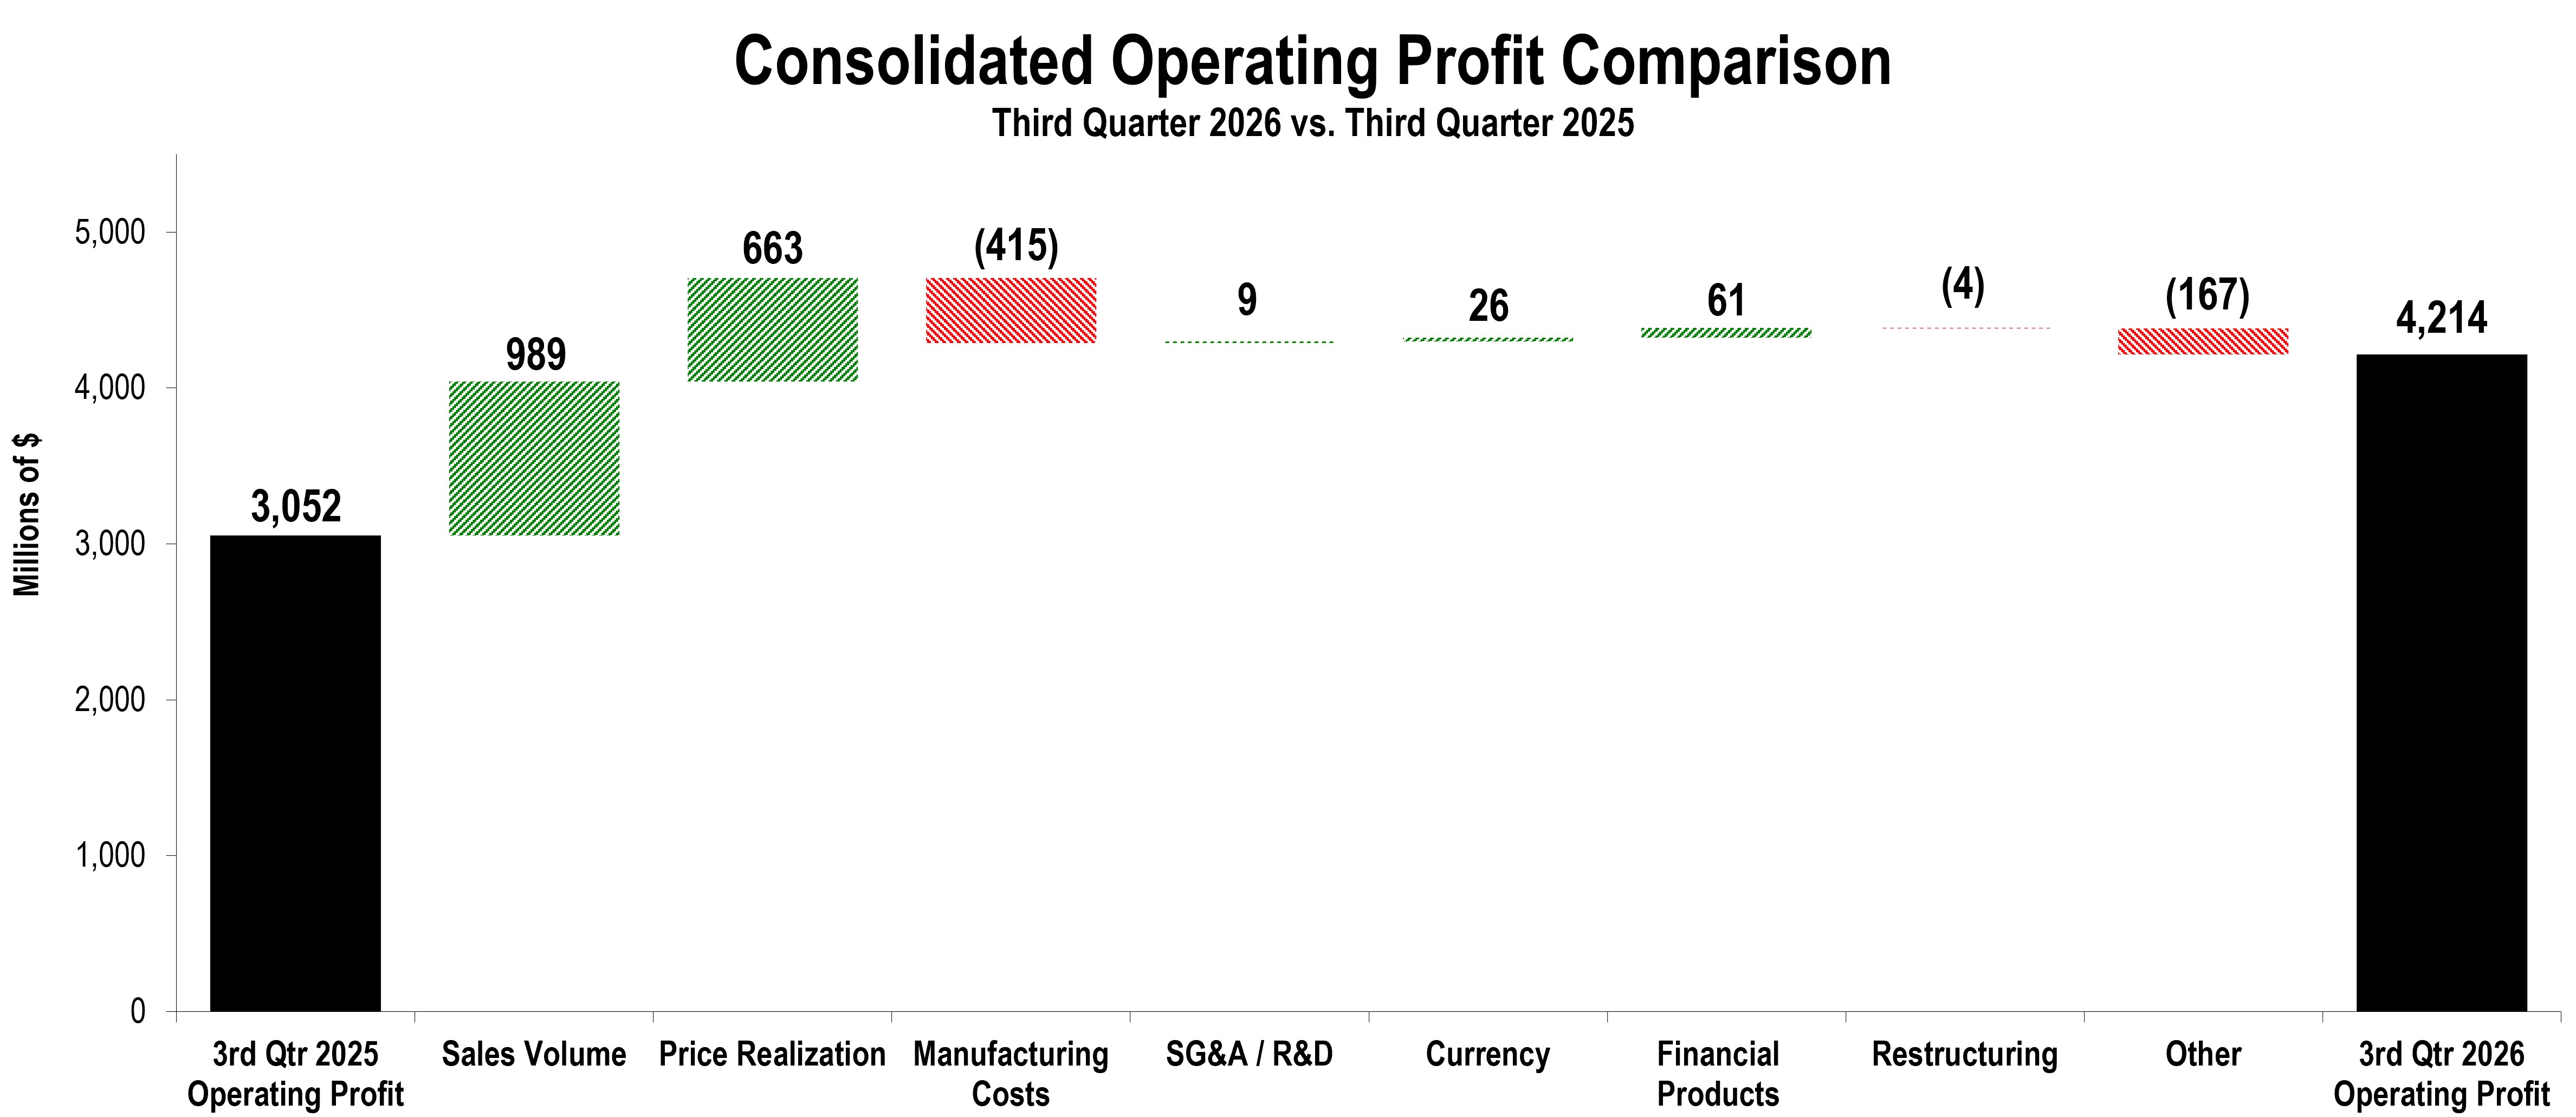
| Consolidated Operating Profit | $ | 4,214 | $ | 3,052 | $ | 1,162 | 38 | % | |||||||||||||||
| POWER & ENERGY | ||||||||||||||||||||||||||||||||||||||||||||||||||
| (Millions of dollars) | ||||||||||||||||||||||||||||||||||||||||||||||||||
| Segment Sales | ||||||||||||||||||||||||||||||||||||||||||||||||||
| Third Quarter 2025 | Sales Volume | Price Realization | Currency | Inter-Segment | Third Quarter 2026 | $ Change | % Change | |||||||||||||||||||||||||||||||||||||||||||
| Total Sales | $ | 7,463 | $ | 879 | $ | 216 | $ | 12 | $ | 214 | $ | 8,784 | $ | 1,321 | 18 | % | ||||||||||||||||||||||||||||||||||
| Sales by Application | ||||||||||||||||||||||||||||||||||||||||||||||||||
| Third Quarter 2026 | Third Quarter 2025 | $ Change | % Change | |||||||||||||||||||||||||||||||||||||||||||||||
| Power Generation | $ | 3,421 | $ | 2,634 | $ | 787 | 30 | % | ||||||||||||||||||||||||||||||||||||||||||
| Oil and Gas | 2,236 | 1,979 | 257 | 13 | % | |||||||||||||||||||||||||||||||||||||||||||||
| Industrial | 1,631 | 1,568 | 63 | 4 | % | |||||||||||||||||||||||||||||||||||||||||||||
| External Sales | 7,288 | 6,181 | 1,107 | 18 | % | |||||||||||||||||||||||||||||||||||||||||||||
| Inter-segment | 1,496 | 1,282 | 214 | 17 | % | |||||||||||||||||||||||||||||||||||||||||||||
| Total Sales | $ | 8,784 | $ | 7,463 | $ | 1,321 | 18 | % | ||||||||||||||||||||||||||||||||||||||||||
| Segment Profit | ||||||||||||||||||||||||||||||||||||||||||||||||||
| Third Quarter 2026 | Third Quarter 2025 | Change | % Change | |||||||||||||||||||||||||||||||||||||||||||||||
| Segment Profit | $ | 2,143 | $ | 1,633 | $ | 510 | 31 | % | ||||||||||||||||||||||||||||||||||||||||||
| Segment Profit Margin | 24.4 | % | 21.9 | % | 2.5 | pts | ||||||||||||||||||||||||||||||||||||||||||||
| CONSTRUCTION INDUSTRIES | ||||||||||||||||||||||||||||||||||||||||||||||||||
| (Millions of dollars) | ||||||||||||||||||||||||||||||||||||||||||||||||||
| Segment Sales | ||||||||||||||||||||||||||||||||||||||||||||||||||
| Third Quarter 2025 | Sales Volume | Price Realization | Currency | Inter-Segment | Third Quarter 2026 | $ Change | % Change | |||||||||||||||||||||||||||||||||||||||||||
| Total Sales | $ | 6,760 | $ | 874 | $ | 349 | $ | 2 | $ | (2) | $ | 7,983 | $ | 1,223 | 18 | % | ||||||||||||||||||||||||||||||||||
| Sales by Geographic Region | ||||||||||||||||||||||||||||||||||||||||||||||||||
| Third Quarter 2026 | Third Quarter 2025 | $ Change | % Change | |||||||||||||||||||||||||||||||||||||||||||||||
| North America | $ | 4,796 | $ | 3,912 | $ | 884 | 23 | % | ||||||||||||||||||||||||||||||||||||||||||
| Latin America | 825 | 654 | 171 | 26 | % | |||||||||||||||||||||||||||||||||||||||||||||
| EAME | 1,366 | 1,217 | 149 | 12 | % | |||||||||||||||||||||||||||||||||||||||||||||
| Asia/Pacific | 925 | 904 | 21 | 2 | % | |||||||||||||||||||||||||||||||||||||||||||||
| External Sales | 7,912 | 6,687 | 1,225 | 18 | % | |||||||||||||||||||||||||||||||||||||||||||||
| Inter-segment | 71 | 73 | (2) | (3 | %) | |||||||||||||||||||||||||||||||||||||||||||||
| Total Sales | $ | 7,983 | $ | 6,760 | $ | 1,223 | 18 | % | ||||||||||||||||||||||||||||||||||||||||||
| Segment Profit | ||||||||||||||||||||||||||||||||||||||||||||||||||
| Third Quarter 2026 | Third Quarter 2025 | Change | % Change | |||||||||||||||||||||||||||||||||||||||||||||||
| Segment Profit | $ | 1,831 | $ | 1,377 | $ | 454 | 33 | % | ||||||||||||||||||||||||||||||||||||||||||
| Segment Profit Margin | 22.9 | % | 20.4 | % | 2.5 | pts | ||||||||||||||||||||||||||||||||||||||||||||
| RESOURCE INDUSTRIES | ||||||||||||||||||||||||||||||||||||||||||||||||||
| (Millions of dollars) | ||||||||||||||||||||||||||||||||||||||||||||||||||
| Segment Sales | ||||||||||||||||||||||||||||||||||||||||||||||||||
| Third Quarter 2025 | Sales Volume | Price Realization | Currency | Inter-Segment | Third Quarter 2026 | $ Change | % Change | |||||||||||||||||||||||||||||||||||||||||||
| Total Sales | $ | 3,999 | $ | 478 | $ | 96 | $ | 40 | $ | 2 | $ | 4,615 | $ | 616 | 15 | % | ||||||||||||||||||||||||||||||||||
| Sales by Industry | ||||||||||||||||||||||||||||||||||||||||||||||||||
| Third Quarter 2026 | Third Quarter 2025 | $ Change | % Change | |||||||||||||||||||||||||||||||||||||||||||||||
| Mining, HC and Q&A* | $ | 3,697 | $ | 3,036 | $ | 661 | 22 | % | ||||||||||||||||||||||||||||||||||||||||||
| Rail | 832 | 879 | (47) | (5 | %) | |||||||||||||||||||||||||||||||||||||||||||||
| External Sales | 4,529 | 3,915 | 614 | 16 | % | |||||||||||||||||||||||||||||||||||||||||||||
| Inter-segment | 86 | 84 | 2 | 2 | % | |||||||||||||||||||||||||||||||||||||||||||||
| Total Sales | $ | 4,615 | $ | 3,999 | $ | 616 | 15 | % | ||||||||||||||||||||||||||||||||||||||||||
*Heavy Construction and Quarry & Aggregates (HC and Q&A) | ||||||||||||||||||||||||||||||||||||||||||||||||||
| Segment Profit | ||||||||||||||||||||||||||||||||||||||||||||||||||
| Third Quarter 2026 | Third Quarter 2025 | Change | % Change | |||||||||||||||||||||||||||||||||||||||||||||||
| Segment Profit | $ | 622 | $ | 544 | $ | 78 | 14 | % | ||||||||||||||||||||||||||||||||||||||||||
| Segment Profit Margin | 13.5 | % | 13.6 | % | (0.1 | pts) | ||||||||||||||||||||||||||||||||||||||||||||
| FINANCIAL PRODUCTS SEGMENT | ||||||||||||||||||||||||||||||||||||||||||||||||||
| (Millions of dollars) | ||||||||||||||||||||||||||||||||||||||||||||||||||
| Revenues by Geographic Region | ||||||||||||||||||||||||||||||||||||||||||||||||||
| Third Quarter 2026 | Third Quarter 2025 | $ Change | % Change | |||||||||||||||||||||||||||||||||||||||||||||||
| North America | $ | 780 | $ | 722 | $ | 58 | 8 | % | ||||||||||||||||||||||||||||||||||||||||||
| Latin America | 132 | 118 | 14 | 12 | % | |||||||||||||||||||||||||||||||||||||||||||||
| EAME | 142 | 130 | 12 | 9 | % | |||||||||||||||||||||||||||||||||||||||||||||
| Asia/Pacific | 123 | 106 | 17 | 16 | % | |||||||||||||||||||||||||||||||||||||||||||||
| Total Revenues | $ | 1,177 | $ | 1,076 | $ | 101 | 9 | % | ||||||||||||||||||||||||||||||||||||||||||
| Segment Profit | ||||||||||||||||||||||||||||||||||||||||||||||||||
| Third Quarter 2026 | Third Quarter 2025 | Change | % Change | |||||||||||||||||||||||||||||||||||||||||||||||
| Segment Profit | $ | 264 | $ | 241 | $ | 23 | 10 | % | ||||||||||||||||||||||||||||||||||||||||||
| (Dollars in millions except per share data) | Operating Profit | Operating Profit Margin | Profit Before Taxes | Provision (Benefit) for Income Taxes | Profit | Profit per Share | |||||||||||||||||||||||||||||||||||
Three Months Ended September 30, 2026 - U.S. GAAP | $ | 4,214 | 20.4 | % | $ | 4,220 | $ | 968 | $ | 3,287 | $ | 7.13 | |||||||||||||||||||||||||||||
| Restructuring costs | 41 | 0.2 | % | 41 | 9 | 32 | 0.07 | ||||||||||||||||||||||||||||||||||
Three Months Ended September 30, 2026 - Adjusted | $ | 4,255 | 20.6 | % | $ | 4,261 | $ | 977 | $ | 3,319 | $ | 7.20 | |||||||||||||||||||||||||||||
Three Months Ended September 30, 2025 - U.S. GAAP | $ | 3,052 | 17.3 | % | $ | 3,127 | $ | 836 | $ | 2,300 | $ | 4.88 | |||||||||||||||||||||||||||||
| Restructuring costs | 37 | 0.2 | % | 37 | 9 | 28 | 0.07 | ||||||||||||||||||||||||||||||||||
Three Months Ended September 30, 2025 - Adjusted | $ | 3,089 | 17.5 | % | $ | 3,164 | $ | 845 | $ | 2,328 | $ | 4.95 | |||||||||||||||||||||||||||||
| (Dollars in millions) | Profit Before Taxes | Provision (Benefit) for Income Taxes | Effective Tax Rate | |||||||||||||||||
Three Months Ended September 30, 2026 - U.S. GAAP | $ | 4,220 | 968 | 22.9 | % | |||||||||||||||
| Excess stock-based compensation | — | 3 | ||||||||||||||||||
| Annual effective tax rate, excluding discrete items | $ | 4,220 | $ | 971 | 23.0 | % | ||||||||||||||
| Excess stock-based compensation | — | (3) | ||||||||||||||||||
| Restructuring costs | 41 | 9 | ||||||||||||||||||
Three Months Ended September 30, 2026 - Adjusted | $ | 4,261 | $ | 977 | ||||||||||||||||
Three Months Ended September 30, 2025 - U.S. GAAP | $ | 3,127 | $ | 836 | 26.7 | % | ||||||||||||||
| Increase in annual effective tax rate | — | (54) | ||||||||||||||||||
| Changes in estimates related to prior years | — | (41) | ||||||||||||||||||
| Excess stock-based compensation | — | 10 | ||||||||||||||||||
| Annual effective tax rate, excluding discrete items | $ | 3,127 | $ | 751 | 24.0 | % | ||||||||||||||
| Increase in annual effective tax rate | — | 54 | ||||||||||||||||||
| Changes in estimates related to prior years | — | 41 | ||||||||||||||||||
| Excess stock-based compensation | — | (10) | ||||||||||||||||||
| Restructuring costs | 37 | 9 | ||||||||||||||||||
Three Months Ended September 30, 2025 - Adjusted | $ | 3,164 | $ | 845 | ||||||||||||||||
| Three Months Ended September 30, | Nine Months Ended September 30, | ||||||||||||||||||||||
| 2026 | 2025 | 2026 | 2025 | ||||||||||||||||||||
| Sales and revenues: | |||||||||||||||||||||||
| Sales of Machinery, Power & Energy | $ | 19,654 | $ | 16,726 | $ | 55,708 | $ | 45,778 | |||||||||||||||
| Revenues of Financial Products | 1,028 | 912 | 2,932 | 2,678 | |||||||||||||||||||
| Total sales and revenues | 20,682 | 17,638 | 58,640 | 48,456 | |||||||||||||||||||
| Operating costs: | |||||||||||||||||||||||
| Cost of goods sold | 13,332 | 11,673 | 37,419 | 31,445 | |||||||||||||||||||
| Selling, general and administrative expenses | 1,797 | 1,822 | 5,631 | 5,109 | |||||||||||||||||||
| Research and development expenses | 596 | 555 | 1,749 | 1,586 | |||||||||||||||||||
| Interest expense of Financial Products | 384 | 346 | 1,091 | 1,008 | |||||||||||||||||||
| Other operating (income) expenses | 359 | 190 | 1,156 | 817 | |||||||||||||||||||
| Total operating costs | 16,468 | 14,586 | 47,046 | 39,965 | |||||||||||||||||||
| Operating profit | 4,214 | 3,052 | 11,594 | 8,491 | |||||||||||||||||||
| Interest expense excluding Financial Products | 129 | 133 | 398 | 375 | |||||||||||||||||||
| Other income (expense) | 135 | 208 | 793 | 399 | |||||||||||||||||||
| Consolidated profit before taxes | 4,220 | 3,127 | 11,989 | 8,515 | |||||||||||||||||||
| Provision (benefit) for income taxes | 968 | 836 | 2,693 | 2,056 | |||||||||||||||||||
| Profit of consolidated companies | 3,252 | 2,291 | 9,296 | 6,459 | |||||||||||||||||||
| Equity in profit (loss) of unconsolidated affiliated companies | 34 | 8 | 131 | 22 | |||||||||||||||||||
| Profit of consolidated and affiliated companies | 3,286 | 2,299 | 9,427 | 6,481 | |||||||||||||||||||
| Less: Profit (loss) attributable to noncontrolling interests | (1) | (1) | (2) | (1) | |||||||||||||||||||
Profit 1 | $ | 3,287 | $ | 2,300 | $ | 9,429 | $ | 6,482 | |||||||||||||||
| Profit per common share | $ | 7.16 | $ | 4.91 | $ | 20.45 | $ | 13.76 | |||||||||||||||
Profit per common share — diluted 2 | $ | 7.13 | $ | 4.88 | $ | 20.36 | $ | 13.69 | |||||||||||||||
| Weighted-average common shares outstanding (millions) | |||||||||||||||||||||||
| – Basic | 459.1 | 468.6 | 461.0 | 471.3 | |||||||||||||||||||
– Diluted 2 | 460.9 | 470.8 | 463.2 | 473.4 | |||||||||||||||||||
| 1 | Profit attributable to common shareholders. | ||||
| 2 | Diluted by assumed exercise of stock-based compensation awards using the treasury stock method. | ||||
| September 30, 2026 | December 31, 2025 | ||||||||||
| Assets | |||||||||||
| Current assets: | |||||||||||
| Cash and cash equivalents | $ | 7,929 | $ | 9,980 | |||||||
| Receivables – trade and other | 13,440 | 10,920 | |||||||||
| Receivables – finance | 11,051 | 10,649 | |||||||||
| Prepaid expenses and other current assets | 3,200 | 2,801 | |||||||||
| Inventories | 22,214 | 18,135 | |||||||||
| Total current assets | 57,834 | 52,485 | |||||||||
| Property, plant and equipment – net | 16,011 | 15,140 | |||||||||
| Long-term receivables – trade and other | 3,348 | 2,142 | |||||||||
| Long-term receivables – finance | 14,402 | 14,272 | |||||||||
| Noncurrent deferred and refundable income taxes | 2,235 | 2,882 | |||||||||
| Intangible assets | 409 | 241 | |||||||||
| Goodwill | 5,905 | 5,321 | |||||||||
| Other assets | 6,699 | 6,102 | |||||||||
| Total assets | $ | 106,843 | $ | 98,585 | |||||||
| Liabilities | |||||||||||
| Current liabilities: | |||||||||||
| Short-term borrowings: | |||||||||||
| -- Financial Products | $ | 4,855 | $ | 5,514 | |||||||
| Accounts payable | 10,573 | 8,968 | |||||||||
| Accrued expenses | 6,038 | 5,587 | |||||||||
| Accrued wages, salaries and employee benefits | 2,663 | 2,554 | |||||||||
| Customer advances | 5,329 | 3,314 | |||||||||
| Dividends payable | — | 703 | |||||||||
| Other current liabilities | 3,028 | 2,798 | |||||||||
| Long-term debt due within one year: | |||||||||||
| -- Machinery, Power & Energy | 36 | 35 | |||||||||
| -- Financial Products | 8,144 | 7,085 | |||||||||
| Total current liabilities | 40,666 | 36,558 | |||||||||
| Long-term debt due after one year: | |||||||||||
| -- Machinery, Power & Energy | 10,614 | 10,678 | |||||||||
| -- Financial Products | 21,552 | 20,018 | |||||||||
| Liability for postemployment benefits | 3,610 | 3,838 | |||||||||
| Other liabilities | 8,919 | 6,175 | |||||||||
| Total liabilities | 85,361 | 77,267 | |||||||||
| Shareholders’ equity | |||||||||||
| Common stock | 6,658 | 7,181 | |||||||||
| Treasury stock | (56,702) | (49,539) | |||||||||
| Profit employed in the business | 73,428 | 65,448 | |||||||||
| Accumulated other comprehensive income (loss) | (1,901) | (1,772) | |||||||||
| Noncontrolling interests | (1) | — | |||||||||
| Total shareholders’ equity | 21,482 | 21,318 | |||||||||
| Total liabilities and shareholders’ equity | $ | 106,843 | $ | 98,585 | |||||||
| Nine Months Ended September 30, | |||||||||||
| 2026 | 2025 | ||||||||||
| Cash flow from operating activities: | |||||||||||
| Profit of consolidated and affiliated companies | $ | 9,427 | $ | 6,481 | |||||||
| Adjustments to reconcile profit to net cash provided by operating activities: | |||||||||||
| Depreciation and amortization | 1,826 | 1,664 | |||||||||
| Provision (benefit) for deferred income taxes | 630 | 300 | |||||||||
| (Gain) loss on divestiture | 139 | — | |||||||||
| Other | 249 | 509 | |||||||||
| Changes in assets and liabilities, net of acquisitions and divestitures: | |||||||||||
| Receivables – trade and other | (3,761) | (788) | |||||||||
| Inventories | (4,118) | (2,015) | |||||||||
| Accounts payable | 1,752 | 1,086 | |||||||||
| Accrued expenses | 354 | 51 | |||||||||
| Accrued wages, salaries and employee benefits | 107 | (296) | |||||||||
| Customer advances | 4,002 | 1,649 | |||||||||
| Other assets – net | (251) | (138) | |||||||||
| Other liabilities – net | 237 | (355) | |||||||||
| Net cash provided by (used for) operating activities | 10,593 | 8,148 | |||||||||
| Cash flow from investing activities: | |||||||||||
| Capital expenditures – excluding equipment leased to others | (2,012) | (1,923) | |||||||||
| Expenditures for equipment leased to others | (1,214) | (1,021) | |||||||||
| Proceeds from disposals of leased assets and property, plant and equipment | 773 | 544 | |||||||||
| Additions to finance receivables | (13,123) | (10,964) | |||||||||
| Collections of finance receivables | 12,149 | 9,890 | |||||||||
| Proceeds from sale of finance receivables | 56 | 26 | |||||||||
| Investments and acquisitions (net of cash acquired) | (893) | (26) | |||||||||
| Proceeds from sale of businesses and investments (net of cash sold) | (92) | 12 | |||||||||
| Proceeds from maturities and sale of securities | 1,303 | 1,945 | |||||||||
| Investments in securities | (1,872) | (1,291) | |||||||||
| Other – net | 170 | (19) | |||||||||
| Net cash provided by (used for) investing activities | (4,755) | (2,827) | |||||||||
| Cash flow from financing activities: | |||||||||||
| Dividends paid | (2,148) | (2,043) | |||||||||
| Common stock issued, and other stock compensation transactions, net | (131) | (39) | |||||||||
| Payments to purchase common stock | (7,745) | (4,850) | |||||||||
| Excise tax paid on purchases of common stock | (49) | (73) | |||||||||
| Proceeds from debt issued (original maturities greater than three months) | 10,490 | 8,454 | |||||||||
| Payments on debt (original maturities greater than three months) | (7,495) | (6,205) | |||||||||
| Short-term borrowings – net (original maturities three months or less) | (748) | 106 | |||||||||
| Net cash provided by (used for) financing activities | (7,826) | (4,650) | |||||||||
| Effect of exchange rate changes on cash | (63) | (23) | |||||||||
| Increase (decrease) in cash, cash equivalents and restricted cash | (2,051) | 648 | |||||||||
| Cash, cash equivalents and restricted cash at beginning of period | 9,986 | 6,896 | |||||||||
| Cash, cash equivalents and restricted cash at end of period | $ | 7,935 | $ | 7,544 | |||||||
Cash equivalents primarily represent short-term, highly liquid investments with original maturities of generally three months or less. | ||
| Supplemental Consolidating Data | ||||||||||||||||||||||||||
| Consolidated | Machinery, Power & Energy | Financial Products | Consolidating Adjustments | |||||||||||||||||||||||
| Sales and revenues: | ||||||||||||||||||||||||||
| Sales of Machinery, Power & Energy | $ | 19,654 | $ | 19,654 | $ | — | $ | — | ||||||||||||||||||
| Revenues of Financial Products | 1,028 | — | 1,261 | (233) | 1 | |||||||||||||||||||||
| Total sales and revenues | 20,682 | 19,654 | 1,261 | (233) | ||||||||||||||||||||||
| Operating costs: | ||||||||||||||||||||||||||
| Cost of goods sold | 13,332 | 13,332 | — | — | ||||||||||||||||||||||
| Selling, general and administrative expenses | 1,797 | 1,571 | 245 | (19) | 2 | |||||||||||||||||||||
| Research and development expenses | 596 | 596 | — | — | ||||||||||||||||||||||
| Interest expense of Financial Products | 384 | — | 397 | (13) | 2 | |||||||||||||||||||||
| Other operating (income) expenses | 359 | 11 | 358 | (10) | 2 | |||||||||||||||||||||
| Total operating costs | 16,468 | 15,510 | 1,000 | (42) | ||||||||||||||||||||||
| Operating profit | 4,214 | 4,144 | 261 | (191) | ||||||||||||||||||||||
| Interest expense excluding Financial Products | 129 | 135 | — | (6) | 3 | |||||||||||||||||||||
| Other income (expense) | 135 | (77) | 27 | 185 | 4 | |||||||||||||||||||||
| Consolidated profit before taxes | 4,220 | 3,932 | 288 | — | ||||||||||||||||||||||
| Provision (benefit) for income taxes | 968 | 899 | 69 | — | ||||||||||||||||||||||
| Profit of consolidated companies | 3,252 | 3,033 | 219 | — | ||||||||||||||||||||||
| Equity in profit (loss) of unconsolidated affiliated companies | 34 | 34 | — | — | ||||||||||||||||||||||
| Profit of consolidated and affiliated companies | 3,286 | 3,067 | 219 | — | ||||||||||||||||||||||
| Less: Profit (loss) attributable to noncontrolling interests | (1) | (1) | — | — | ||||||||||||||||||||||
Profit 5 | $ | 3,287 | $ | 3,068 | $ | 219 | $ | — | ||||||||||||||||||
| 1 | Elimination of Financial Products’ revenues earned from MP&E. | ||||
| 2 | Elimination of net expenses recorded between MP&E and Financial Products. | ||||
| 3 | Elimination of interest expense recorded between Financial Products and MP&E. | ||||
| 4 | Elimination of discount recorded by MP&E on receivables sold to Financial Products and of interest earned between MP&E and Financial Products as well as dividends paid by Financial Products to MP&E. | ||||
| 5 | Profit attributable to common shareholders. | ||||
| Supplemental Consolidating Data | ||||||||||||||||||||||||||
| Consolidated | Machinery, Power & Energy | Financial Products | Consolidating Adjustments | |||||||||||||||||||||||
| Sales and revenues: | ||||||||||||||||||||||||||
| Sales of Machinery, Power & Energy | $ | 16,726 | $ | 16,726 | $ | — | $ | — | ||||||||||||||||||
| Revenues of Financial Products | 912 | — | 1,115 | (203) | 1 | |||||||||||||||||||||
| Total sales and revenues | 17,638 | 16,726 | 1,115 | (203) | ||||||||||||||||||||||
| Operating costs: | ||||||||||||||||||||||||||
| Cost of goods sold | 11,673 | 11,675 | — | (2) | 2 | |||||||||||||||||||||
| Selling, general and administrative expenses | 1,822 | 1,608 | 218 | (4) | 2 | |||||||||||||||||||||
| Research and development expenses | 555 | 555 | — | — | ||||||||||||||||||||||
| Interest expense of Financial Products | 346 | — | 358 | (12) | ||||||||||||||||||||||
| Other operating (income) expenses | 190 | (114) | 336 | (32) | 2 | |||||||||||||||||||||
| Total operating costs | 14,586 | 13,724 | 912 | (50) | ||||||||||||||||||||||
| Operating profit | 3,052 | 3,002 | 203 | (153) | ||||||||||||||||||||||
| Interest expense excluding Financial Products | 133 | 136 | — | (3) | ||||||||||||||||||||||
| Other income (expense) | 208 | 25 | 33 | 150 | 3 | |||||||||||||||||||||
| Consolidated profit before taxes | 3,127 | 2,891 | 236 | — | ||||||||||||||||||||||
| Provision (benefit) for income taxes | 836 | 773 | 63 | — | ||||||||||||||||||||||
| Profit of consolidated companies | 2,291 | 2,118 | 173 | — | ||||||||||||||||||||||
| Equity in profit (loss) of unconsolidated affiliated companies | 8 | 8 | — | — | ||||||||||||||||||||||
| Profit of consolidated and affiliated companies | 2,299 | 2,126 | 173 | — | ||||||||||||||||||||||
| Less: Profit (loss) attributable to noncontrolling interests | (1) | (1) | — | — | ||||||||||||||||||||||
Profit 4 | $ | 2,300 | $ | 2,127 | $ | 173 | $ | — | ||||||||||||||||||
| 1 | Elimination of Financial Products’ revenues earned from MP&E. | ||||
| 2 | Elimination of net expenses recorded by MP&E paid to Financial Products. | ||||
| 3 | Elimination of discount recorded by MP&E on receivables sold to Financial Products and of interest earned between MP&E and Financial Products as well as dividends paid by Financial Products to MP&E. | ||||
| 4 | Profit attributable to common shareholders. | ||||
| Supplemental Consolidating Data | ||||||||||||||||||||||||||
| Consolidated | Machinery, Power & Energy | Financial Products | Consolidating Adjustments | |||||||||||||||||||||||
| Sales and revenues: | ||||||||||||||||||||||||||
| Sales of Machinery, Power & Energy | $ | 55,708 | $ | 55,708 | $ | — | $ | — | ||||||||||||||||||
| Revenues of Financial Products | 2,932 | — | 3,592 | (660) | 1 | |||||||||||||||||||||
| Total sales and revenues | 58,640 | 55,708 | 3,592 | (660) | ||||||||||||||||||||||
| Operating costs: | ||||||||||||||||||||||||||
| Cost of goods sold | 37,419 | 37,423 | — | (4) | 2 | |||||||||||||||||||||
| Selling, general and administrative expenses | 5,631 | 4,980 | 690 | (39) | 2 | |||||||||||||||||||||
| Research and development expenses | 1,749 | 1,749 | — | — | ||||||||||||||||||||||
| Interest expense of Financial Products | 1,091 | — | 1,127 | (36) | 2 | |||||||||||||||||||||
| Other operating (income) expenses | 1,156 | 199 | 1,014 | (57) | 2 | |||||||||||||||||||||
| Total operating costs | 47,046 | 44,351 | 2,831 | (136) | ||||||||||||||||||||||
| Operating profit | 11,594 | 11,357 | 761 | (524) | ||||||||||||||||||||||
| Interest expense excluding Financial Products | 398 | 416 | — | (18) | 3 | |||||||||||||||||||||
| Other income (expense) | 793 | 185 | 102 | 506 | 4 | |||||||||||||||||||||
| Consolidated profit before taxes | 11,989 | 11,126 | 863 | — | ||||||||||||||||||||||
| Provision (benefit) for income taxes | 2,693 | 2,469 | 224 | — | ||||||||||||||||||||||
| Profit of consolidated companies | 9,296 | 8,657 | 639 | — | ||||||||||||||||||||||
| Equity in profit (loss) of unconsolidated affiliated companies | 131 | 131 | — | — | ||||||||||||||||||||||
| Profit of consolidated and affiliated companies | 9,427 | 8,788 | 639 | — | ||||||||||||||||||||||
| Less: Profit (loss) attributable to noncontrolling interests | (2) | (2) | — | — | ||||||||||||||||||||||
Profit 5 | $ | 9,429 | $ | 8,790 | $ | 639 | $ | — | ||||||||||||||||||
| 1 | Elimination of Financial Products’ revenues earned from MP&E. | ||||
| 2 | Elimination of net expenses recorded between MP&E and Financial Products. | ||||
| 3 | Elimination of interest expense recorded between Financial Products and MP&E. | ||||
| 4 | Elimination of discount recorded by MP&E on receivables sold to Financial Products and of interest earned between MP&E and Financial Products as well as dividends paid by Financial Products to MP&E. | ||||
| 5 | Profit attributable to common shareholders. | ||||
| Supplemental Consolidating Data | ||||||||||||||||||||||||||
| Consolidated | Machinery, Power & Energy | Financial Products | Consolidating Adjustments | |||||||||||||||||||||||
| Sales and revenues: | ||||||||||||||||||||||||||
| Sales of Machinery, Power & Energy | $ | 45,778 | $ | 45,778 | $ | — | $ | — | ||||||||||||||||||
| Revenues of Financial Products | 2,678 | — | 3,244 | (566) | 1 | |||||||||||||||||||||
| Total sales and revenues | 48,456 | 45,778 | 3,244 | (566) | ||||||||||||||||||||||
| Operating costs: | ||||||||||||||||||||||||||
| Cost of goods sold | 31,445 | 31,451 | — | (6) | 2 | |||||||||||||||||||||
| Selling, general and administrative expenses | 5,109 | 4,513 | 623 | (27) | 2 | |||||||||||||||||||||
| Research and development expenses | 1,586 | 1,586 | — | — | ||||||||||||||||||||||
| Interest expense of Financial Products | 1,008 | — | 1,026 | (18) | ||||||||||||||||||||||
| Other operating (income) expenses | 817 | (84) | 979 | (78) | 2 | |||||||||||||||||||||
| Total operating costs | 39,965 | 37,466 | 2,628 | (129) | ||||||||||||||||||||||
| Operating profit | 8,491 | 8,312 | 616 | (437) | ||||||||||||||||||||||
| Interest expense excluding Financial Products | 375 | 385 | — | (10) | ||||||||||||||||||||||
| Other income (expense) | 399 | (121) | 93 | 427 | 3 | |||||||||||||||||||||
| Consolidated profit before taxes | 8,515 | 7,806 | 709 | — | ||||||||||||||||||||||
| Provision (benefit) for income taxes | 2,056 | 1,878 | 178 | — | ||||||||||||||||||||||
| Profit of consolidated companies | 6,459 | 5,928 | 531 | — | ||||||||||||||||||||||
| Equity in profit (loss) of unconsolidated affiliated companies | 22 | 22 | — | — | ||||||||||||||||||||||
| Profit of consolidated and affiliated companies | 6,481 | 5,950 | 531 | — | ||||||||||||||||||||||
| Less: Profit (loss) attributable to noncontrolling interests | (1) | (2) | 1 | — | ||||||||||||||||||||||
Profit 4 | $ | 6,482 | $ | 5,952 | $ | 530 | $ | — | ||||||||||||||||||
| 1 | Elimination of Financial Products’ revenues earned from MP&E. | ||||
| 2 | Elimination of net expenses recorded between MP&E and Financial Products. | ||||
| 3 | Elimination of discount recorded by MP&E on receivables sold to Financial Products and of interest earned between MP&E and Financial Products as well as dividends paid by Financial Products to MP&E. | ||||
| 4 | Profit attributable to common shareholders. | ||||
| Supplemental Consolidating Data | ||||||||||||||||||||||||||
| Consolidated | Machinery, Power & Energy | Financial Products | Consolidating Adjustments | |||||||||||||||||||||||
| Assets | ||||||||||||||||||||||||||
| Current assets: | ||||||||||||||||||||||||||
| Cash and cash equivalents | $ | 7,929 | $ | 7,102 | $ | 827 | $ | — | ||||||||||||||||||
| Receivables – trade and other | 13,440 | 5,001 | 497 | 7,942 | 1,2 | |||||||||||||||||||||
| Receivables – finance | 11,051 | — | 19,679 | (8,628) | 2 | |||||||||||||||||||||
| Prepaid expenses and other current assets | 3,200 | 2,866 | 405 | (71) | 3 | |||||||||||||||||||||
| Inventories | 22,214 | 22,214 | — | — | ||||||||||||||||||||||
| Total current assets | 57,834 | 37,183 | 21,408 | (757) | ||||||||||||||||||||||
| Property, plant and equipment – net | 16,011 | 11,728 | 4,237 | 46 | 4 | |||||||||||||||||||||
| Long-term receivables – trade and other | 3,348 | 2,612 | 95 | 641 | 1,2 | |||||||||||||||||||||
| Long-term receivables – finance | 14,402 | — | 16,338 | (1,936) | 2 | |||||||||||||||||||||
| Noncurrent deferred and refundable income taxes | 2,235 | 2,512 | 139 | (416) | 5 | |||||||||||||||||||||
| Intangible assets | 409 | 409 | — | — | ||||||||||||||||||||||
| Goodwill | 5,905 | 5,905 | — | — | ||||||||||||||||||||||
| Other assets | 6,699 | 4,975 | 2,812 | (1,088) | 6 | |||||||||||||||||||||
| Total assets | $ | 106,843 | $ | 65,324 | $ | 45,029 | $ | (3,510) | ||||||||||||||||||
| Liabilities | ||||||||||||||||||||||||||
| Current liabilities: | ||||||||||||||||||||||||||
| Short-term borrowings | $ | 4,855 | $ | — | $ | 4,855 | $ | — | ||||||||||||||||||
| Short-term borrowings with consolidated companies | — | — | 500 | (500) | 9 | |||||||||||||||||||||
| Accounts payable | 10,573 | 10,489 | 266 | (182) | 7 | |||||||||||||||||||||
| Accrued expenses | 6,038 | 5,322 | 716 | — | ||||||||||||||||||||||
| Accrued wages, salaries and employee benefits | 2,663 | 2,598 | 65 | — | ||||||||||||||||||||||
| Customer advances | 5,329 | 5,326 | 3 | — | ||||||||||||||||||||||
| Dividends payable | — | — | — | — | ||||||||||||||||||||||
| Other current liabilities | 3,028 | 2,315 | 803 | (90) | 5,8,9 | |||||||||||||||||||||
| Long-term debt due within one year | 8,180 | 36 | 8,144 | |||||||||||||||||||||||
| Total current liabilities | 40,666 | 26,086 | 15,352 | (772) | ||||||||||||||||||||||
| Long-term debt due after one year | 32,166 | 10,913 | 22,552 | (1,299) | 9 | |||||||||||||||||||||
| Liability for postemployment benefits | 3,610 | 3,609 | 1 | — | ||||||||||||||||||||||
| Other liabilities | 8,919 | 7,722 | 1,693 | (496) | 5 | |||||||||||||||||||||
| Total liabilities | 85,361 | 48,330 | 39,598 | (2,567) | ||||||||||||||||||||||
| Shareholders’ equity | ||||||||||||||||||||||||||
| Common stock | 6,658 | 6,658 | 905 | (905) | 10 | |||||||||||||||||||||
| Treasury stock | (56,702) | (56,702) | — | — | ||||||||||||||||||||||
| Profit employed in the business | 73,428 | 67,958 | 5,438 | 32 | 10 | |||||||||||||||||||||
| Accumulated other comprehensive income (loss) | (1,901) | (921) | (980) | — | ||||||||||||||||||||||
| Noncontrolling interests | (1) | 1 | 68 | (70) | 10 | |||||||||||||||||||||
| Total shareholders’ equity | 21,482 | 16,994 | 5,431 | (943) | ||||||||||||||||||||||
| Total liabilities and shareholders’ equity | $ | 106,843 | $ | 65,324 | $ | 45,029 | $ | (3,510) | ||||||||||||||||||
| 1 | Elimination of receivables between MP&E and Financial Products. | ||||
| 2 | Reclassification of MP&E’s trade receivables purchased by Financial Products and Financial Products’ wholesale inventory receivables. | ||||
| 3 | Elimination of MP&E's insurance premiums that are prepaid to Financial Products. | ||||
| 4 | Reclassification of Financial Products’ other assets to property, plant and equipment. | ||||
| 5 | Reclassification reflecting required netting of deferred tax assets/liabilities by taxing jurisdiction. | ||||
| 6 | Elimination of other intercompany assets and liabilities between MP&E and Financial Products. | ||||
| 7 | Elimination of payables between MP&E and Financial Products. | ||||
| 8 | Elimination of prepaid insurance in Financial Products’ other liabilities. | ||||
| 9 | Elimination of debt between MP&E and Financial Products. | ||||
| 10 | Eliminations associated with MP&E’s investments in Financial Products’ subsidiaries. | ||||
| Supplemental Consolidating Data | ||||||||||||||||||||||||||
| Consolidated | Machinery, Power & Energy | Financial Products | Consolidating Adjustments | |||||||||||||||||||||||
| Assets | ||||||||||||||||||||||||||
| Current assets: | ||||||||||||||||||||||||||
| Cash and cash equivalents | $ | 9,980 | $ | 9,333 | $ | 647 | $ | — | ||||||||||||||||||
| Receivables – trade and other | 10,920 | 3,883 | 657 | 6,380 | 1,2 | |||||||||||||||||||||
| Receivables – finance | 10,649 | — | 17,325 | (6,676) | 2 | |||||||||||||||||||||
| Prepaid expenses and other current assets | 2,801 | 2,448 | 441 | (88) | 3 | |||||||||||||||||||||
| Inventories | 18,135 | 18,135 | — | — | ||||||||||||||||||||||
| Total current assets | 52,485 | 33,799 | 19,070 | (384) | ||||||||||||||||||||||
| Property, plant and equipment – net | 15,140 | 10,985 | 4,106 | 49 | 4 | |||||||||||||||||||||
| Long-term receivables – trade and other | 2,142 | 1,982 | 163 | (3) | 1,2 | |||||||||||||||||||||
| Long-term receivables – finance | 14,272 | — | 15,538 | (1,266) | 2 | |||||||||||||||||||||
| Noncurrent deferred and refundable income taxes | 2,882 | 3,208 | 133 | (459) | 5 | |||||||||||||||||||||
| Intangible assets | 241 | 241 | — | — | ||||||||||||||||||||||
| Goodwill | 5,321 | 5,321 | — | — | ||||||||||||||||||||||
| Other assets | 6,102 | 4,525 | 2,651 | (1,074) | 6 | |||||||||||||||||||||
| Total assets | $ | 98,585 | $ | 60,061 | $ | 41,661 | $ | (3,137) | ||||||||||||||||||
| Liabilities | ||||||||||||||||||||||||||
| Current liabilities: | ||||||||||||||||||||||||||
| Short-term borrowings | $ | 5,514 | $ | — | $ | 5,514 | $ | — | ||||||||||||||||||
| Accounts payable | 8,968 | 8,988 | 268 | (288) | 7 | |||||||||||||||||||||
| Accrued expenses | 5,587 | 4,877 | 710 | — | ||||||||||||||||||||||
| Accrued wages, salaries and employee benefits | 2,554 | 2,494 | 60 | — | ||||||||||||||||||||||
| Customer advances | 3,314 | 3,311 | 3 | — | ||||||||||||||||||||||
| Dividends payable | 703 | 703 | — | — | ||||||||||||||||||||||
| Other current liabilities | 2,798 | 2,259 | 645 | (106) | 5,8 | |||||||||||||||||||||
| Long-term debt due within one year | 7,120 | 35 | 7,085 | — | ||||||||||||||||||||||
| Total current liabilities | 36,558 | 22,667 | 14,285 | (394) | ||||||||||||||||||||||
| Long-term debt due after one year | 30,696 | 10,955 | 21,018 | (1,277) | 9 | |||||||||||||||||||||
| Liability for postemployment benefits | 3,838 | 3,837 | 1 | — | ||||||||||||||||||||||
| Other liabilities | 6,175 | 5,162 | 1,516 | (503) | 5 | |||||||||||||||||||||
| Total liabilities | 77,267 | 42,621 | 36,820 | (2,174) | ||||||||||||||||||||||
| Shareholders’ equity | ||||||||||||||||||||||||||
| Common stock | 7,181 | 7,181 | 905 | (905) | 10 | |||||||||||||||||||||
| Treasury stock | (49,539) | (49,539) | — | — | ||||||||||||||||||||||
| Profit employed in the business | 65,448 | 60,639 | 4,799 | 10 | 10 | |||||||||||||||||||||
| Accumulated other comprehensive income (loss) | (1,772) | (843) | (929) | — | ||||||||||||||||||||||
| Noncontrolling interests | — | 2 | 66 | (68) | 10 | |||||||||||||||||||||
| Total shareholders’ equity | 21,318 | 17,440 | 4,841 | (963) | ||||||||||||||||||||||
| Total liabilities and shareholders’ equity | $ | 98,585 | $ | 60,061 | $ | 41,661 | $ | (3,137) | ||||||||||||||||||
| 1 | Elimination of receivables between MP&E and Financial Products. | ||||
| 2 | Reclassification of MP&E’s trade receivables purchased by Financial Products and Financial Products’ wholesale inventory receivables. | ||||
| 3 | Elimination of MP&E’s insurance premiums that are prepaid to Financial Products. | ||||
| 4 | Reclassification of Financial Products’ other assets to property, plant and equipment. | ||||
| 5 | Reclassification reflecting required netting of deferred tax assets/liabilities by taxing jurisdiction. | ||||
| 6 | Elimination of other intercompany assets and liabilities between MP&E and Financial Products. | ||||
| 7 | Elimination of payables between MP&E and Financial Products. | ||||
| 8 | Elimination of prepaid insurance in Financial Products’ other liabilities. | ||||
| 9 | Elimination of debt between MP&E and Financial Products. | ||||
| 10 | Eliminations associated with MP&E’s investments in Financial Products’ subsidiaries. | ||||
| Supplemental Consolidating Data | ||||||||||||||||||||||||||
| Consolidated | Machinery, Power & Energy | Financial Products | Consolidating Adjustments | |||||||||||||||||||||||
| Cash flow from operating activities: | ||||||||||||||||||||||||||
| Profit of consolidated and affiliated companies | $ | 9,427 | $ | 8,788 | $ | 639 | $ | — | ||||||||||||||||||
| Adjustments to reconcile profit to net cash provided by operating activities: | ||||||||||||||||||||||||||
| Depreciation and amortization | 1,826 | 1,225 | 601 | — | ||||||||||||||||||||||
| Provision (benefit) for deferred income taxes | 630 | 684 | (54) | — | ||||||||||||||||||||||
| (Gain) loss on divestiture | 139 | 139 | — | — | ||||||||||||||||||||||
| Other | 249 | 158 | (429) | 520 | 1 | |||||||||||||||||||||
| Changes in assets and liabilities, net of acquisitions and divestitures: | ||||||||||||||||||||||||||
| Receivables – trade and other | (3,761) | (1,146) | 113 | (2,728) | 1,2 | |||||||||||||||||||||
| Inventories | (4,118) | (4,114) | — | (4) | 1 | |||||||||||||||||||||
| Accounts payable | 1,752 | 1,635 | 11 | 106 | 1 | |||||||||||||||||||||
| Accrued expenses | 354 | 412 | (58) | — | ||||||||||||||||||||||
| Accrued wages, salaries and employee benefits | 107 | 101 | 6 | — | ||||||||||||||||||||||
| Customer advances | 4,002 | 4,002 | — | — | ||||||||||||||||||||||
| Other assets – net | (251) | (317) | 32 | 34 | 1 | |||||||||||||||||||||
| Other liabilities – net | 237 | (33) | 276 | (6) | 1 | |||||||||||||||||||||
| Net cash provided by (used for) operating activities | 10,593 | 11,534 | 1,137 | (2,078) | ||||||||||||||||||||||
| Cash flow from investing activities: | ||||||||||||||||||||||||||
| Capital expenditures – excluding equipment leased to others | (2,012) | (1,993) | (22) | 3 | 1 | |||||||||||||||||||||
| Expenditures for equipment leased to others | (1,214) | (16) | (1,207) | 9 | 1 | |||||||||||||||||||||
| Proceeds from disposals of leased assets and property, plant and equipment | 773 | 55 | 725 | (7) | 1 | |||||||||||||||||||||
| Additions to finance receivables | (13,123) | — | (16,089) | 2,966 | 2 | |||||||||||||||||||||
| Collections of finance receivables | 12,149 | — | 13,841 | (1,692) | 2 | |||||||||||||||||||||
| Net intercompany purchased receivables | — | — | (799) | 799 | 2 | |||||||||||||||||||||
| Proceeds from sale of finance receivables | 56 | — | 56 | — | ||||||||||||||||||||||
| Collections of intercompany receivables (original maturities greater than three months) | — | — | 68 | (68) | 3 | |||||||||||||||||||||
| Net intercompany borrowings (original maturities three months or less) | — | (500) | — | 500 | 3 | |||||||||||||||||||||
| Investments and acquisitions (net of cash acquired) | (893) | (893) | — | — | ||||||||||||||||||||||
| Proceeds from sale of businesses and investments (net of cash sold) | (92) | (92) | — | — | ||||||||||||||||||||||
| Proceeds from maturities and sale of securities | 1,303 | 590 | 713 | — | ||||||||||||||||||||||
| Investments in securities | (1,872) | (915) | (957) | — | ||||||||||||||||||||||
| Other – net | 170 | 242 | (72) | — | ||||||||||||||||||||||
| Net cash provided by (used for) investing activities | (4,755) | (3,522) | (3,743) | 2,510 | ||||||||||||||||||||||
| Cash flow from financing activities: | ||||||||||||||||||||||||||
| Dividends paid | (2,148) | (2,148) | — | — | ||||||||||||||||||||||
| Common stock issued, and other stock compensation transactions, net | (131) | (131) | — | — | ||||||||||||||||||||||
| Payments to purchase common stock | (7,745) | (7,745) | — | — | ||||||||||||||||||||||
| Excise tax paid on purchases of common stock | (49) | (49) | — | — | ||||||||||||||||||||||
| Payments on intercompany borrowings (original maturities greater than three months) | — | (68) | — | 68 | 3 | |||||||||||||||||||||
| Net intercompany borrowings (original maturities three months or less) | — | — | 500 | (500) | 3 | |||||||||||||||||||||
| Proceeds from debt issued (original maturities greater than three months) | 10,490 | — | 10,490 | — | ||||||||||||||||||||||
| Payments on debt (original maturities greater than three months) | (7,495) | (30) | (7,465) | — | ||||||||||||||||||||||
| Short-term borrowings – net (original maturities three months or less) | (748) | — | (748) | — | ||||||||||||||||||||||
| Net cash provided by (used for) financing activities | (7,826) | (10,171) | 2,777 | (432) | ||||||||||||||||||||||
| Effect of exchange rate changes on cash | (63) | (71) | 8 | — | ||||||||||||||||||||||
| Increase (decrease) in cash, cash equivalents and restricted cash | (2,051) | (2,230) | 179 | — | ||||||||||||||||||||||
| Cash, cash equivalents and restricted cash at beginning of period | 9,986 | 9,336 | 650 | — | ||||||||||||||||||||||
| Cash, cash equivalents and restricted cash at end of period | $ | 7,935 | $ | 7,106 | $ | 829 | $ | — | ||||||||||||||||||
| 1 | Elimination of non-cash adjustments and changes in assets and liabilities related to consolidated reporting. | ||||
| 2 | Reclassification of Financial Products’ cash flow activity from investing to operating for receivables that arose from the sale of inventory. | ||||
| 3 | Elimination of proceeds and payments to/from MP&E and Financial Products. | ||||
| Supplemental Consolidating Data | ||||||||||||||||||||||||||
| Consolidated | Machinery, Power & Energy | Financial Products | Consolidating Adjustments | |||||||||||||||||||||||
| Cash flow from operating activities: | ||||||||||||||||||||||||||
| Profit of consolidated and affiliated companies | $ | 6,481 | $ | 5,950 | $ | 531 | $ | — | ||||||||||||||||||
| Adjustments to reconcile profit to net cash provided by operating activities: | ||||||||||||||||||||||||||
| Depreciation and amortization | 1,664 | 1,096 | 568 | — | ||||||||||||||||||||||
| Provision (benefit) for deferred income taxes | 300 | 308 | (8) | — | ||||||||||||||||||||||
| Other | 509 | 431 | (412) | 490 | 1 | |||||||||||||||||||||
| Changes in assets and liabilities, net of acquisitions and divestitures: | ||||||||||||||||||||||||||
| Receivables – trade and other | (788) | 89 | 102 | (979) | 1,2 | |||||||||||||||||||||
| Inventories | (2,015) | (2,012) | — | (3) | 1 | |||||||||||||||||||||
| Accounts payable | 1,086 | 1,051 | 44 | (9) | 1 | |||||||||||||||||||||
| Accrued expenses | 51 | 161 | (110) | — | ||||||||||||||||||||||
| Accrued wages, salaries and employee benefits | (296) | (284) | (12) | — | ||||||||||||||||||||||
| Customer advances | 1,649 | 1,649 | — | — | ||||||||||||||||||||||
| Other assets – net | (138) | (219) | 15 | 66 | 1 | |||||||||||||||||||||
| Other liabilities – net | (355) | (475) | 176 | (56) | 1 | |||||||||||||||||||||
| Net cash provided by (used for) operating activities | 8,148 | 7,745 | 894 | (491) | ||||||||||||||||||||||
| Cash flow from investing activities: | ||||||||||||||||||||||||||
| Capital expenditures – excluding equipment leased to others | (1,923) | (1,920) | (33) | 30 | 1 | |||||||||||||||||||||
| Expenditures for equipment leased to others | (1,021) | (24) | (1,004) | 7 | 1 | |||||||||||||||||||||
| Proceeds from disposals of leased assets and property, plant and equipment | 544 | 54 | 524 | (34) | 1 | |||||||||||||||||||||
| Additions to finance receivables | (10,964) | — | (12,668) | 1,704 | 2 | |||||||||||||||||||||
| Collections of finance receivables | 9,890 | — | 11,347 | (1,457) | 2 | |||||||||||||||||||||
| Net intercompany purchased receivables | — | — | (241) | 241 | 2 | |||||||||||||||||||||
| Proceeds from sale of finance receivables | 26 | — | 26 | — | ||||||||||||||||||||||
| Additions to intercompany receivables (original maturities greater than three months) | — | (1,000) | — | 1,000 | 3 | |||||||||||||||||||||
| Collections of intercompany receivables (original maturities greater than three months) | — | — | 56 | (56) | 3 | |||||||||||||||||||||
| Investments and acquisitions (net of cash acquired) | (26) | (26) | — | — | ||||||||||||||||||||||
| Proceeds from sale of businesses and investments (net of cash sold) | 12 | 12 | — | — | ||||||||||||||||||||||
| Proceeds from maturities and sale of securities | 1,945 | 1,259 | 686 | — | ||||||||||||||||||||||
| Investments in securities | (1,291) | (510) | (781) | — | ||||||||||||||||||||||
| Other – net | (19) | 43 | (62) | — | ||||||||||||||||||||||
| Net cash provided by (used for) investing activities | (2,827) | (2,112) | (2,150) | 1,435 | ||||||||||||||||||||||
| Cash flow from financing activities: | ||||||||||||||||||||||||||
| Dividends paid | (2,043) | (2,043) | — | — | ||||||||||||||||||||||
| Common stock issued, and other stock compensation transactions, net | (39) | (39) | — | — | ||||||||||||||||||||||
| Payments to purchase common stock | (4,850) | (4,850) | — | — | ||||||||||||||||||||||
| Excise tax paid on purchases of common stock | (73) | (73) | — | — | ||||||||||||||||||||||
| Proceeds from intercompany borrowings (original maturities greater than three months) | — | — | 1,000 | (1,000) | 3 | |||||||||||||||||||||
| Payments on intercompany borrowings (original maturities greater than three months) | — | (56) | — | 56 | 3 | |||||||||||||||||||||
| Proceeds from debt issued (original maturities greater than three months) | 8,454 | 1,976 | 6,478 | — | ||||||||||||||||||||||
| Payments on debt (original maturities greater than three months) | (6,205) | (43) | (6,162) | — | ||||||||||||||||||||||
| Short-term borrowings – net (original maturities three months or less) | 106 | — | 106 | — | ||||||||||||||||||||||
| Net cash provided by (used for) financing activities | (4,650) | (5,128) | 1,422 | (944) | ||||||||||||||||||||||
| Effect of exchange rate changes on cash | (23) | (39) | 16 | — | ||||||||||||||||||||||
| Increase (decrease) in cash, cash equivalents and restricted cash | 648 | 466 | 182 | — | ||||||||||||||||||||||
| Cash, cash equivalents and restricted cash at beginning of period | 6,896 | 6,170 | 726 | — | ||||||||||||||||||||||
| Cash, cash equivalents and restricted cash at end of period | $ | 7,544 | $ | 6,636 | $ | 908 | $ | — | ||||||||||||||||||
| 1 | Elimination of non-cash adjustments and changes in assets and liabilities related to consolidated reporting. | ||||
| 2 | Reclassification of Financial Products’ cash flow activity from investing to operating for receivables that arose from the sale of inventory. | ||||
| 3 | Elimination of proceeds and payments to/from MP&E and Financial Products. | ||||