Q3 2026 Investor Presentation Exhibit 99.3 October 29, 2026 – based on financial results as of September 30, 2026
2Investor Presentation 2 Forward-Looking Statements Some statements in this presentation, which are not historical facts, are “forward-looking statements” as defined by the Private Securities Litigation Reform Act of 1995. Forward-looking statements include statements about Trinity's estimates, expectations, beliefs, intentions or strategies for the future, and the assumptions underlying these forward-looking statements, including, but not limited to, future financial and operating performance, future opportunities and any other statements regarding events or developments that Trinity believes or anticipates will or may occur in the future. Trinity uses the words “anticipates,” “assumes,” “believes,” “estimates,” “expects,” “intends,” “forecasts,” “may,” “will,” “should,” “guidance,” “projected,” “outlook,” and similar expressions to identify these forward-looking statements. Forward-looking statements speak only as of the date of this material, and Trinity expressly disclaims any obligation or undertaking to disseminate any updates or revisions to any forward-looking statement contained herein to reflect any change in Trinity’s expectations with regard thereto or any change in events, conditions or circumstances on which any such statement is based, except as required by federal securities laws. Forward-looking statements involve risks and uncertainties that could cause actual results to differ materially from historical experience or our present expectations, including but not limited to risks and uncertainties regarding geopolitical events and conflicts, as well as economic, competitive, governmental, and technological factors affecting Trinity’s operations, markets, products, services and prices, and such forward-looking statements are not guarantees of future performance. For a discussion of such risks and uncertainties, which could cause actual results to differ from those contained in the forward-looking statements, see “Risk Factors” and “Forward-Looking Statements” in Trinity’s Annual Report on Form 10-K for the most recent fiscal year, as may be revised and updated by Trinity’s Quarterly Reports on Form 10-Q, and Trinity’s Current Reports on Form 8-K. This presentation also includes references to calculations that are not based on generally accepted accounting principles (“GAAP”). Reconciliations of each of these non-GAAP measures to the most directly comparable GAAP measures have been included in the Appendix. When forward-looking non-GAAP measures are provided, Trinity does not provide quantitative reconciliations of forward-looking non-GAAP measures to the most directly comparable GAAP measures because it cannot, without unreasonable effort, predict the timing and amounts of certain items included in the computations of each of these measures. These factors include, but are not limited to: the product mix of expected railcar deliveries; the timing and amount of significant transactions and investments, such as lease portfolio sales, capital expenditures, and returns of capital to shareholders; and the amount and timing of certain other items outside the normal course of our core business operations. Except where noted, financial data is presented as of the Company’s most recent fiscal quarter ending September 30, 2026. “LTM” represents Last Twelve Months(1) financial information from October 1, 2025 to September 30, 2026. See appendix for footnotes
3Investor Presentation I. Quarter Results . . . . . . . . . . . . . . . . . . . . . . . . . . . . . . . . . . . . . . . . . . . . . . . . . . . . . . . . . . . . 4 II. Company Overview . . . . . . . . . . . . . . . . . . . . . . . . . . . . . . . . . . . . . . . . . . . . . . . . . . . . . . . . . 13 III. Financial Positioning and Strategic Initiatives . . . . . . . . . . . . . . . . . . . . . . . . . . . . . . . . 22 IV. Appendix . . . . . . . . . . . . . . . . . . . . . . . . . . . . . . . . . . . . . . . . . . . . . . . . . . . . . . . . . . . . . . . . . . 26 Investor Presentation – Q3 2026

4Investor Presentation Quarter Results
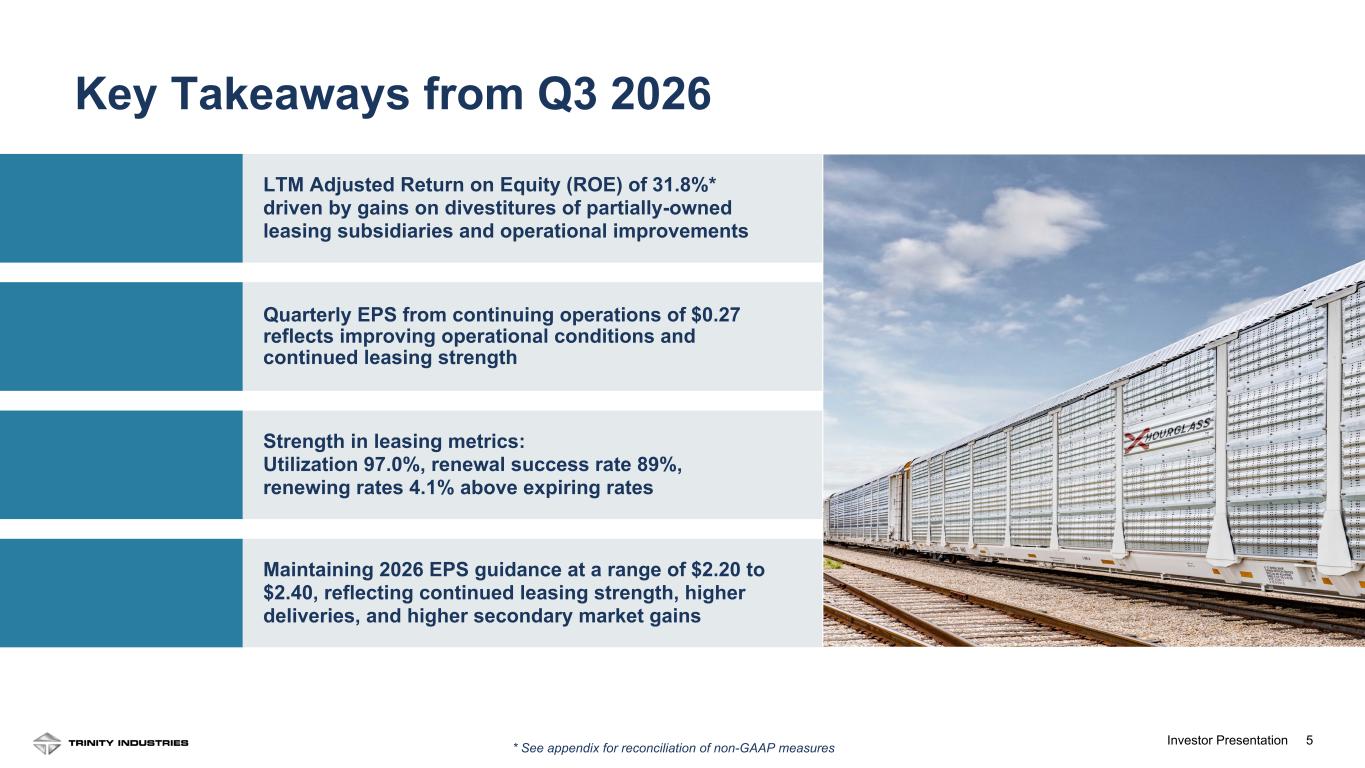
5Investor Presentation Key Takeaways from Q3 2026 Quarterly EPS from continuing operations of $0.27 reflects improving operational conditions and continued leasing strength Strength in leasing metrics: Utilization 97.0%, renewal success rate 89%, renewing rates 4.1% above expiring rates LTM Adjusted Return on Equity (ROE) of 31.8%* driven by gains on divestitures of partially-owned leasing subsidiaries and operational improvements Maintaining 2026 EPS guidance at a range of $2.20 to $2.40, reflecting continued leasing strength, higher deliveries, and higher secondary market gains * See appendix for reconciliation of non-GAAP measures
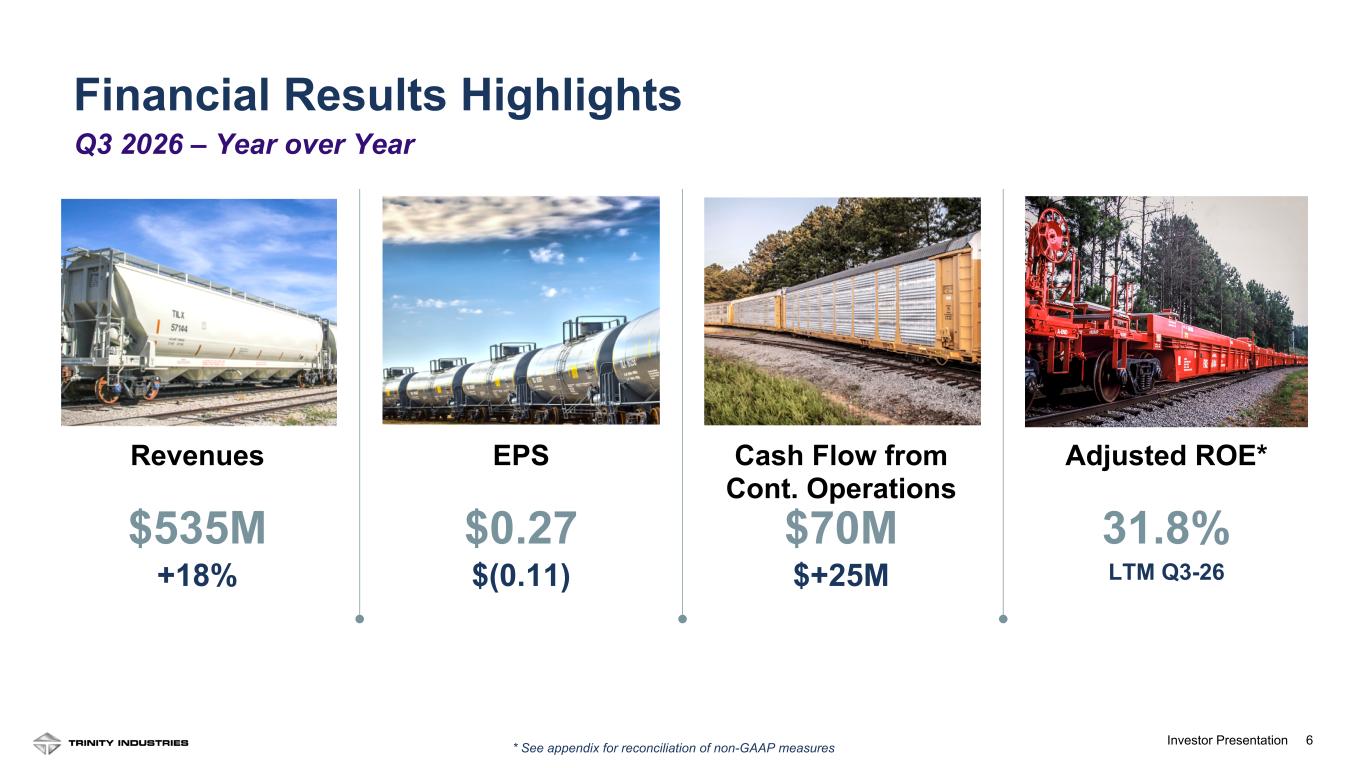
6Investor Presentation Financial Results Highlights Cash Flow from Cont. Operations $70M $+25M Revenues $535M +18% EPS $0.27 $(0.11) Q3 2026 – Year over Year Adjusted ROE* 31.8% LTM Q3-26 * See appendix for reconciliation of non-GAAP measures
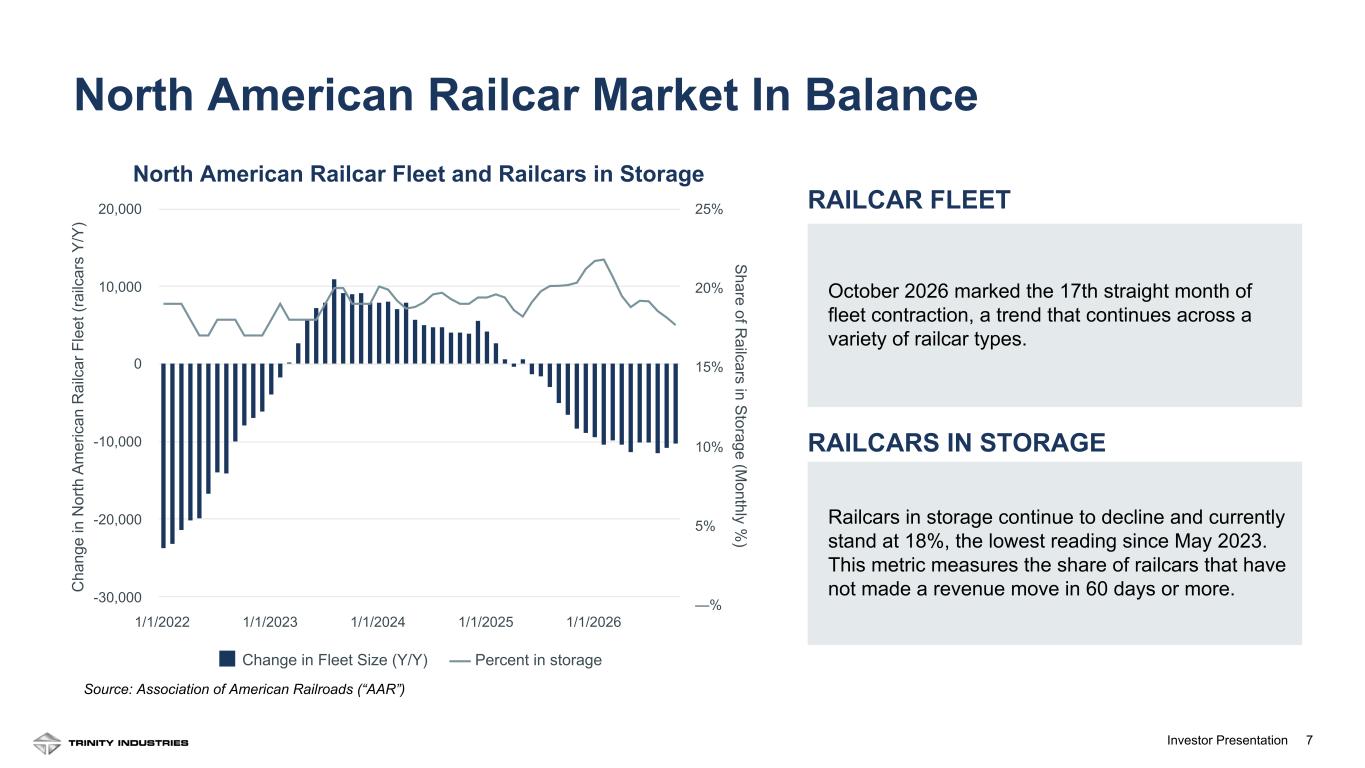
7Investor Presentation North American Railcar Market In Balance C ha ng e in N or th A m er ic an R ai lc ar F le et (r ai lc ar s Y /Y ) S hare of R ailcars in S torage (M onthly % ) Change in Fleet Size (Y/Y) Percent in storage 1/1/2022 1/1/2023 1/1/2024 1/1/2025 1/1/2026 -30,000 -20,000 -10,000 0 10,000 20,000 —% 5% 10% 15% 20% 25% North American Railcar Fleet and Railcars in Storage Source: Association of American Railroads (“AAR”) RAILCAR FLEET October 2026 marked the 17th straight month of fleet contraction, a trend that continues across a variety of railcar types. Railcars in storage continue to decline and currently stand at 18%, the lowest reading since May 2023. This metric measures the share of railcars that have not made a revenue move in 60 days or more. RAILCARS IN STORAGE
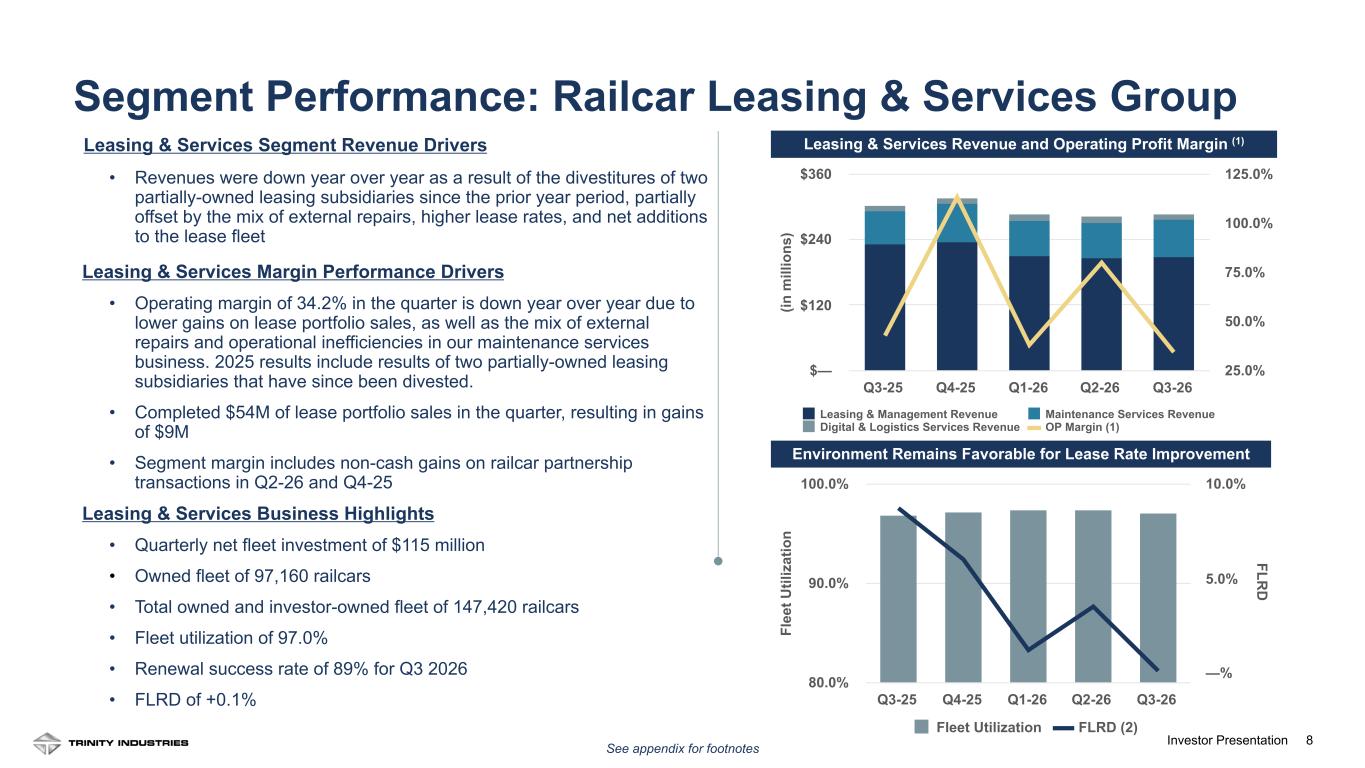
8Investor Presentation8 Leasing & Services Revenue and Operating Profit Margin (1) (in m ill io ns ) Leasing & Management Revenue Maintenance Services Revenue Digital & Logistics Services Revenue OP Margin (1) Q3-25 Q4-25 Q1-26 Q2-26 Q3-26 $— $120 $240 $360 25.0% 50.0% 75.0% 100.0% 125.0% Leasing & Services Segment Revenue Drivers • Revenues were down year over year as a result of the divestitures of two partially-owned leasing subsidiaries since the prior year period, partially offset by the mix of external repairs, higher lease rates, and net additions to the lease fleet Leasing & Services Margin Performance Drivers • Operating margin of 34.2% in the quarter is down year over year due to lower gains on lease portfolio sales, as well as the mix of external repairs and operational inefficiencies in our maintenance services business. 2025 results include results of two partially-owned leasing subsidiaries that have since been divested. • Completed $54M of lease portfolio sales in the quarter, resulting in gains of $9M • Segment margin includes non-cash gains on railcar partnership transactions in Q2-26 and Q4-25 Leasing & Services Business Highlights • Quarterly net fleet investment of $115 million • Owned fleet of 97,160 railcars • Total owned and investor-owned fleet of 147,420 railcars • Fleet utilization of 97.0% • Renewal success rate of 89% for Q3 2026 • FLRD of +0.1% See appendix for footnotes Segment Performance: Railcar Leasing & Services Group Fl ee t U til iz at io n FLR D Fleet Utilization FLRD (2) Q3-25 Q4-25 Q1-26 Q2-26 Q3-26 80.0% 90.0% 100.0% —% 5.0% 10.0% Environment Remains Favorable for Lease Rate Improvement
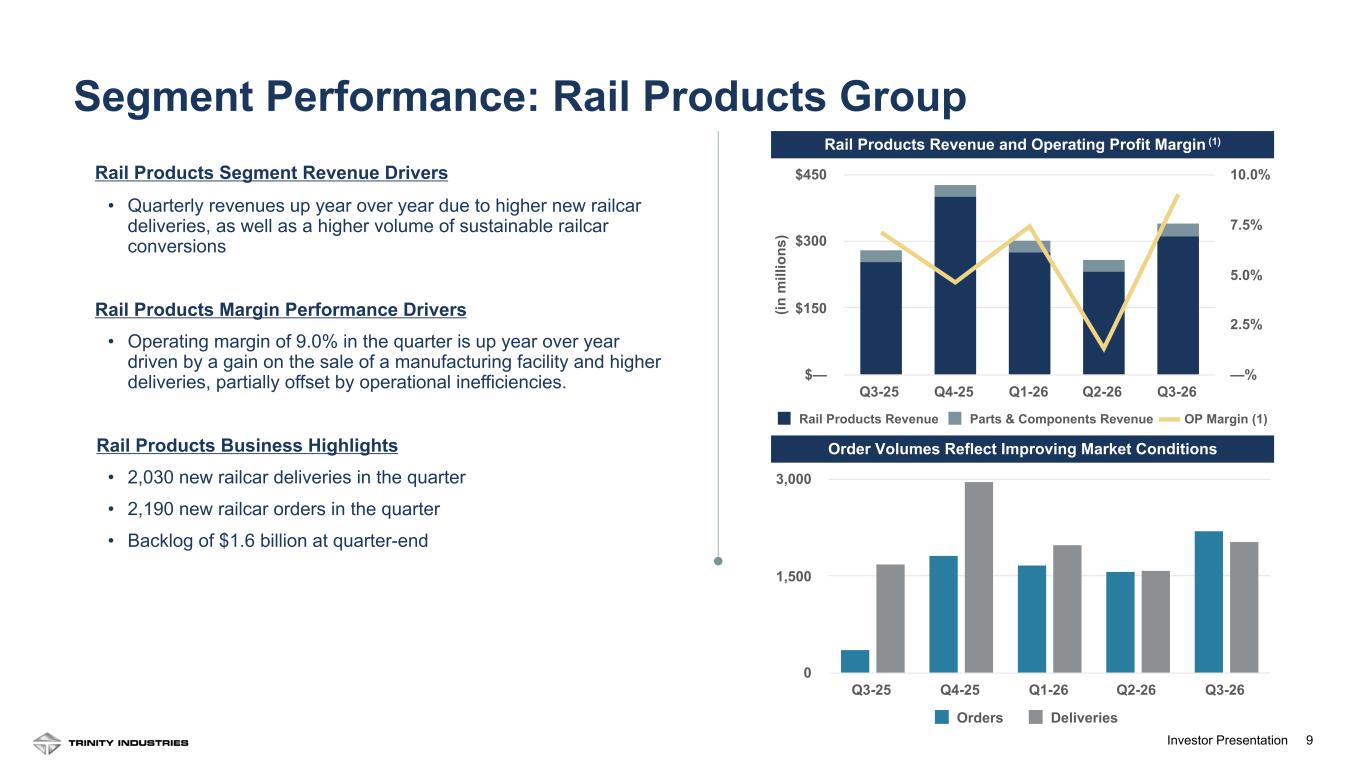
9Investor Presentation9 Rail Products Segment Revenue Drivers • Quarterly revenues up year over year due to higher new railcar deliveries, as well as a higher volume of sustainable railcar conversions Rail Products Margin Performance Drivers • Operating margin of 9.0% in the quarter is up year over year driven by a gain on the sale of a manufacturing facility and higher deliveries, partially offset by operational inefficiencies. Rail Products Business Highlights • 2,030 new railcar deliveries in the quarter • 2,190 new railcar orders in the quarter • Backlog of $1.6 billion at quarter-end Rail Products Revenue and Operating Profit Margin (1) (in m ill io ns ) Rail Products Revenue Parts & Components Revenue OP Margin (1) Q3-25 Q4-25 Q1-26 Q2-26 Q3-26 $— $150 $300 $450 —% 2.5% 5.0% 7.5% 10.0% Segment Performance: Rail Products Group Orders Deliveries Q3-25 Q4-25 Q1-26 Q2-26 Q3-26 0 1,500 3,000 Order Volumes Reflect Improving Market Conditions
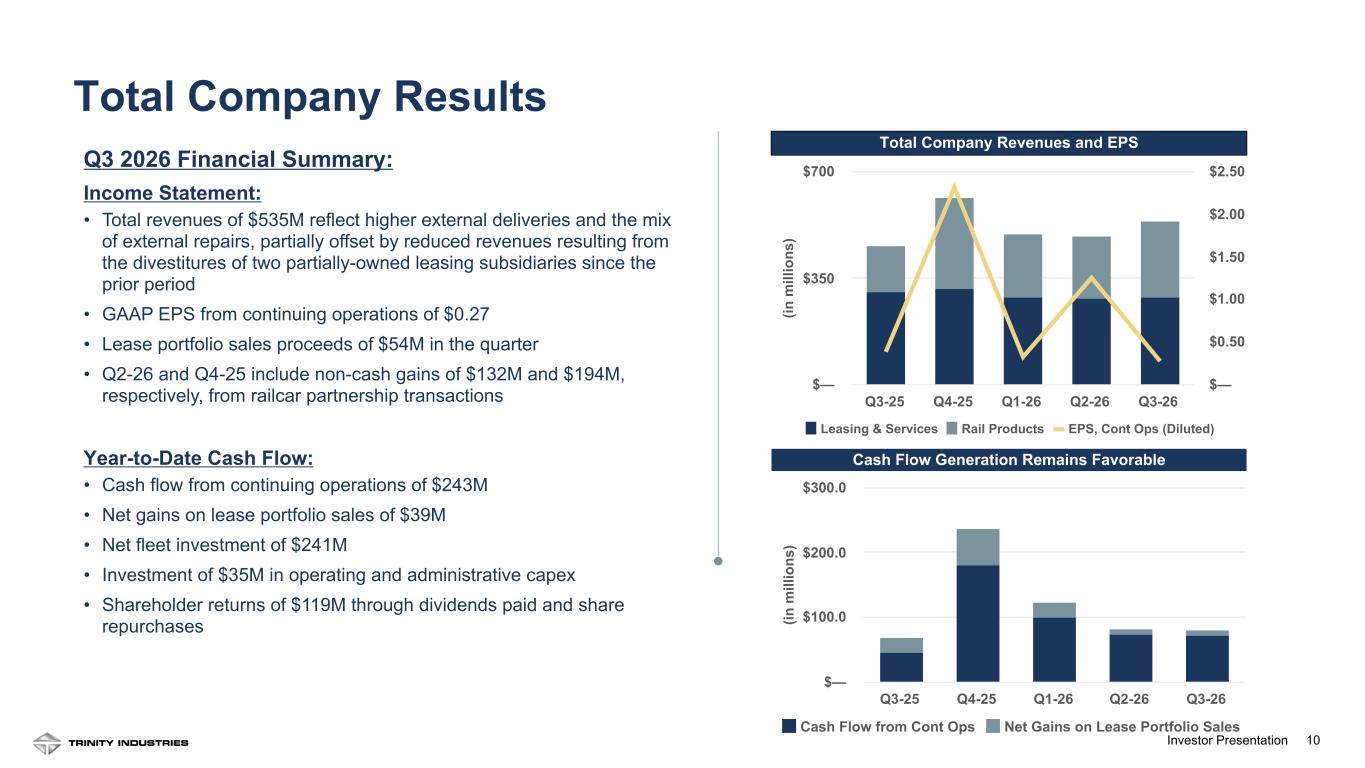
10Investor Presentation Total Company Revenues and EPS Q3 2026 Financial Summary: Income Statement: • Total revenues of $535M reflect higher external deliveries and the mix of external repairs, partially offset by reduced revenues resulting from the divestitures of two partially-owned leasing subsidiaries since the prior period • GAAP EPS from continuing operations of $0.27 • Lease portfolio sales proceeds of $54M in the quarter • Q2-26 and Q4-25 include non-cash gains of $132M and $194M, respectively, from railcar partnership transactions 10 Cash Flow Generation Remains Favorable (in m ill io ns ) Leasing & Services Rail Products EPS, Cont Ops (Diluted) Q3-25 Q4-25 Q1-26 Q2-26 Q3-26 $— $350 $700 $— $0.50 $1.00 $1.50 $2.00 $2.50 (in m ill io ns ) Cash Flow from Cont Ops Net Gains on Lease Portfolio Sales Q3-25 Q4-25 Q1-26 Q2-26 Q3-26 $— $100.0 $200.0 $300.0 Total Company Results Year-to-Date Cash Flow: • Cash flow from continuing operations of $243M • Net gains on lease portfolio sales of $39M • Net fleet investment of $241M • Investment of $35M in operating and administrative capex • Shareholder returns of $119M through dividends paid and share repurchases
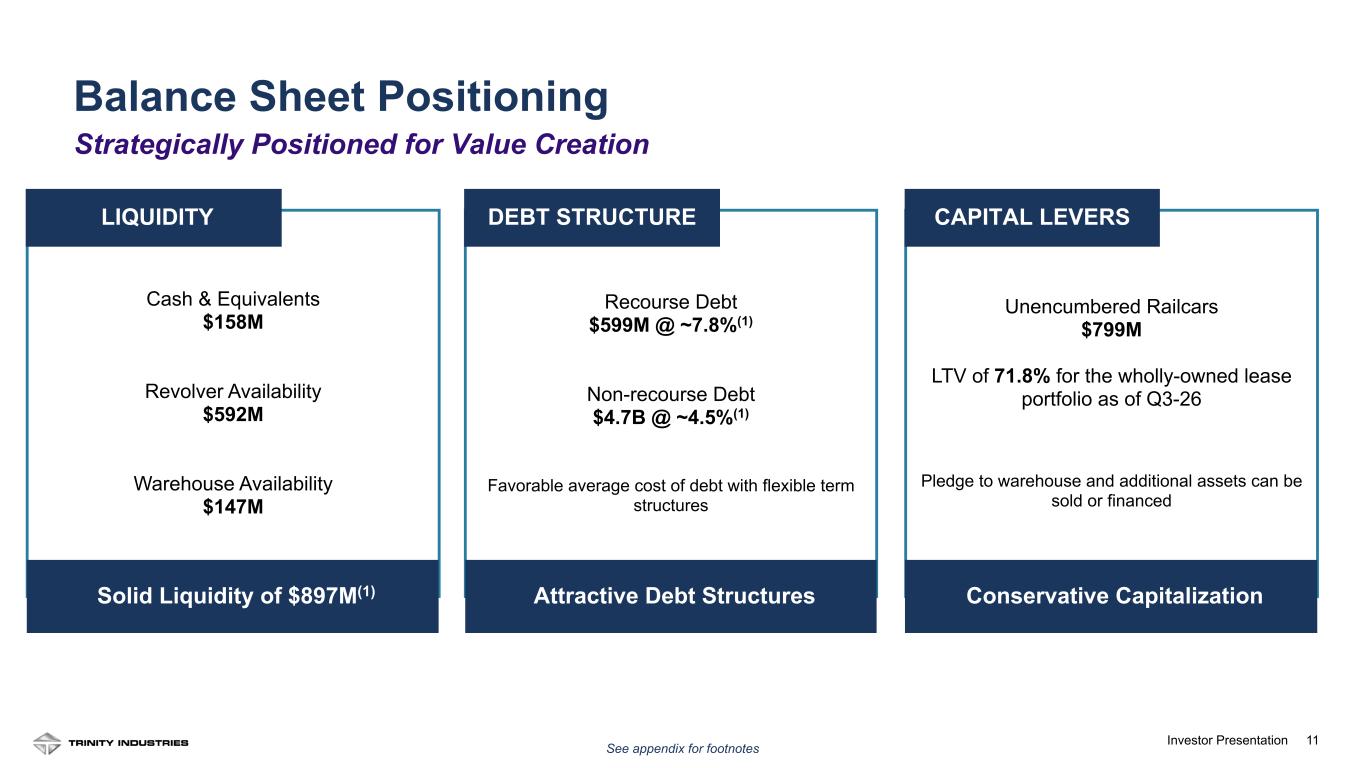
11Investor Presentation Unencumbered Railcars $799M LTV of 71.8% for the wholly-owned lease portfolio as of Q3-26 Pledge to warehouse and additional assets can be sold or financed CAPITAL LEVERS Recourse Debt $599M @ ~7.8%(1) Non-recourse Debt $4.7B @ ~4.5%(1) Favorable average cost of debt with flexible term structures DEBT STRUCTURE Cash & Equivalents $158M Revolver Availability $592M Warehouse Availability $147M LIQUIDITY Solid Liquidity of $897M(1) Attractive Debt Structures Conservative Capitalization See appendix for footnotes Balance Sheet Positioning Strategically Positioned for Value Creation
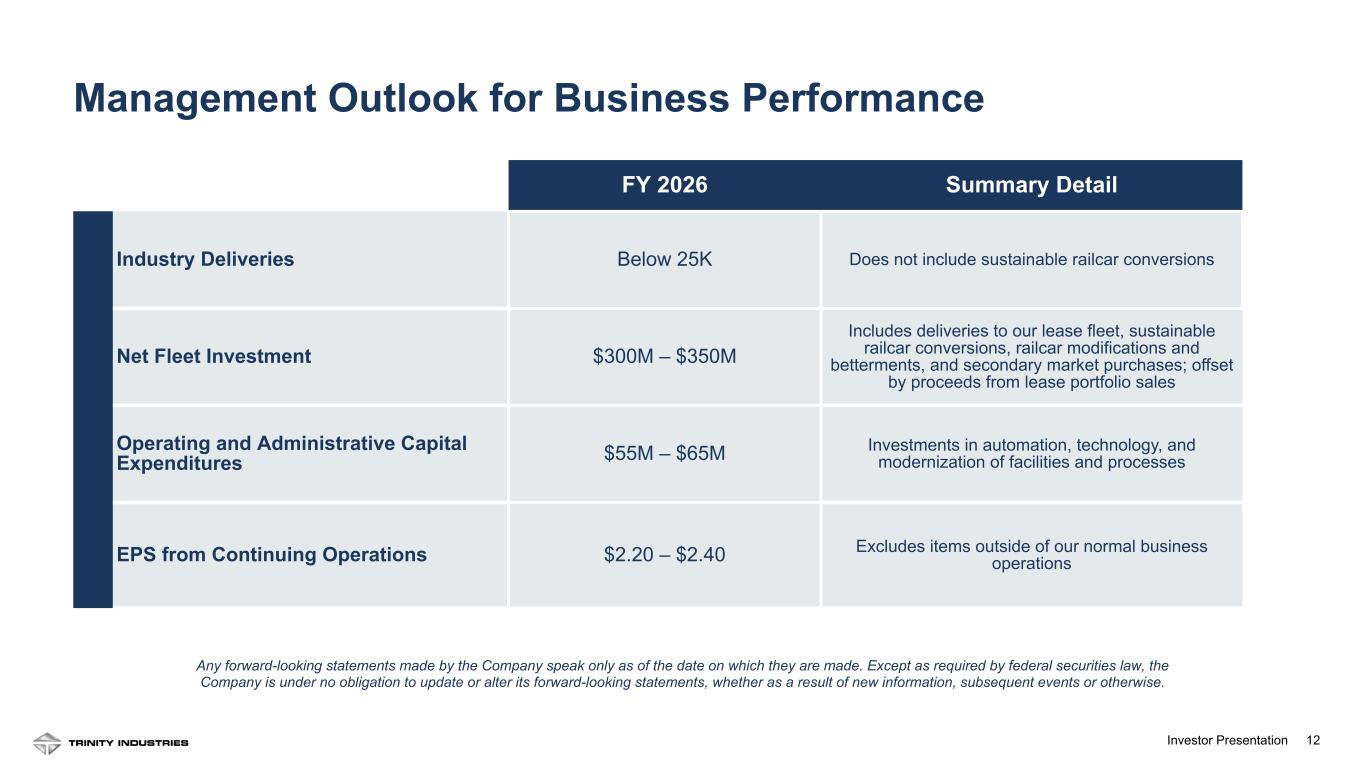
12Investor Presentation C ap ita l A llo ca tio n FY 2026 Summary Detail Industry Deliveries Below 25K Does not include sustainable railcar conversions Net Fleet Investment $300M – $350M Includes deliveries to our lease fleet, sustainable railcar conversions, railcar modifications and betterments, and secondary market purchases; offset by proceeds from lease portfolio sales Operating and Administrative Capital Expenditures $55M – $65M Investments in automation, technology, and modernization of facilities and processes EPS from Continuing Operations $2.20 – $2.40 Excludes items outside of our normal business operations Any forward-looking statements made by the Company speak only as of the date on which they are made. Except as required by federal securities law, the Company is under no obligation to update or alter its forward-looking statements, whether as a result of new information, subsequent events or otherwise. Management Outlook for Business Performance

13Investor Presentation Company Overview
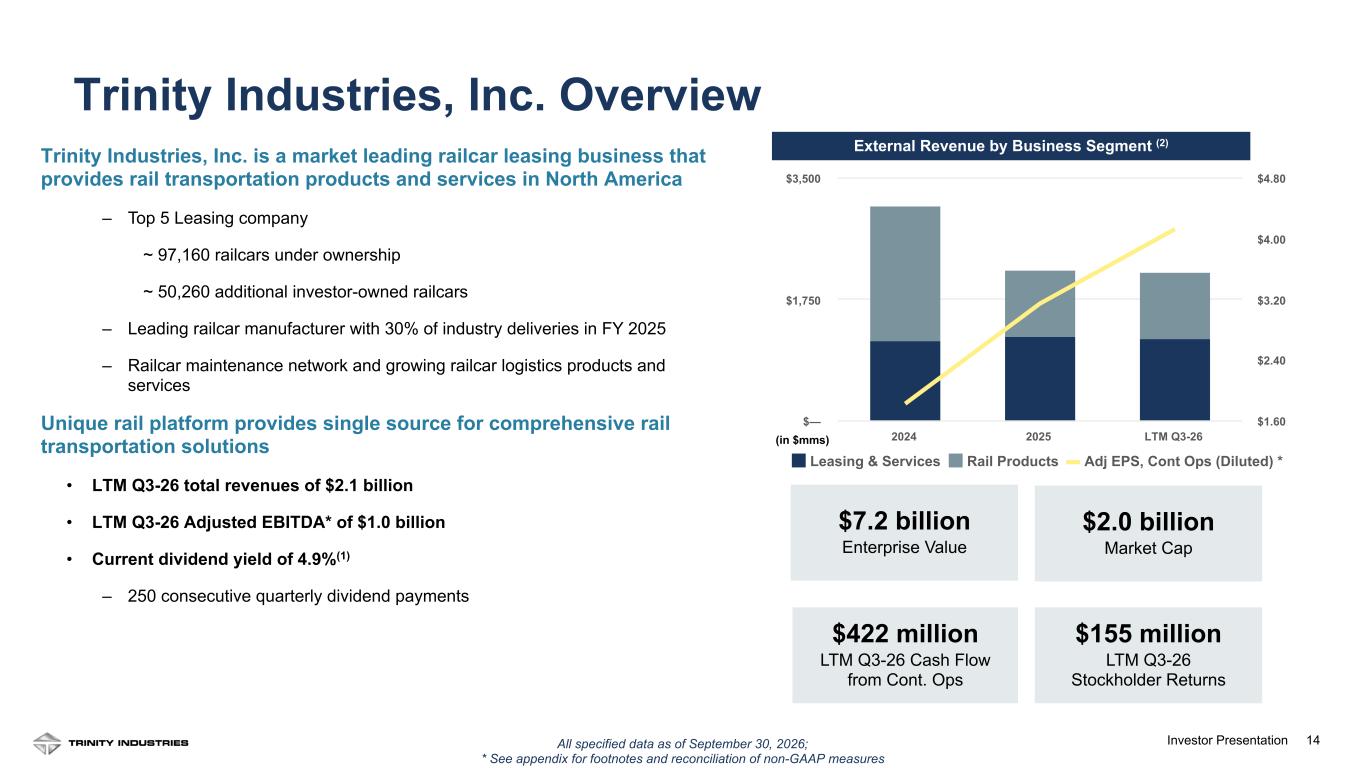
14Investor Presentation Trinity Industries, Inc. is a market leading railcar leasing business that provides rail transportation products and services in North America – Top 5 Leasing company ~ 97,160 railcars under ownership ~ 50,260 additional investor-owned railcars – Leading railcar manufacturer with 30% of industry deliveries in FY 2025 – Railcar maintenance network and growing railcar logistics products and services Unique rail platform provides single source for comprehensive rail transportation solutions • LTM Q3-26 total revenues of $2.1 billion • LTM Q3-26 Adjusted EBITDA* of $1.0 billion • Current dividend yield of 4.9%(1) – 250 consecutive quarterly dividend payments External Revenue by Business Segment (2) All specified data as of September 30, 2026; * See appendix for footnotes and reconciliation of non-GAAP measures $7.2 billion Enterprise Value $155 million LTM Q3-26 Stockholder Returns $422 million LTM Q3-26 Cash Flow from Cont. Ops $2.0 billion Market Cap Leasing & Services Rail Products Adj EPS, Cont Ops (Diluted) * 2024 2025 LTM Q3-26 $— $1,750 $3,500 $1.60 $2.40 $3.20 $4.00 $4.80 (in $mms) Trinity Industries, Inc. Overview
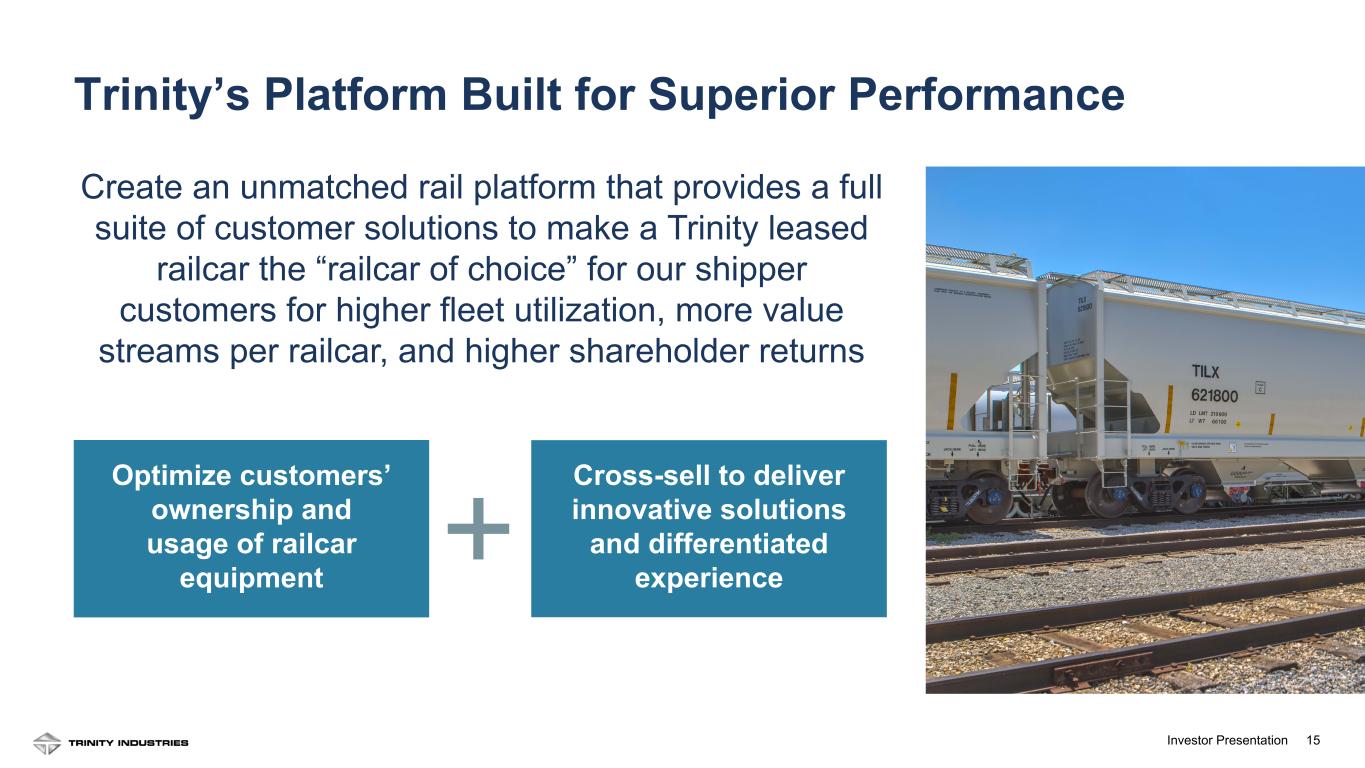
15Investor Presentation Optimize customers’ ownership and usage of railcar equipment Cross-sell to deliver innovative solutions and differentiated experience Create an unmatched rail platform that provides a full suite of customer solutions to make a Trinity leased railcar the “railcar of choice” for our shipper customers for higher fleet utilization, more value streams per railcar, and higher shareholder returns Trinity’s Platform Built for Superior Performance
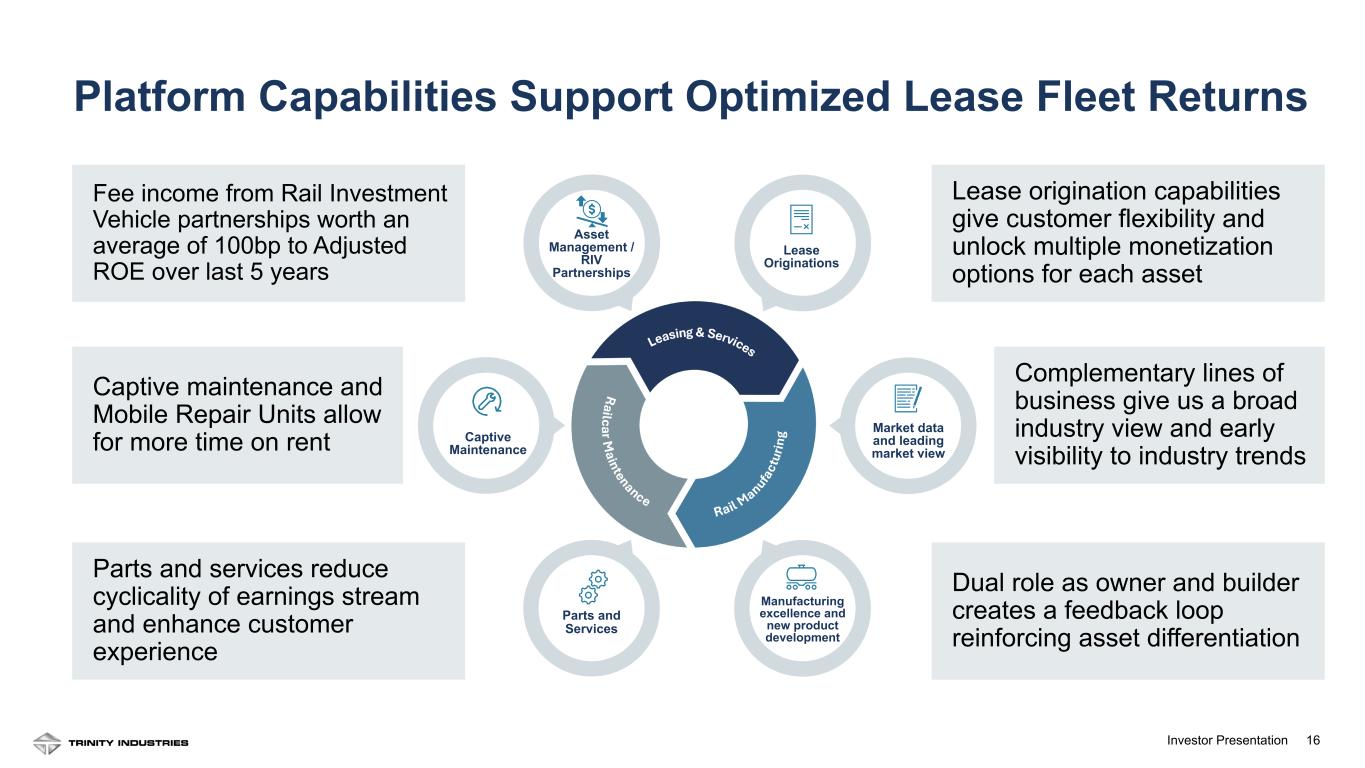
16Investor Presentation Platform Capabilities Support Optimized Lease Fleet Returns Lease Originations Captive Maintenance Parts and Services Manufacturing excellence and new product development Market data and leading market view Asset Management / RIV Partnerships Dual role as owner and builder creates a feedback loop reinforcing asset differentiation Complementary lines of business give us a broad industry view and early visibility to industry trends Lease origination capabilities give customer flexibility and unlock multiple monetization options for each asset Fee income from Rail Investment Vehicle partnerships worth an average of 100bp to Adjusted ROE over last 5 years Captive maintenance and Mobile Repair Units allow for more time on rent Parts and services reduce cyclicality of earnings stream and enhance customer experience
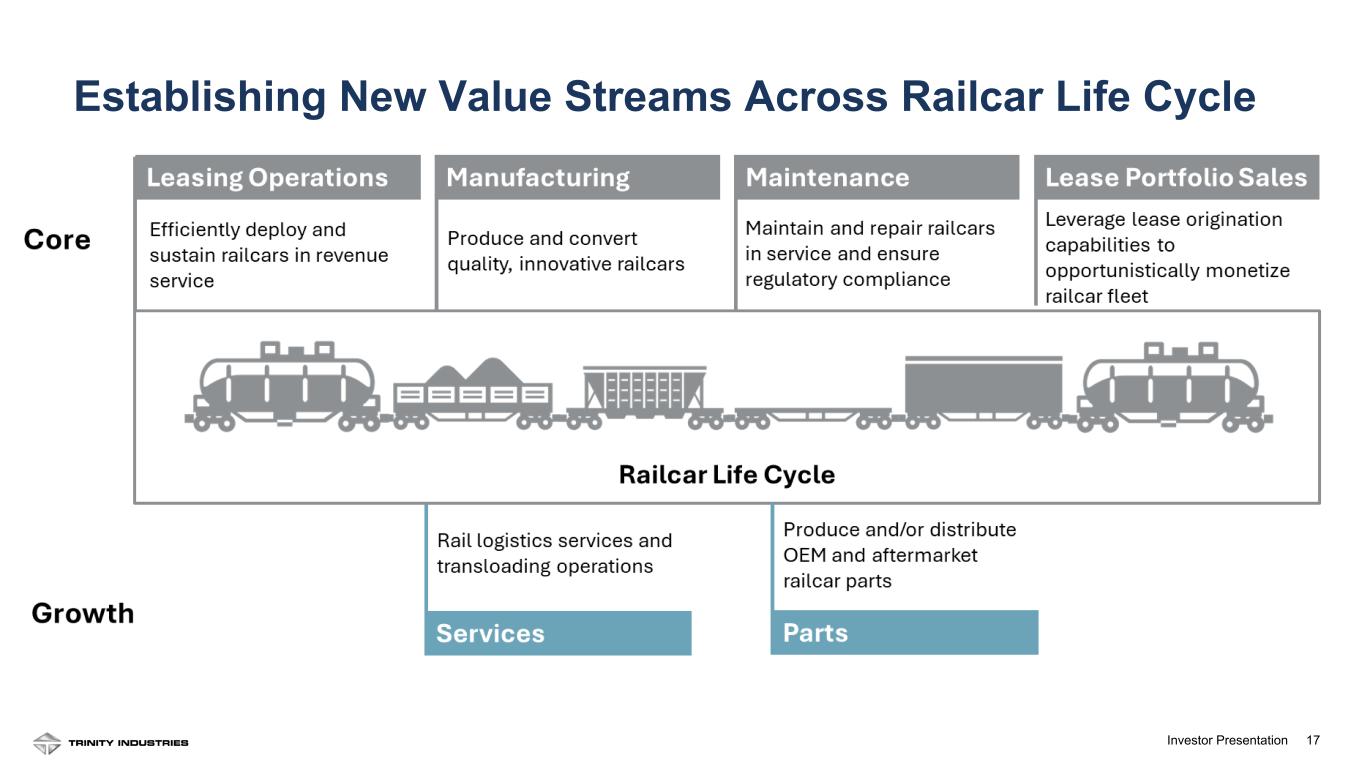
17Investor Presentation Establishing New Value Streams Across Railcar Life Cycle
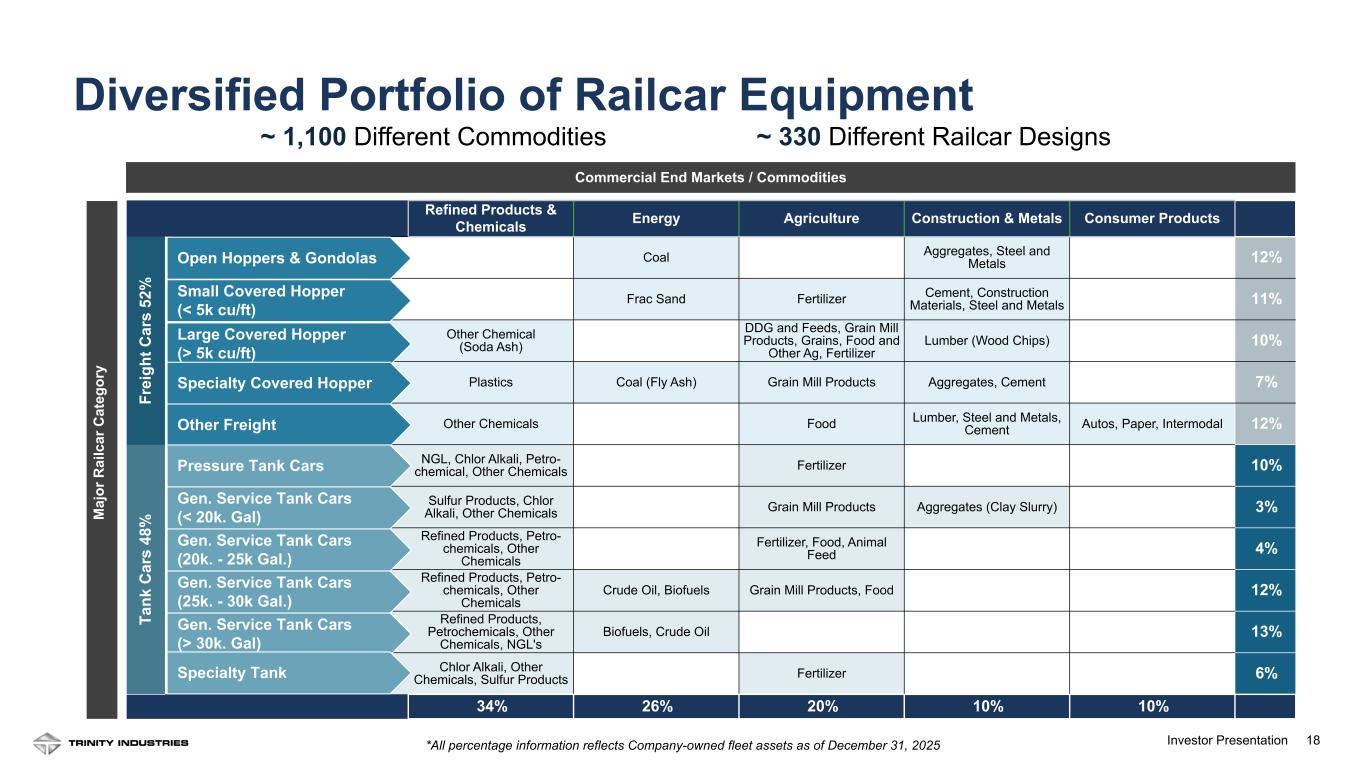
18Investor Presentation Diversified Portfolio of Railcar Equipment ~ 1,100 Different Commodities ~ 330 Different Railcar Designs Refined Products & Chemicals Energy Agriculture Construction & Metals Consumer Products Fr ei gh t C ar s 52 % Open Hoppers & Gondolas Coal Aggregates, Steel and Metals 12% Small Covered Hopper (< 5k cu/ft) Frac Sand Fertilizer Cement, Construction Materials, Steel and Metals 11% Large Covered Hopper (< 5k cu/ft) Other Chemical (Soda Ash) DDG and Feeds, Grain Mill Products, Grains, Food and Other Ag, Fertilizer Lumber (Wood Chips) 10% Specialty Covered Hopper Plastics Coal (Fly Ash) Grain Mill Products Aggregates, Cement 7% Other Freight Other Chemicals Food Lumber, Steel and Metals, Cement Autos, Paper, Intermodal 12% Ta nk C ar s 48 % Pressure Tank Cars NGL, Chlor Alkali, Petro- chemical, Other Chemicals Fertilizer 10% Gen. Service Tank Cars (< 20k. Gal) Sulfur Products, Chlor Alkali, Other Chemicals Grain Mill Products Aggregates (Clay Slurry) 3% Gen. Service Tank Cars (20k. - 25k Gal.) Refined Products, Petro- chemicals, Other Chemicals Fertilizer, Food, Animal Feed 4% Gen. Service Tank Cars (25k. - 30k Gal.) Refined Products, Petro- chemicals, Other Chemicals Crude Oil, Biofuels Grain Mill Products, Food 12% Gen. Service Tank Cars (> 30k. Gal) Refined Products, Petrochemicals, Other Chemicals, NGL's Biofuels, Crude Oil 13% Specialty Tank Chlor Alkali, Other Chemicals, Sulfur Products Fertilizer 6% 34% 26% 20% 10% 10% Commercial End Markets / Commodities M aj or R ai lc ar C at eg or y r l ll r r (< 5k cu/ft) Large overed opper (> 5k cu/ft) i lt r r t r r i t r r r . r i r (< 20k. Gal) . r i r (20k. - 25k Gal.) . r i r (25k. - 30k Gal.) . r i r (> 30k. Gal) i lt *All percentage information reflects Company-owned fleet assets as of December 31, 2025
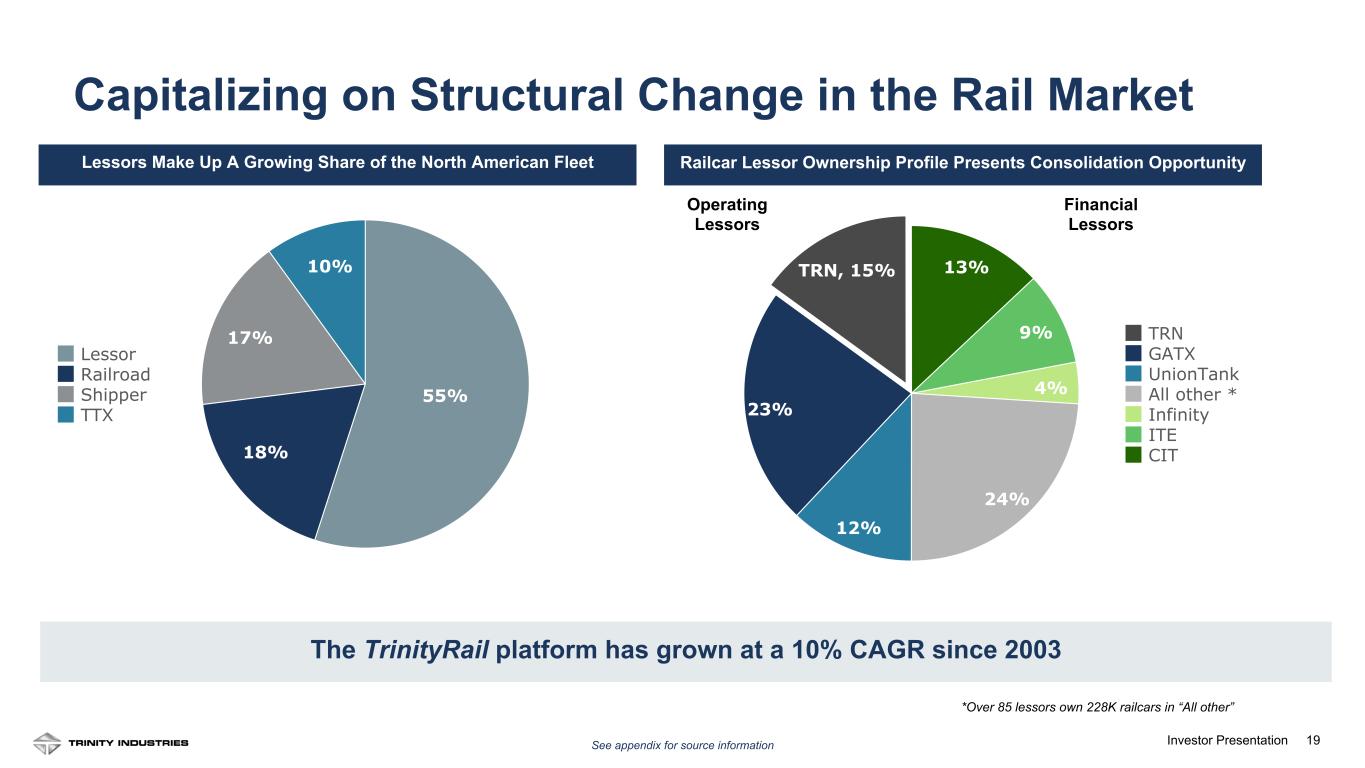
19Investor Presentation 13% 9% 4% 24% 12% 23% TRN, 15% TRN GATX UnionTank All other * Infinity ITE CIT The TrinityRail platform has grown at a 10% CAGR since 2003 Lessors Make Up A Growing Share of the North American Fleet Railcar Lessor Ownership Profile Presents Consolidation Opportunity Operating Lessors *Over 85 lessors own 228K railcars in “All other” 19 Financial Lessors 55% 18% 17% 10% Lessor Railroad Shipper TTX See appendix for source information Capitalizing on Structural Change in the Rail Market
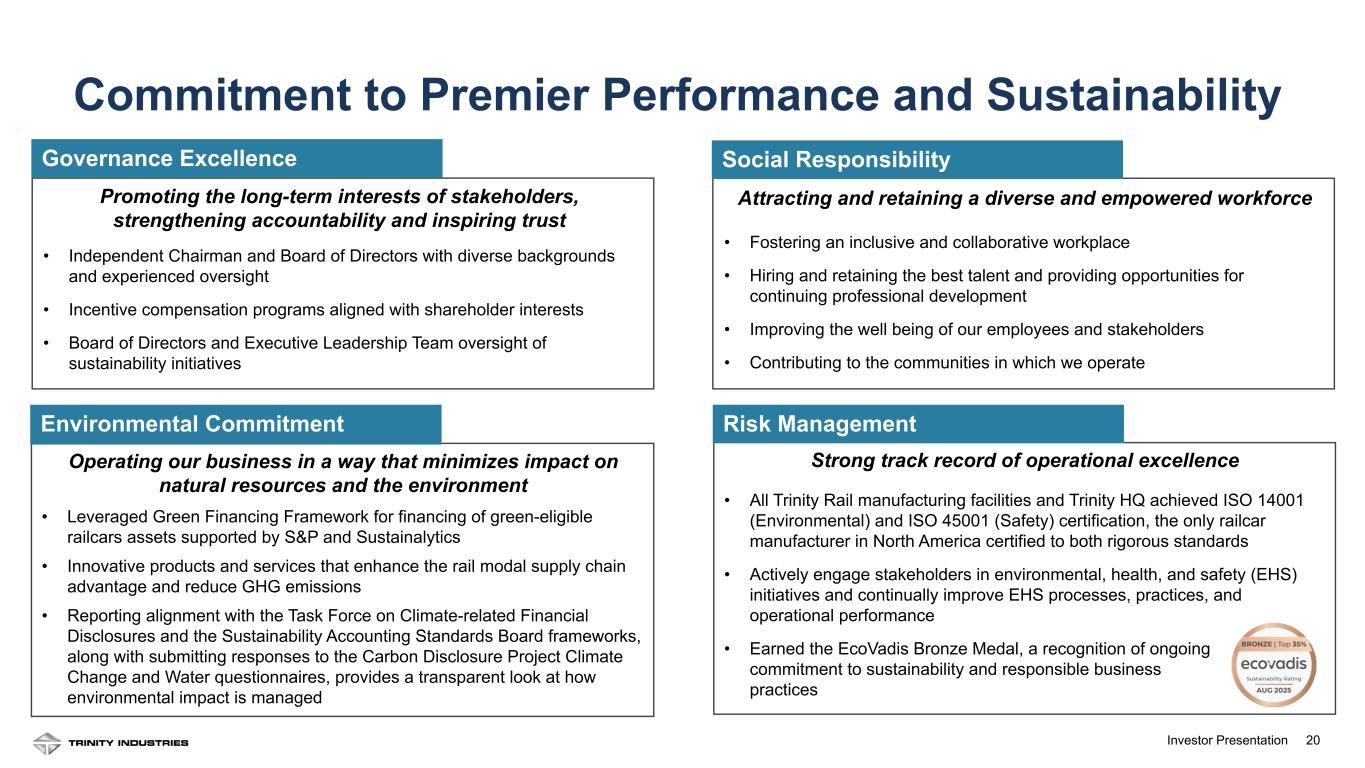
20Investor Presentation Promoting the long-term interests of stakeholders, strengthening accountability and inspiring trust • Independent Chairman and Board of Directors with diverse backgrounds and experienced oversight • Incentive compensation programs aligned with shareholder interests • Board of Directors and Executive Leadership Team oversight of sustainability initiatives Attracting and retaining a diverse and empowered workforce • Fostering an inclusive and collaborative workplace • Hiring and retaining the best talent and providing opportunities for continuing professional development • Improving the well being of our employees and stakeholders • Contributing to the communities in which we operate Operating our business in a way that minimizes impact on natural resources and the environment • Leveraged Green Financing Framework for financing of green-eligible railcars assets supported by S&P and Sustainalytics • Innovative products and services that enhance the rail modal supply chain advantage and reduce GHG emissions • Reporting alignment with the Task Force on Climate-related Financial Disclosures and the Sustainability Accounting Standards Board frameworks, along with submitting responses to the Carbon Disclosure Project Climate Change and Water questionnaires, provides a transparent look at how environmental impact is managed Strong track record of operational excellence • All Trinity Rail manufacturing facilities and Trinity HQ achieved ISO 14001 (Environmental) and ISO 45001 (Safety) certification, the only railcar manufacturer in North America certified to both rigorous standards • Actively engage stakeholders in environmental, health, and safety (EHS) initiatives and continually improve EHS processes, practices, and operational performance • Earned the EcoVadis Bronze Medal, a recognition of ongoing commitment to sustainability and responsible business practices Commitment to Premier Performance and Sustainability Governance Excellence Social Responsibility Environmental Commitment Risk Management
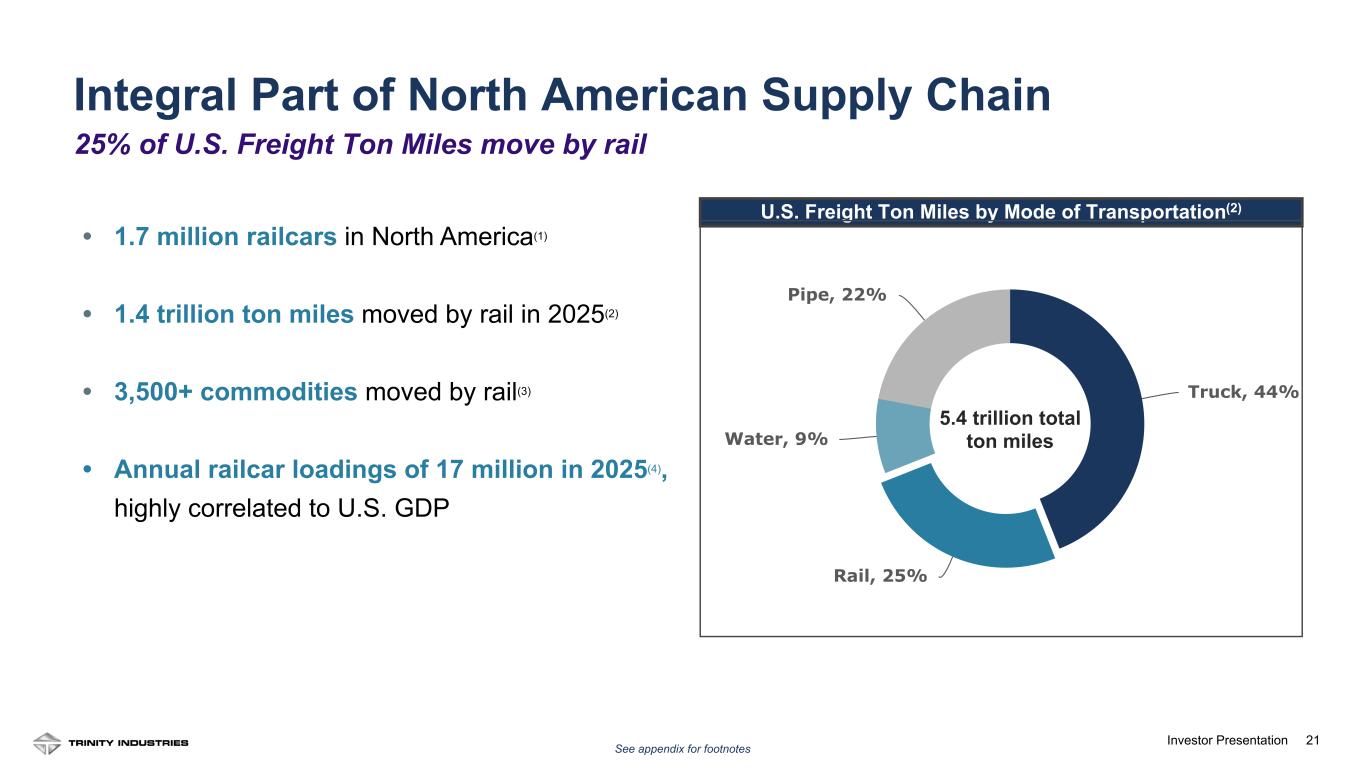
21Investor Presentation • 1.7 million railcars in North America(1) • 1.4 trillion ton miles moved by rail in 2025(2) • 3,500+ commodities moved by rail(3) • Annual railcar loadings of 17 million in 2025(4), highly correlated to U.S. GDP U.S. Freight Ton Miles by Mode of Transportation(2) See appendix for footnotes 21 Truck, 44% Rail, 25% Water, 9% Pipe, 22% 5.4 trillion total ton miles Integral Part of North American Supply Chain 25% of U.S. Freight Ton Miles move by rail
22Investor Presentation Financial Positioning and Strategic Initiatives
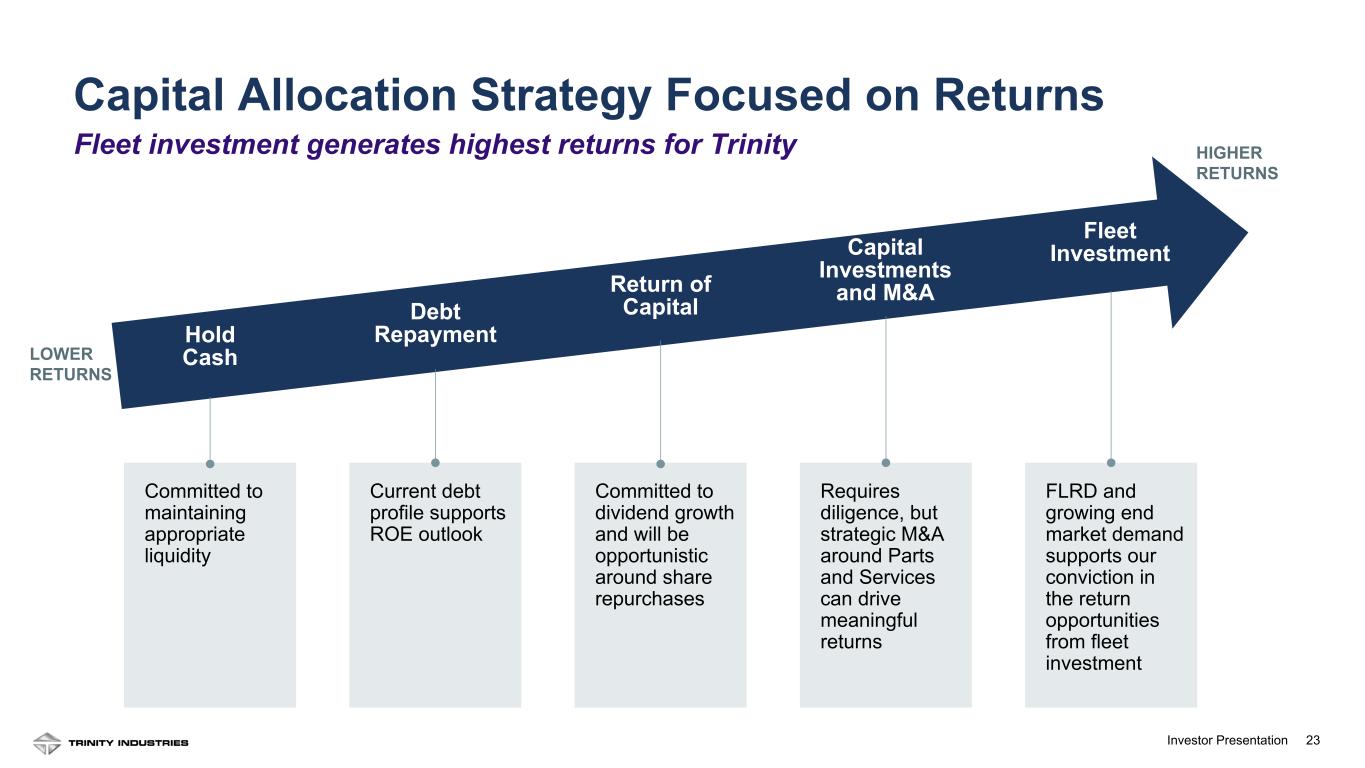
23Investor Presentation Fleet investment generates highest returns for Trinity FLRD and growing end market demand supports our conviction in the return opportunities from fleet investment Requires diligence, but strategic M&A around Parts and Services can drive meaningful returns Committed to dividend growth and will be opportunistic around share repurchases Current debt profile supports ROE outlook Committed to maintaining appropriate liquidity Capital Allocation Strategy Focused on Returns HIGHER RETURNS LOWER RETURNS Fleet InvestmentCapital Investments and M&AReturn of CapitalDebt RepaymentHold Cash
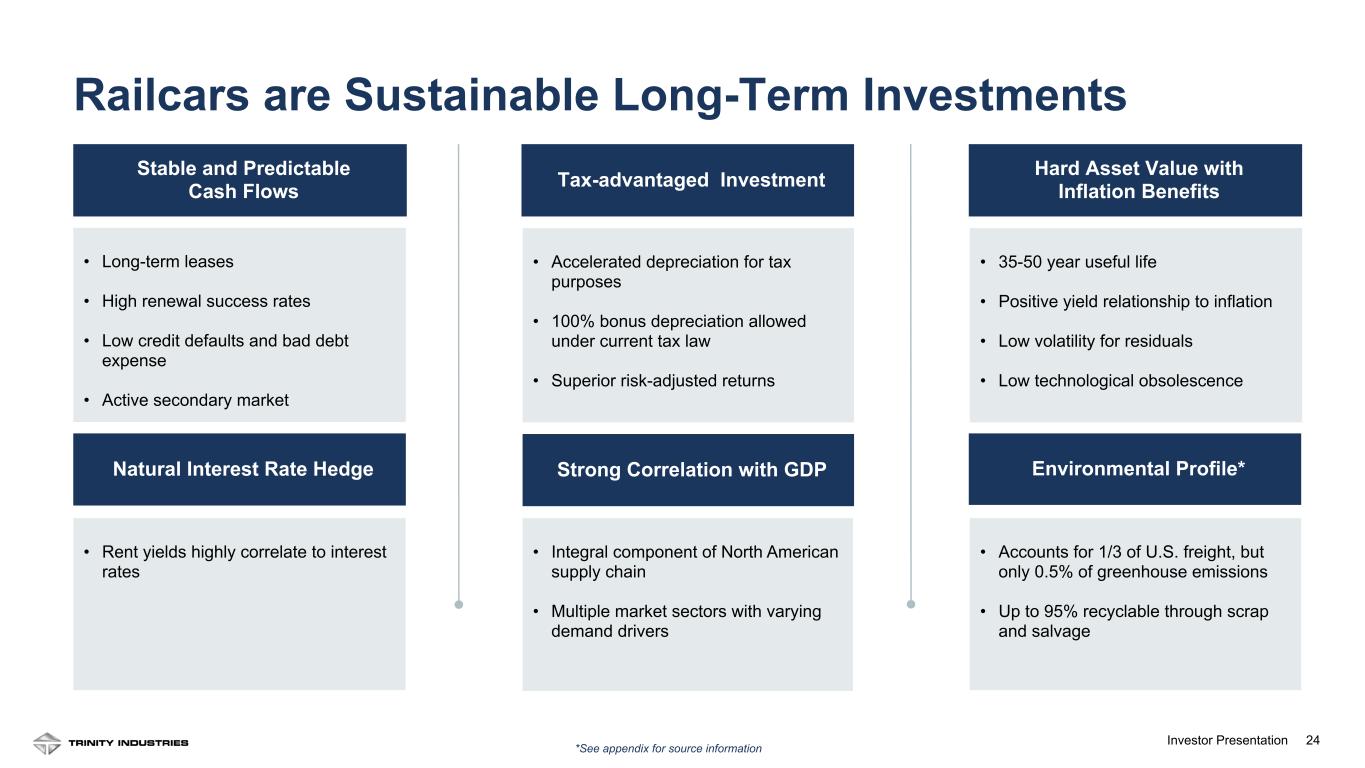
24Investor Presentation • Long-term leases • High renewal success rates • Low credit defaults and bad debt expense • Active secondary market Stable and Predictable Cash Flows • 35-50 year useful life • Positive yield relationship to inflation • Low volatility for residuals • Low technological obsolescence Hard Asset Value with Inflation Benefits • Integral component of North American supply chain • Multiple market sectors with varying demand drivers Strong Correlation with GDP • Rent yields highly correlate to interest rates Natural Interest Rate Hedge • Accelerated depreciation for tax purposes • 100% bonus depreciation allowed under current tax law • Superior risk-adjusted returns Tax-advantaged Investment • Accounts for 1/3 of U.S. freight, but only 0.5% of greenhouse emissions • Up to 95% recyclable through scrap and salvage Environmental Profile* *See appendix for source information 24 Railcars are Sustainable Long-Term Investments
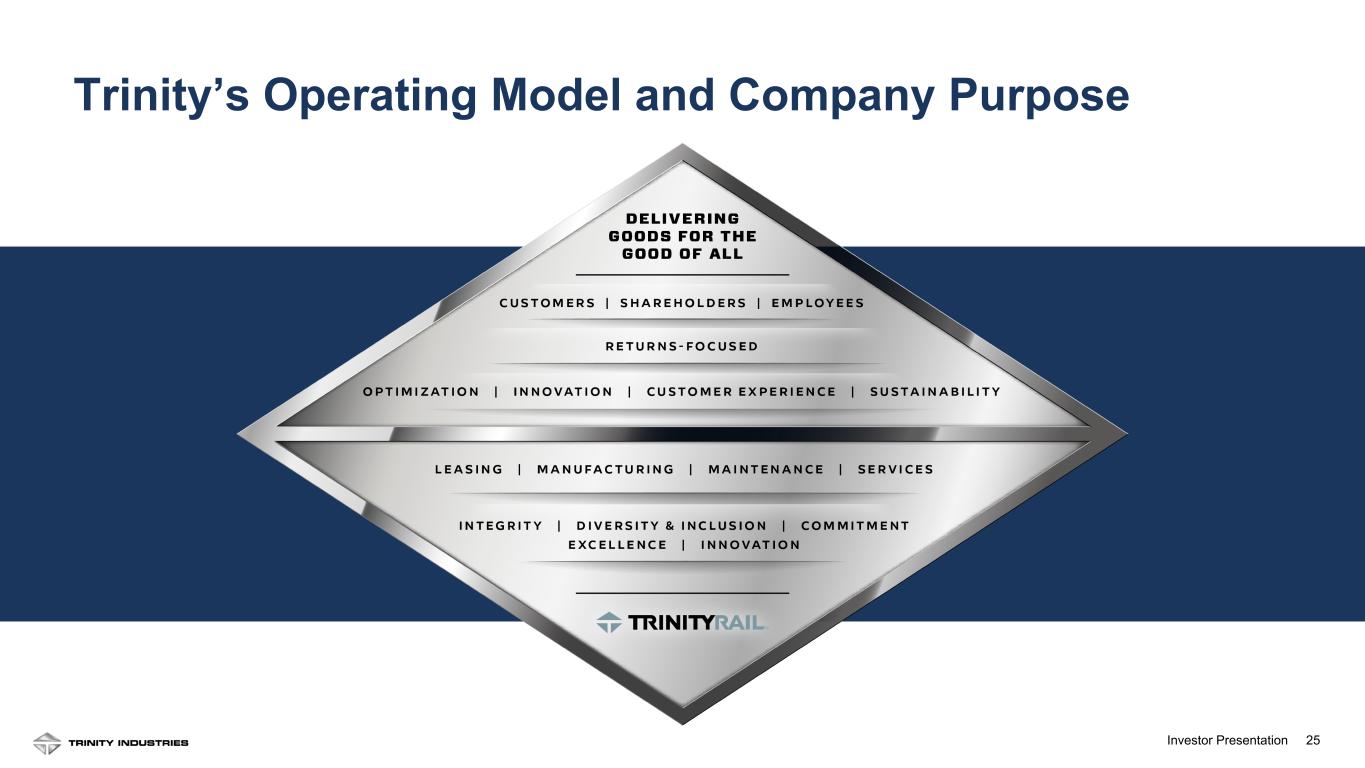
25Investor Presentation Trinity’s Operating Model and Company Purpose

26Investor Presentation Appendix
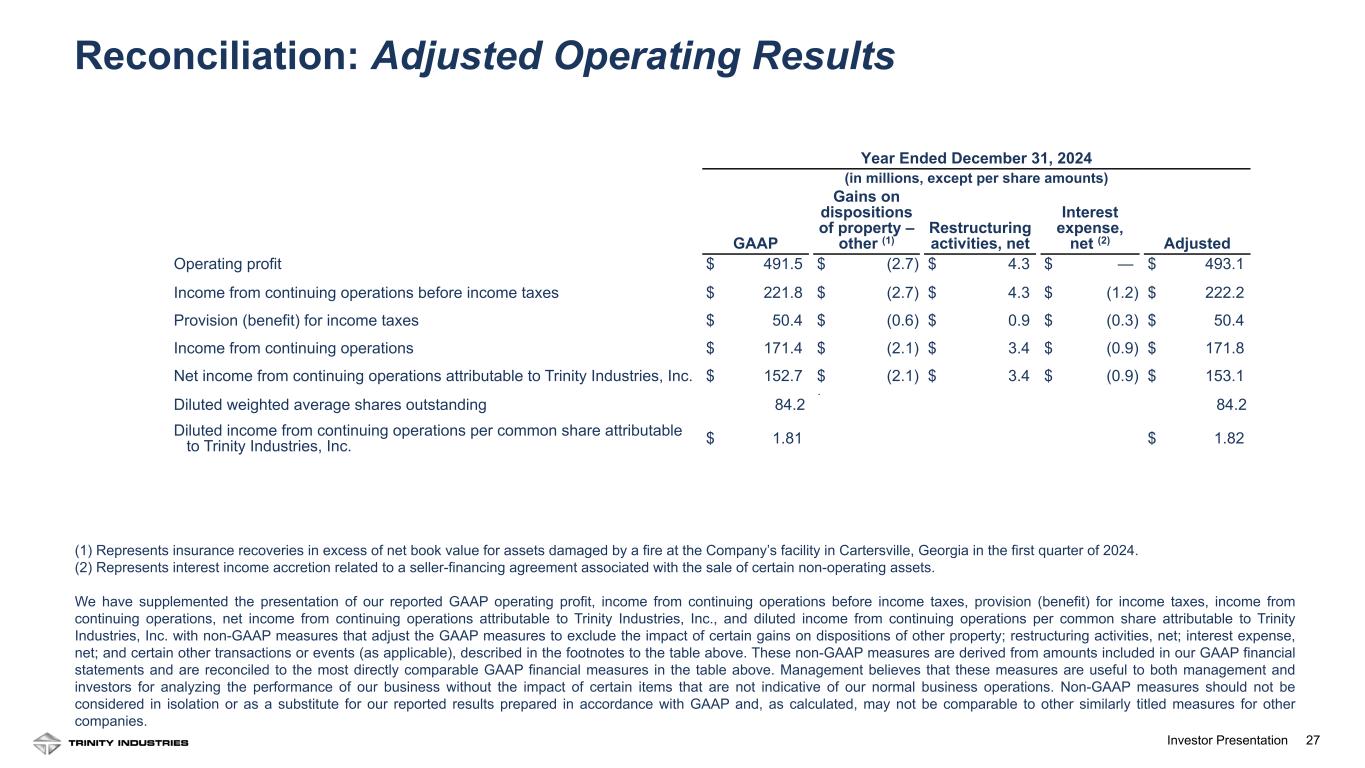
27Investor Presentation 27 Year Ended December 31, 2024 (in millions, except per share amounts) GAAP Gains on dispositions of property – other (1) Restructuring activities, net Interest expense, net (2) Adjusted Operating profit $ 491.5 $ (2.7) $ 4.3 $ — $ 493.1 Income from continuing operations before income taxes $ 221.8 $ (2.7) $ 4.3 $ (1.2) $ 222.2 Provision (benefit) for income taxes $ 50.4 $ (0.6) $ 0.9 $ (0.3) $ 50.4 Income from continuing operations $ 171.4 $ (2.1) $ 3.4 $ (0.9) $ 171.8 Net income from continuing operations attributable to Trinity Industries, Inc. $ 152.7 $ (2.1) $ 3.4 $ (0.9) $ 153.1 . Diluted weighted average shares outstanding 84.2 84.2 Diluted income from continuing operations per common share attributable to Trinity Industries, Inc. $ 1.81 $ 1.82 Reconciliation: Adjusted Operating Results (1) Represents insurance recoveries in excess of net book value for assets damaged by a fire at the Company’s facility in Cartersville, Georgia in the first quarter of 2024. (2) Represents interest income accretion related to a seller-financing agreement associated with the sale of certain non-operating assets. We have supplemented the presentation of our reported GAAP operating profit, income from continuing operations before income taxes, provision (benefit) for income taxes, income from continuing operations, net income from continuing operations attributable to Trinity Industries, Inc., and diluted income from continuing operations per common share attributable to Trinity Industries, Inc. with non-GAAP measures that adjust the GAAP measures to exclude the impact of certain gains on dispositions of other property; restructuring activities, net; interest expense, net; and certain other transactions or events (as applicable), described in the footnotes to the table above. These non-GAAP measures are derived from amounts included in our GAAP financial statements and are reconciled to the most directly comparable GAAP financial measures in the table above. Management believes that these measures are useful to both management and investors for analyzing the performance of our business without the impact of certain items that are not indicative of our normal business operations. Non-GAAP measures should not be considered in isolation or as a substitute for our reported results prepared in accordance with GAAP and, as calculated, may not be comparable to other similarly titled measures for other companies.
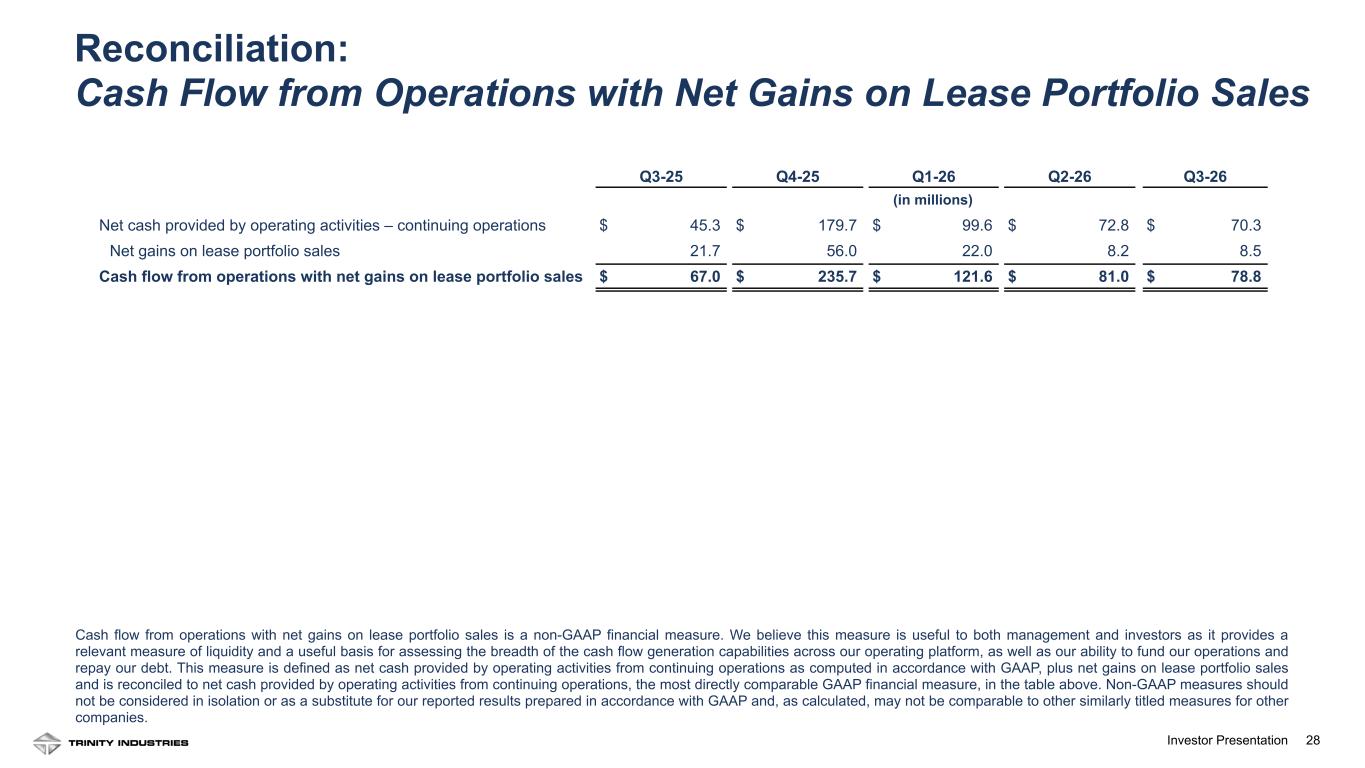
28Investor Presentation Q3-25 Q4-25 Q1-26 Q2-26 Q3-26 (in millions) Net cash provided by operating activities – continuing operations $ 45.3 $ 179.7 $ 99.6 $ 72.8 $ 70.3 Net gains on lease portfolio sales 21.7 56.0 22.0 8.2 8.5 Cash flow from operations with net gains on lease portfolio sales $ 67.0 $ 235.7 $ 121.6 $ 81.0 $ 78.8 Reconciliation: Cash Flow from Operations with Net Gains on Lease Portfolio Sales Cash flow from operations with net gains on lease portfolio sales is a non-GAAP financial measure. We believe this measure is useful to both management and investors as it provides a relevant measure of liquidity and a useful basis for assessing the breadth of the cash flow generation capabilities across our operating platform, as well as our ability to fund our operations and repay our debt. This measure is defined as net cash provided by operating activities from continuing operations as computed in accordance with GAAP, plus net gains on lease portfolio sales and is reconciled to net cash provided by operating activities from continuing operations, the most directly comparable GAAP financial measure, in the table above. Non-GAAP measures should not be considered in isolation or as a substitute for our reported results prepared in accordance with GAAP and, as calculated, may not be comparable to other similarly titled measures for other companies.
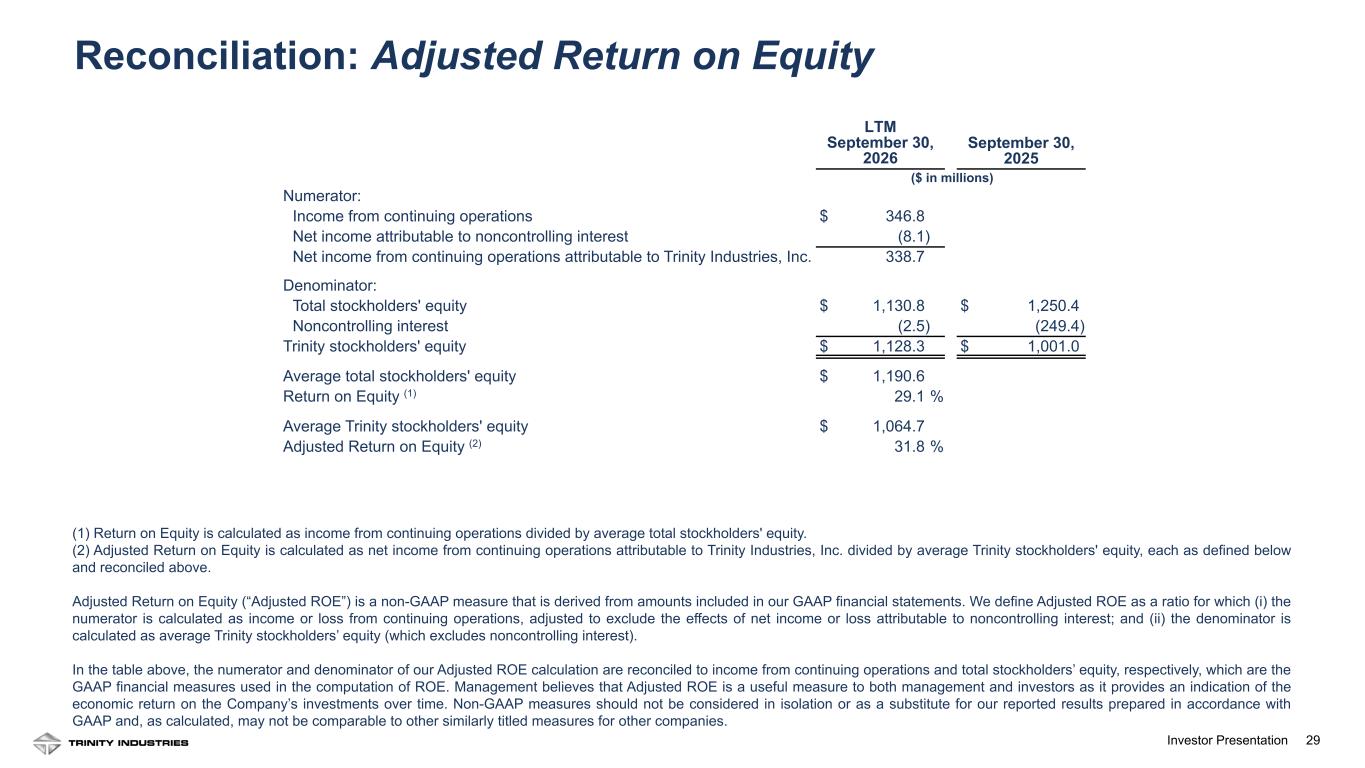
29Investor Presentation (1) Return on Equity is calculated as income from continuing operations divided by average total stockholders' equity. (2) Adjusted Return on Equity is calculated as net income from continuing operations attributable to Trinity Industries, Inc. divided by average Trinity stockholders' equity, each as defined below and reconciled above. Adjusted Return on Equity (“Adjusted ROE”) is a non-GAAP measure that is derived from amounts included in our GAAP financial statements. We define Adjusted ROE as a ratio for which (i) the numerator is calculated as income or loss from continuing operations, adjusted to exclude the effects of net income or loss attributable to noncontrolling interest; and (ii) the denominator is calculated as average Trinity stockholders’ equity (which excludes noncontrolling interest). In the table above, the numerator and denominator of our Adjusted ROE calculation are reconciled to income from continuing operations and total stockholders’ equity, respectively, which are the GAAP financial measures used in the computation of ROE. Management believes that Adjusted ROE is a useful measure to both management and investors as it provides an indication of the economic return on the Company’s investments over time. Non-GAAP measures should not be considered in isolation or as a substitute for our reported results prepared in accordance with GAAP and, as calculated, may not be comparable to other similarly titled measures for other companies. LTM September 30, 2026 September 30, 2025 ($ in millions) Numerator: Income from continuing operations $ 346.8 Net income attributable to noncontrolling interest (8.1) Net income from continuing operations attributable to Trinity Industries, Inc. 338.7 Denominator: Total stockholders' equity $ 1,130.8 $ 1,250.4 Noncontrolling interest (2.5) (249.4) Trinity stockholders' equity $ 1,128.3 $ 1,001.0 Average total stockholders' equity $ 1,190.6 Return on Equity (1) 29.1 % Average Trinity stockholders' equity $ 1,064.7 Adjusted Return on Equity (2) 31.8 % Reconciliation: Adjusted Return on Equity
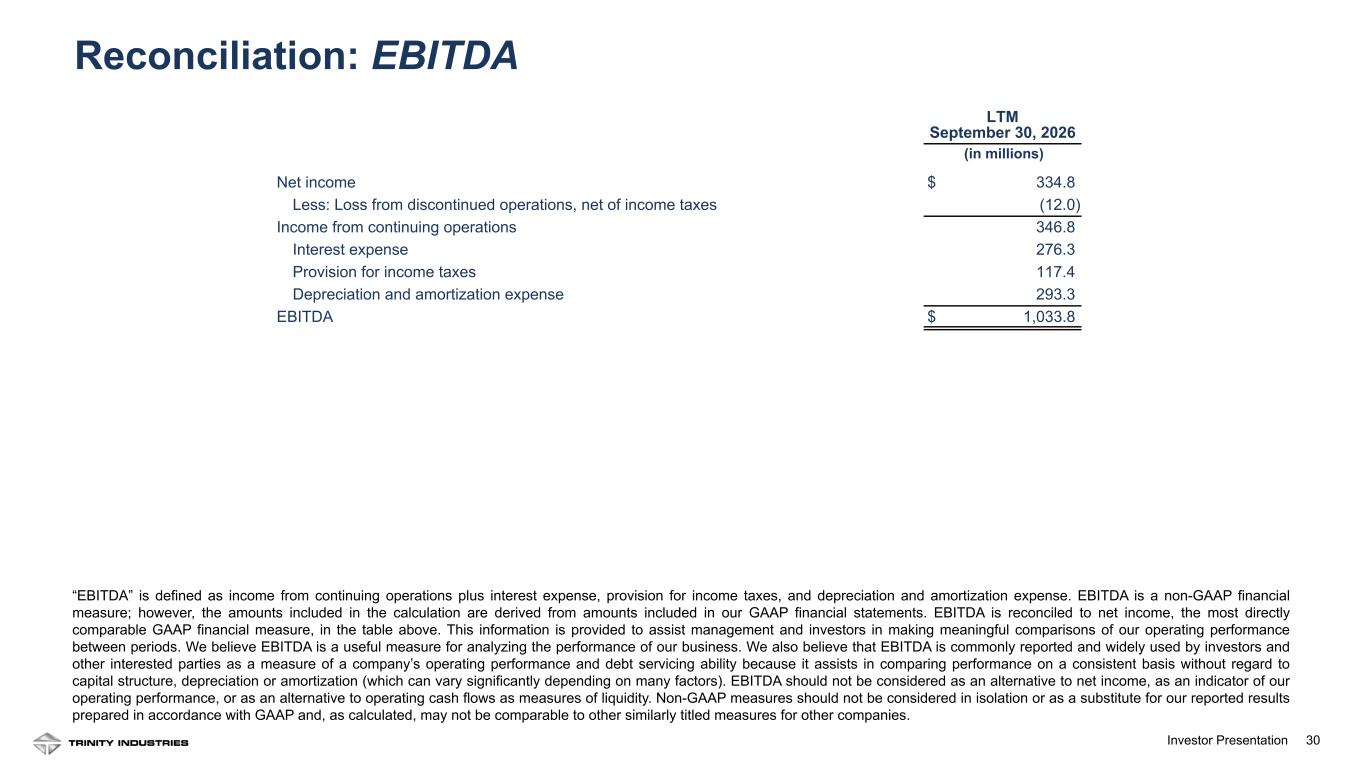
30Investor Presentation “EBITDA” is defined as income from continuing operations plus interest expense, provision for income taxes, and depreciation and amortization expense. EBITDA is a non-GAAP financial measure; however, the amounts included in the calculation are derived from amounts included in our GAAP financial statements. EBITDA is reconciled to net income, the most directly comparable GAAP financial measure, in the table above. This information is provided to assist management and investors in making meaningful comparisons of our operating performance between periods. We believe EBITDA is a useful measure for analyzing the performance of our business. We also believe that EBITDA is commonly reported and widely used by investors and other interested parties as a measure of a company’s operating performance and debt servicing ability because it assists in comparing performance on a consistent basis without regard to capital structure, depreciation or amortization (which can vary significantly depending on many factors). EBITDA should not be considered as an alternative to net income, as an indicator of our operating performance, or as an alternative to operating cash flows as measures of liquidity. Non-GAAP measures should not be considered in isolation or as a substitute for our reported results prepared in accordance with GAAP and, as calculated, may not be comparable to other similarly titled measures for other companies. LTM September 30, 2026 (in millions) Net income $ 334.8 Less: Loss from discontinued operations, net of income taxes (12.0) Income from continuing operations 346.8 Interest expense 276.3 Provision for income taxes 117.4 Depreciation and amortization expense 293.3 EBITDA $ 1,033.8 Reconciliation: EBITDA
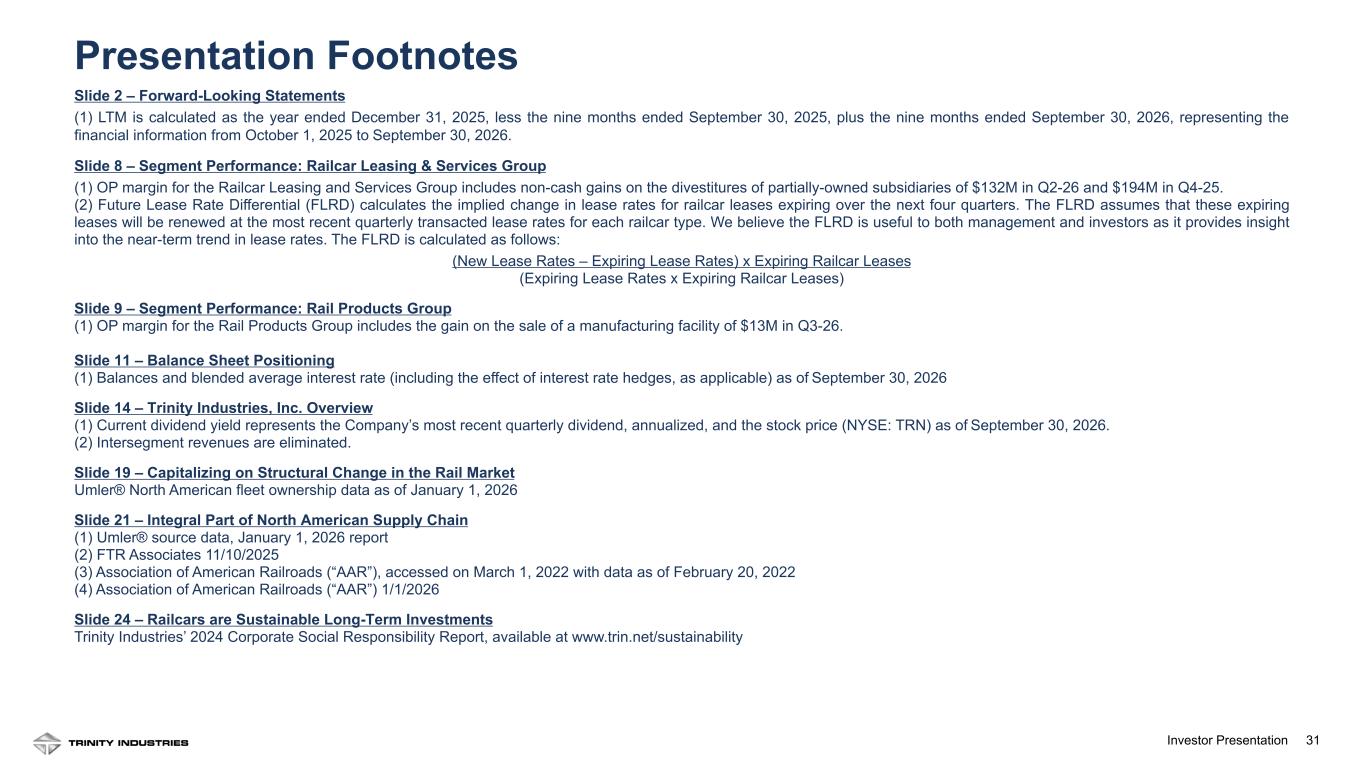
31Investor Presentation Slide 2 – Forward-Looking Statements (1) LTM is calculated as the year ended December 31, 2025, less the nine months ended September 30, 2025, plus the nine months ended September 30, 2026, representing the financial information from October 1, 2025 to September 30, 2026. Slide 8 – Segment Performance: Railcar Leasing & Services Group (1) OP margin for the Railcar Leasing and Services Group includes non-cash gains on the divestitures of partially-owned subsidiaries of $132M in Q2-26 and $194M in Q4-25. (2) Future Lease Rate Differential (FLRD) calculates the implied change in lease rates for railcar leases expiring over the next four quarters. The FLRD assumes that these expiring leases will be renewed at the most recent quarterly transacted lease rates for each railcar type. We believe the FLRD is useful to both management and investors as it provides insight into the near-term trend in lease rates. The FLRD is calculated as follows: (New Lease Rates – Expiring Lease Rates) x Expiring Railcar Leases (Expiring Lease Rates x Expiring Railcar Leases) Slide 9 – Segment Performance: Rail Products Group (1) OP margin for the Rail Products Group includes the gain on the sale of a manufacturing facility of $13M in Q3-26. Slide 11 – Balance Sheet Positioning (1) Balances and blended average interest rate (including the effect of interest rate hedges, as applicable) as of September 30, 2026 Slide 14 – Trinity Industries, Inc. Overview (1) Current dividend yield represents the Company’s most recent quarterly dividend, annualized, and the stock price (NYSE: TRN) as of September 30, 2026. (2) Intersegment revenues are eliminated. Slide 19 – Capitalizing on Structural Change in the Rail Market Umler® North American fleet ownership data as of January 1, 2026 Slide 21 – Integral Part of North American Supply Chain (1) Umler® source data, January 1, 2026 report (2) FTR Associates 11/10/2025 (3) Association of American Railroads (“AAR”), accessed on March 1, 2022 with data as of February 20, 2022 (4) Association of American Railroads (“AAR”) 1/1/2026 Slide 24 – Railcars are Sustainable Long-Term Investments Trinity Industries’ 2024 Corporate Social Responsibility Report, available at www.trin.net/sustainability Presentation Footnotes
32Investor Presentation Leigh Anne Mann, Vice President of Investor Relations 214-631-4420 TrinityInvestorRelations@trin.net Investor Website: www.trin.net/investor-relations Contact Information