
3rd Quarter 2026 Financial Results October 29th, 2026
3rd Quarter 2026 Financial Results Cautionary Note Regarding Forward-Looking Statements Certain statements included in this presentation that are not historical facts are forward-looking statements for purposes of the safe harbor provisions under the United States Private Securities Litigation Reform Act of 1995. We intend such forward- looking statements to be covered by the safe harbor provisions for forward-looking statements contained in Section 27A of the U.S. Securities Act of 1933, as amended, and Section 21E of the U.S. Securities Exchange Act of 1934, as amended. All statements contained in this presentation other than statements of historical fact, including, without limitation, statements regarding the financial position, business strategy, and the plans and objectives of management for Hippo Holdings Inc. (together with its subsidiaries, “Hippo,” the “Company,” “we,” “us” and “our”) for future operations, statements regarding our strategic relationships, and statements regarding future expansion of our program are forward-looking statements. These statements are not guarantees of performance. Such statements can be identified by the fact that they do not relate strictly to historical or current facts. Forward-looking statements generally are accompanied by words such as “anticipate,” “believe,” “continue,” “could,” “estimate,” “expect,” “future,” “intend,” “may,” “might,” “outlook,” “plan,” “possible,” “potential,” “predict,” “project,” “seek,” “seem,” “should,” “strive,” “will,” “would,” including the negative expressions of these words and similar expressions that predict or indicate future events or trends or that are not statements of historical matters, but the absence of these words does not mean that a statement is not forward-looking. Forward-looking statements in this presentation include, for example, statements about: our future results of operations and financial condition, including estimates and forecasts of financial and operating results and performance metrics, and our ability to attain and maintain profitability; our business strategy, including our cost reduction efforts, our diversified distribution strategy, the expected evolution of our business and premium mix across personal and commercial lines, and our plans to expand into new markets and new products; our ability to grow our business and, if such growth occurs, to effectively manage such growth, including the growth and development of our distribution channels; customer satisfaction and our ability to attract, retain, and expand our customer base; our ability to maintain and enhance our brand and reputation, including the quality of our products and services; our expectations about our book of business, including our ability to cross-sell and to attain greater value from each customer; the effects of seasonal and cyclical trends on our results of operations; our ability to compete effectively in the segments of the insurance industry in which we operate; our ability to underwrite risks accurately and charge competitive yet profitable rates to our customers, and the sufficiency of the analytical models we use to assess and predict exposure to catastrophe losses; our expectations regarding the effectiveness and adequacy of our reinsurance program, our ability to maintain reinsurance contracts and our near- and long-term strategies and expectations with respect to the availability, adequacy, coverage, limits, pricing, and cession of insurance risk; our ability to utilize, develop, and protect our proprietary technology, digital platform, and intellectual property; our development, deployment, and use of artificial intelligence and machine learning technologies, including the risk that competitors or other third parties may incorporate such technologies into their products more quickly or more successfully than we do; our ability to leverage our data, technology, and geographic diversity to help manage risk; our ability to expand our product offerings or improve existing ones; our ability to attract and retain personnel, including our officers and key employees; potential harm caused by outages or interruptions in, or delays to, services provided by our third-party providers, including our data vendors; potential harm caused by misappropriation of our data and compromises in cybersecurity, and our ability to receive, process, store, use, and share data in compliance with laws and regulations related to data privacy and data security; potential harm caused by changes in internet search engines’ methodologies; our denial of claims or our failure to accurately and timely pay claims; the effects of severe weather events and other natural or man-made catastrophes, including the effects of climate change, global pandemics, and terrorism; any overall decline in economic activity; regulators’ identification of errors in the policy forms we use, the rates we charge, and our customer communications, including cancellations, non-renewals, and reinstatements, through market conduct exams, complaints, or other inquiries; our ability to navigate extensive insurance industry regulations and the scrutiny of state insurance regulators, and the effects of existing or new legal or regulatory requirements on our business, including with respect to maintenance of risk- based capital and financial strength ratings, the insurance industry generally, and data privacy and cybersecurity, in the United States and internationally; our expected use of cash on our balance sheet, our future capital needs, and our ability to raise additional capital; fluctuations in our results of operations and operating metrics; our expectations regarding the realizability of our deferred tax assets, including the timing and amount of any release of the valuation allowance against our net deferred tax assets and the related impact on our results of operations; and our public securities’ liquidity and trading. These statements are based on the current expectations of Hippo’s management and are not predictions of actual performance. You should not rely upon forward-looking statements as predictions of future events. Actual events and circumstances are difficult or impossible to predict and will differ from assumptions, and many actual events and circumstances are beyond the control of Hippo. Although we believe that we have a reasonable basis for each forward- looking statement contained in this presentation, we cannot guarantee that the future results, levels of activity, performance, events, and circumstances reflected in the forward-looking statements will be achieved or occur at all. These forward-looking statements are subject to a number of risks, uncertainties, and other factors, including those described above and other risks set forth in the sections entitled “Risk Factors” in the Company’s most recent Annual Report on Form 10-K and subsequent Quarterly Reports on Form 10-Q, and in other documents that may be filed by the Company from time to time with the Securities and Exchange Commission (the “SEC”). Moreover, we operate in a very competitive and rapidly changing environment. New risks and uncertainties emerge from time to time, and it is not possible for us to predict all risks and uncertainties that could have an impact on the forward-looking statements contained in this presentation. If any of these risks materialize or our assumptions prove incorrect, actual results could differ materially from the results implied by these forward-looking statements. There may be additional risks that Hippo does not presently know or that Hippo currently believes are immaterial that could also cause actual results, events, or circumstances to differ materially from those described in the forward-looking statements. These forward-looking statements are based on information available as of the date of this presentation and reflect Hippo’s expectations, plans, forecasts, and views of future events as of that date. Accordingly, forward-looking statements should not be relied upon as representing Hippo’s views as of any subsequent date, and Hippo does not undertake any obligation to update forward-looking statements to reflect events or circumstances after the date they were made, whether as a result of new information, future events, or otherwise, except as may be required under applicable securities laws. While Hippo may elect to update these forward-looking statements at some point in the future, Hippo specifically disclaims any obligation to do so. Accordingly, undue reliance should not be placed upon the forward-looking statements. Rounding Certain monetary amounts, percentages, and other figures included in this presentation have been subject to rounding adjustments. The sum of individual metrics may not always equal total amounts indicated due to rounding. 2 Disclaimers
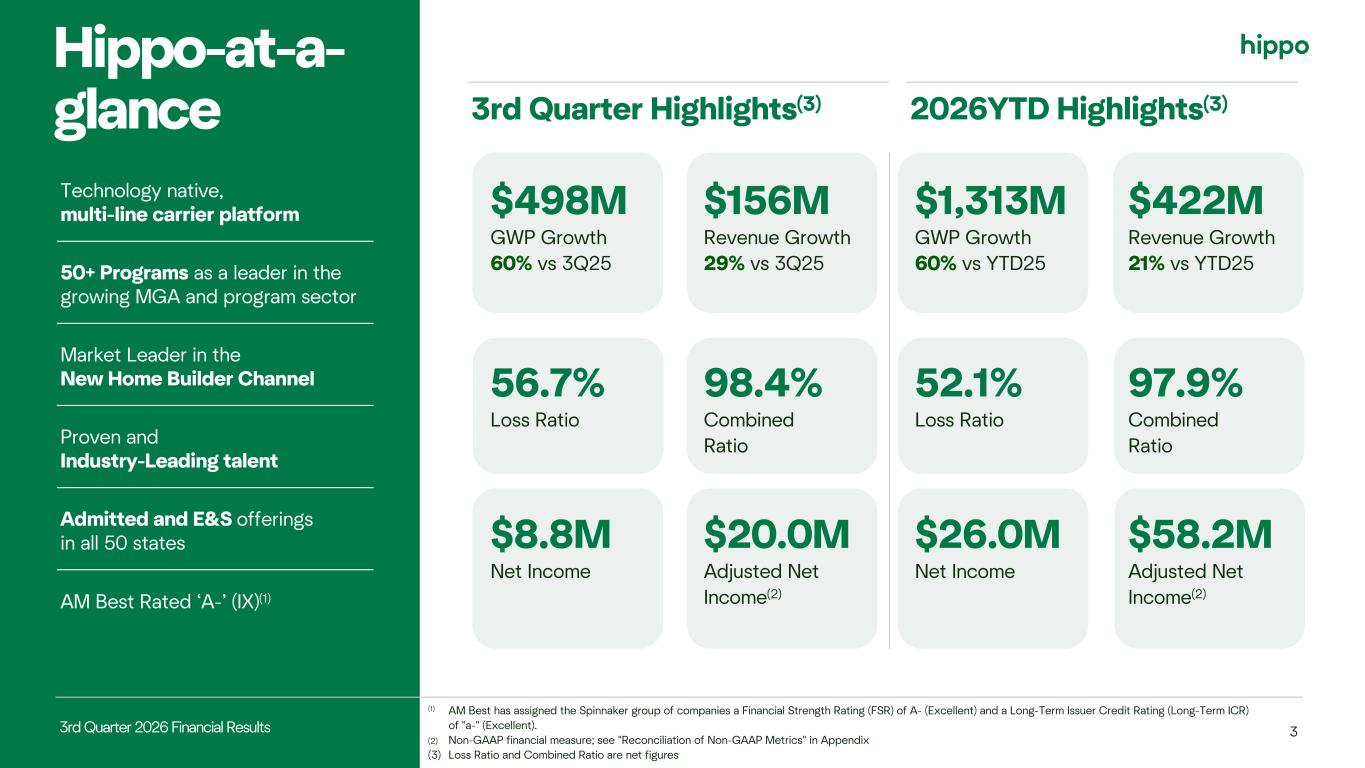
3rd Quarter 2026 Financial Results 3 Technology native, multi-line carrier platform 50+ Programs as a leader in the growing MGA and program sector Market Leader in the New Home Builder Channel Proven and Industry-Leading talent Admitted and E&S offerings in all 50 states AM Best Rated ‘A-’ (IX)(1) 3rd Quarter Highlights(3) (1) AM Best has assigned the Spinnaker group of companies a Financial Strength Rating (FSR) of A- (Excellent) and a Long-Term Issuer Credit Rating (Long-Term ICR) of "a-" (Excellent). (2) Non-GAAP financial measure; see "Reconciliation of Non-GAAP Metrics" in Appendix (3) Loss Ratio and Combined Ratio are net figures $498M $156M $1,313M $422M GWP Growth 60% vs 3Q25 Revenue Growth 29% vs 3Q25 GWP Growth 60% vs YTD25 Revenue Growth 21% vs YTD25 56.7% 98.4% 52.1% 97.9% Loss Ratio Combined Ratio Loss Ratio Combined Ratio $8.8M $20.0M $26.0M $58.2M Net Income Adjusted Net Income(2) Net Income Adjusted Net Income(2) 2026YTD Highlights(3) Hippo-at-a- glance
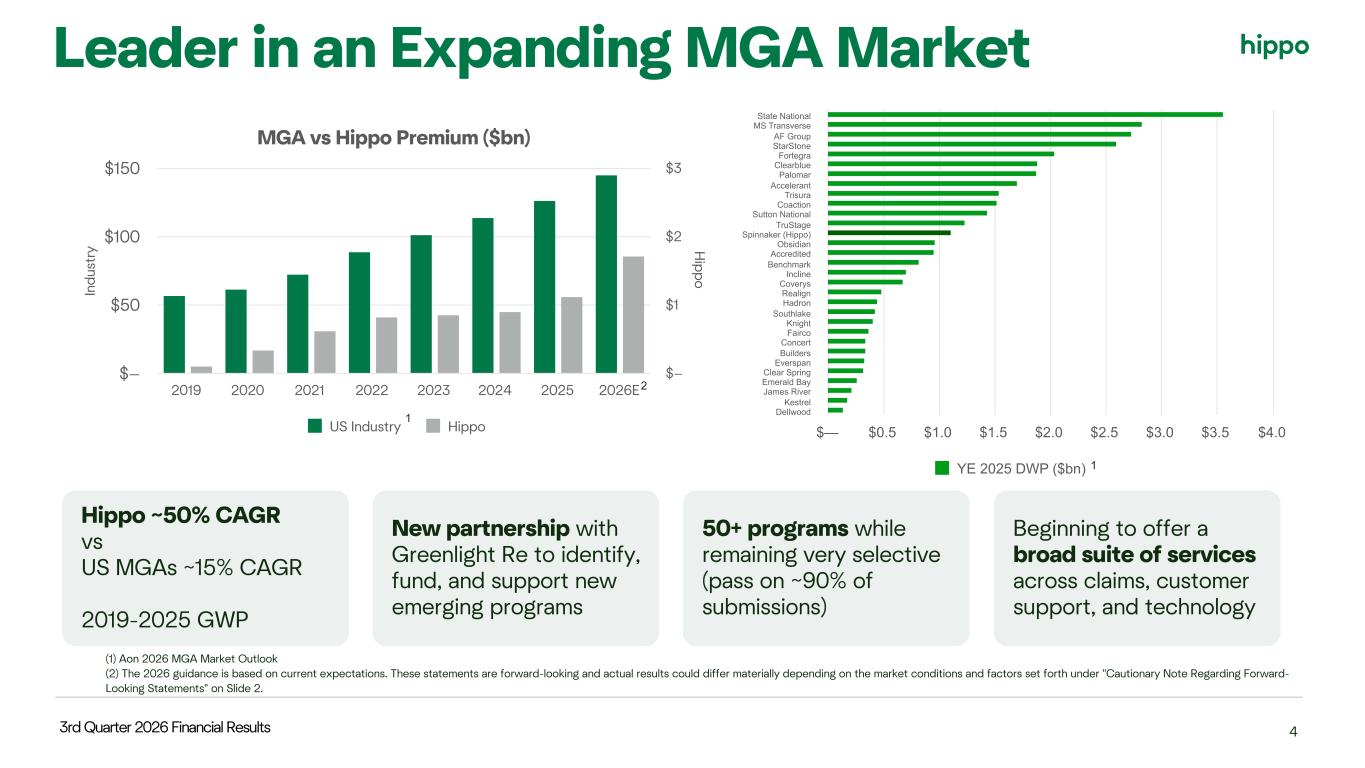
3rd Quarter 2026 Financial Results 4 In du st ry Hippo MGA vs Hippo Premium ($bn) US Industry Hippo 2019 2020 2021 2022 2023 2024 2025 2026E $— $50 $100 $150 $— $1 $2 $3 Leader in an Expanding MGA Market (1) Aon 2026 MGA Market Outlook (2) The 2026 guidance is based on current expectations. These statements are forward-looking and actual results could differ materially depending on the market conditions and factors set forth under "Cautionary Note Regarding Forward- Looking Statements" on Slide 2. Hippo ~50% CAGR vs US MGAs ~15% CAGR 2019-2025 GWP New partnership with Greenlight Re to identify, fund, and support new emerging programs 50+ programs while remaining very selective (pass on ~90% of submissions) Beginning to offer a broad suite of services across claims, customer support, and technology 1 1YE 2025 DWP ($bn) $— $0.5 $1.0 $1.5 $2.0 $2.5 $3.0 $3.5 $4.0 State National MS Transverse AF Group StarStone Fortegra Clearblue Palomar Accelerant Trisura Coaction Sutton National TruStage Spinnaker (Hippo) Obsidian Accredited Benchmark Incline Coverys Realign Hadron Southlake Knight Fairco Concert Builders Everspan Clear Spring Emerald Bay James River Kestrel Dellwood 2
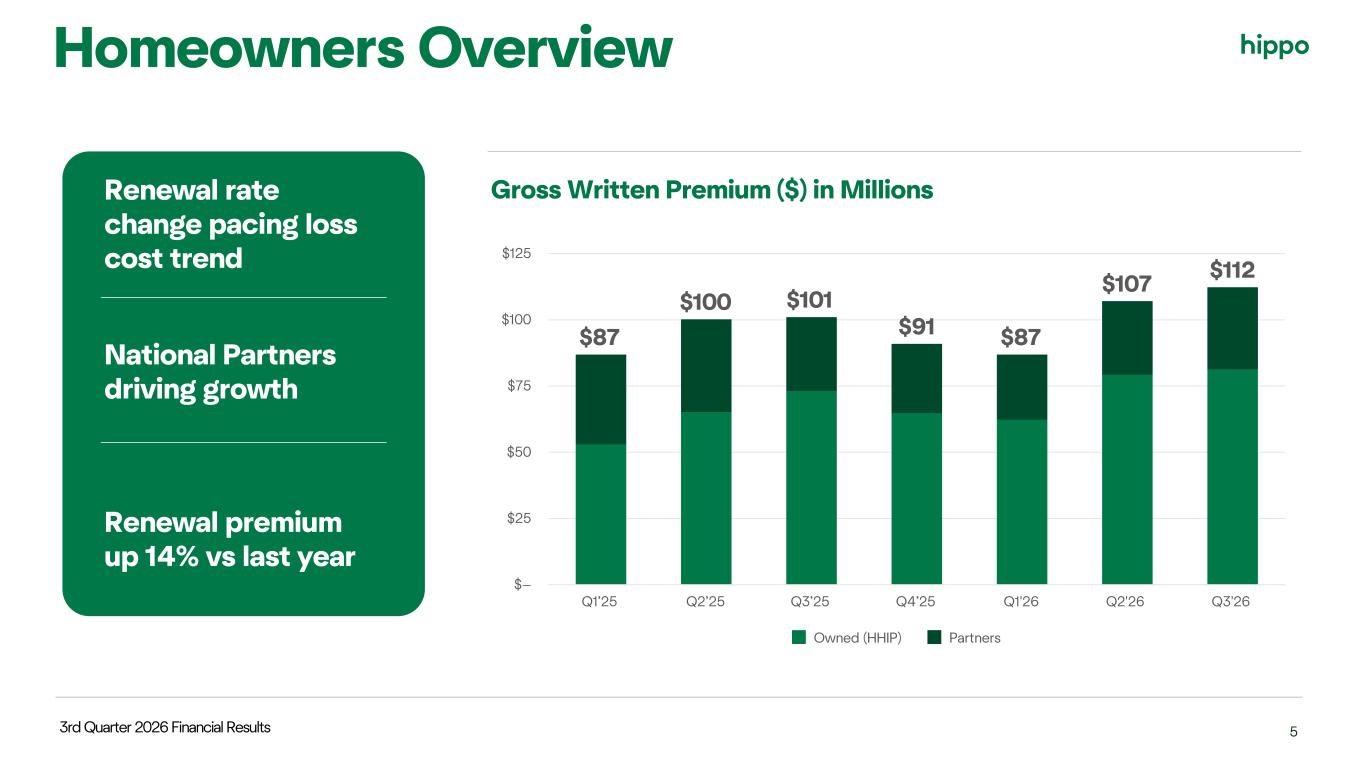
3rd Quarter 2026 Financial Results Renewal rate change pacing loss cost trend National Partners driving growth Renewal premium up 14% vs last year Homeowners Overview Gross Written Premium ($) in Millions 5 $87 $100 $101 $91 $87 $107 $112 Owned (HHIP) Partners Q1’25 Q2’25 Q3’25 Q4’25 Q1'26 Q2'26 Q3'26 $— $25 $50 $75 $100 $125
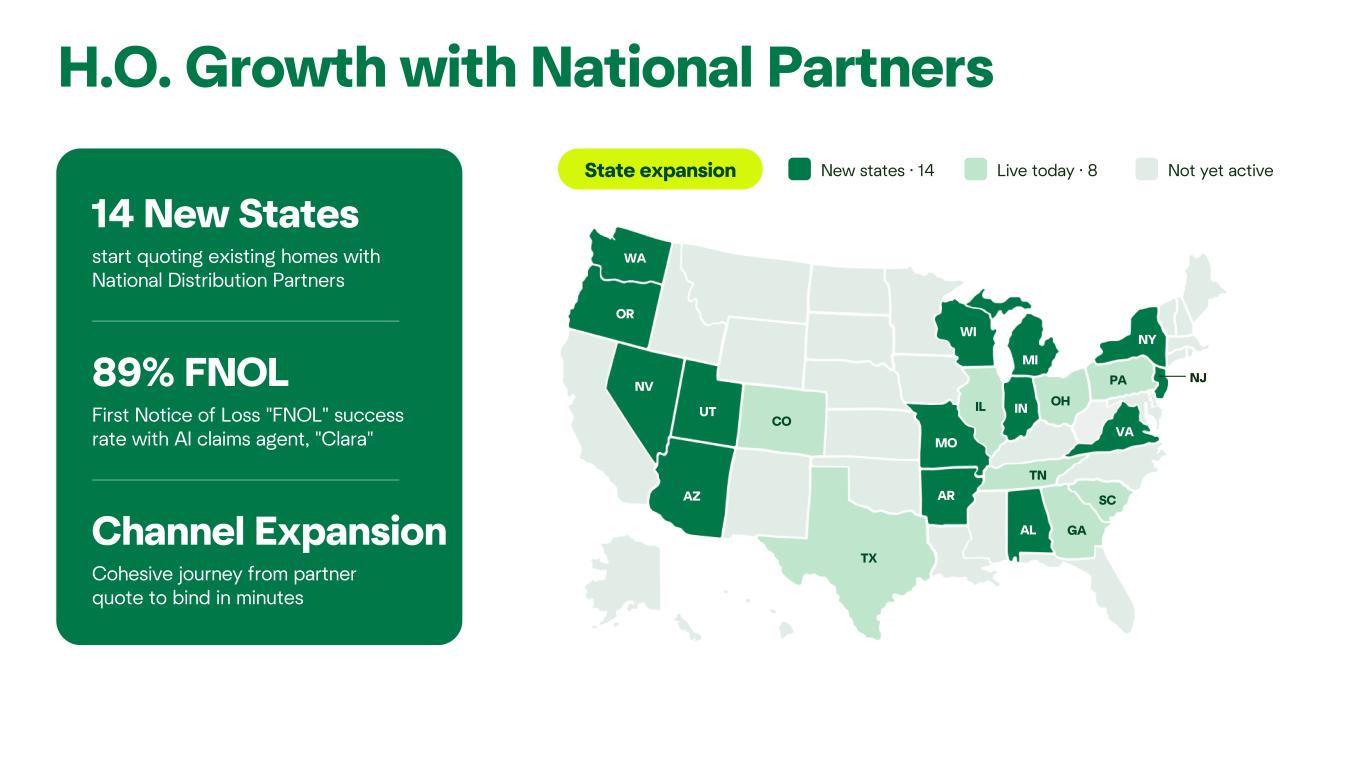
H.O. Growth with National Partners WA OR MI WI NY NV PA UT NJ IL OHIN CO MO VA AZ TN TX AR SC GAAL State expansion New states · 14 Live today · 8 Not yet active start quoting existing homes with National Distribution Partners 89% FNOL First Notice of Loss "FNOL" success rate with AI claims agent, "Clara" Channel Expansion Cohesive journey from partner quote to bind in minutes 14 New States
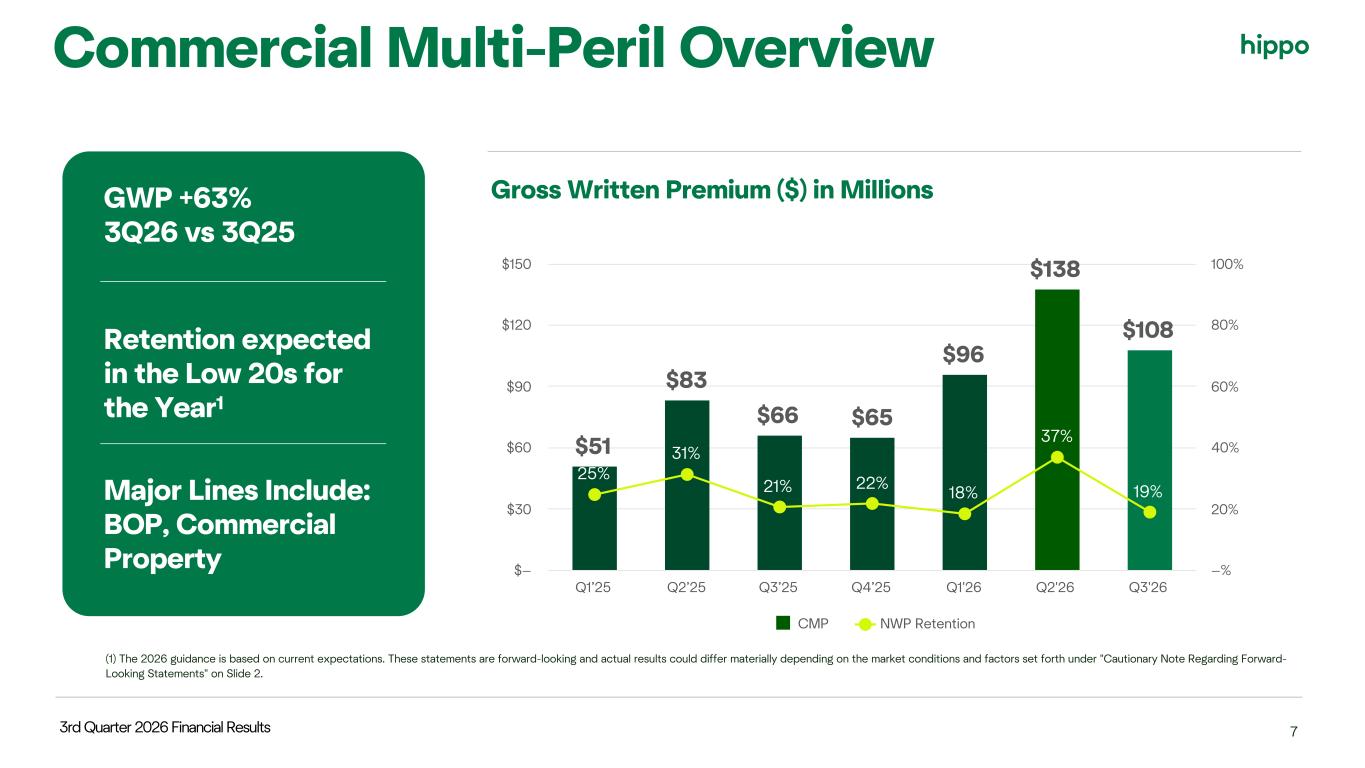
3rd Quarter 2026 Financial Results GWP +63% 3Q26 vs 3Q25 Retention expected in the Low 20s for the Year1 Major Lines Include: BOP, Commercial Property Commercial Multi-Peril Overview 7 $51 $83 $66 $65 $96 $138 $108 25% 31% 21% 22% 18% 37% 19% CMP NWP Retention Q1’25 Q2’25 Q3’25 Q4’25 Q1'26 Q2'26 Q3'26 $— $30 $60 $90 $120 $150 —% 20% 40% 60% 80% 100% Gross Written Premium ($) in Millions (1) The 2026 guidance is based on current expectations. These statements are forward-looking and actual results could differ materially depending on the market conditions and factors set forth under "Cautionary Note Regarding Forward- Looking Statements" on Slide 2.
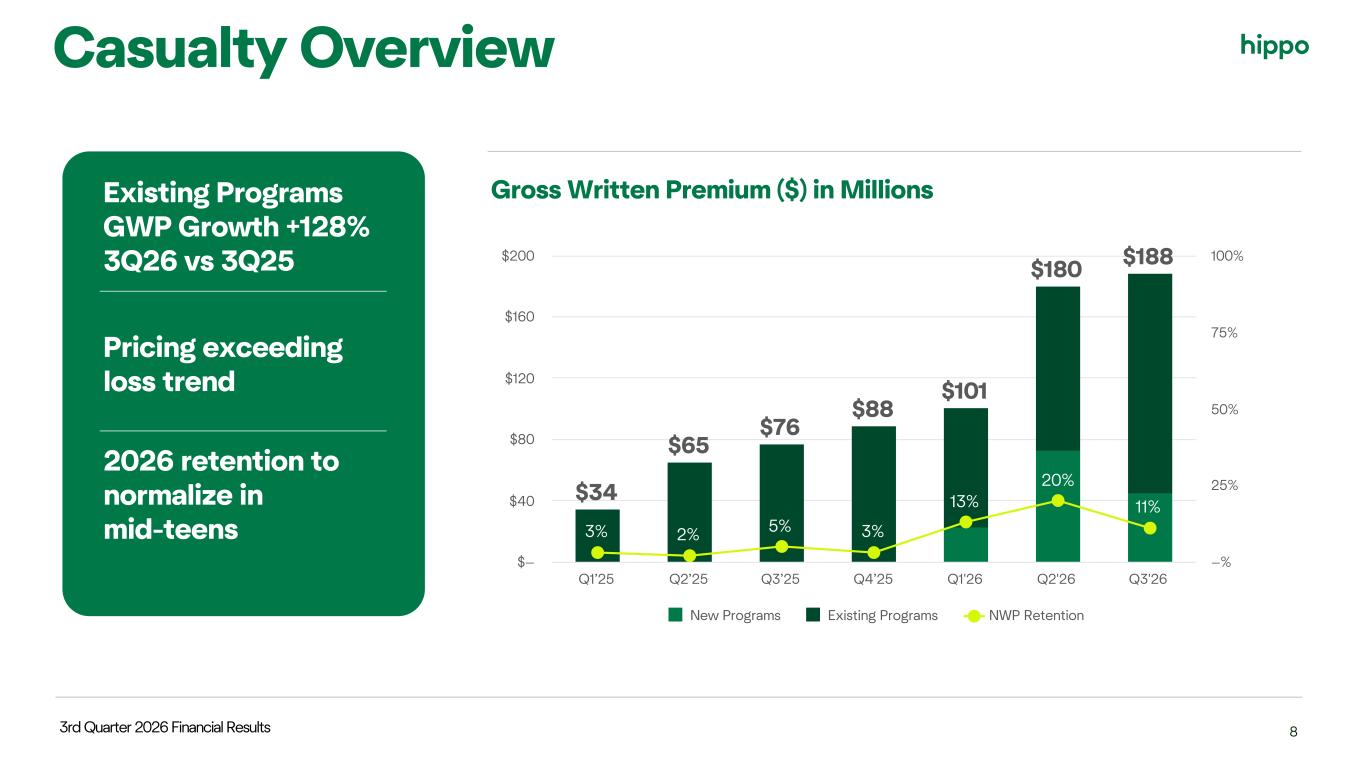
3rd Quarter 2026 Financial Results Existing Programs GWP Growth +128% 3Q26 vs 3Q25 Pricing exceeding loss trend 2026 retention to normalize in mid-teens Casualty Overview 8 $34 $65 $76 $88 $101 $180 $188 3% 2% 5% 3% 13% 20% 11% New Programs Existing Programs NWP Retention Q1’25 Q2’25 Q3’25 Q4’25 Q1'26 Q2'26 Q3'26 $— $40 $80 $120 $160 $200 —% 25% 50% 75% 100% Gross Written Premium ($) in Millions
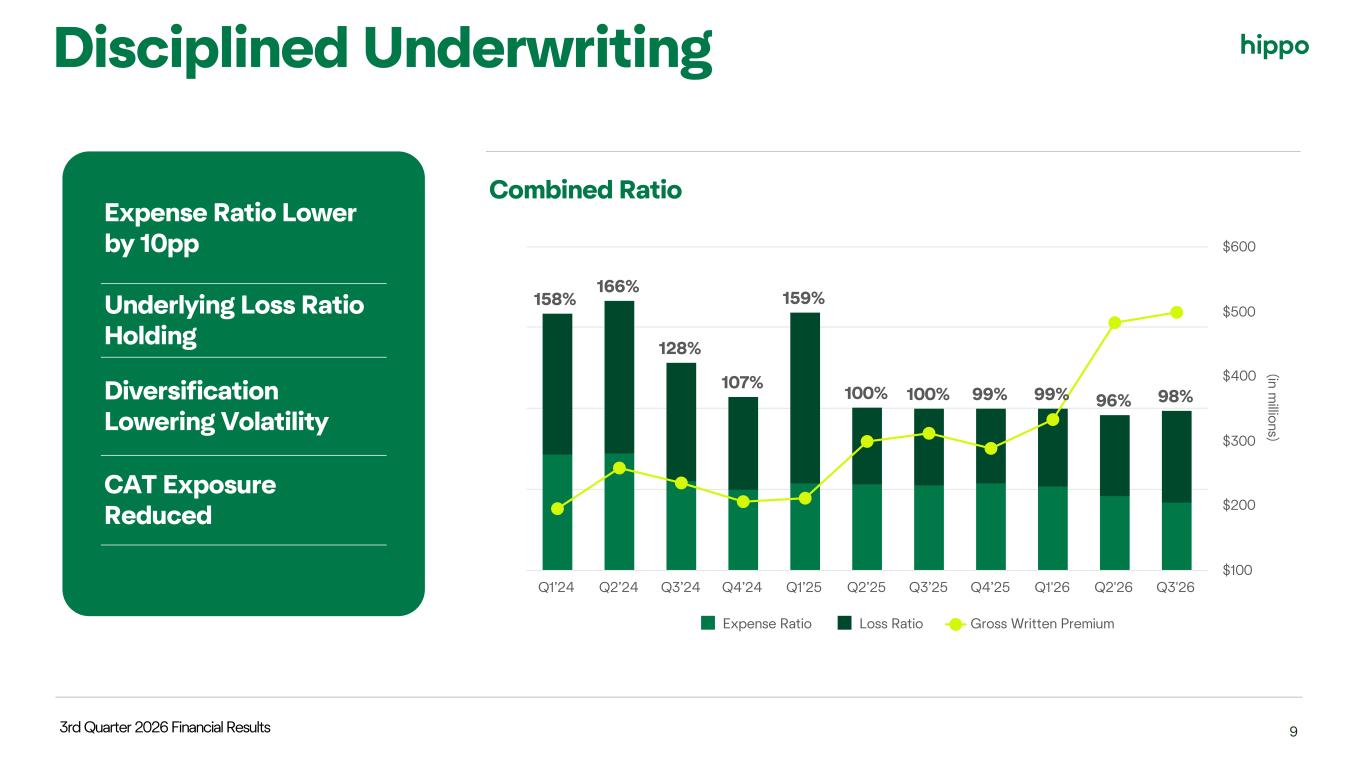
3rd Quarter 2026 Financial Results Disciplined Underwriting Combined Ratio 9 Expense Ratio Lower by 10pp Underlying Loss Ratio Holding Diversification Lowering Volatility CAT Exposure Reduced (in m illions) 158% 166% 128% 107% 159% 100% 100% 99% 99% 96% 98% Expense Ratio Loss Ratio Gross Written Premium Q1’24 Q2’24 Q3’24 Q4’24 Q1’25 Q2’25 Q3’25 Q4’25 Q1'26 Q2'26 Q3'26 $100 $200 $300 $400 $500 $600
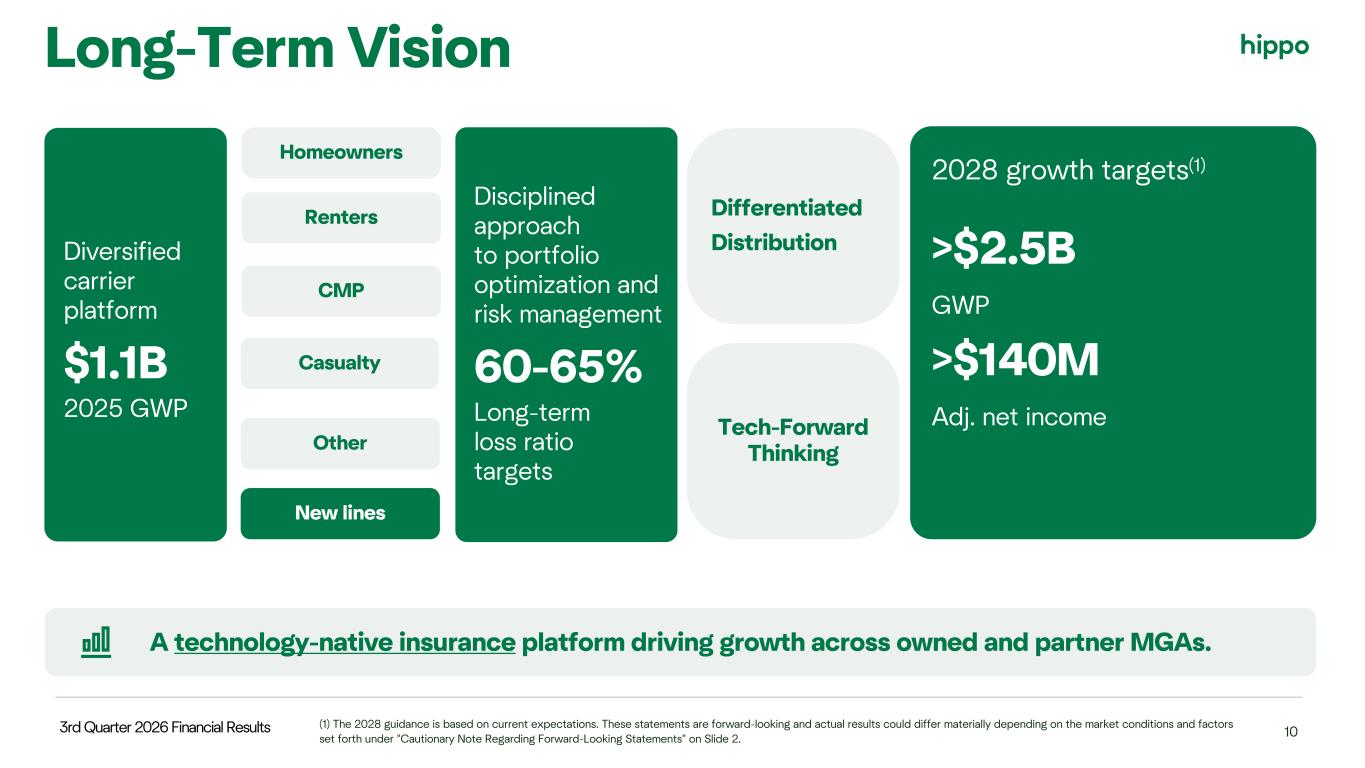
3rd Quarter 2026 Financial Results 2028 growth targets(1) >$2.5B GWP >$140M Adj. net income A technology-native insurance platform driving growth across owned and partner MGAs. Diversified carrier platform $1.1B 2025 GWP Homeowners Renters CMP Other New lines Casualty Disciplined approach to portfolio optimization and risk management 60-65% Long-term loss ratio targets Differentiated Distribution Tech-Forward Thinking Long-Term Vision 10(1) The 2028 guidance is based on current expectations. These statements are forward-looking and actual results could differ materially depending on the market conditions and factors set forth under "Cautionary Note Regarding Forward-Looking Statements" on Slide 2.
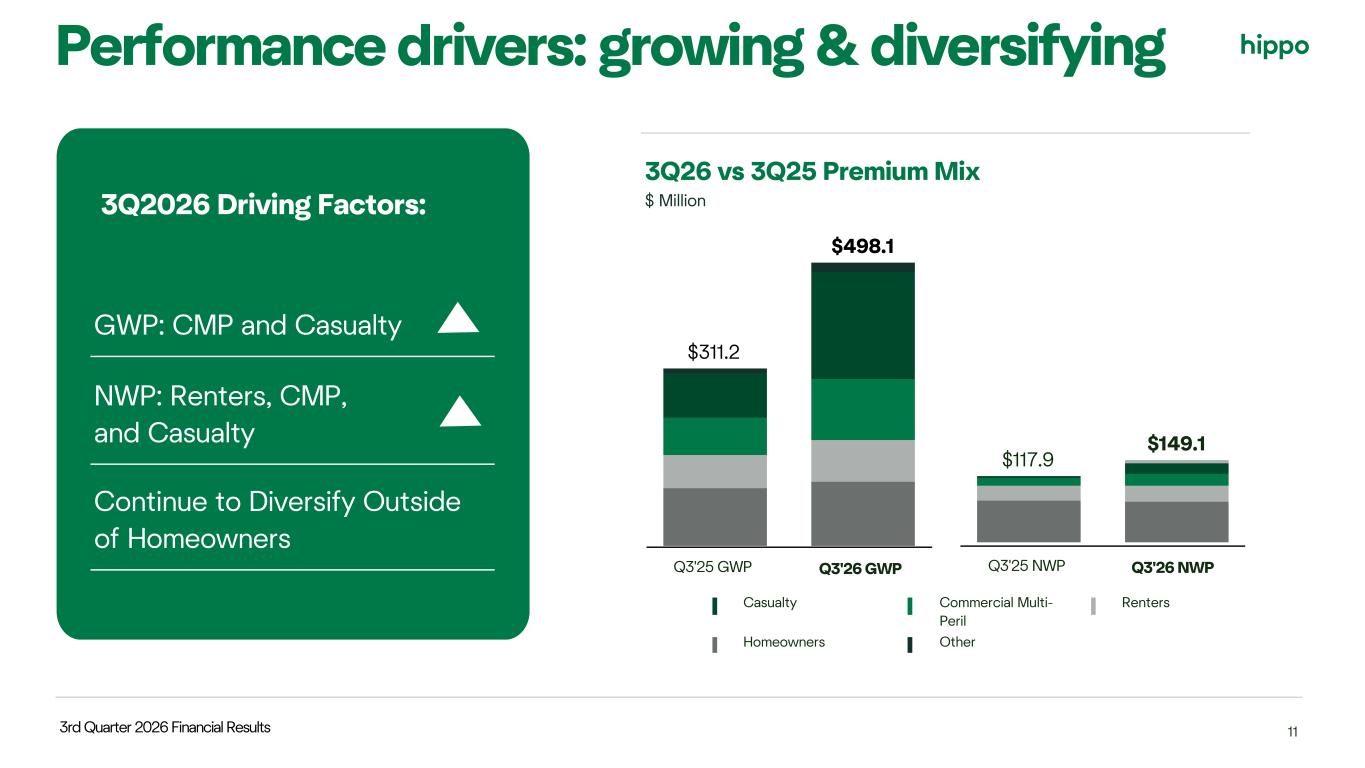
3rd Quarter 2026 Financial Results 11 $311.2 $498.1 Casualty Commercial Multi- Peril Renters Homeowners Other Performance drivers: growing & diversifying Q3'25 GWP Q3'26 GWP $117.9 $149.1 Q3'25 NWP Q3'26 NWP 3Q2026 Driving Factors: GWP: CMP and Casualty NWP: Renters, CMP, and Casualty Continue to Diversify Outside of Homeowners 3Q26 vs 3Q25 Premium Mix $ Million
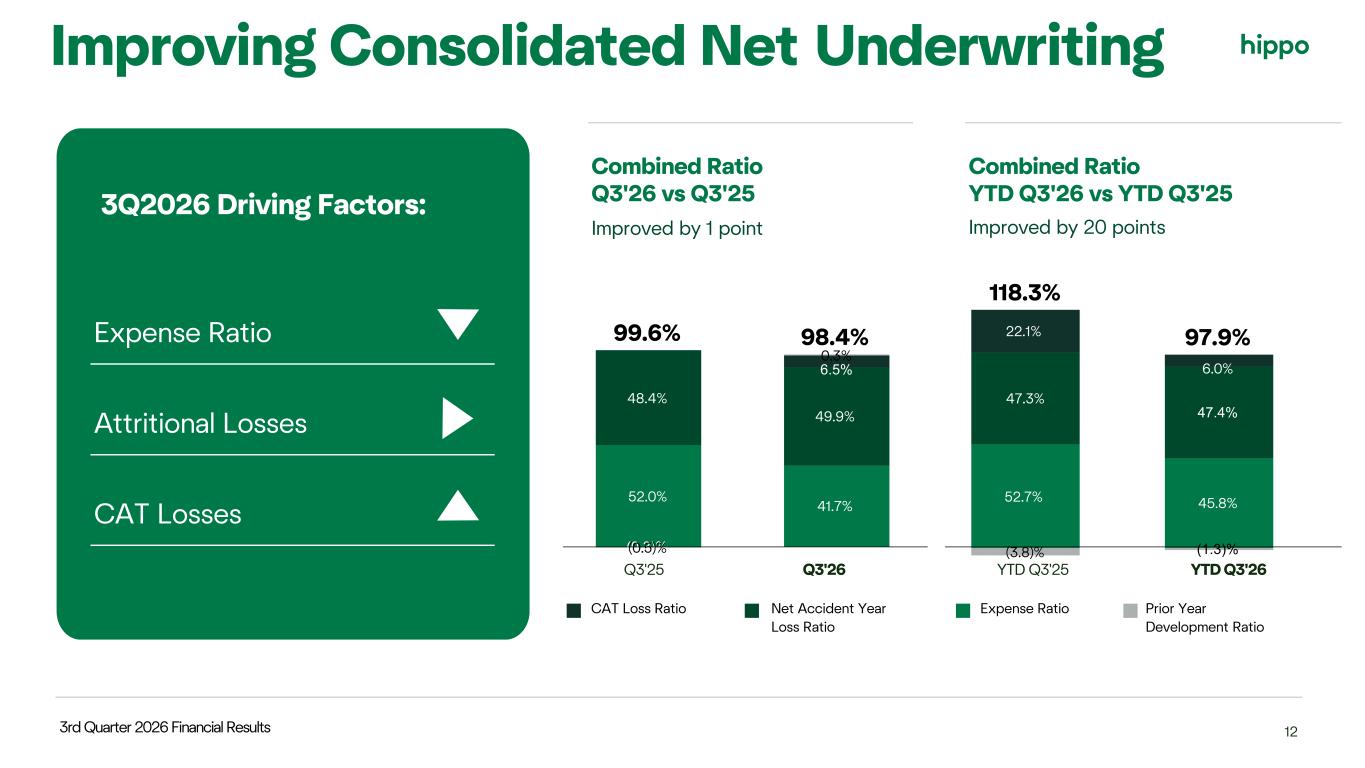
3rd Quarter 2026 Financial Results 12 Improving Consolidated Net Underwriting Expense Ratio Attritional Losses CAT Losses Combined Ratio Q3'26 vs Q3'25 Improved by 1 point 99.6% 98.4% 52.0% 41.7% 48.4% 49.9% (0.3)% 6.5% ( .5) 0.3% g CAT Loss Ratio g Net Accident Year Loss Ratio g Expense Ratio g Prior Year Development Ratio Q3'25 Q3'26 Combined Ratio YTD Q3'26 vs YTD Q3'25 Improved by 20 points 118.3% 97.9% 52.7% 45.8% 47.3% 47.4% 22.1% 6.0% (3.8)% (1.3)% YTD Q3'25 YTD Q3'26 3Q2026 Driving Factors:
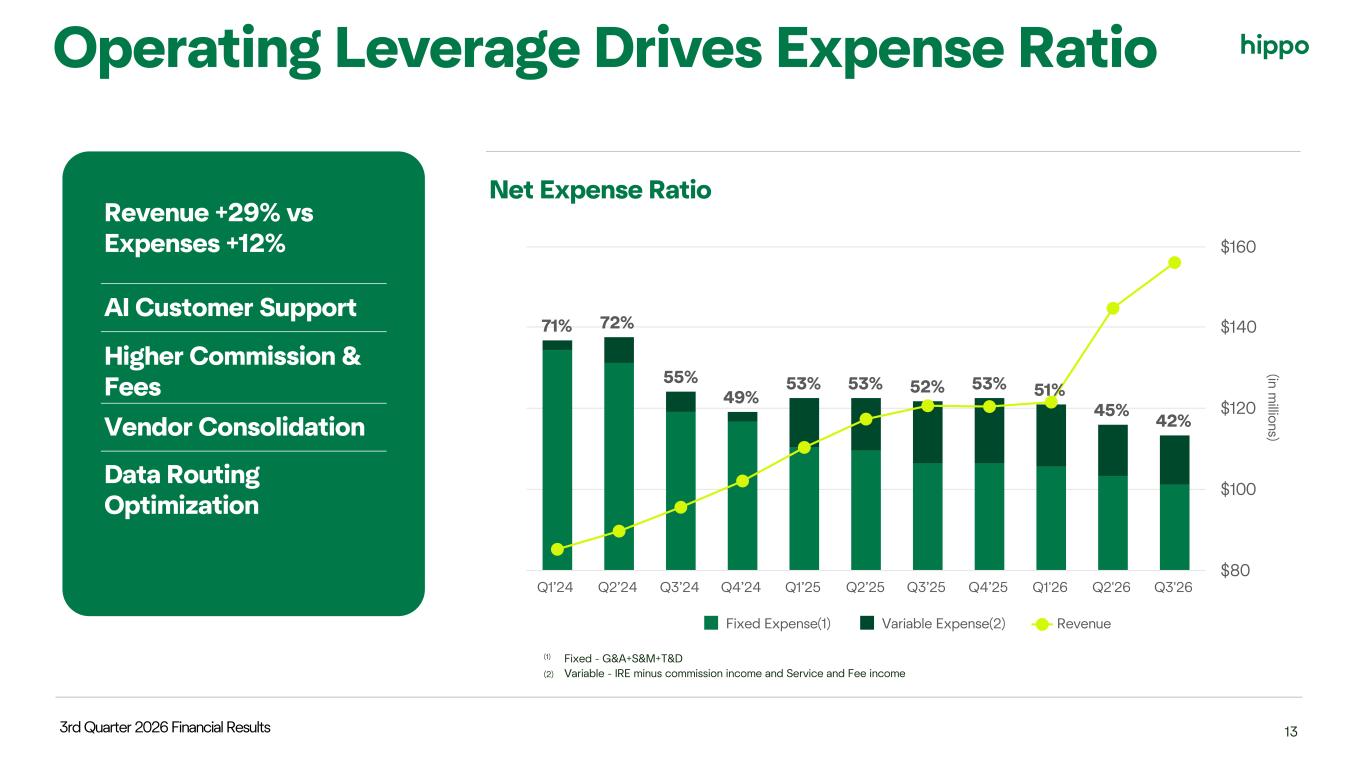
3rd Quarter 2026 Financial Results Operating Leverage Drives Expense Ratio Net Expense Ratio 13 Revenue +29% vs Expenses +12% AI Customer Support Higher Commission & Fees Vendor Consolidation Data Routing Optimization (in m illions) 71% 72% 55% 49% 53% 53% 52% 53% 51% 45% 42% Fixed Expense(1) Variable Expense(2) Revenue Q1’24 Q2’24 Q3’24 Q4’24 Q1’25 Q2’25 Q3’25 Q4’25 Q1'26 Q2'26 Q3'26 $80 $100 $120 $140 $160 (1) Fixed - G&A+S&M+T&D (2) Variable - IRE minus commission income and Service and Fee income
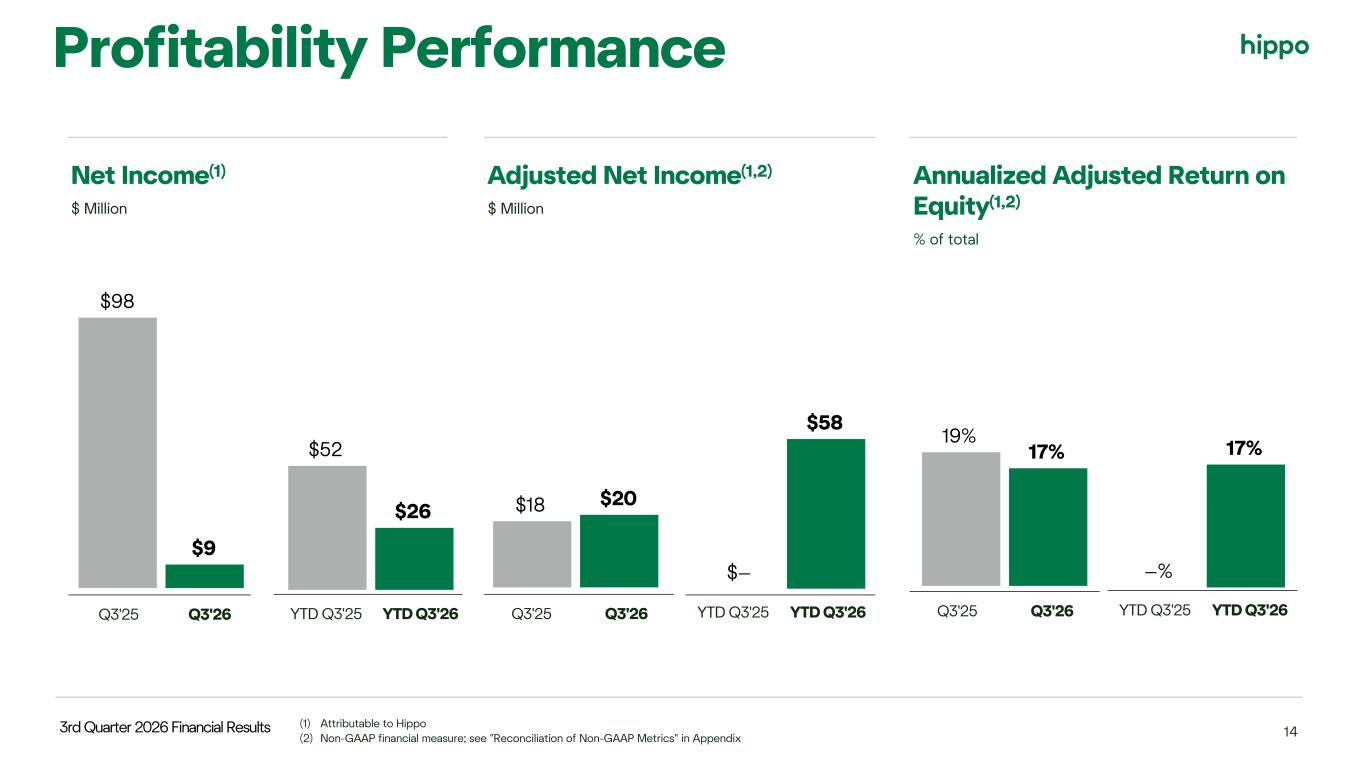
3rd Quarter 2026 Financial Results 14 Profitability Performance Net Income(1) $ Million Adjusted Net Income(1,2) $ Million Annualized Adjusted Return on Equity(1,2) % of total 19% 17% $18 $20 Q3'25 Q3'26 Q3'25 Q3'26Q3'25 Q3'26 $98 $9 (1) Attributable to Hippo (2) Non-GAAP financial measure; see "Reconciliation of Non-GAAP Metrics" in Appendix $52 $26 $— $58 YTD Q3'25 YTD Q3'26 —% 17% YTD Q3'25 YTD Q3'26YTD Q3'25 YTD Q3'26
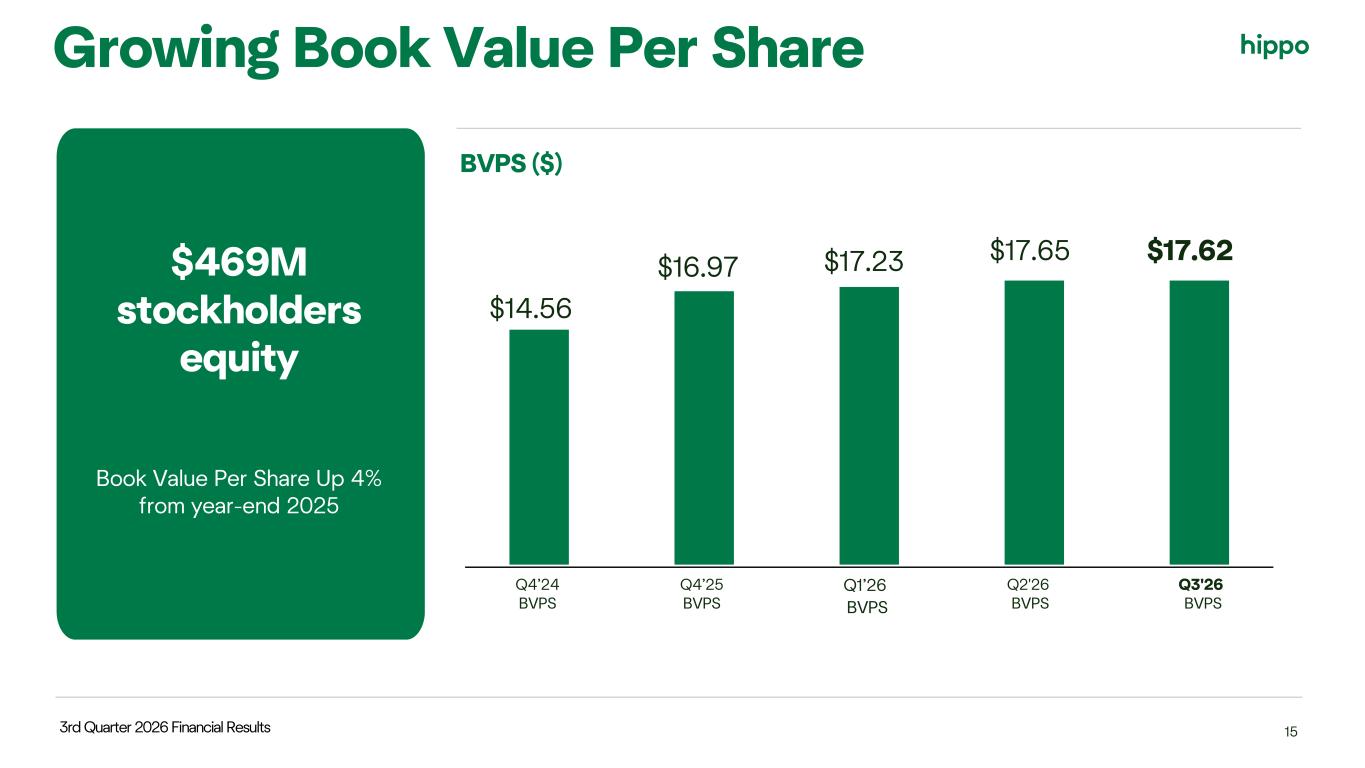
3rd Quarter 2026 Financial Results $469M stockholders equity Book Value Per Share Up 4% from year-end 2025 Growing Book Value Per Share BVPS ($) Q4’24 BVPS Q4’25 BVPS Q1’26 BVPS Q2'26 BVPS Q3'26 BVPS $16.97 $17.62 $14.56 15 $17.23 $17.65
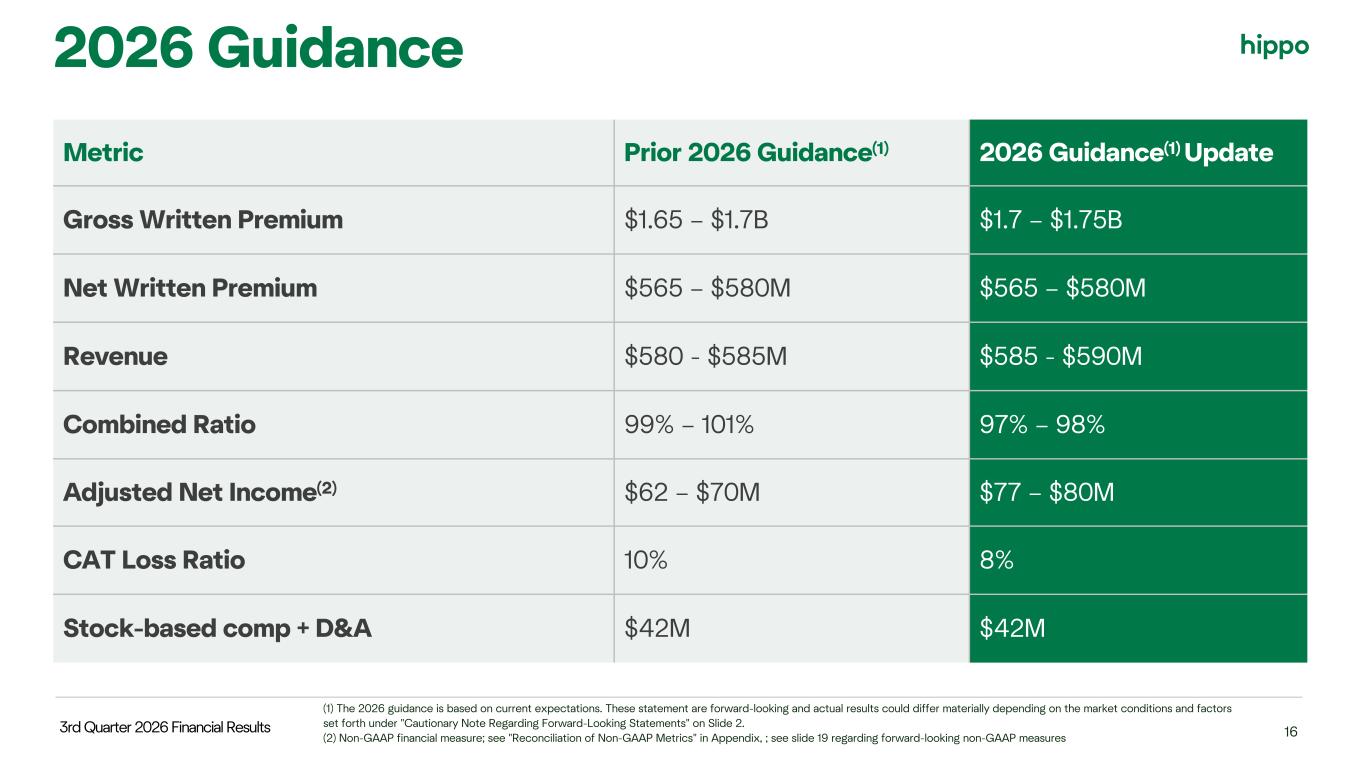
3rd Quarter 2026 Financial Results 16 Metric Prior 2026 Guidance(1) 2026 Guidance(1) Update Gross Written Premium $1.65 – $1.7B $1.7 – $1.75B Net Written Premium $565 – $580M $565 – $580M Revenue $580 - $585M $585 - $590M Combined Ratio 99% – 101% 97% – 98% Adjusted Net Income(2) $62 – $70M $77 – $80M CAT Loss Ratio 10% 8% Stock-based comp + D&A $42M $42M (1) The 2026 guidance is based on current expectations. These statement are forward-looking and actual results could differ materially depending on the market conditions and factors set forth under "Cautionary Note Regarding Forward-Looking Statements" on Slide 2. (2) Non-GAAP financial measure; see "Reconciliation of Non-GAAP Metrics" in Appendix, ; see slide 19 regarding forward-looking non-GAAP measures 2026 Guidance

Q&A
Appendix
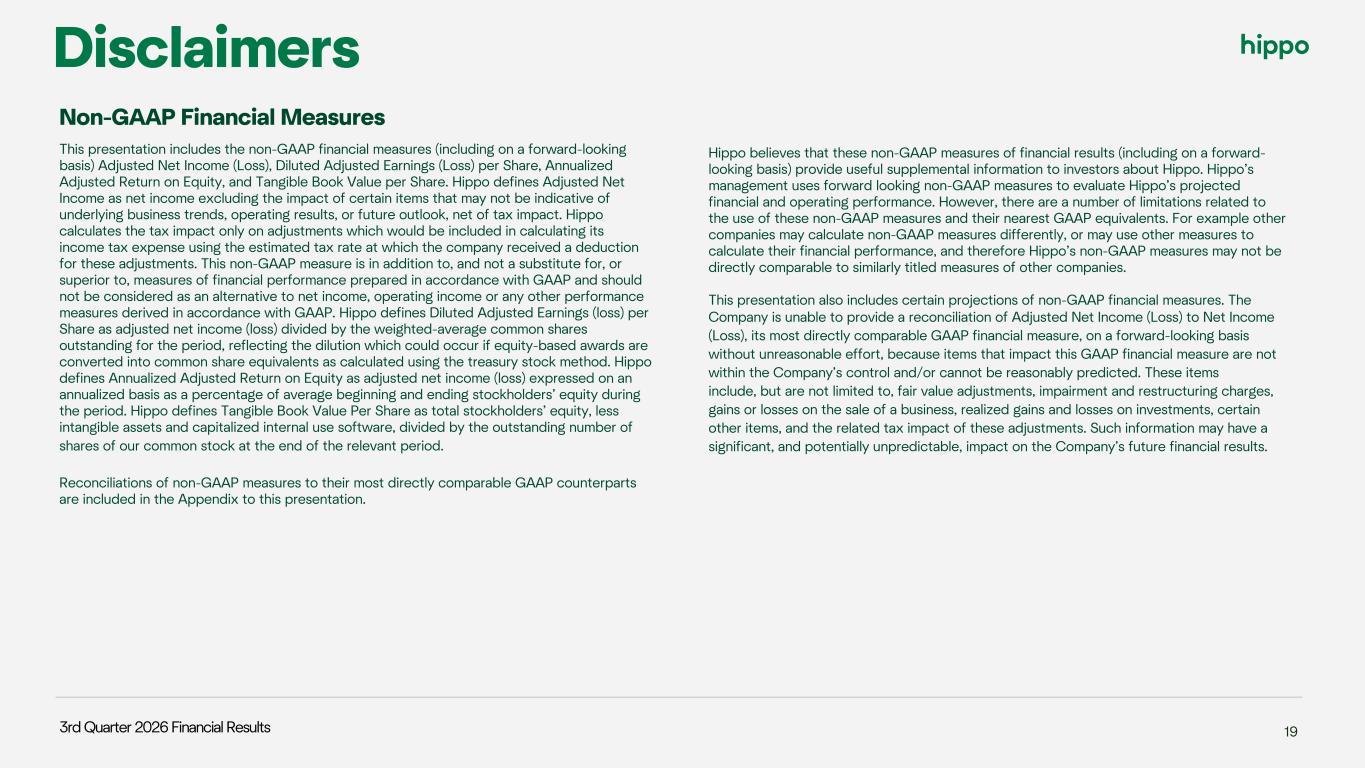
3rd Quarter 2026 Financial Results 19 Disclaimers Non-GAAP Financial Measures This presentation includes the non-GAAP financial measures (including on a forward-looking basis) Adjusted Net Income (Loss), Diluted Adjusted Earnings (Loss) per Share, Annualized Adjusted Return on Equity, and Tangible Book Value per Share. Hippo defines Adjusted Net Income as net income excluding the impact of certain items that may not be indicative of underlying business trends, operating results, or future outlook, net of tax impact. Hippo calculates the tax impact only on adjustments which would be included in calculating its income tax expense using the estimated tax rate at which the company received a deduction for these adjustments. This non-GAAP measure is in addition to, and not a substitute for, or superior to, measures of financial performance prepared in accordance with GAAP and should not be considered as an alternative to net income, operating income or any other performance measures derived in accordance with GAAP. Hippo defines Diluted Adjusted Earnings (loss) per Share as adjusted net income (loss) divided by the weighted-average common shares outstanding for the period, reflecting the dilution which could occur if equity-based awards are converted into common share equivalents as calculated using the treasury stock method. Hippo defines Annualized Adjusted Return on Equity as adjusted net income (loss) expressed on an annualized basis as a percentage of average beginning and ending stockholders’ equity during the period. Hippo defines Tangible Book Value Per Share as total stockholders’ equity, less intangible assets and capitalized internal use software, divided by the outstanding number of shares of our common stock at the end of the relevant period. Reconciliations of non-GAAP measures to their most directly comparable GAAP counterparts are included in the Appendix to this presentation. Hippo believes that these non-GAAP measures of financial results (including on a forward- looking basis) provide useful supplemental information to investors about Hippo. Hippo’s management uses forward looking non-GAAP measures to evaluate Hippo’s projected financial and operating performance. However, there are a number of limitations related to the use of these non-GAAP measures and their nearest GAAP equivalents. For example other companies may calculate non-GAAP measures differently, or may use other measures to calculate their financial performance, and therefore Hippo’s non-GAAP measures may not be directly comparable to similarly titled measures of other companies. This presentation also includes certain projections of non-GAAP financial measures. The Company is unable to provide a reconciliation of Adjusted Net Income (Loss) to Net Income (Loss), its most directly comparable GAAP financial measure, on a forward-looking basis without unreasonable effort, because items that impact this GAAP financial measure are not within the Company’s control and/or cannot be reasonably predicted. These items include, but are not limited to, fair value adjustments, impairment and restructuring charges, gains or losses on the sale of a business, realized gains and losses on investments, certain other items, and the related tax impact of these adjustments. Such information may have a significant, and potentially unpredictable, impact on the Company’s future financial results.
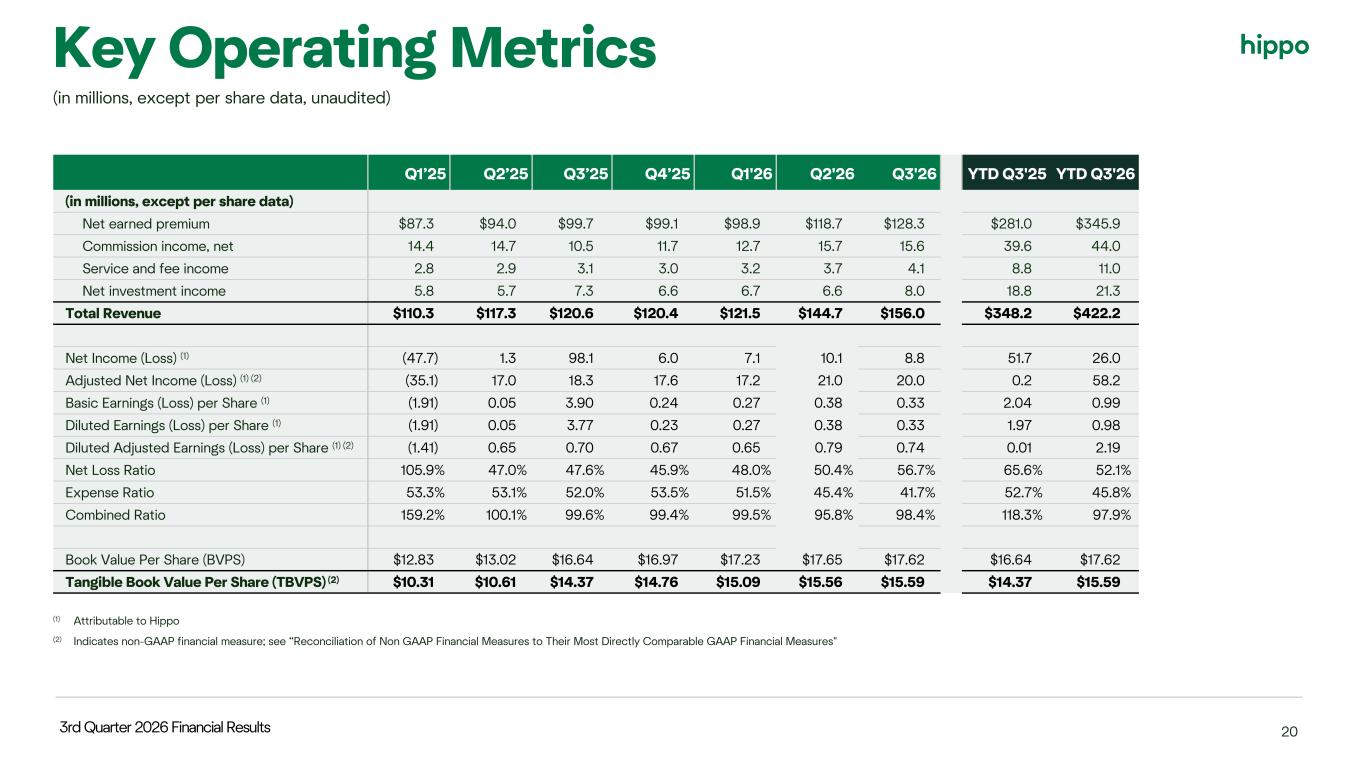
3rd Quarter 2026 Financial Results 20 Key Operating Metrics (in millions, except per share data, unaudited) Q1’25 Q2’25 Q3’25 Q4’25 Q1'26 Q2'26 Q3'26 YTD Q3'25 YTD Q3'26 (in millions, except per share data) Net earned premium $87.3 $94.0 $99.7 $99.1 $98.9 $118.7 $128.3 $281.0 $345.9 Commission income, net 14.4 14.7 10.5 11.7 12.7 15.7 15.6 39.6 44.0 Service and fee income 2.8 2.9 3.1 3.0 3.2 3.7 4.1 8.8 11.0 Net investment income 5.8 5.7 7.3 6.6 6.7 6.6 8.0 18.8 21.3 Total Revenue $110.3 $117.3 $120.6 $120.4 $121.5 $144.7 $156.0 $348.2 $422.2 Net Income (Loss) (1) (47.7) 1.3 98.1 6.0 7.1 10.1 8.8 51.7 26.0 Adjusted Net Income (Loss) (1) (2) (35.1) 17.0 18.3 17.6 17.2 21.0 20.0 0.2 58.2 Basic Earnings (Loss) per Share (1) (1.91) 0.05 3.90 0.24 0.27 0.38 0.33 2.04 0.99 Diluted Earnings (Loss) per Share (1) (1.91) 0.05 3.77 0.23 0.27 0.38 0.33 1.97 0.98 Diluted Adjusted Earnings (Loss) per Share (1) (2) (1.41) 0.65 0.70 0.67 0.65 0.79 0.74 0.01 2.19 Net Loss Ratio 105.9% 47.0% 47.6% 45.9% 48.0% 50.4% 56.7% 65.6% 52.1% Expense Ratio 53.3% 53.1% 52.0% 53.5% 51.5% 45.4% 41.7% 52.7% 45.8% Combined Ratio 159.2% 100.1% 99.6% 99.4% 99.5% 95.8% 98.4% 118.3% 97.9% Book Value Per Share (BVPS) $12.83 $13.02 $16.64 $16.97 $17.23 $17.65 $17.62 $16.64 $17.62 Tangible Book Value Per Share (TBVPS) (2) $10.31 $10.61 $14.37 $14.76 $15.09 $15.56 $15.59 $14.37 $15.59 (1) Attributable to Hippo (2) Indicates non-GAAP financial measure; see “Reconciliation of Non GAAP Financial Measures to Their Most Directly Comparable GAAP Financial Measures"
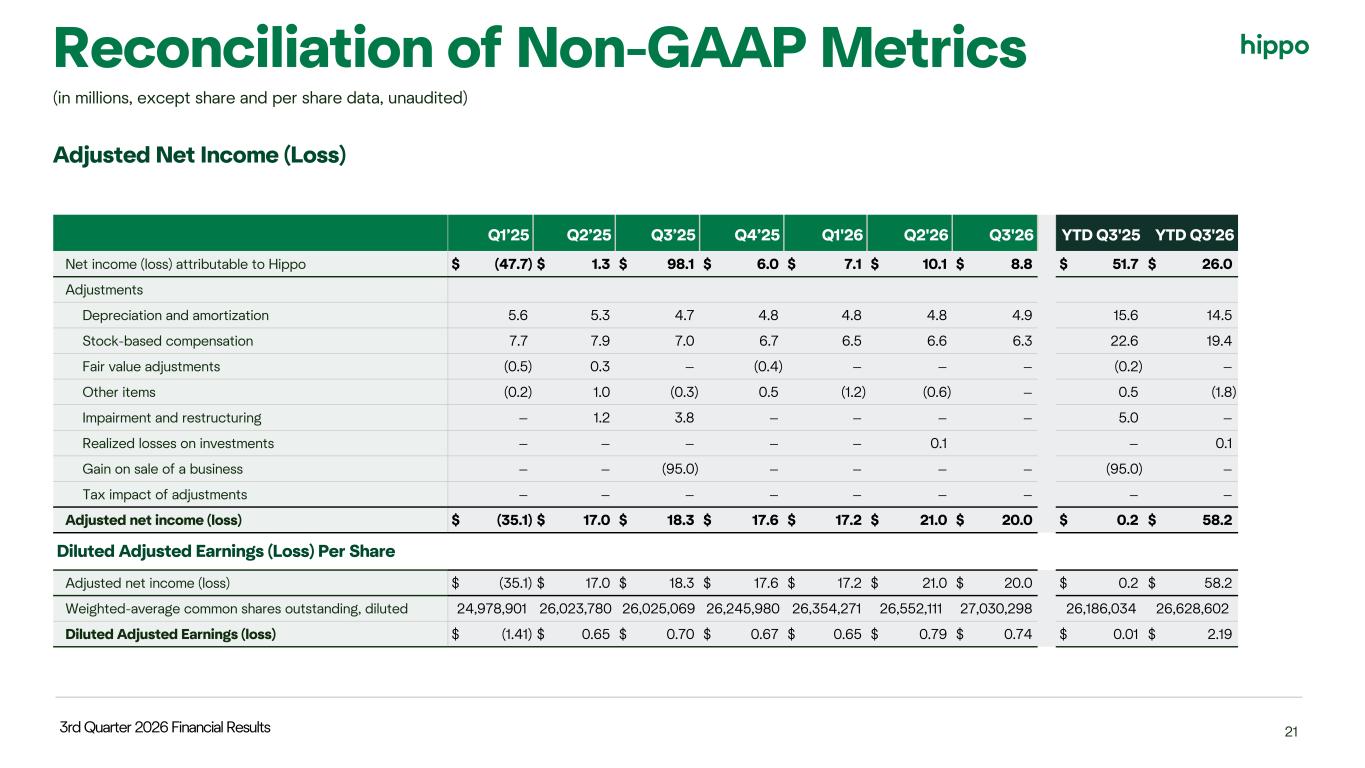
3rd Quarter 2026 Financial Results 21 Reconciliation of Non-GAAP Metrics (in millions, except share and per share data, unaudited) Q1’25 Q2’25 Q3’25 Q4’25 Q1'26 Q2'26 Q3'26 YTD Q3'25 YTD Q3'26 Net income (loss) attributable to Hippo $ (47.7) $ 1.3 $ 98.1 $ 6.0 $ 7.1 $ 10.1 $ 8.8 $ 51.7 $ 26.0 Adjustments Depreciation and amortization 5.6 5.3 4.7 4.8 4.8 4.8 4.9 15.6 14.5 Stock-based compensation 7.7 7.9 7.0 6.7 6.5 6.6 6.3 22.6 19.4 Fair value adjustments (0.5) 0.3 — (0.4) — — — (0.2) — Other items (0.2) 1.0 (0.3) 0.5 (1.2) (0.6) — 0.5 (1.8) Impairment and restructuring — 1.2 3.8 — — — — 5.0 — Realized losses on investments — — — — — 0.1 — 0.1 Gain on sale of a business — — (95.0) — — — — (95.0) — Tax impact of adjustments — — — — — — — — — Adjusted net income (loss) $ (35.1) $ 17.0 $ 18.3 $ 17.6 $ 17.2 $ 21.0 $ 20.0 $ 0.2 $ 58.2 Diluted Adjusted Earnings (Loss) Per Share Adjusted net income (loss) $ (35.1) $ 17.0 $ 18.3 $ 17.6 $ 17.2 $ 21.0 $ 20.0 $ 0.2 $ 58.2 Weighted-average common shares outstanding, diluted 24,978,901 26,023,780 26,025,069 26,245,980 26,354,271 26,552,111 27,030,298 26,186,034 26,628,602 Diluted Adjusted Earnings (loss) $ (1.41) $ 0.65 $ 0.70 $ 0.67 $ 0.65 $ 0.79 $ 0.74 $ 0.01 $ 2.19 Adjusted Net Income (Loss)
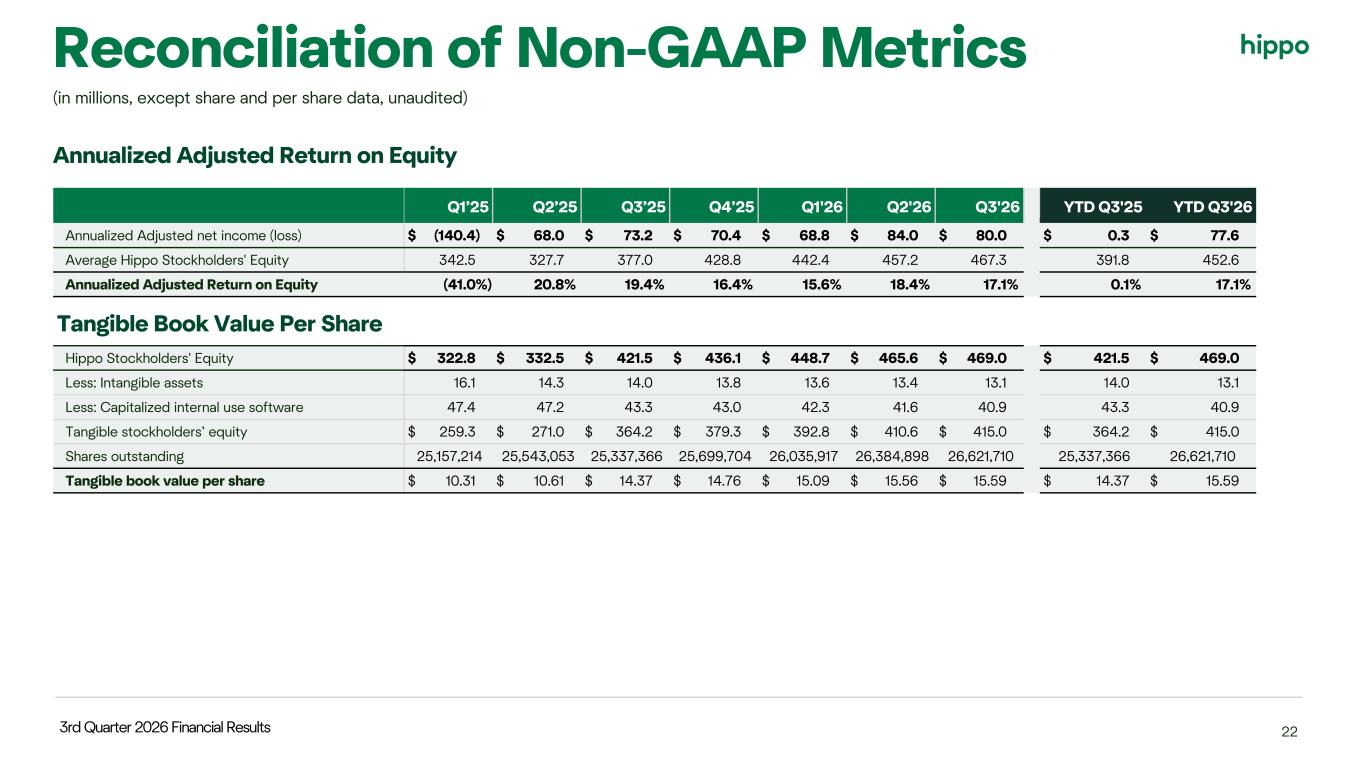
3rd Quarter 2026 Financial Results 22 Reconciliation of Non-GAAP Metrics (in millions, except share and per share data, unaudited) Q1’25 Q2’25 Q3’25 Q4’25 Q1'26 Q2'26 Q3'26 YTD Q3'25 YTD Q3'26 Annualized Adjusted net income (loss) $ (140.4) $ 68.0 $ 73.2 $ 70.4 $ 68.8 $ 84.0 $ 80.0 $ 0.3 $ 77.6 Average Hippo Stockholders' Equity 342.5 327.7 377.0 428.8 442.4 457.2 467.3 391.8 452.6 Annualized Adjusted Return on Equity (41.0%) 20.8% 19.4% 16.4% 15.6% 18.4% 17.1% 0.1% 17.1% Tangible Book Value Per Share Hippo Stockholders' Equity $ 322.8 $ 332.5 $ 421.5 $ 436.1 $ 448.7 $ 465.6 $ 469.0 $ 421.5 $ 469.0 Less: Intangible assets 16.1 14.3 14.0 13.8 13.6 13.4 13.1 14.0 13.1 Less: Capitalized internal use software 47.4 47.2 43.3 43.0 42.3 41.6 40.9 43.3 40.9 Tangible stockholders’ equity $ 259.3 $ 271.0 $ 364.2 $ 379.3 $ 392.8 $ 410.6 $ 415.0 $ 364.2 $ 415.0 Shares outstanding 25,157,214 25,543,053 25,337,366 25,699,704 26,035,917 26,384,898 26,621,710 25,337,366 26,621,710 Tangible book value per share $ 10.31 $ 10.61 $ 14.37 $ 14.76 $ 15.09 $ 15.56 $ 15.59 $ 14.37 $ 15.59 Annualized Adjusted Return on Equity
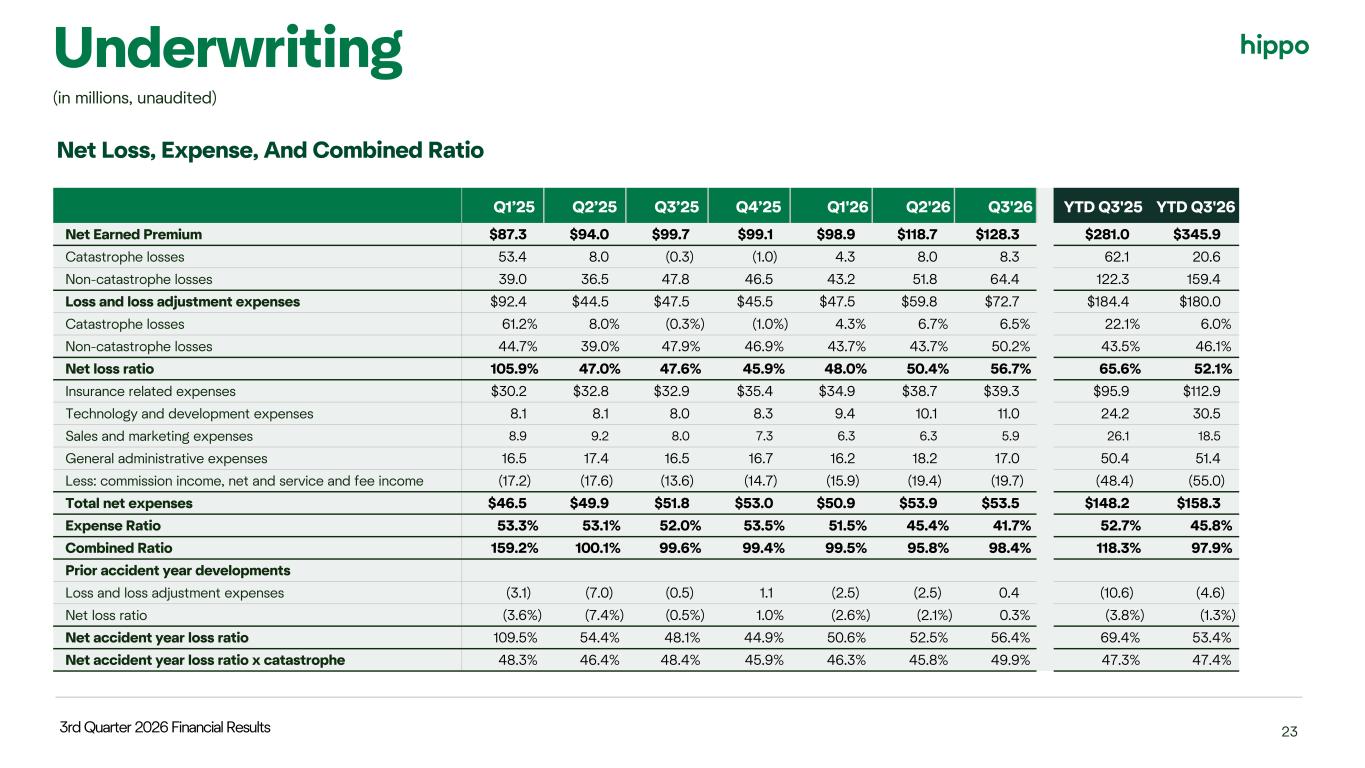
3rd Quarter 2026 Financial Results 23 Underwriting (in millions, unaudited) Q1’25 Q2’25 Q3’25 Q4’25 Q1'26 Q2'26 Q3'26 YTD Q3'25 YTD Q3'26 Net Earned Premium $87.3 $94.0 $99.7 $99.1 $98.9 $118.7 $128.3 $281.0 $345.9 Catastrophe losses 53.4 8.0 (0.3) (1.0) 4.3 8.0 8.3 62.1 20.6 Non-catastrophe losses 39.0 36.5 47.8 46.5 43.2 51.8 64.4 122.3 159.4 Loss and loss adjustment expenses $92.4 $44.5 $47.5 $45.5 $47.5 $59.8 $72.7 $184.4 $180.0 Catastrophe losses 61.2% 8.0% (0.3%) (1.0%) 4.3% 6.7% 6.5% 22.1% 6.0% Non-catastrophe losses 44.7% 39.0% 47.9% 46.9% 43.7% 43.7% 50.2% 43.5% 46.1% Net loss ratio 105.9% 47.0% 47.6% 45.9% 48.0% 50.4% 56.7% 65.6% 52.1% Insurance related expenses $30.2 $32.8 $32.9 $35.4 $34.9 $38.7 $39.3 $95.9 $112.9 Technology and development expenses 8.1 8.1 8.0 8.3 9.4 10.1 11.0 24.2 30.5 Sales and marketing expenses 8.9 9.2 8.0 7.3 6.3 6.3 5.9 26.1 18.5 General administrative expenses 16.5 17.4 16.5 16.7 16.2 18.2 17.0 50.4 51.4 Less: commission income, net and service and fee income (17.2) (17.6) (13.6) (14.7) (15.9) (19.4) (19.7) (48.4) (55.0) Total net expenses $46.5 $49.9 $51.8 $53.0 $50.9 $53.9 $53.5 $148.2 $158.3 Expense Ratio 53.3% 53.1% 52.0% 53.5% 51.5% 45.4% 41.7% 52.7% 45.8% Combined Ratio 159.2% 100.1% 99.6% 99.4% 99.5% 95.8% 98.4% 118.3% 97.9% Prior accident year developments Loss and loss adjustment expenses (3.1) (7.0) (0.5) 1.1 (2.5) (2.5) 0.4 (10.6) (4.6) Net loss ratio (3.6%) (7.4%) (0.5%) 1.0% (2.6%) (2.1%) 0.3% (3.8%) (1.3%) Net accident year loss ratio 109.5% 54.4% 48.1% 44.9% 50.6% 52.5% 56.4% 69.4% 53.4% Net accident year loss ratio x catastrophe 48.3% 46.4% 48.4% 45.9% 46.3% 45.8% 49.9% 47.3% 47.4% Net Loss, Expense, And Combined Ratio
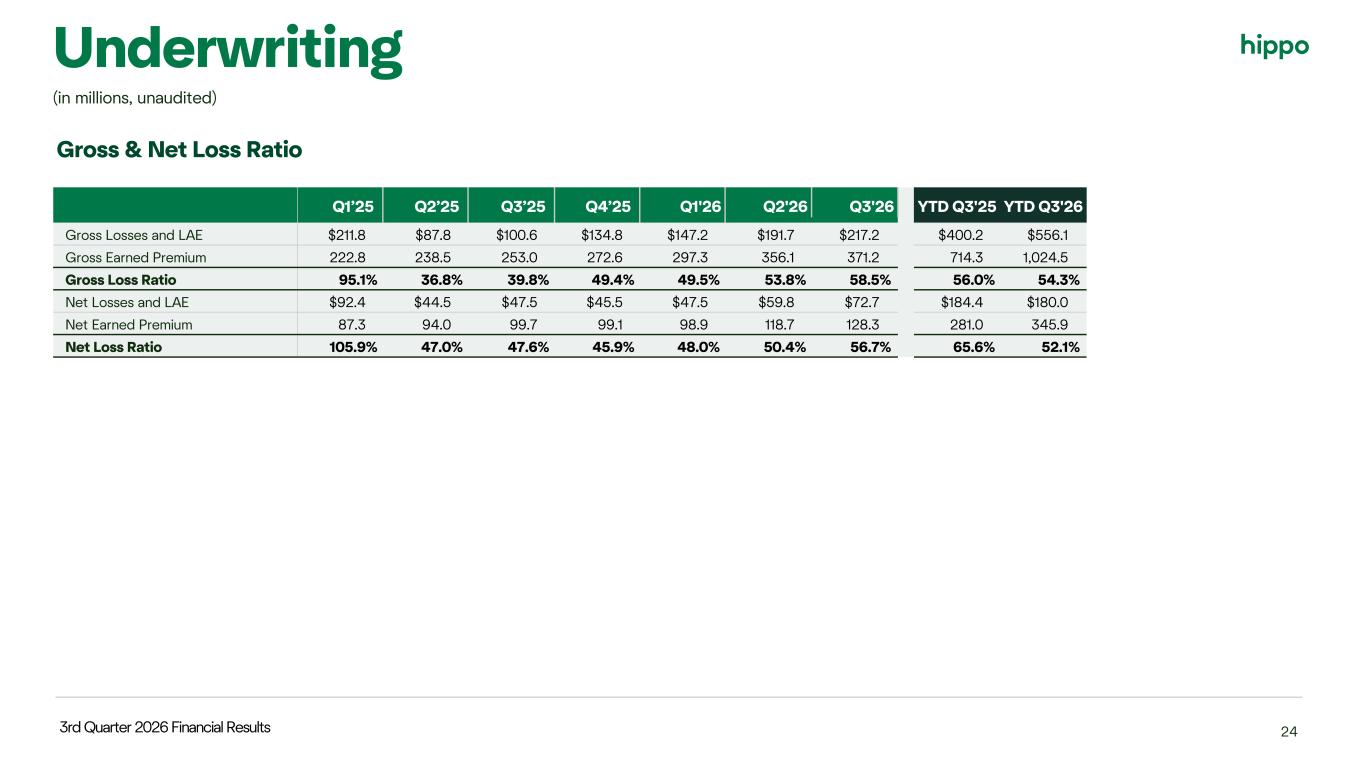
3rd Quarter 2026 Financial Results 24 Underwriting (in millions, unaudited) Q1’25 Q2’25 Q3’25 Q4’25 Q1'26 Q2'26 Q3'26 YTD Q3'25 YTD Q3'26 Gross Losses and LAE $211.8 $87.8 $100.6 $134.8 $147.2 $191.7 $217.2 $400.2 $556.1 Gross Earned Premium 222.8 238.5 253.0 272.6 297.3 356.1 371.2 714.3 1,024.5 Gross Loss Ratio 95.1% 36.8% 39.8% 49.4% 49.5% 53.8% 58.5% 56.0% 54.3% Net Losses and LAE $92.4 $44.5 $47.5 $45.5 $47.5 $59.8 $72.7 $184.4 $180.0 Net Earned Premium 87.3 94.0 99.7 99.1 98.9 118.7 128.3 281.0 345.9 Net Loss Ratio 105.9% 47.0% 47.6% 45.9% 48.0% 50.4% 56.7% 65.6% 52.1% Gross & Net Loss Ratio
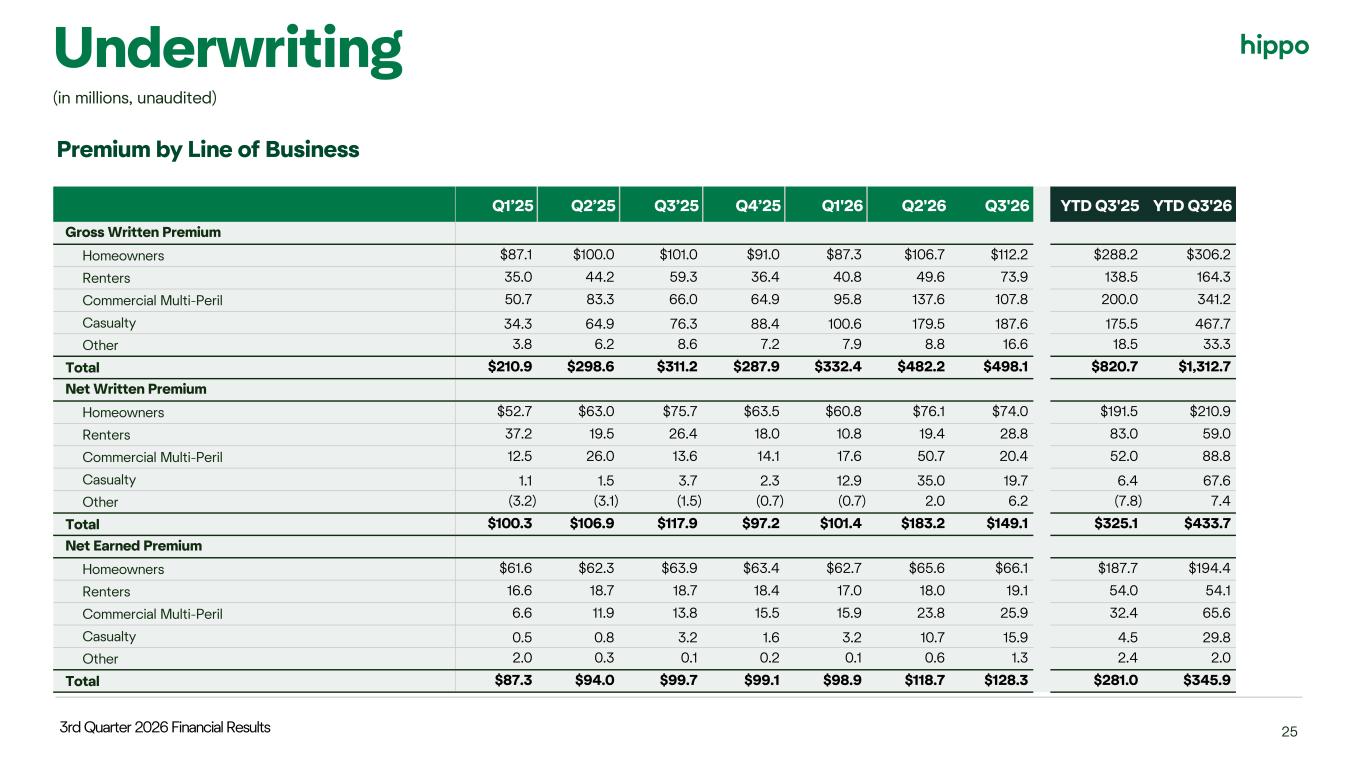
3rd Quarter 2026 Financial Results 25 Q1’25 Q2’25 Q3’25 Q4’25 Q1'26 Q2'26 Q3'26 YTD Q3'25 YTD Q3'26 Gross Written Premium Homeowners $87.1 $100.0 $101.0 $91.0 $87.3 $106.7 $112.2 $288.2 $306.2 Renters 35.0 44.2 59.3 36.4 40.8 49.6 73.9 138.5 164.3 Commercial Multi-Peril 50.7 83.3 66.0 64.9 95.8 137.6 107.8 200.0 341.2 Casualty 34.3 64.9 76.3 88.4 100.6 179.5 187.6 175.5 467.7 Other 3.8 6.2 8.6 7.2 7.9 8.8 16.6 18.5 33.3 Total $210.9 $298.6 $311.2 $287.9 $332.4 $482.2 $498.1 $820.7 $1,312.7 Net Written Premium Homeowners $52.7 $63.0 $75.7 $63.5 $60.8 $76.1 $74.0 $191.5 $210.9 Renters 37.2 19.5 26.4 18.0 10.8 19.4 28.8 83.0 59.0 Commercial Multi-Peril 12.5 26.0 13.6 14.1 17.6 50.7 20.4 52.0 88.8 Casualty 1.1 1.5 3.7 2.3 12.9 35.0 19.7 6.4 67.6 Other (3.2) (3.1) (1.5) (0.7) (0.7) 2.0 6.2 (7.8) 7.4 Total $100.3 $106.9 $117.9 $97.2 $101.4 $183.2 $149.1 $325.1 $433.7 Net Earned Premium Homeowners $61.6 $62.3 $63.9 $63.4 $62.7 $65.6 $66.1 $187.7 $194.4 Renters 16.6 18.7 18.7 18.4 17.0 18.0 19.1 54.0 54.1 Commercial Multi-Peril 6.6 11.9 13.8 15.5 15.9 23.8 25.9 32.4 65.6 Casualty 0.5 0.8 3.2 1.6 3.2 10.7 15.9 4.5 29.8 Other 2.0 0.3 0.1 0.2 0.1 0.6 1.3 2.4 2.0 Total $87.3 $94.0 $99.7 $99.1 $98.9 $118.7 $128.3 $281.0 $345.9 Premium by Line of Business Underwriting (in millions, unaudited)

Contact Information Charles Sebaski Head of Investor Relations IR@hippo.com