
Exhibit 99.3 October 30, 2026 UNIFI, Inc. First Quarter Fiscal 2027 Earnings Conference Call (Unaudited results) (Amounts and dollars in millions, unless otherwise noted)
Cautionary Statements Forward-Looking Statements Certain statements included herein contain “forward-looking statements” within the meaning of federal securities laws about the financial condition and results of operations of the Company that are based on management’s beliefs, assumptions, and expectations about our future economic performance, considering the information currently available to management. An example of such forward-looking statements include, among others, guidance pertaining to our financial outlook. The words “believe,” “may,” “could,” “will,” “should,” “would,” “anticipate,” “plan,” “estimate,” “project,” “expect,” “intend,” “seek,” “strive,” and words of similar import, or the negative of such words, identify or signal the presence of forward-looking statements. These statements are not statements of historical fact, and they involve risks and uncertainties that may cause our actual results, performance, or financial condition to differ materially from the expectations of future results, performance, or financial condition that we express or imply in any forward-looking statement. Factors that could contribute to such differences include, but are not limited to: the competitive nature of the textile industry and the impact of global competition; changes in the trade regulatory environment and governmental policies and legislation; the availability, sourcing, and pricing of raw materials; general domestic and international economic and industry conditions in markets where the Company competes, including economic and political factors over which the Company has no control; changes in consumer spending, customer preferences, fashion trends, and end-uses for UNIFI’s products; the financial condition of the Company’s customers; the loss of a significant customer or brand partner; natural disasters, industrial accidents, power or water shortages; extreme weather conditions, and other disruptions at one of our facilities; the disruption of operations, global demand, or financial performance as a result of catastrophic or extraordinary events, including, but not limited to, epidemics or pandemics; the success of the Company’s strategic business initiatives; the volatility of financial and credit markets, including the impacts of counterparty risk (e.g., deposit concentration and recent depositor sentiment and activity); the ability to service indebtedness and fund capital expenditures and strategic business initiatives; the availability of and access to credit on reasonable terms; changes in foreign currency exchange, interest, and inflation rates; fluctuations in production costs; the ability to protect intellectual property; the strength and reputation of our brands; employee relations; the ability to attract, retain, and motivate key employees; the impact of climate change or environmental, health, and safety regulations; and the impact of tax laws, the judicial or administrative interpretations of tax laws, and/or changes in such laws or interpretations. All such factors are difficult to predict, contain uncertainties that may materially affect actual results, and may be beyond our control. New factors emerge from time to time, and it is not possible for management to predict all such factors or to assess the impact of each such factor on the Company. Any forward-looking statement speaks only as of the date on which such statement is made, and we do not undertake any obligation to update any forward-looking statement to reflect events or circumstances after the date on which such statement is made, except as may be required by federal securities laws. The above and other risks and uncertainties are described in the Company’s most recent Annual Report on Form 10-K, and additional risks or uncertainties may be described from time to time in other reports filed by the Company with the Securities and Exchange Commission pursuant to the Securities Exchange Act of 1934, as amended. Non-GAAP Financial Measures Certain non-GAAP financial measures are designed to complement the financial information presented in accordance with GAAP. These non-GAAP financial measures include Earnings Before Interest, Taxes, Depreciation, and Amortization (“EBITDA”), Adjusted EBITDA, Adjusted Net (Loss) Income, Adjusted EPS, Adjusted Working Capital, and Net Debt (collectively, the “non-GAAP financial measures”). The non-GAAP financial measures are not determined in accordance with GAAP and should not be considered a substitute for performance measures determined in accordance with GAAP. The calculations of the non-GAAP financial measures are subjective, based on management’s belief as to which items should be included or excluded in order to provide the most reasonable and comparable view of the underlying operating performance of the business. The Company may, from time to time, modify the amounts used to determine its non-GAAP financial measures. We believe that these non-GAAP financial measures better reflect the Company’s underlying operations and performance and that their use, as operating performance measures, provides investors and analysts with a measure of operating results unaffected by differences in capital structures, capital investment cycles, and ages of related assets, among otherwise comparable companies. In evaluating non-GAAP financial measures, investors should be aware that, in the future, we may incur expenses similar to the adjustments included herein. Our presentation of non-GAAP financial measures should not be construed as indicating that our future results will be unaffected by unusual or non-recurring items. Each of our non-GAAP financial measures has limitations as an analytical tool, and you should not consider it in isolation or as a substitute for analysis of our results or liquidity measures as reported under GAAP. Some of these limitations are (i) it is not adjusted for all non-cash income or expense items that are reflected in our statements of cash flows; (ii) it does not reflect the impact of earnings or charges resulting from matters we consider not indicative of our ongoing operations; (iii) it does not reflect changes in, or cash requirements for, our working capital needs; (iv) it does not reflect the cash requirements necessary to make payments on our debt; (v) it does not reflect our future requirements for capital expenditures or contractual commitments; (vi) it does not reflect limitations on or costs related to transferring earnings from our subsidiaries to us; and (vii) other companies in our industry may calculate this measure differently than we do, limiting its usefulness as a comparative measure. Because of these limitations, these non-GAAP financial measures should not be considered as a measure of discretionary cash available to us to invest in the growth of our business or as a measure of cash that will be available to us to meet our obligations, including those under our outstanding debt obligations. You should compensate for these limitations by relying primarily on our GAAP results and using these measures only as supplemental information.

Today’s Speakers Al Carey Executive Chairman Eddie Ingle CEO and Director A.J. Eaker EVP, CFO, and Treasurer
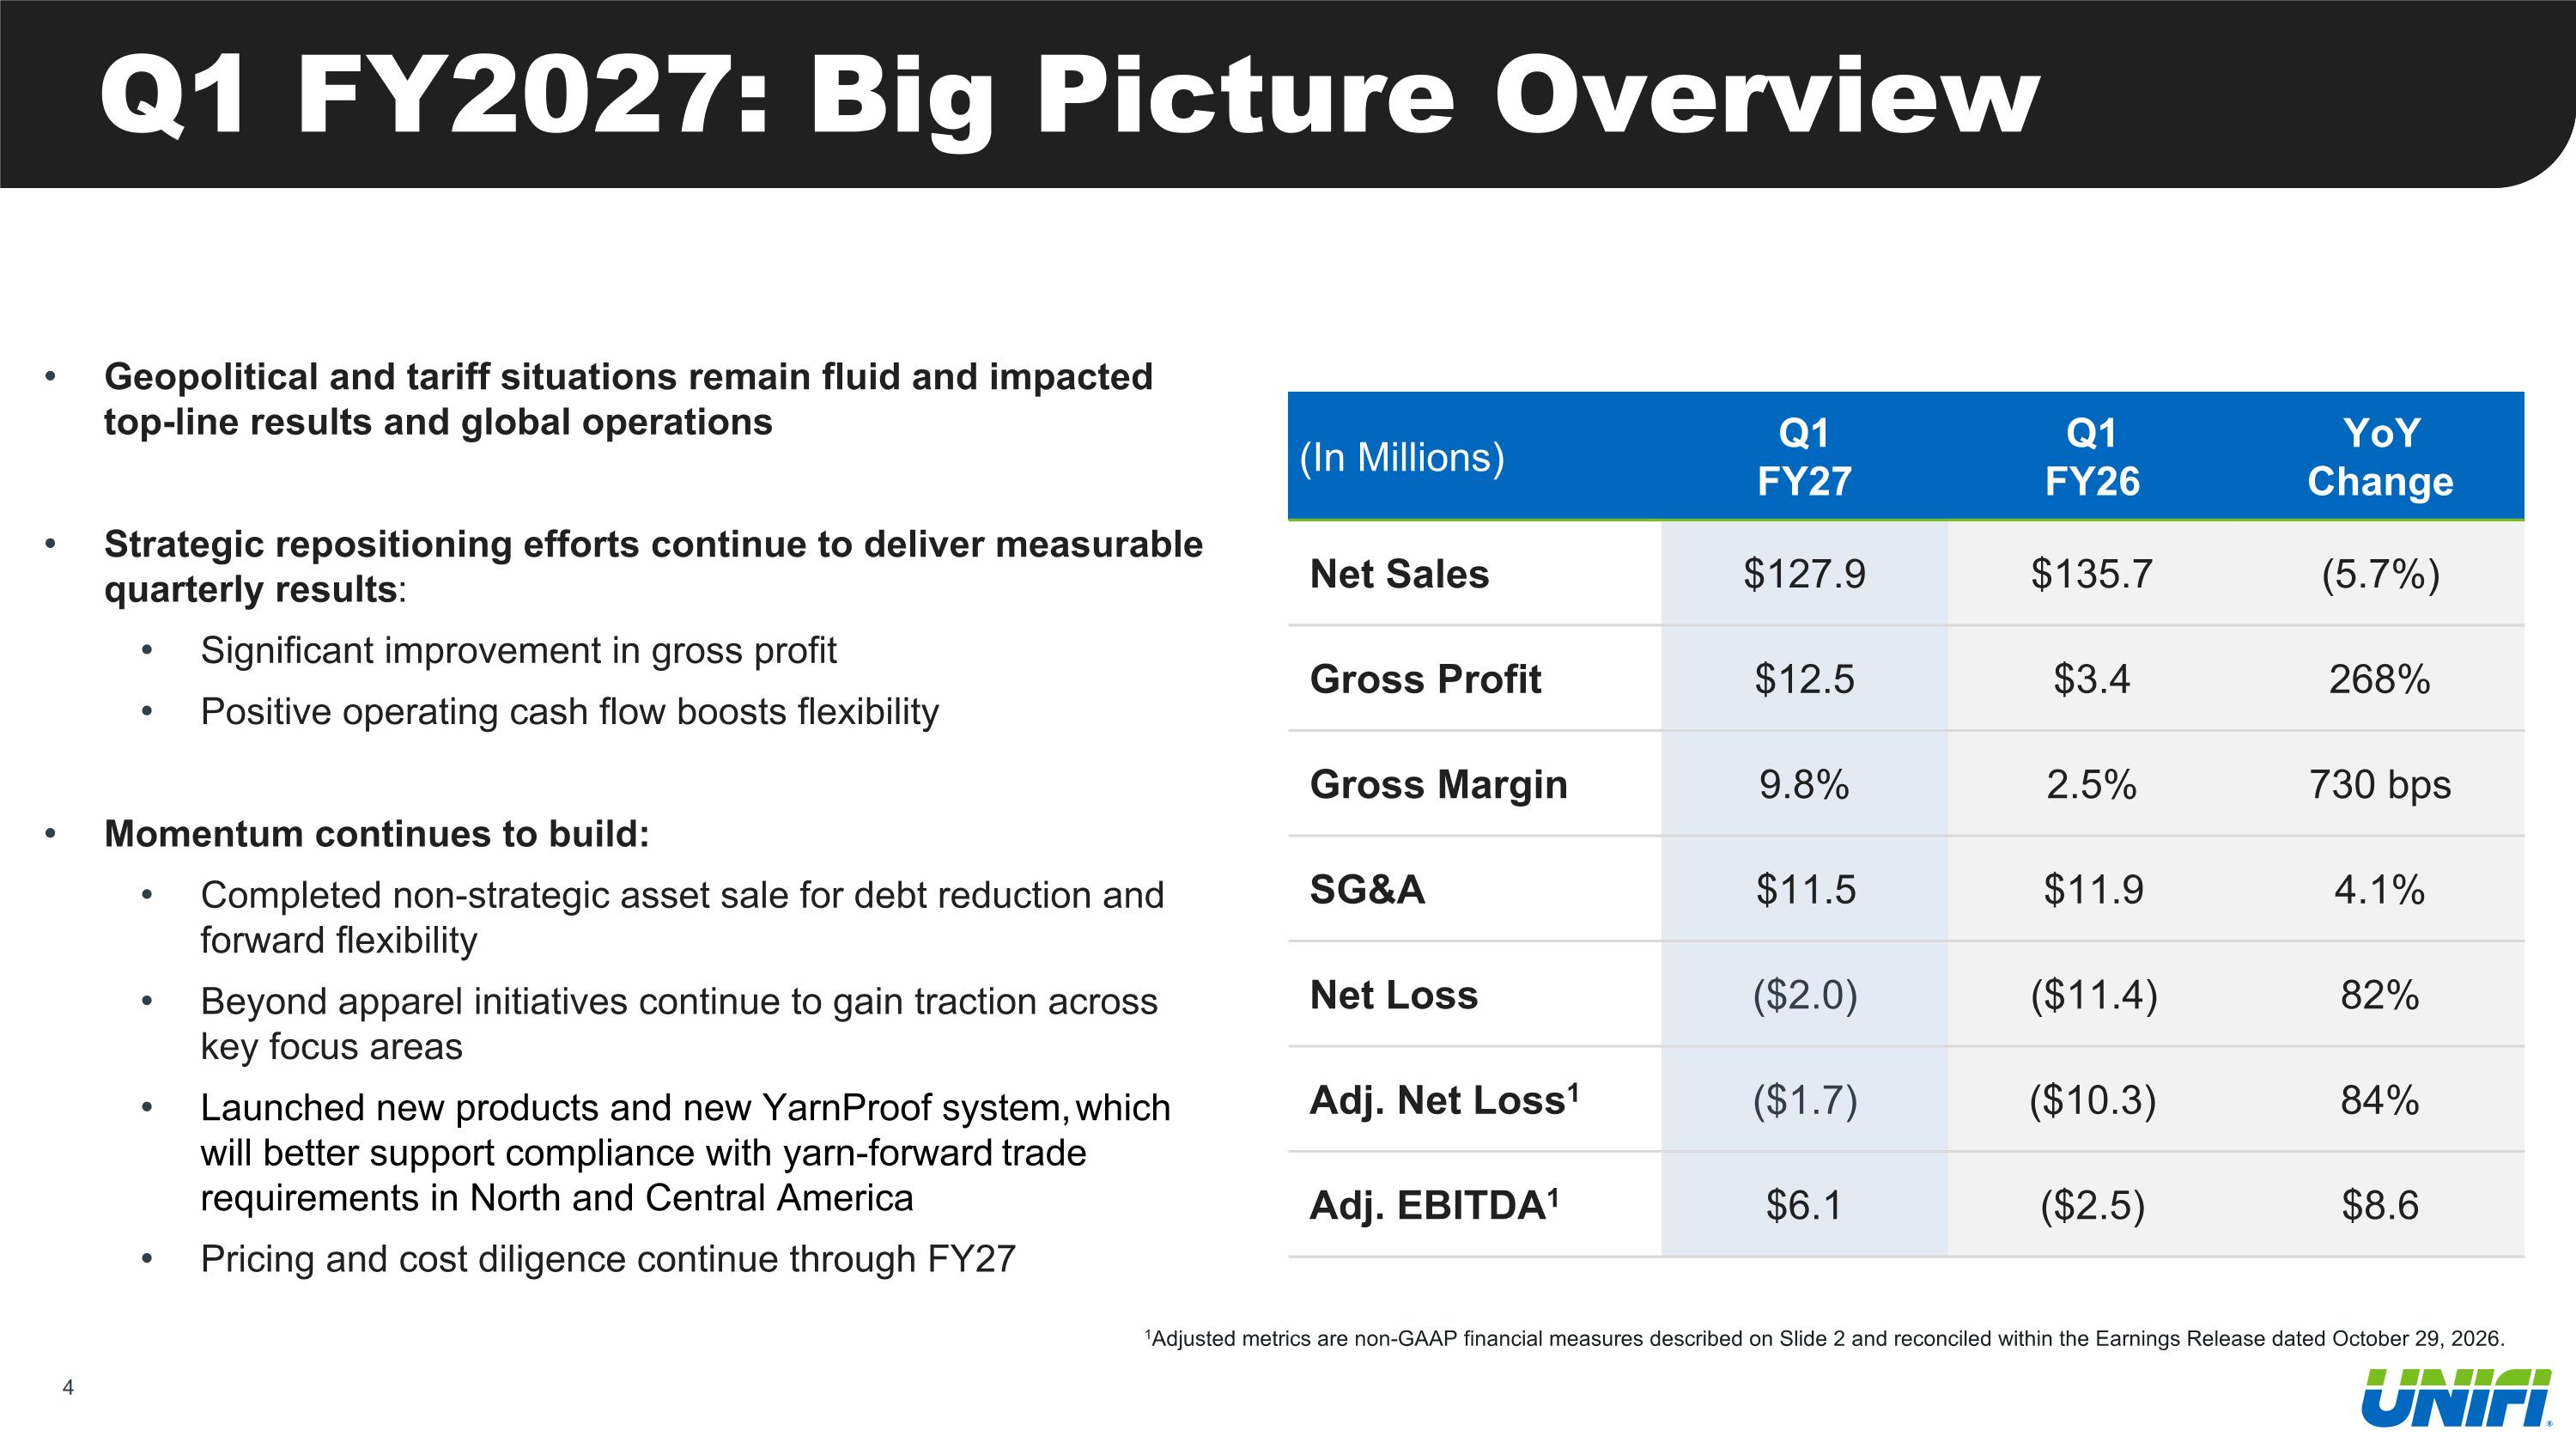
Q1 FY2027: Big Picture Overview Geopolitical and tariff situations remain fluid and impacted top-line results and global operations Strategic repositioning efforts continue to deliver measurable quarterly results: Significant improvement in gross profit Positive operating cash flow boosts flexibility Momentum continues to build: Completed non-strategic asset sale for debt reduction and forward flexibility Beyond apparel initiatives continue to gain traction across key focus areas Launched new products and new YarnProof system, which will better support compliance with yarn-forward trade requirements in North and Central America Pricing and cost diligence continue through FY27 1Adjusted metrics are non-GAAP financial measures described on Slide 2 and reconciled within the Earnings Release dated October 29, 2026. (In Millions) Q1 FY27 Q1 FY26 YoY Change Net Sales $127.9 $135.7 (5.7%) Gross Profit $12.5 $3.4 268% Gross Margin 9.8% 2.5% 730 bps SG&A $11.5 $11.9 4.1% Net Loss ($2.0) ($11.4) 82% Adj. Net Loss1 ($1.7) ($10.3) 84% Adj. EBITDA1 $6.1 ($2.5) $8.6
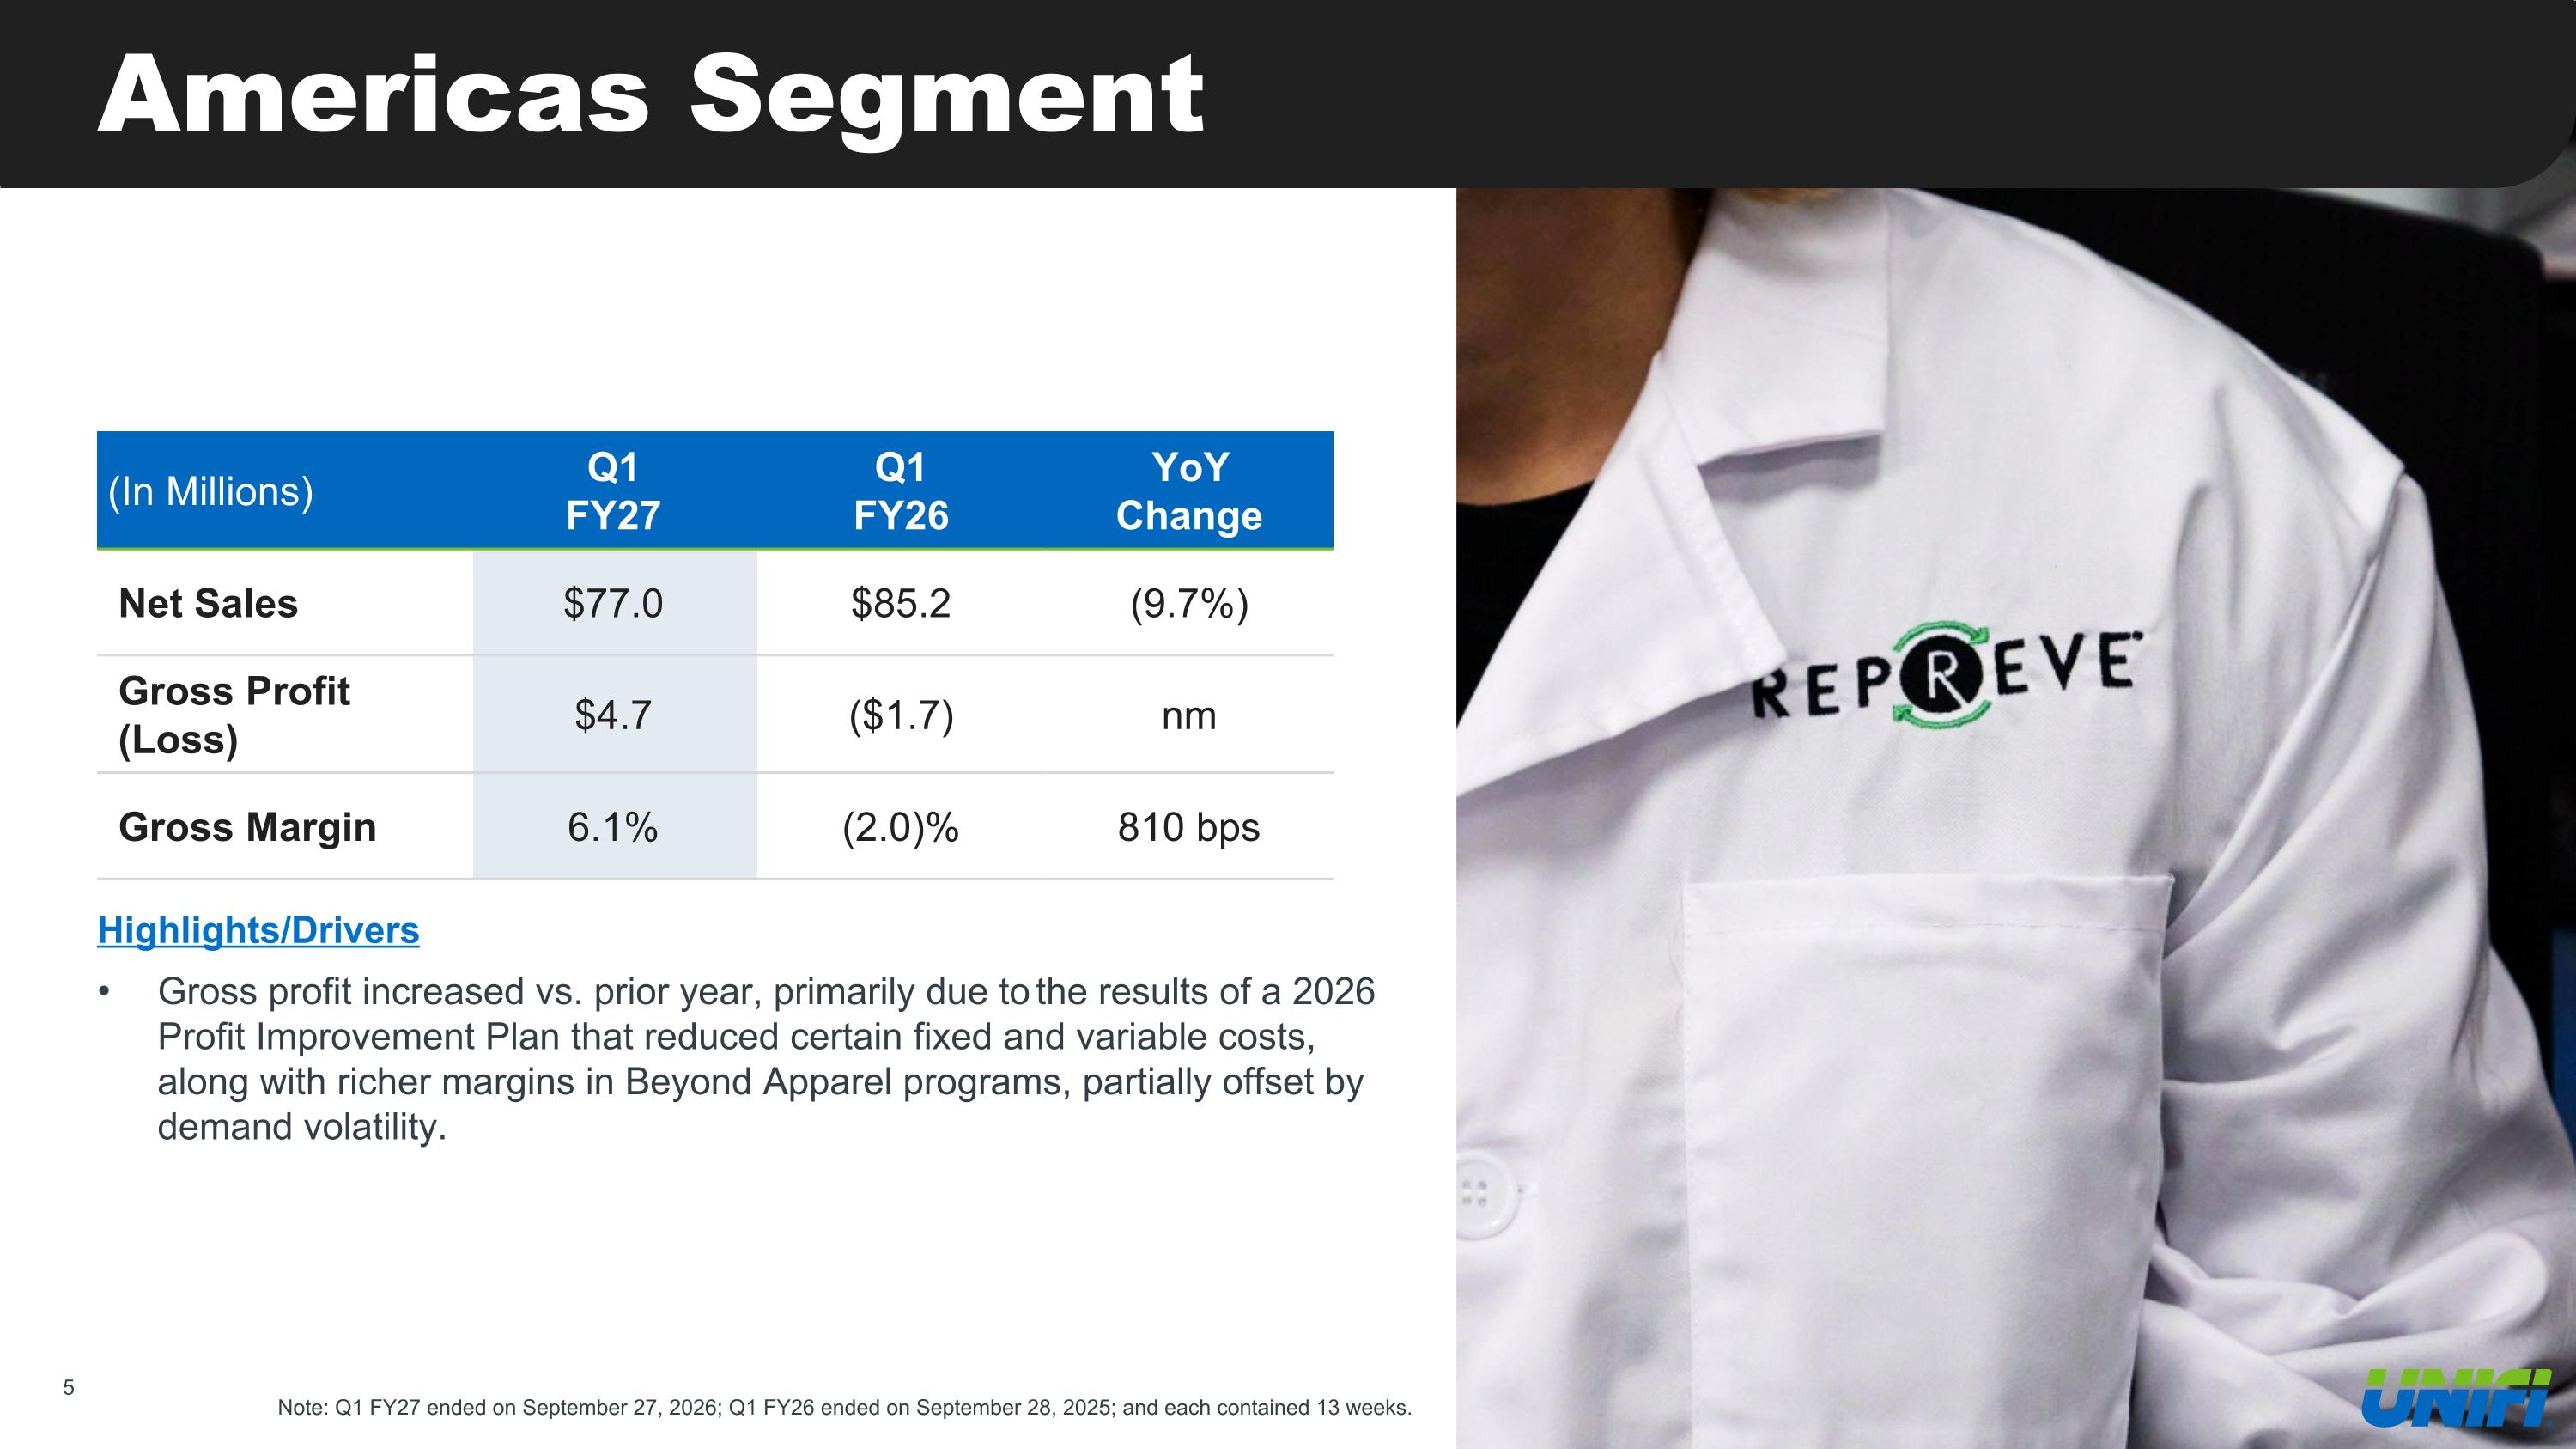
Americas Segment Note: Q1 FY27 ended on September 27, 2026; Q1 FY26 ended on September 28, 2025; and each contained 13 weeks. (In Millions) Q1 FY27 Q1 FY26 YoY Change Net Sales $77.0 $85.2 (9.7%) Gross Profit (Loss) $4.7 ($1.7) nm Gross Margin 6.1% (2.0)% 810 bps Highlights/Drivers Gross profit increased vs. prior year, primarily due to the results of a 2026 Profit Improvement Plan that reduced certain fixed and variable costs, along with richer margins in Beyond Apparel programs, partially offset by demand volatility.
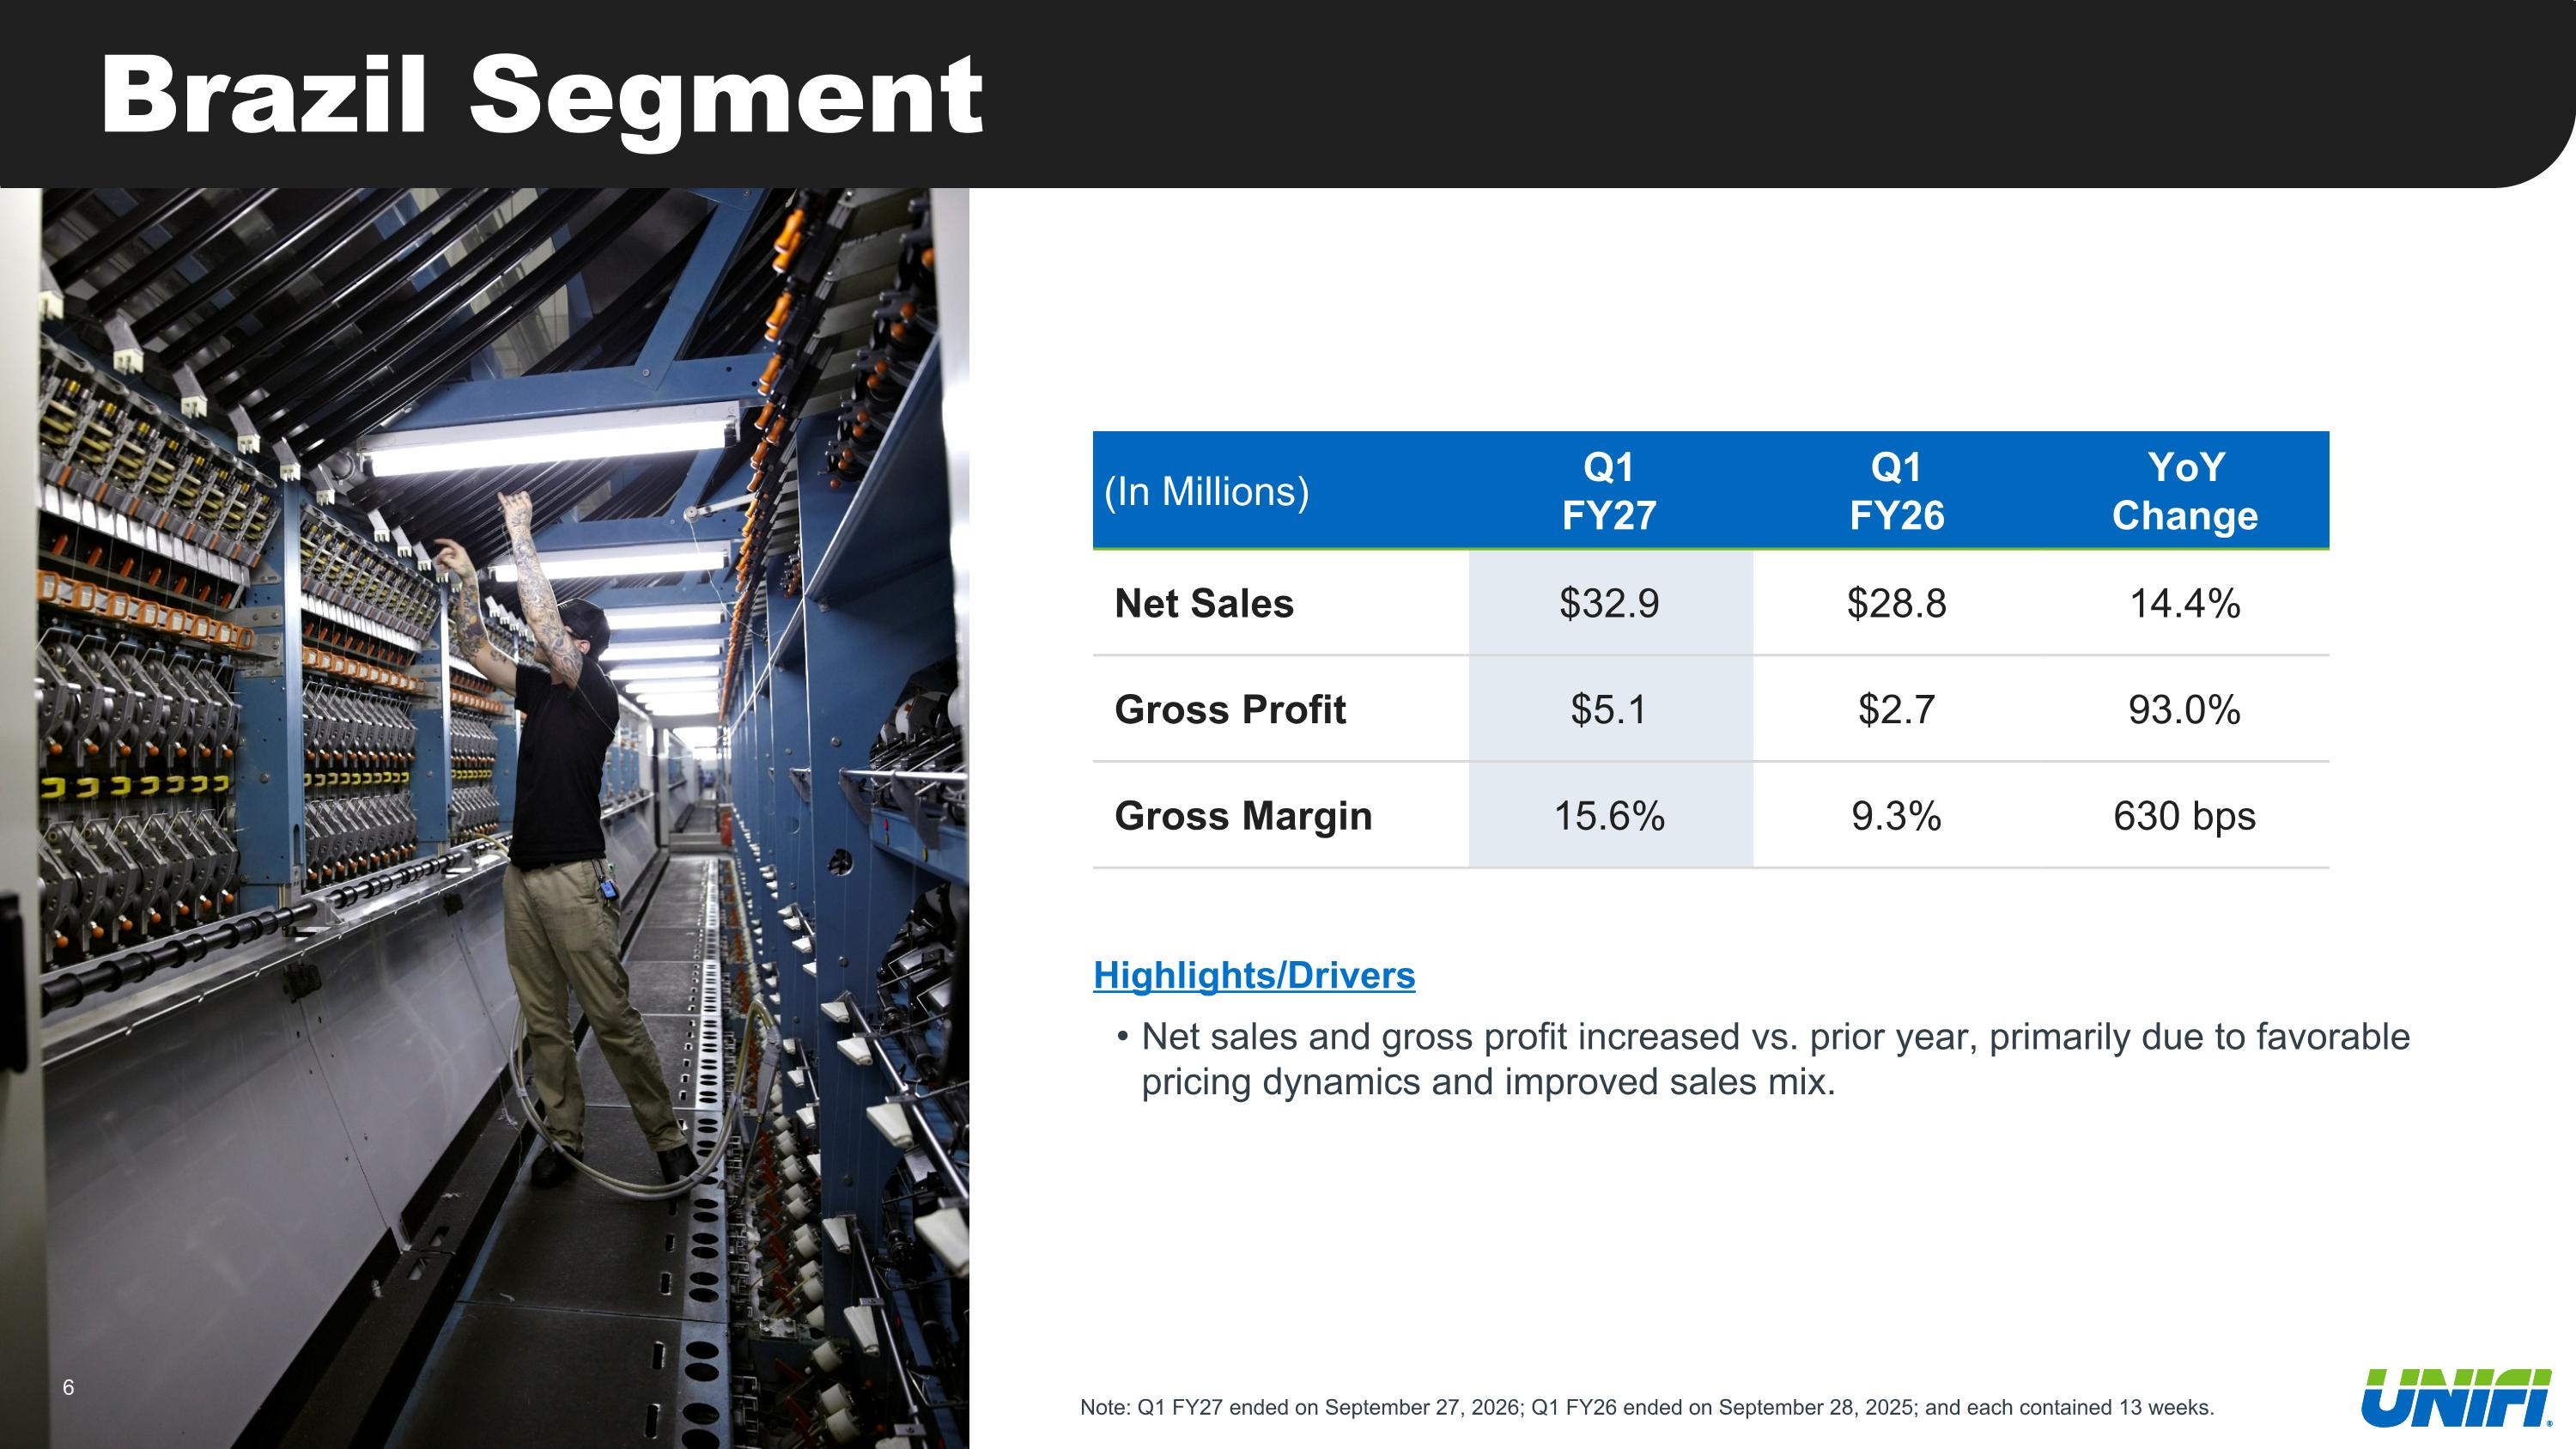
Brazil Segment (In Millions) Q1 FY27 Q1 FY26 YoY Change Net Sales $32.9 $28.8 14.4% Gross Profit $5.1 $2.7 93.0% Gross Margin 15.6% 9.3% 630 bps Highlights/Drivers Net sales and gross profit increased vs. prior year, primarily due to favorable pricing dynamics and improved sales mix. Note: Q1 FY27 ended on September 27, 2026; Q1 FY26 ended on September 28, 2025; and each contained 13 weeks.
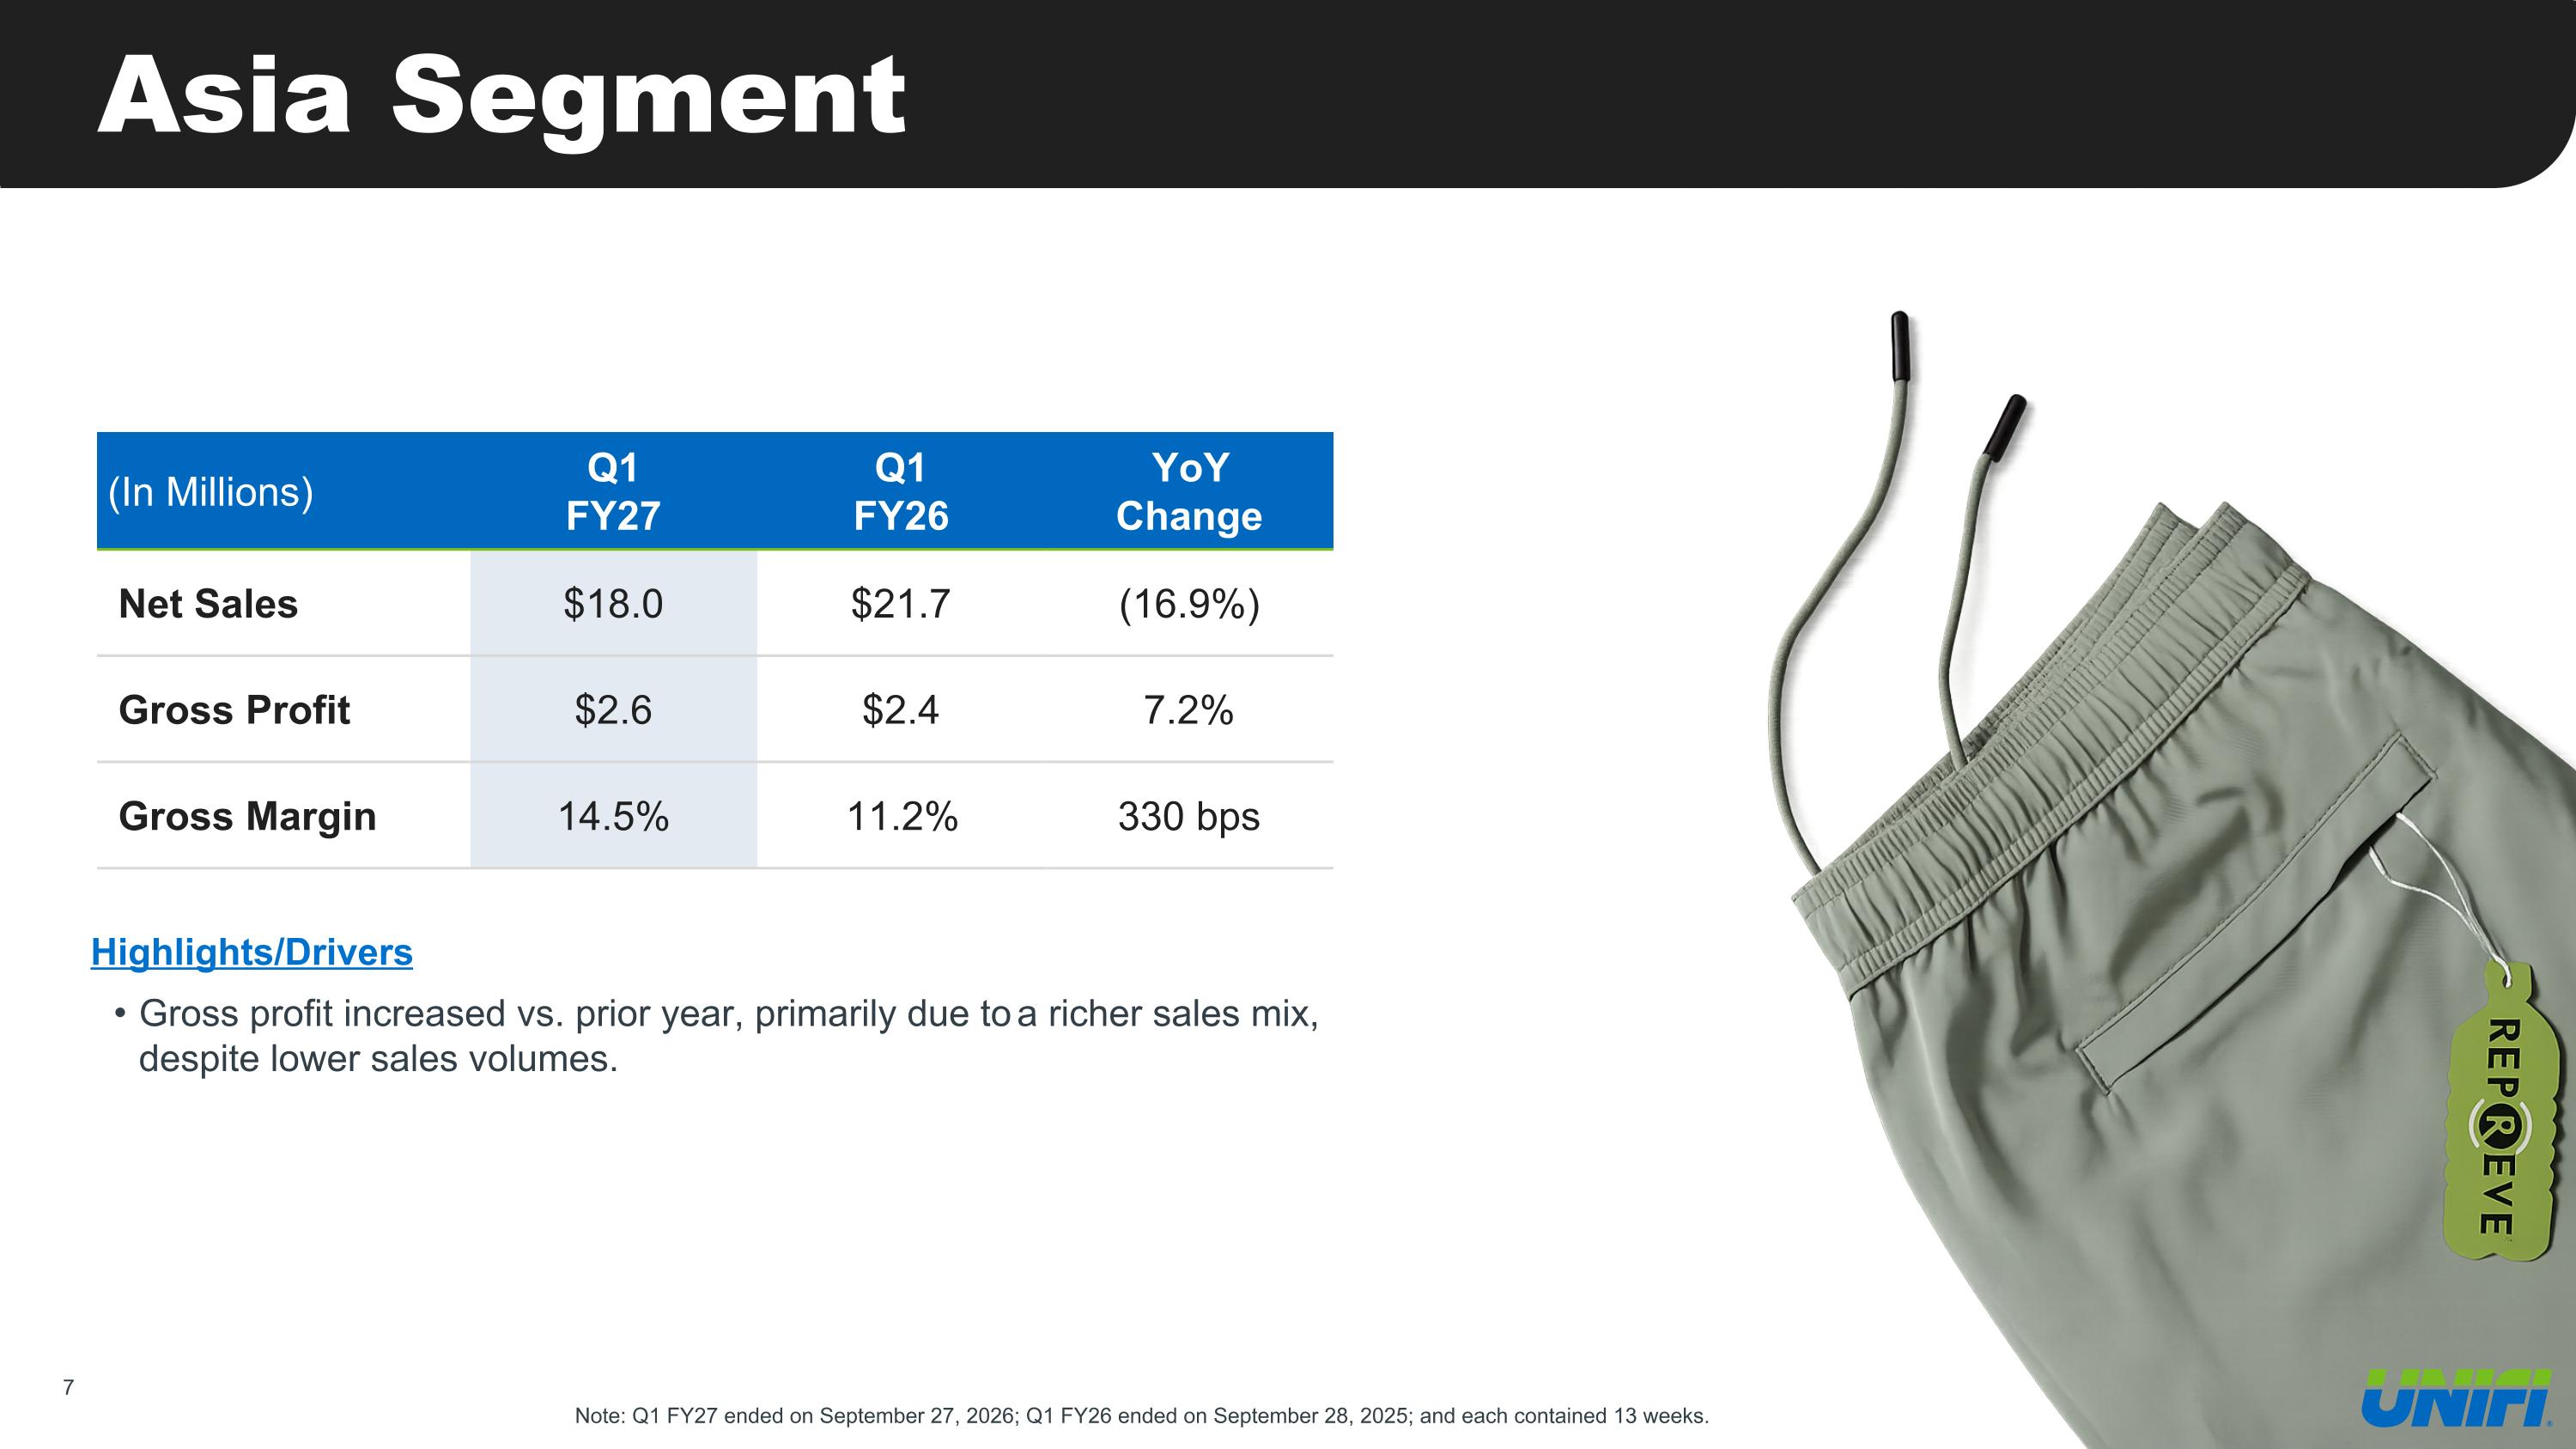
Asia Segment (In Millions) Q1 FY27 Q1 FY26 YoY Change Net Sales $18.0 $21.7 (16.9%) Gross Profit $2.6 $2.4 7.2% Gross Margin 14.5% 11.2% 330 bps Highlights/Drivers Gross profit increased vs. prior year, primarily due to a richer sales mix, despite lower sales volumes. Note: Q1 FY27 ended on September 27, 2026; Q1 FY26 ended on September 28, 2025; and each contained 13 weeks.
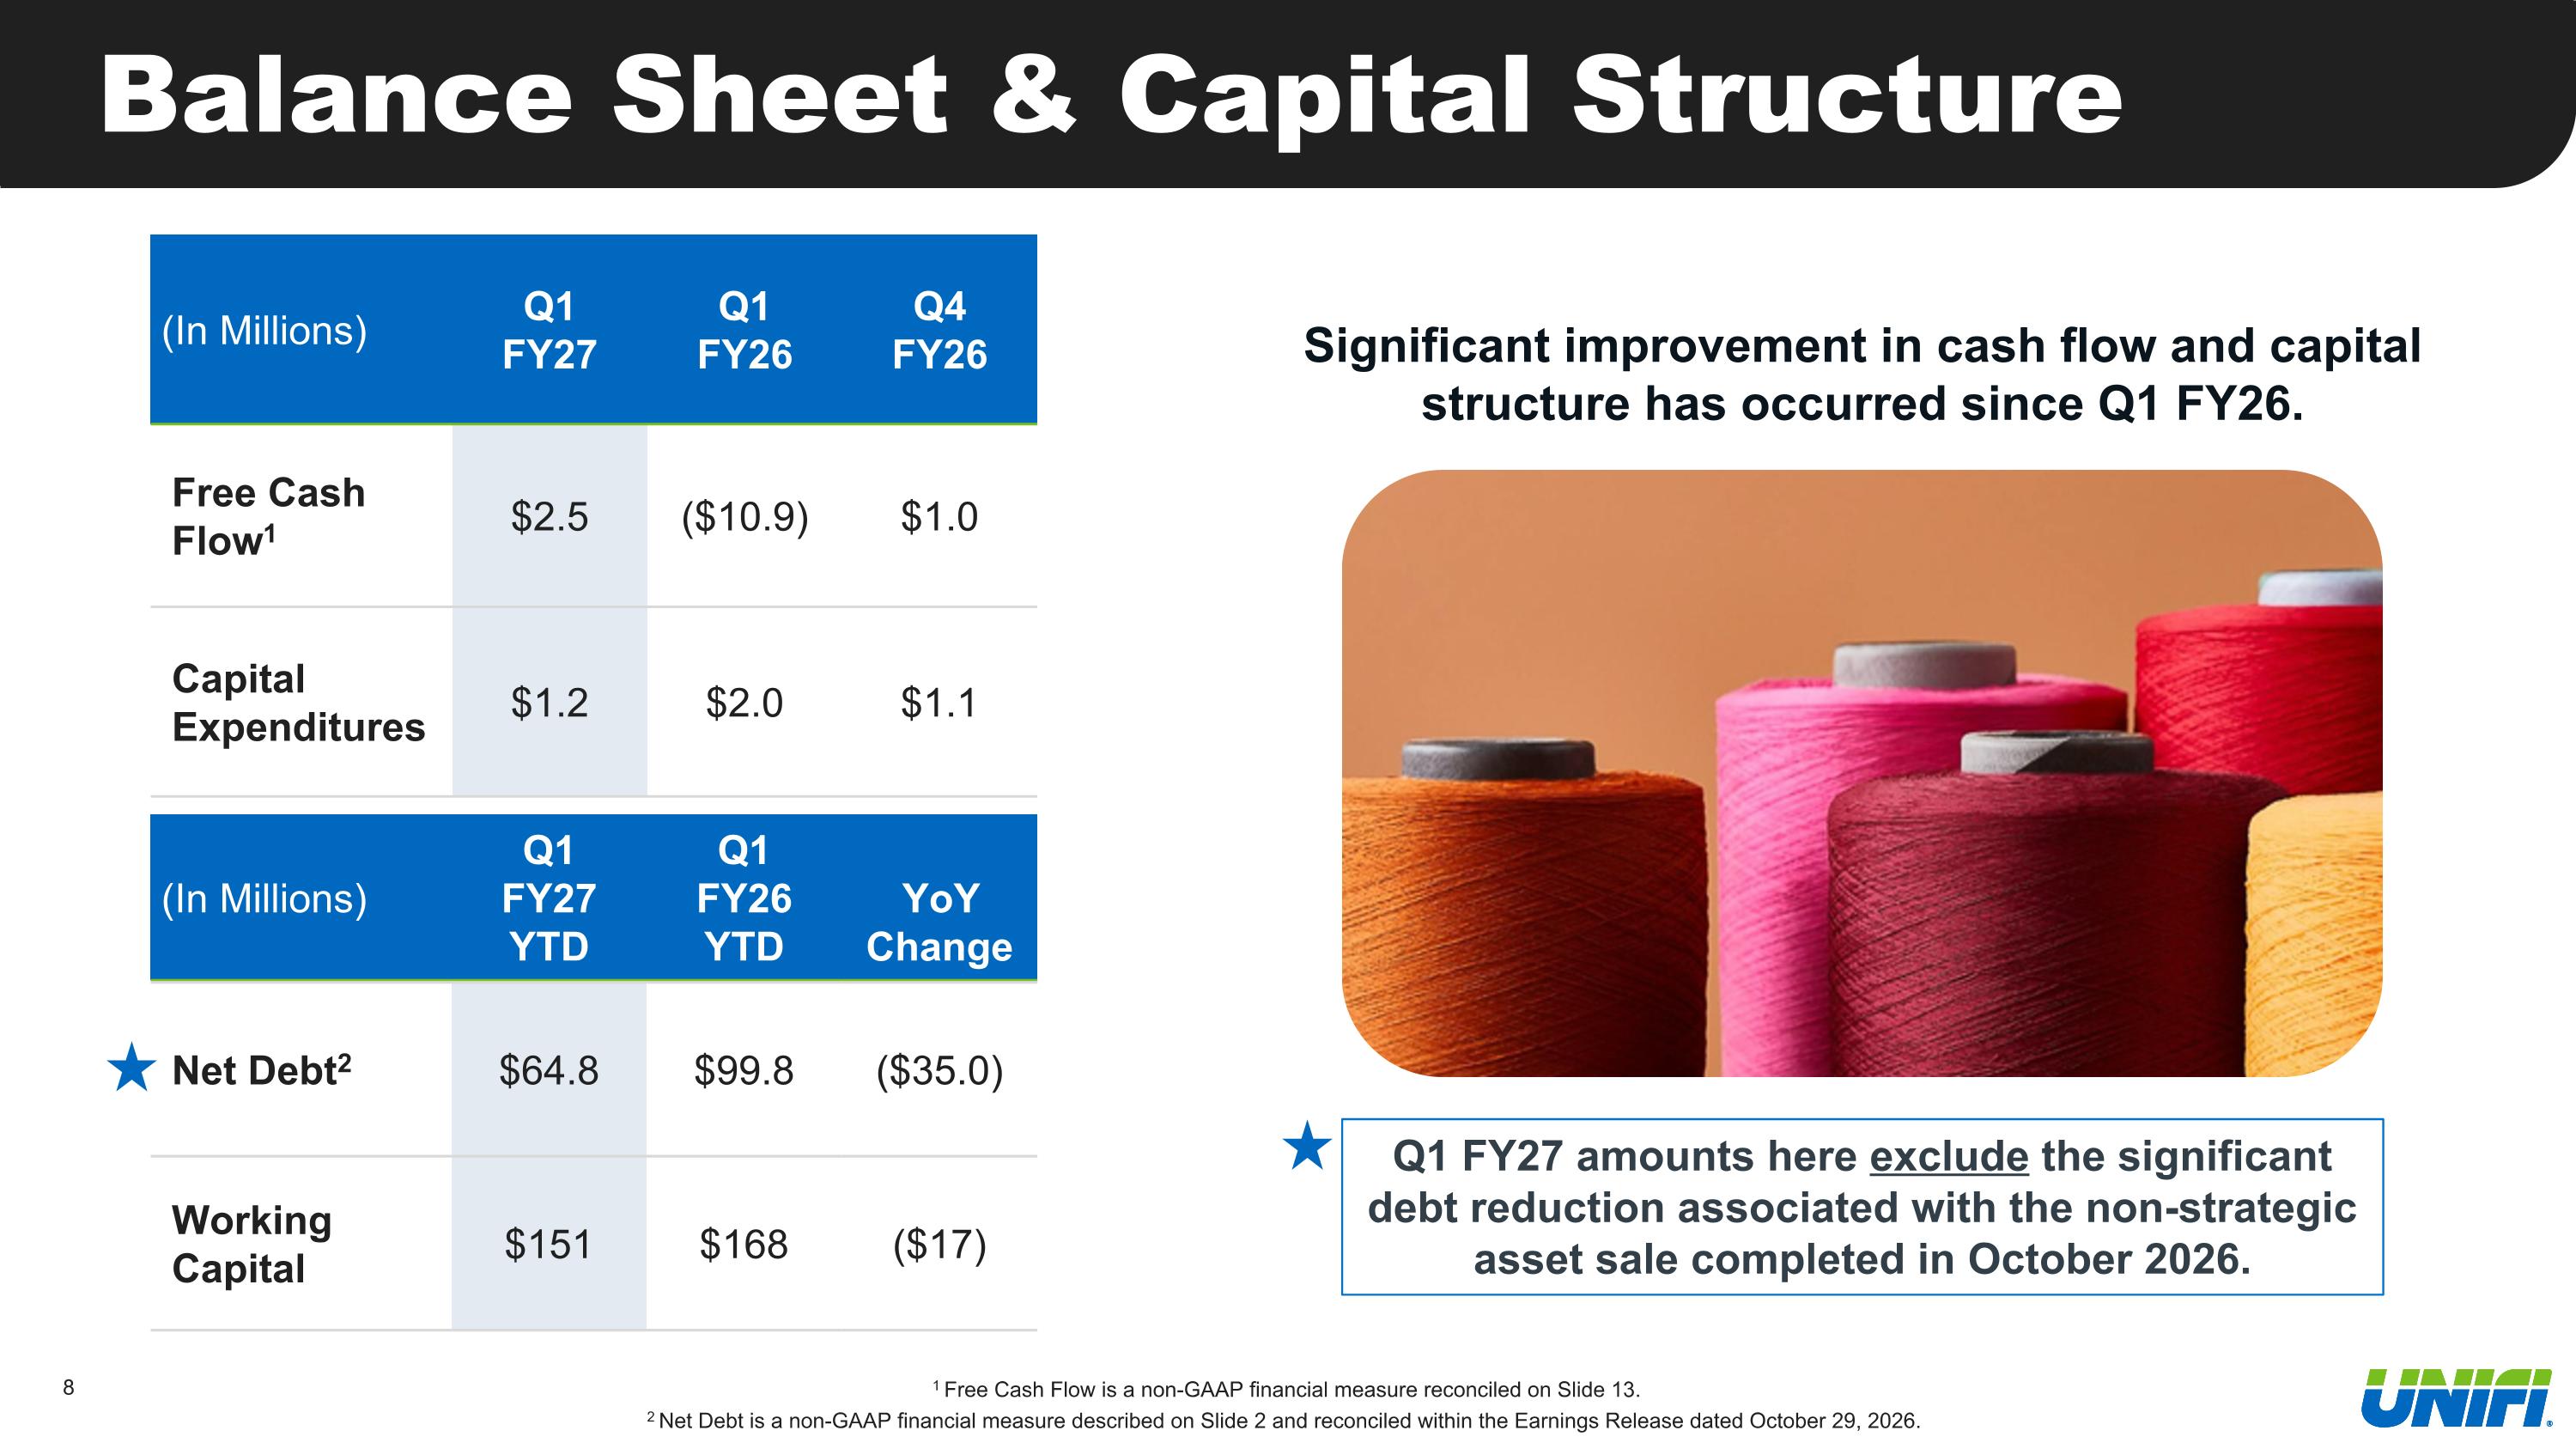
Balance Sheet & Capital Structure 1 Free Cash Flow is a non-GAAP financial measure reconciled on Slide 13. 2 Net Debt is a non-GAAP financial measure described on Slide 2 and reconciled within the Earnings Release dated October 29, 2026. (In Millions) Q1 FY27 Q1 FY26 Q4 FY26 Free Cash Flow1 $2.5 ($10.9) $1.0 Capital Expenditures $1.2 $2.0 $1.1 Q1 FY27 amounts here exclude the significant debt reduction associated with the non-strategic asset sale completed in October 2026. (In Millions) Q1 FY27 YTD Q1 FY26 YTD YoY Change Net Debt2 $64.8 $99.8 ($35.0) Working Capital $151 $168 ($17) Significant improvement in cash flow and capital structure has occurred since Q1 FY26.
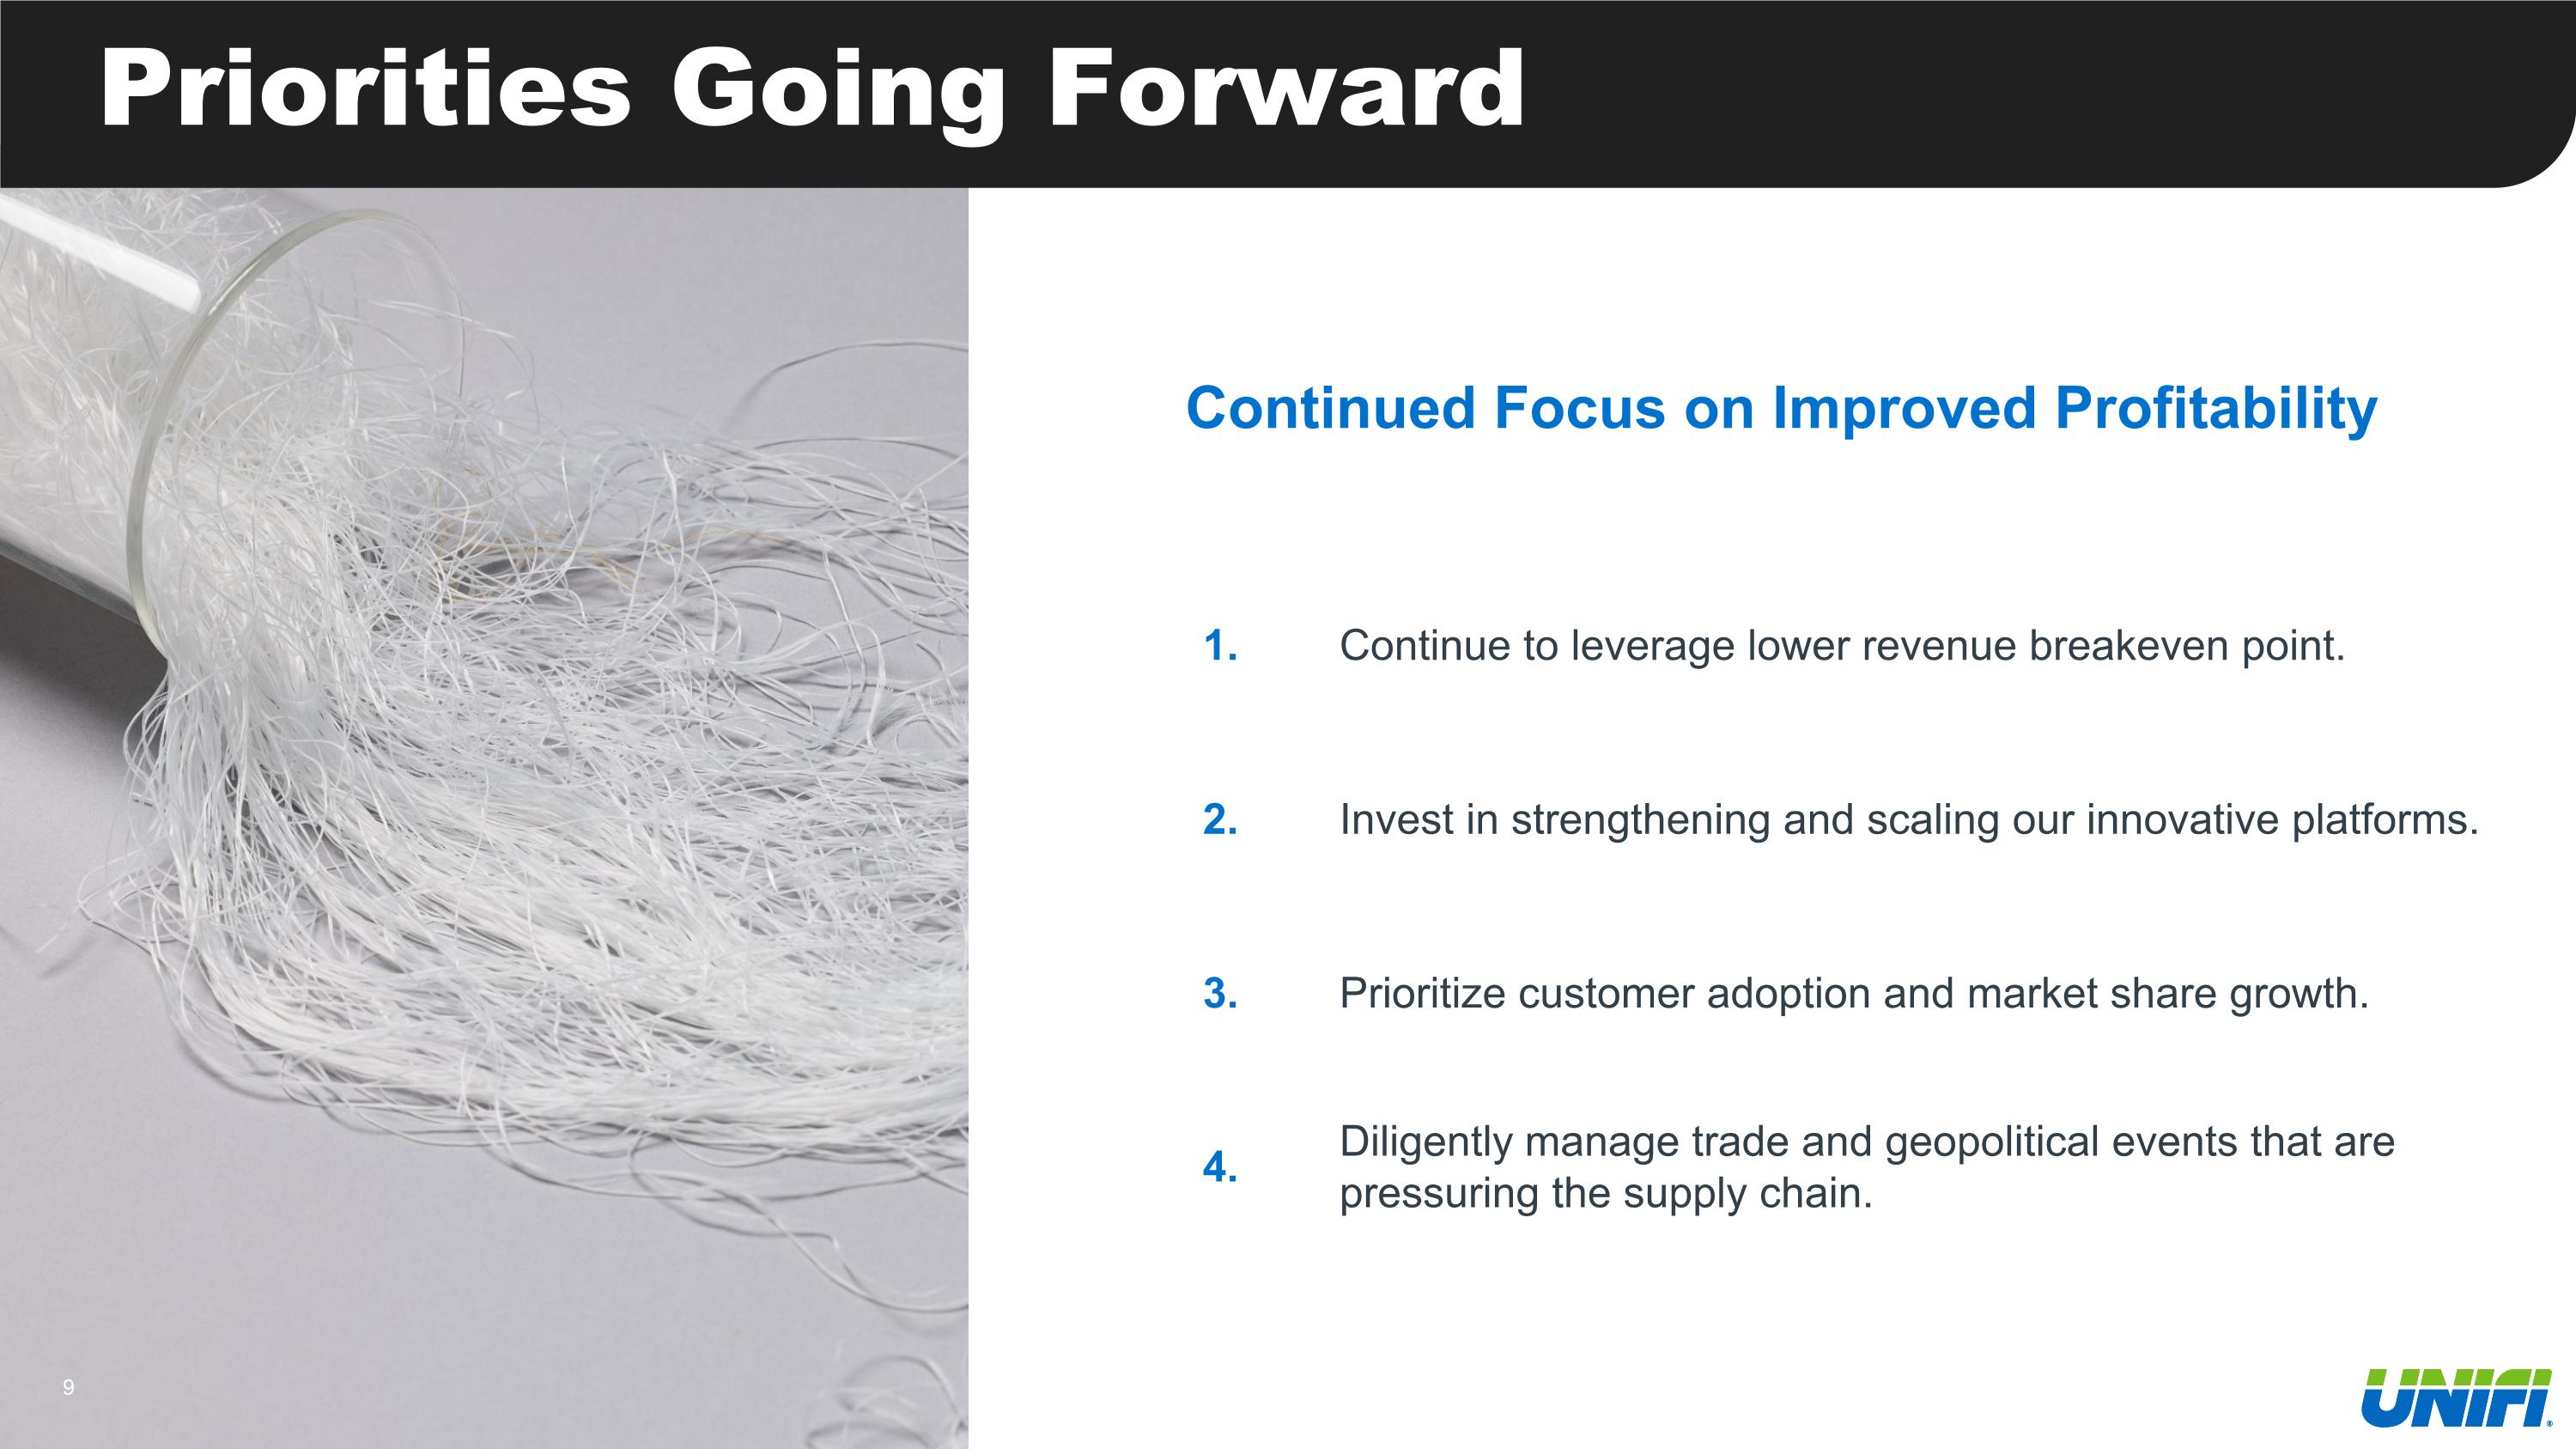
Priorities Going Forward 1. Continue to leverage lower revenue breakeven point. 2. Invest in strengthening and scaling our innovative platforms. 3. Prioritize customer adoption and market share growth. 4. Diligently manage trade and geopolitical events that are pressuring the supply chain. Continued Focus on Improved Profitability

Innovation and Marketing Highlights 10 © 2026 Unifi, Inc. - Confidential & Proprietary
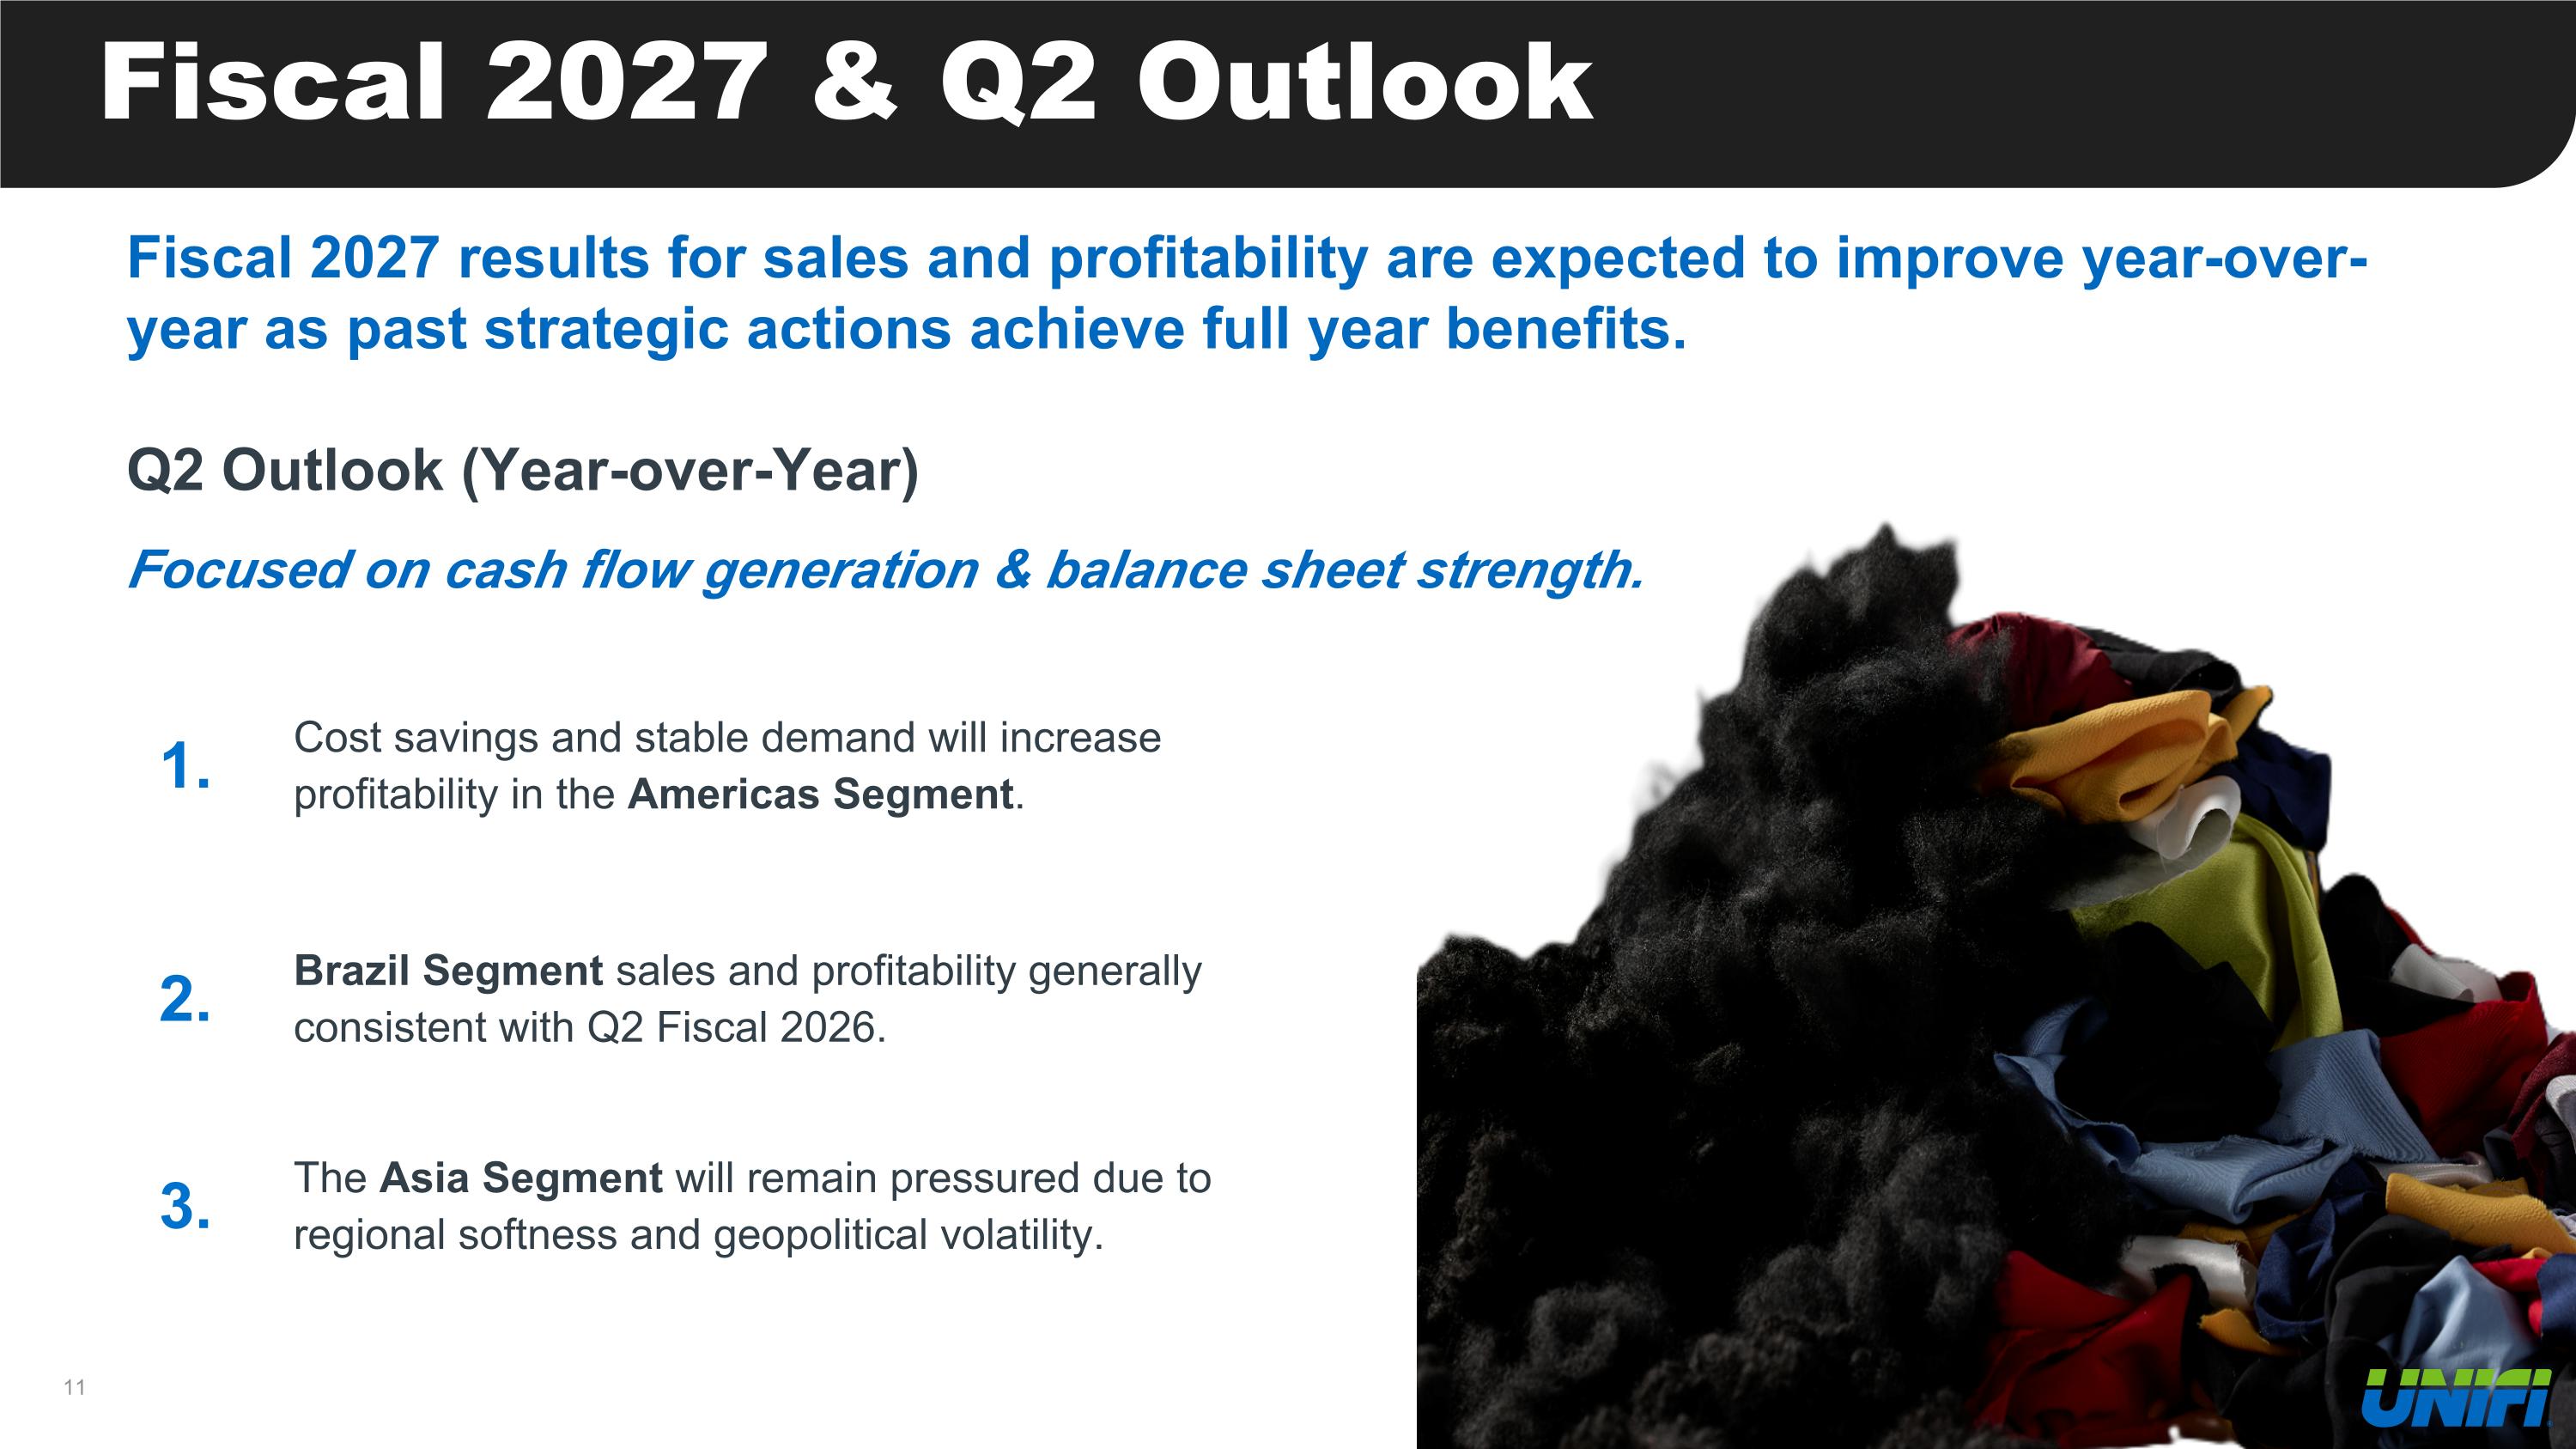
Fiscal 2027 & Q2 Outlook Fiscal 2027 results for sales and profitability are expected to improve year-over-year as past strategic actions achieve full year benefits. Q2 Outlook (Year-over-Year) Focused on cash flow generation & balance sheet strength. 1. Cost savings and stable demand will increase profitability in the Americas Segment. 2. Brazil Segment sales and profitability generally consistent with Q2 Fiscal 2026. 3. The Asia Segment will remain pressured due to regional softness and geopolitical volatility.

Contact Investor Relations: UFI@alpha-ir.com
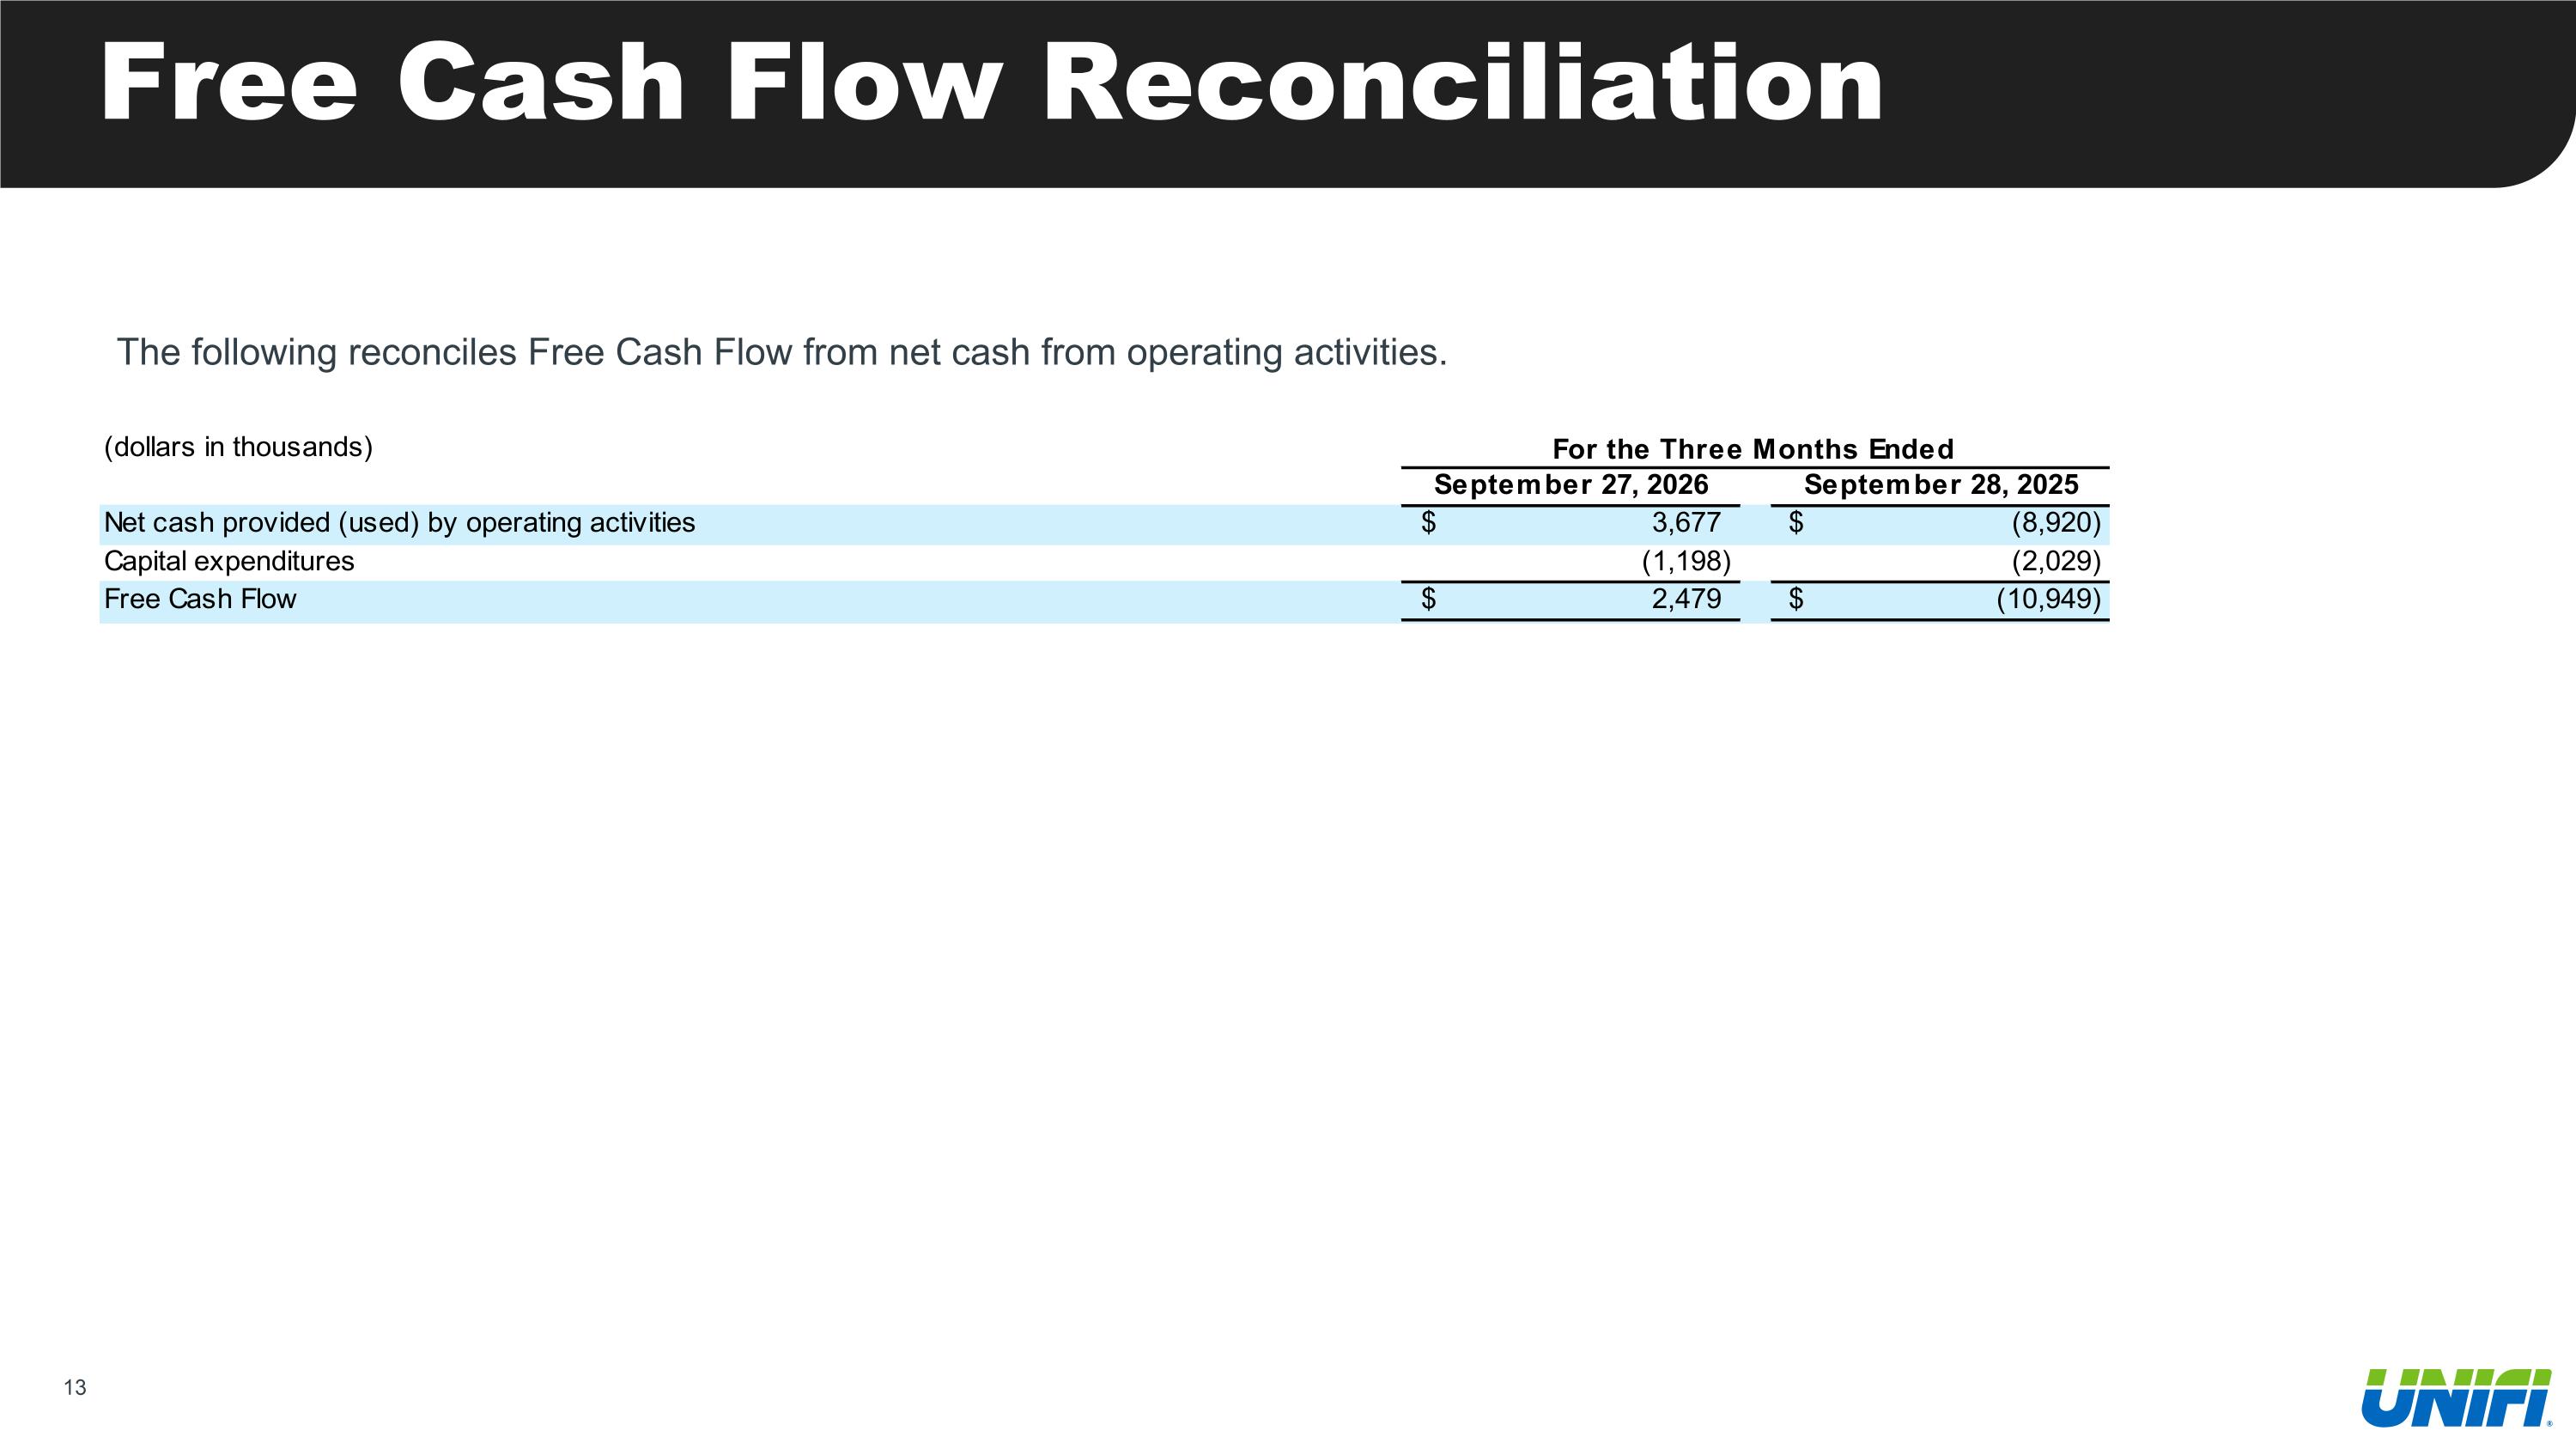
Free Cash Flow Reconciliation The following reconciles Free Cash Flow from net cash from operating activities.