BayFirst Financial Corp. (NASDAQ:BAFN) 2026 – Third Quarter Results (Unaudited)
In addition to the historical information contained herein, this presentation includes "forward-looking statements" within the meaning of such term in the Private Securities Litigation Reform Act of 1995. These statements are subject to many risks and uncertainties, including, but not limited to, the effects of health crises, global military hostilities, weather events, or climate change, including their effects on the economic environment, our customers and our operations, as well as any changes to federal, state or local government laws, regulations or orders in connection with them; the ability of the Company to implement its strategy and expand its banking operations; changes in interest rates and other general economic, business and political conditions, including changes in the financial markets and credit quality; changes in business plans as circumstances warrant; risks related to mergers and acquisitions; changes in benchmark interest rates used to price loans and deposits, changes in tax laws, regulations and guidance; enforcement actions initiated by our regulators and their impact on our operations; and other risks detailed from time to time in filings made by the Company with the SEC, including, but not limited to those “Risk Factors” described in our most recent Form 10-K and Form 10-Q. Readers should note that the forward-looking statements included herein are not a guarantee of future events, and that actual events may differ materially from those made in or suggested by the forward-looking statements. Cautionary Statement Concerning Forward-Looking Information Forward-looking statements generally can be identified by the use of forward-looking terminology such as "will," "propose," "may," "plan," "seek," "expect," "intend," "estimate," "anticipate," "believe," "continue," or similar terminology. Any forward-looking statements presented herein are made only as of the date of this document, and we do not undertake any obligation to update or revise any forward-looking statements to reflect changes in assumptions, the occurrence of unanticipated events, or otherwise.
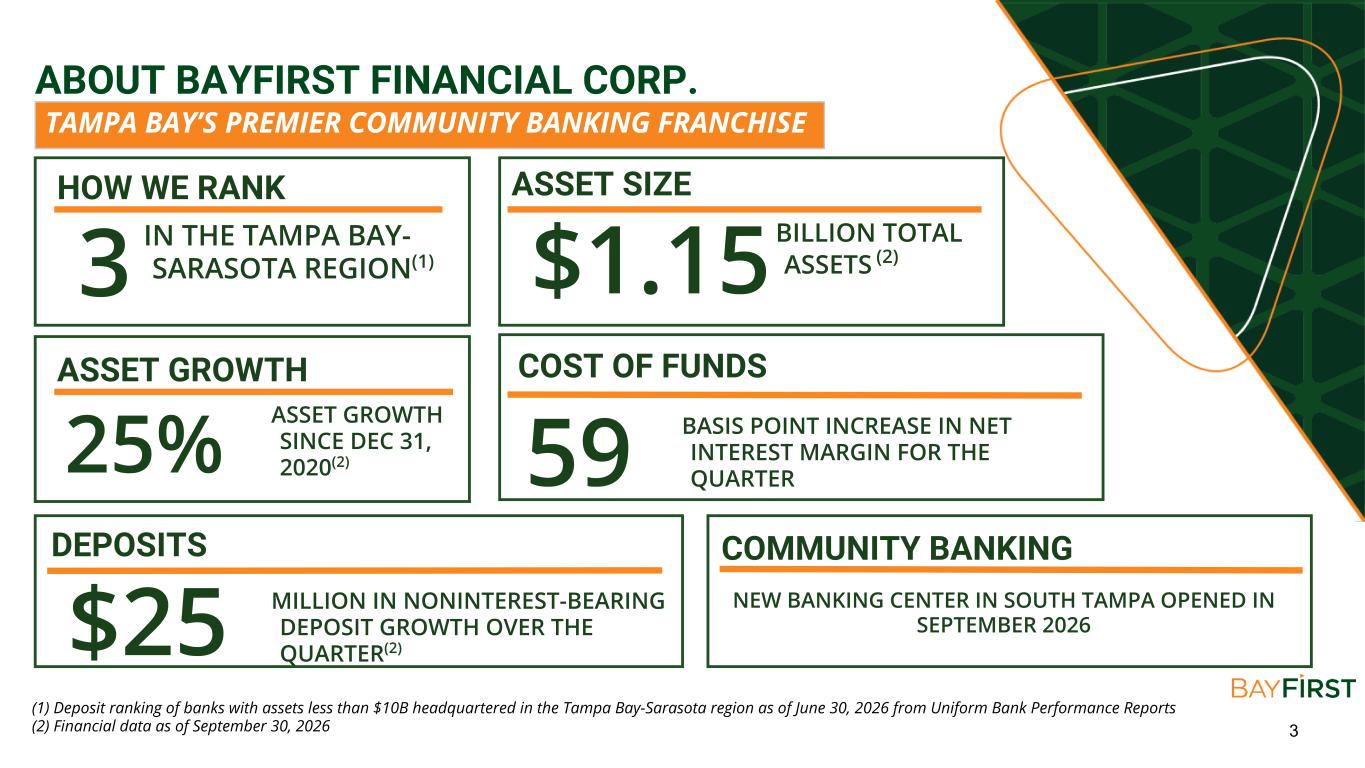
3 ABOUT BAYFIRST FINANCIAL CORP. TAMPA BAY’S PREMIER COMMUNITY BANKING FRANCHISE IN THE TAMPA BAY- SARASOTA REGION(1) HOW WE RANK 3 ASSET SIZE BILLION TOTAL ASSETS (2)$1.15 ASSET GROWTH ASSET GROWTH SINCE DEC 31, 2020(2)25% (1) Deposit ranking of banks with assets less than $10B headquartered in the Tampa Bay-Sarasota region as of June 30, 2026 from Uniform Bank Performance Reports (2) Financial data as of September 30, 2026 COST OF FUNDS BASIS POINT INCREASE IN NET INTEREST MARGIN FOR THE QUARTER DEPOSITS $25 MILLION IN NONINTEREST-BEARING DEPOSIT GROWTH OVER THE QUARTER(2) COMMUNITY BANKING NEW BANKING CENTER IN SOUTH TAMPA OPENED IN SEPTEMBER 2026 59
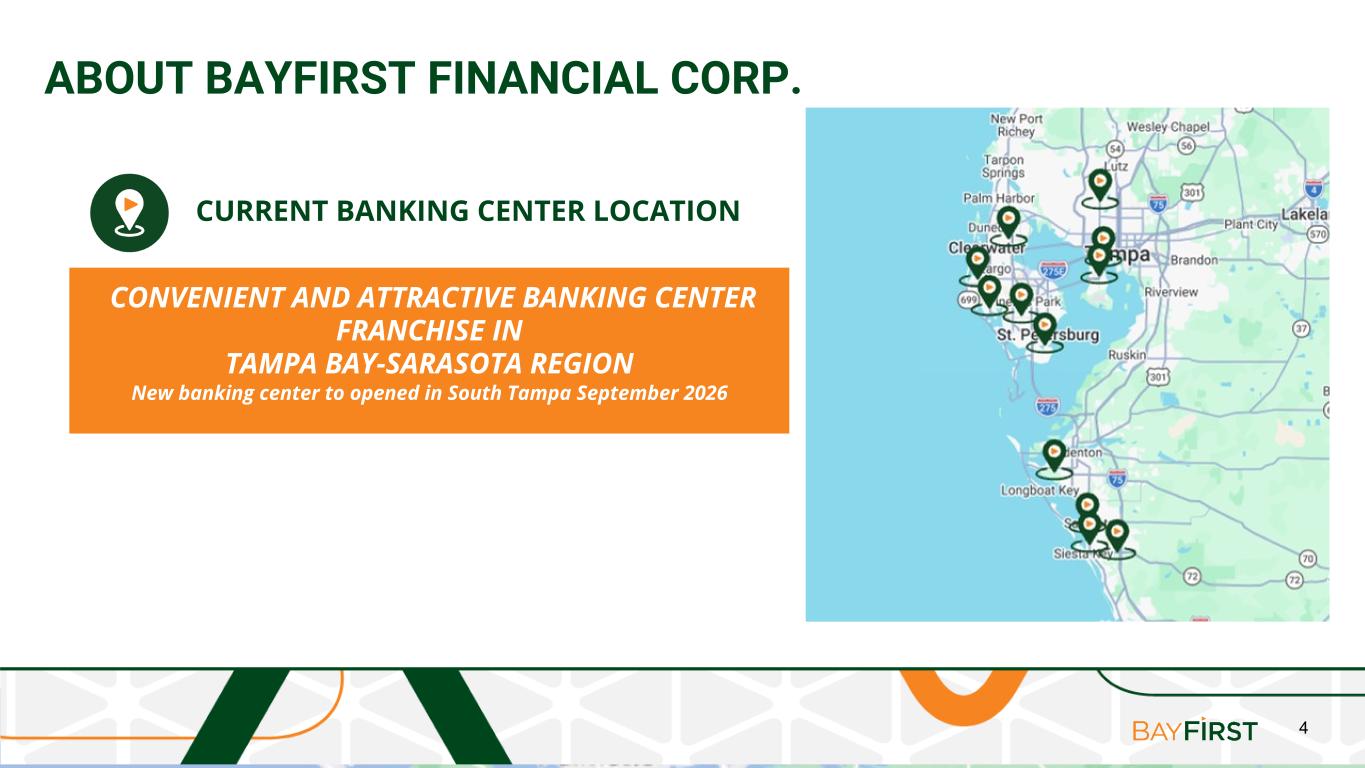
4 ABOUT BAYFIRST FINANCIAL CORP. CURRENT BANKING CENTER LOCATION CONVENIENT AND ATTRACTIVE BANKING CENTER FRANCHISE IN TAMPA BAY-SARASOTA REGION New banking center to opened in South Tampa September 2026
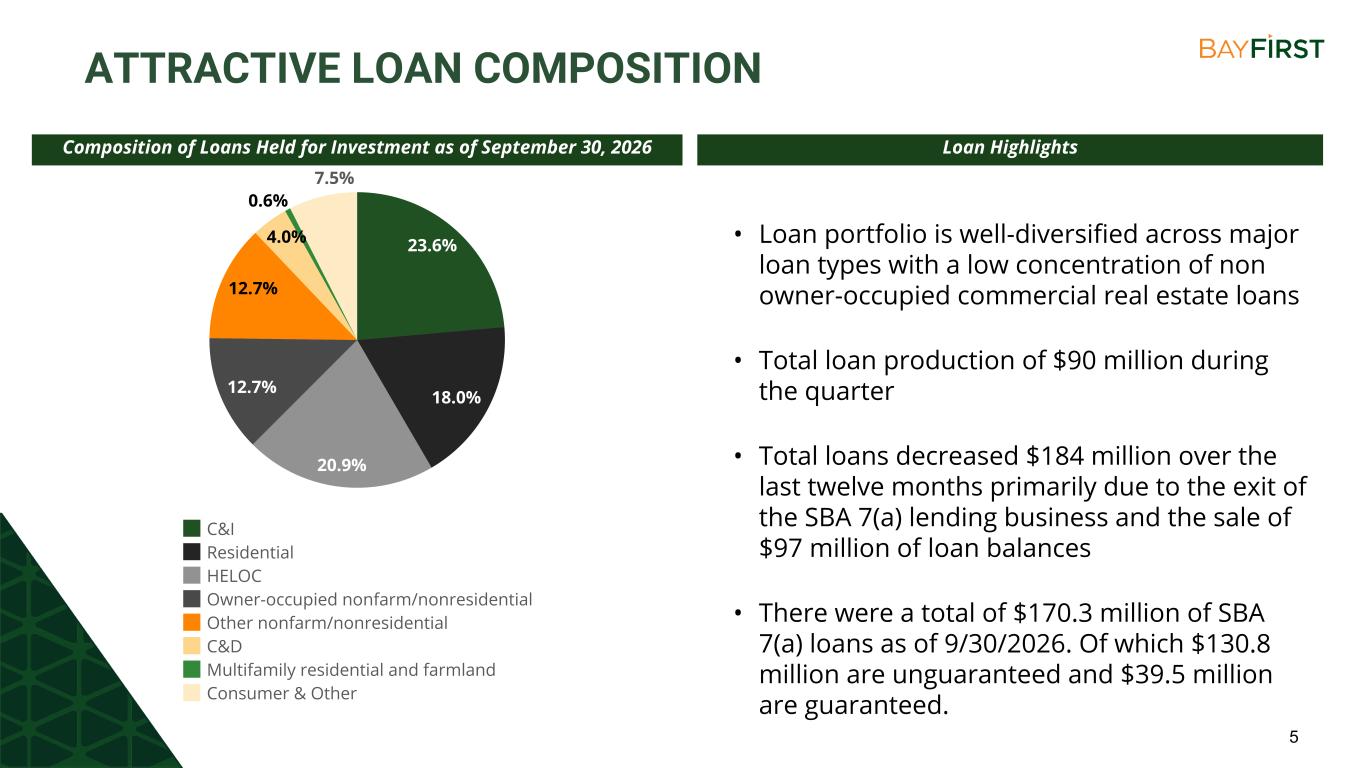
5 ATTRACTIVE LOAN COMPOSITION Composition of Loans Held for Investment as of September 30, 2026 23.6% 18.0% 20.9% 12.7% 12.7% 4.0% 0.6% 7.5% C&I Residential HELOC Owner-occupied nonfarm/nonresidential Other nonfarm/nonresidential C&D Multifamily residential and farmland Consumer & Other Loan Highlights • Loan portfolio is well-diversified across major loan types with a low concentration of non owner-occupied commercial real estate loans • Total loan production of $90 million during the quarter • Total loans decreased $184 million over the last twelve months primarily due to the exit of the SBA 7(a) lending business and the sale of $97 million of loan balances • There were a total of $170.3 million of SBA 7(a) loans as of 9/30/2026. Of which $130.8 million are unguaranteed and $39.5 million are guaranteed.
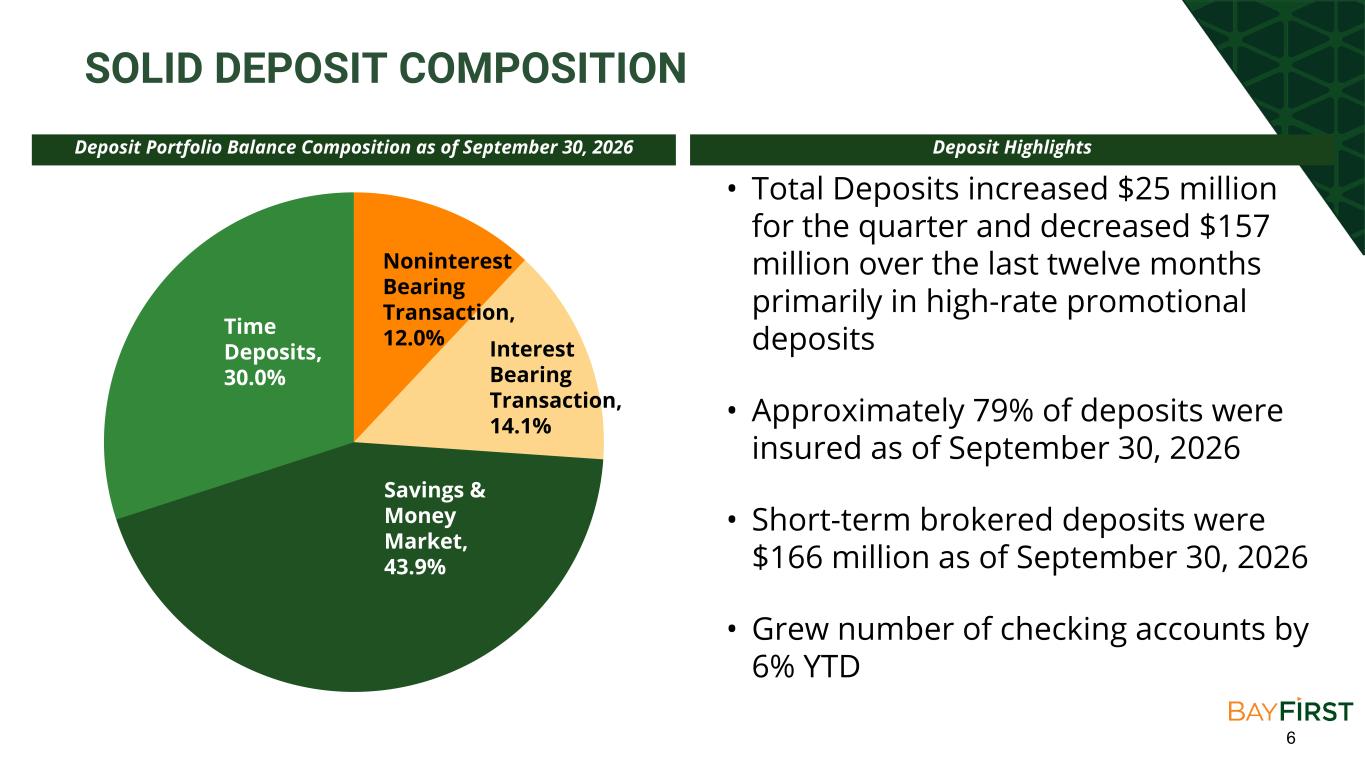
6 SOLID DEPOSIT COMPOSITION Deposit Portfolio Balance Composition as of September 30, 2026 • Total Deposits increased $25 million for the quarter and decreased $157 million over the last twelve months primarily in high-rate promotional deposits • Approximately 79% of deposits were insured as of September 30, 2026 • Short-term brokered deposits were $166 million as of September 30, 2026 • Grew number of checking accounts by 6% YTD Noninterest Bearing Transaction, 12.0% Interest Bearing Transaction, 14.1% Savings & Money Market, 43.9% Time Deposits, 30.0% Deposit Highlights
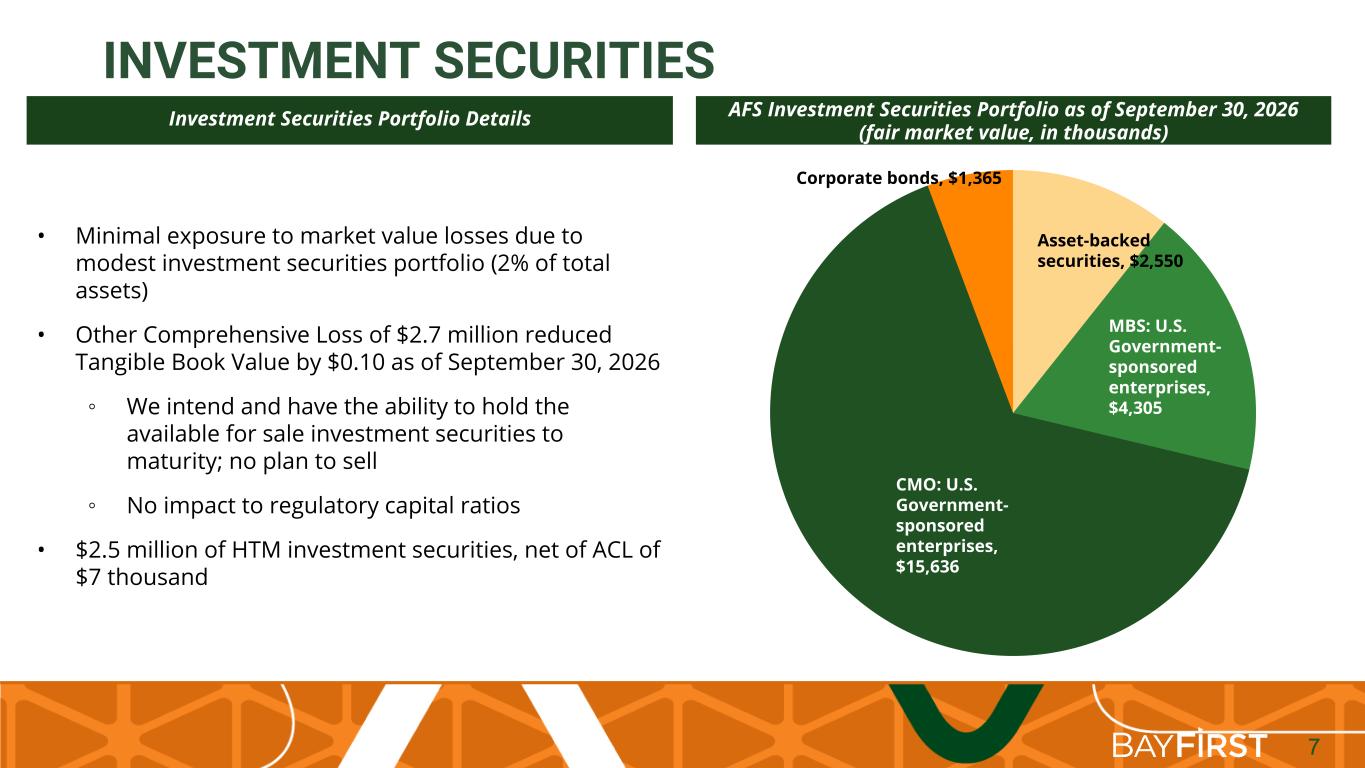
7 INVESTMENT SECURITIES AFS Investment Securities Portfolio as of September 30, 2026 (fair market value, in thousands) Investment Securities Portfolio Details • Minimal exposure to market value losses due to modest investment securities portfolio (2% of total assets) • Other Comprehensive Loss of $2.7 million reduced Tangible Book Value by $0.10 as of September 30, 2026 ◦ We intend and have the ability to hold the available for sale investment securities to maturity; no plan to sell ◦ No impact to regulatory capital ratios • $2.5 million of HTM investment securities, net of ACL of $7 thousand Asset-backed securities, $2,550 MBS: U.S. Government- sponsored enterprises, $4,305 CMO: U.S. Government- sponsored enterprises, $15,636 Corporate bonds, $1,365
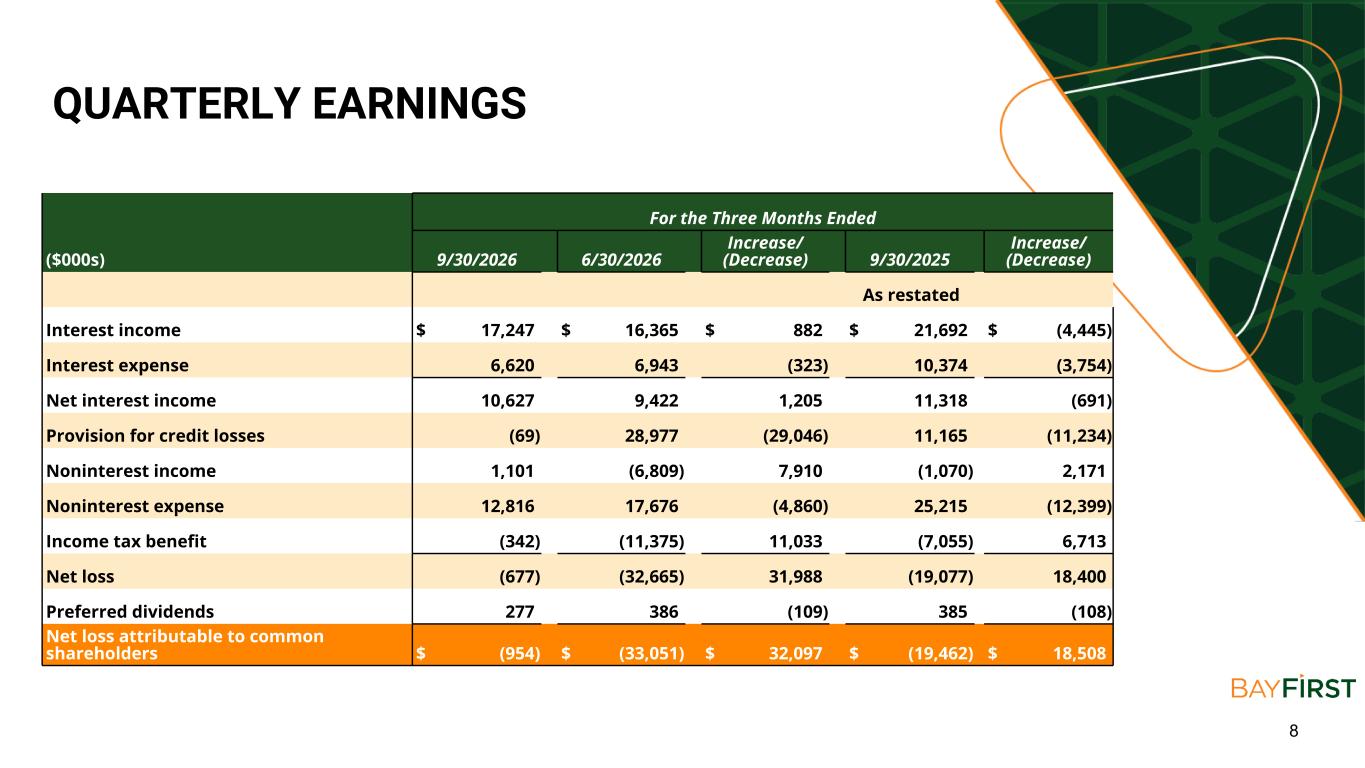
8 QUARTERLY EARNINGS For the Three Months Ended ($000s) 9/30/2026 6/30/2026 Increase/ (Decrease) 9/30/2025 Increase/ (Decrease) As restated Interest income $ 17,247 $ 16,365 $ 882 $ 21,692 $ (4,445) Interest expense 6,620 6,943 (323) 10,374 (3,754) Net interest income 10,627 9,422 1,205 11,318 (691) Provision for credit losses (69) 28,977 (29,046) 11,165 (11,234) Noninterest income 1,101 (6,809) 7,910 (1,070) 2,171 Noninterest expense 12,816 17,676 (4,860) 25,215 (12,399) Income tax benefit (342) (11,375) 11,033 (7,055) 6,713 Net loss (677) (32,665) 31,988 (19,077) 18,400 Preferred dividends 277 386 (109) 385 (108) Net loss attributable to common shareholders $ (954) $ (33,051) $ 32,097 $ (19,462) $ 18,508
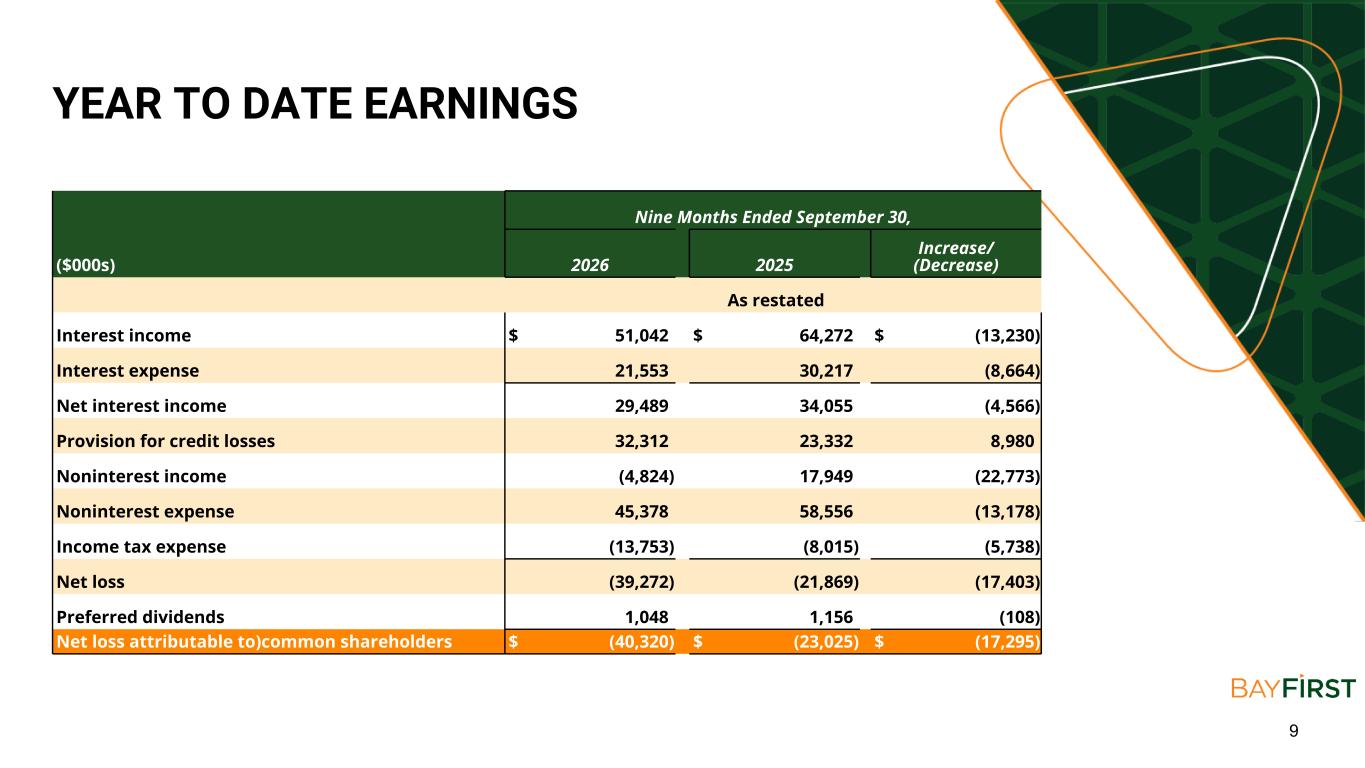
9 Nine Months Ended September 30, ($000s) 2026 2025 Increase/ (Decrease) As restated Interest income $ 51,042 $ 64,272 $ (13,230) Interest expense 21,553 30,217 (8,664) Net interest income 29,489 34,055 (4,566) Provision for credit losses 32,312 23,332 8,980 Noninterest income (4,824) 17,949 (22,773) Noninterest expense 45,378 58,556 (13,178) Income tax expense (13,753) (8,015) (5,738) Net loss (39,272) (21,869) (17,403) Preferred dividends 1,048 1,156 (108) Net loss attributable to)common shareholders $ (40,320) $ (23,025) $ (17,295) YEAR TO DATE EARNINGS
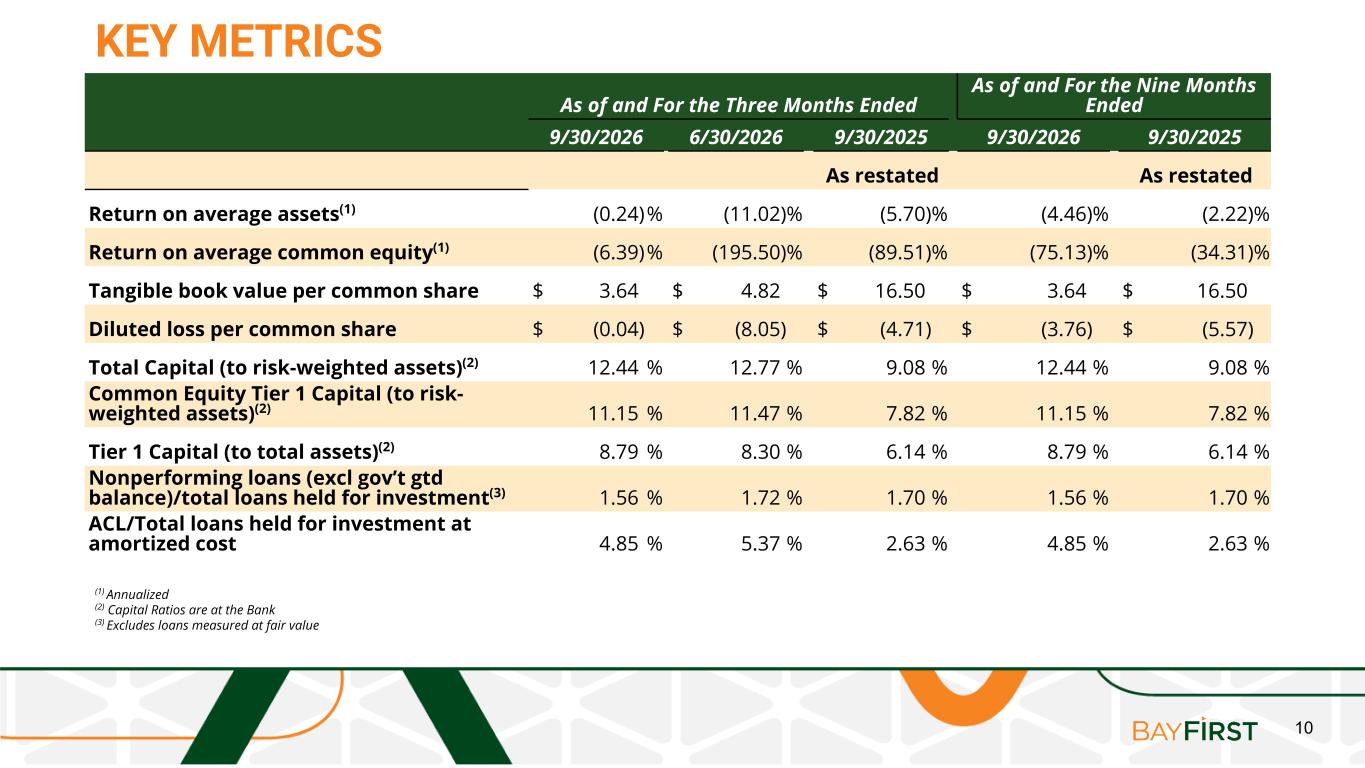
10 KEY METRICS As of and For the Three Months Ended As of and For the Nine Months Ended 9/30/2026 6/30/2026 9/30/2025 9/30/2026 9/30/2025 As restated As restated Return on average assets(1) (0.24) % (11.02) % (5.70) % (4.46) % (2.22) % Return on average common equity(1) (6.39) % (195.50) % (89.51) % (75.13) % (34.31) % Tangible book value per common share $ 3.64 $ 4.82 $ 16.50 $ 3.64 $ 16.50 Diluted loss per common share $ (0.04) $ (8.05) $ (4.71) $ (3.76) $ (5.57) Total Capital (to risk-weighted assets)(2) 12.44 % 12.77 % 9.08 % 12.44 % 9.08 % Common Equity Tier 1 Capital (to risk- weighted assets)(2) 11.15 % 11.47 % 7.82 % 11.15 % 7.82 % Tier 1 Capital (to total assets)(2) 8.79 % 8.30 % 6.14 % 8.79 % 6.14 % Nonperforming loans (excl gov’t gtd balance)/total loans held for investment(3) 1.56 % 1.72 % 1.70 % 1.56 % 1.70 % ACL/Total loans held for investment at amortized cost 4.85 % 5.37 % 2.63 % 4.85 % 2.63 % (1) Annualized (2) Capital Ratios are at the Bank (3) Excludes loans measured at fair value
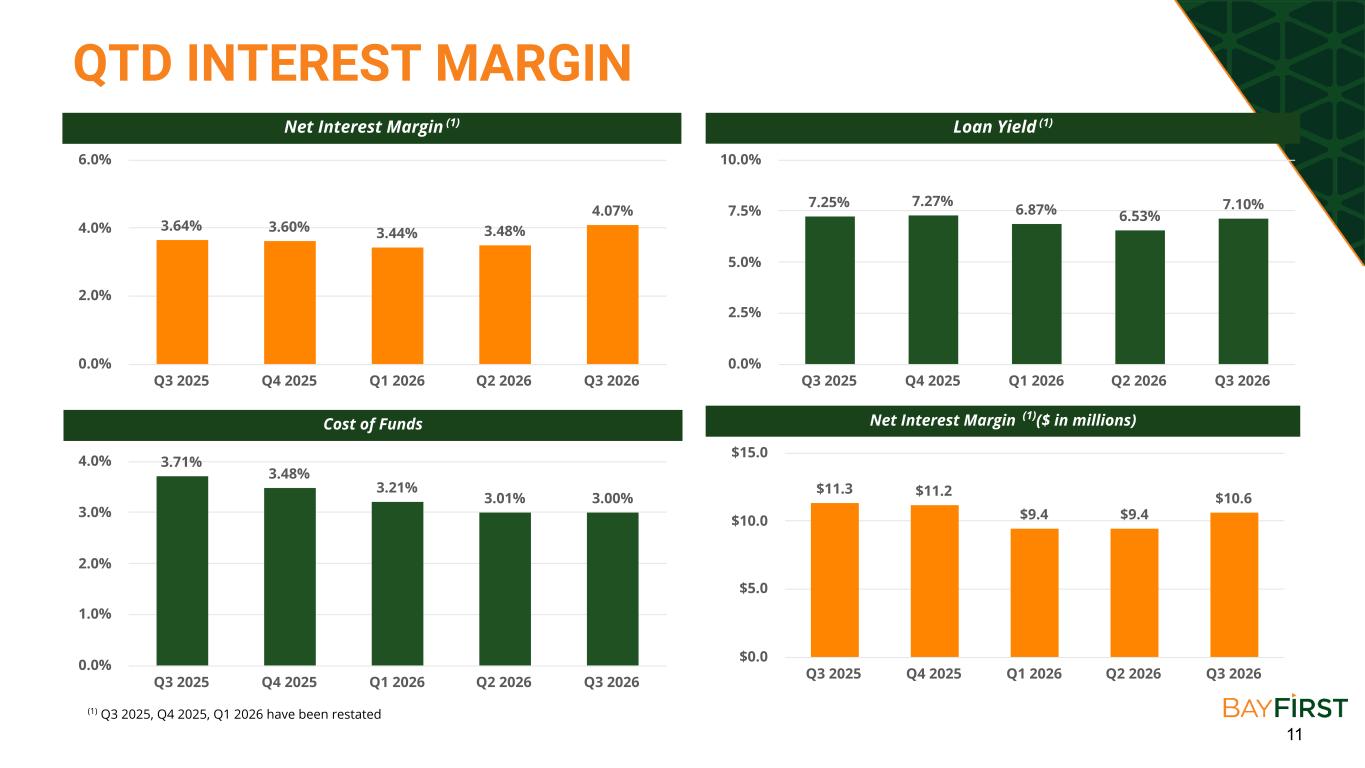
11 QTD INTEREST MARGIN 3.64% 3.60% 3.44% 3.48% 4.07% Q3 2025 Q4 2025 Q1 2026 Q2 2026 Q3 2026 0.0% 2.0% 4.0% 6.0% Net Interest Margin (1) Loan Yield (1) 7.25% 7.27% 6.87% 6.53% 7.10% Q3 2025 Q4 2025 Q1 2026 Q2 2026 Q3 2026 0.0% 2.5% 5.0% 7.5% 10.0% Cost of Funds Net Interest Margin (1)($ in millions) 3.71% 3.48% 3.21% 3.01% 3.00% Q3 2025 Q4 2025 Q1 2026 Q2 2026 Q3 2026 0.0% 1.0% 2.0% 3.0% 4.0% $11.3 $11.2 $9.4 $9.4 $10.6 Q3 2025 Q4 2025 Q1 2026 Q2 2026 Q3 2026 $0.0 $5.0 $10.0 $15.0 (1) Q3 2025, Q4 2025, Q1 2026 have been restated
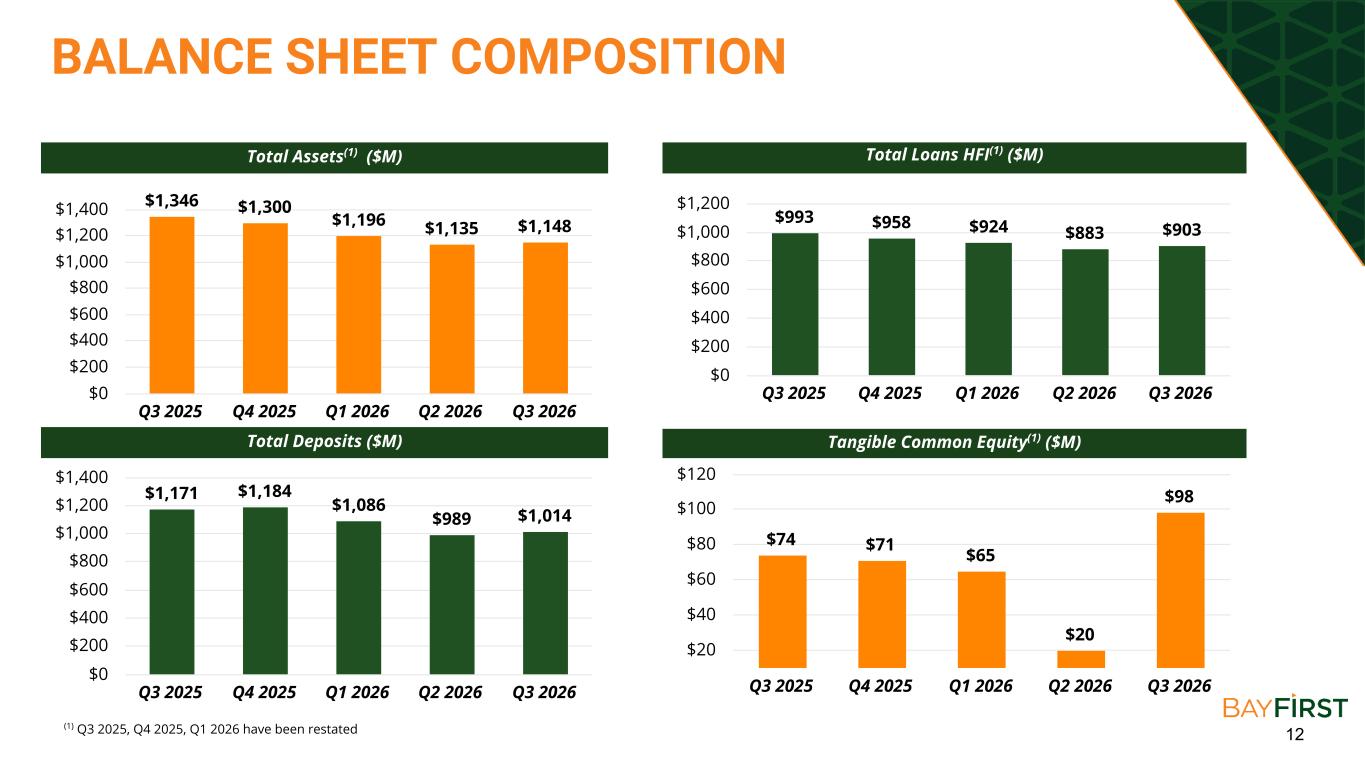
12 $74 $71 $65 $20 $98 Q3 2025 Q4 2025 Q1 2026 Q2 2026 Q3 2026 $20 $40 $60 $80 $100 $120 BALANCE SHEET COMPOSITION Total Assets(1) ($M) Total Loans HFI(1) ($M) Total Deposits ($M) Tangible Common Equity(1) ($M) $1,346 $1,300 $1,196 $1,135 $1,148 Q3 2025 Q4 2025 Q1 2026 Q2 2026 Q3 2026 $0 $200 $400 $600 $800 $1,000 $1,200 $1,400 $993 $958 $924 $883 $903 Q3 2025 Q4 2025 Q1 2026 Q2 2026 Q3 2026 $0 $200 $400 $600 $800 $1,000 $1,200 $1,171 $1,184 $1,086 $989 $1,014 Q3 2025 Q4 2025 Q1 2026 Q2 2026 Q3 2026 $0 $200 $400 $600 $800 $1,000 $1,200 $1,400 (1) Q3 2025, Q4 2025, Q1 2026 have been restated
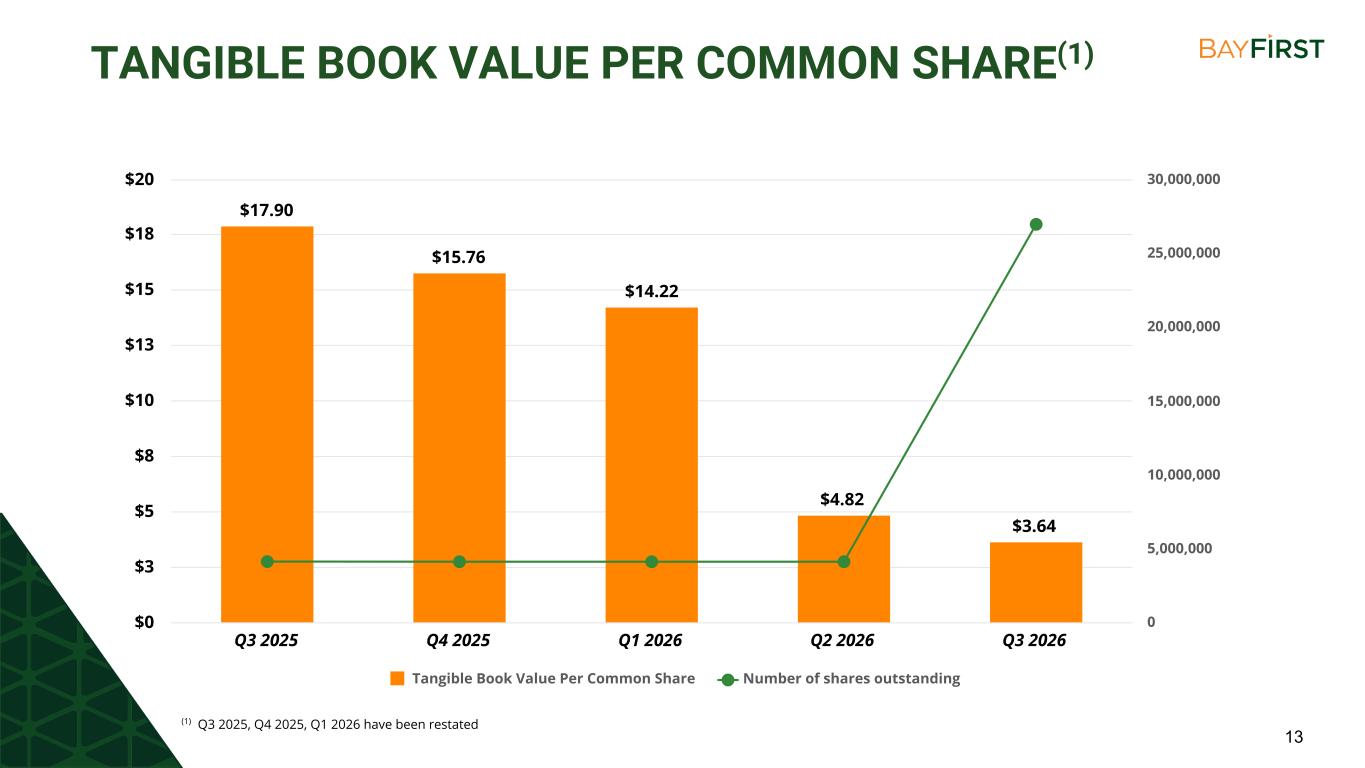
13 TANGIBLE BOOK VALUE PER COMMON SHARE(1) $17.90 $15.76 $14.22 $4.82 $3.64 Tangible Book Value Per Common Share Number of shares outstanding Q3 2025 Q4 2025 Q1 2026 Q2 2026 Q3 2026 $0 $3 $5 $8 $10 $13 $15 $18 $20 0 5,000,000 10,000,000 15,000,000 20,000,000 25,000,000 30,000,000 (1) Q3 2025, Q4 2025, Q1 2026 have been restated
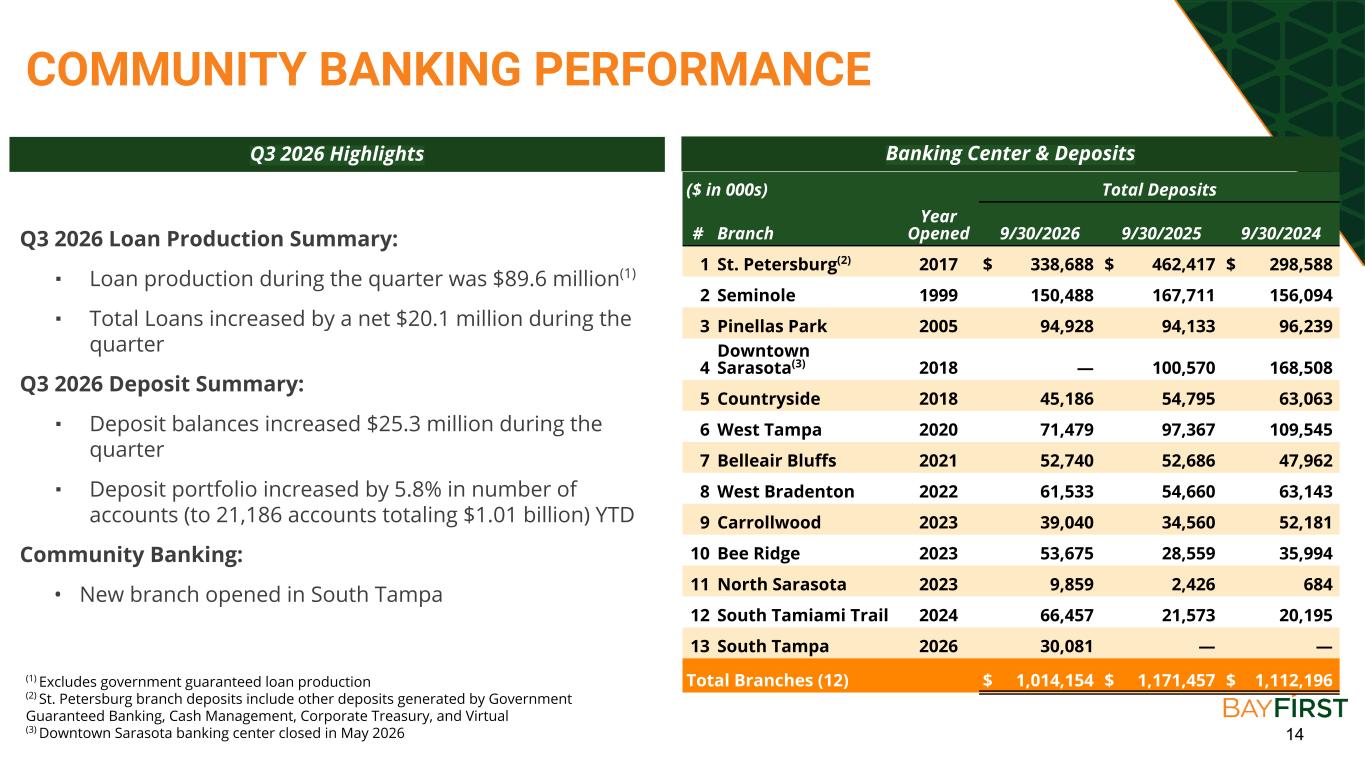
14 COMMUNITY BANKING PERFORMANCE Q3 2026 Loan Production Summary: ▪ Loan production during the quarter was $89.6 million(1) ▪ Total Loans increased by a net $20.1 million during the quarter Q3 2026 Deposit Summary: ▪ Deposit balances increased $25.3 million during the quarter ▪ Deposit portfolio increased by 5.8% in number of accounts (to 21,186 accounts totaling $1.01 billion) YTD Community Banking: • New branch opened in South Tampa Q3 2026 Highlights Banking Center & Deposits ($ in 000s) Total Deposits # Branch Year Opened 9/30/2026 9/30/2025 9/30/2024 1 St. Petersburg(2) 2017 $ 338,688 $ 462,417 $ 298,588 2 Seminole 1999 150,488 167,711 156,094 3 Pinellas Park 2005 94,928 94,133 96,239 4 Downtown Sarasota(3) 2018 — 100,570 168,508 5 Countryside 2018 45,186 54,795 63,063 6 West Tampa 2020 71,479 97,367 109,545 7 Belleair Bluffs 2021 52,740 52,686 47,962 8 West Bradenton 2022 61,533 54,660 63,143 9 Carrollwood 2023 39,040 34,560 52,181 10 Bee Ridge 2023 53,675 28,559 35,994 11 North Sarasota 2023 9,859 2,426 684 12 South Tamiami Trail 2024 66,457 21,573 20,195 13 South Tampa 2026 30,081 — — Total Branches (12) $ 1,014,154 $ 1,171,457 $ 1,112,196 (1) Excludes government guaranteed loan production (2) St. Petersburg branch deposits include other deposits generated by Government Guaranteed Banking, Cash Management, Corporate Treasury, and Virtual (3) Downtown Sarasota banking center closed in May 2026
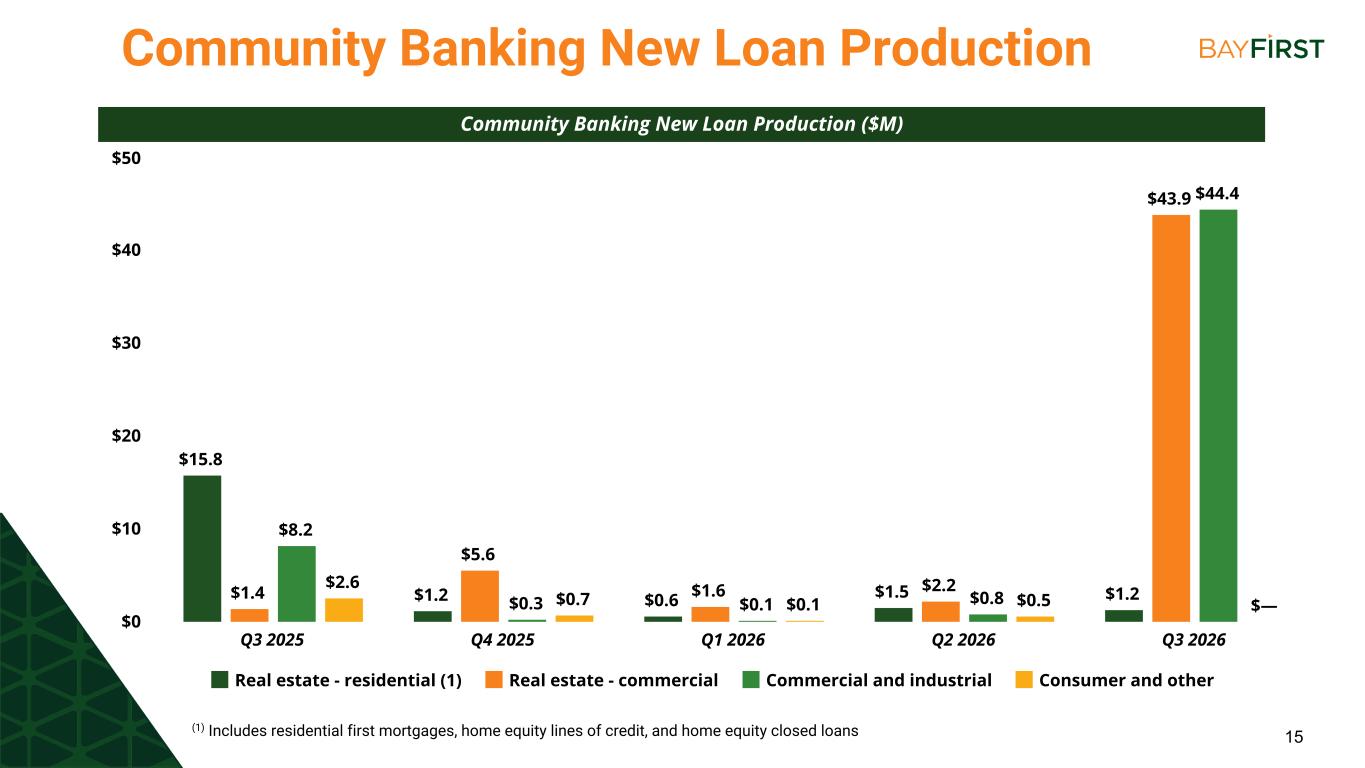
15 $15.8 $1.2 $0.6 $1.5 $1.2$1.4 $5.6 $1.6 $2.2 $43.9 $8.2 $0.3 $0.1 $0.8 $44.4 $2.6 $0.7 $0.1 $0.5 $— Real estate - residential (1) Real estate - commercial Commercial and industrial Consumer and other Q3 2025 Q4 2025 Q1 2026 Q2 2026 Q3 2026 $0 $10 $20 $30 $40 $50 Community Banking New Loan Production Community Banking New Loan Production ($M) (1) Includes residential first mortgages, home equity lines of credit, and home equity closed loans
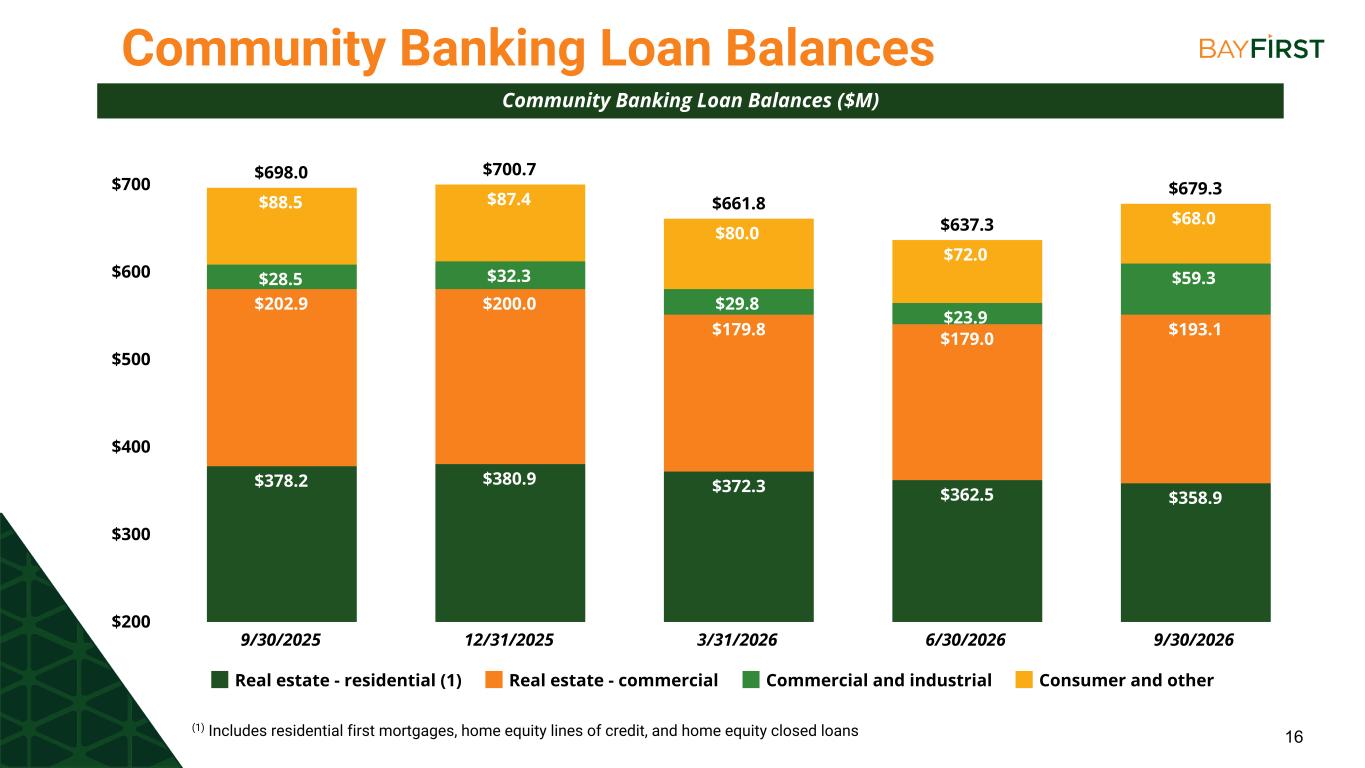
16 $698.0 $700.7 $661.8 $637.3 $679.3 $378.2 $380.9 $372.3 $362.5 $358.9 $202.9 $200.0 $179.8 $179.0 $193.1 $28.5 $32.3 $29.8 $23.9 $59.3 $88.5 $87.4 $80.0 $72.0 $68.0 Real estate - residential (1) Real estate - commercial Commercial and industrial Consumer and other 9/30/2025 12/31/2025 3/31/2026 6/30/2026 9/30/2026 $200 $300 $400 $500 $600 $700 Community Banking Loan Balances Community Banking Loan Balances ($M) (1) Includes residential first mortgages, home equity lines of credit, and home equity closed loans
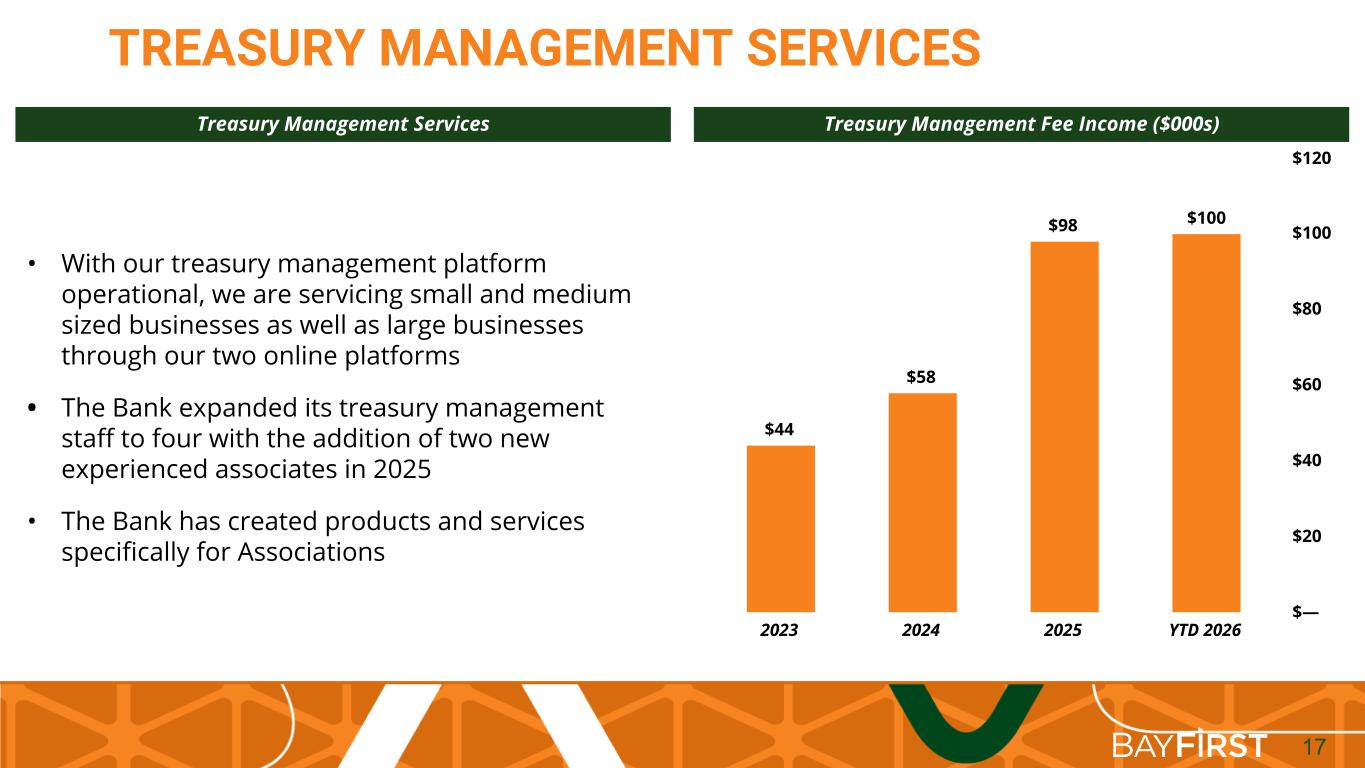
17 $44 $58 $98 $100 2023 2024 2025 YTD 2026 $— $20 $40 $60 $80 $100 $120 • With our treasury management platform operational, we are servicing small and medium sized businesses as well as large businesses through our two online platforms • The Bank expanded its treasury management staff to four with the addition of two new experienced associates in 2025 • The Bank has created products and services specifically for Associations TREASURY MANAGEMENT SERVICES Treasury Management Services Treasury Management Fee Income ($000s)
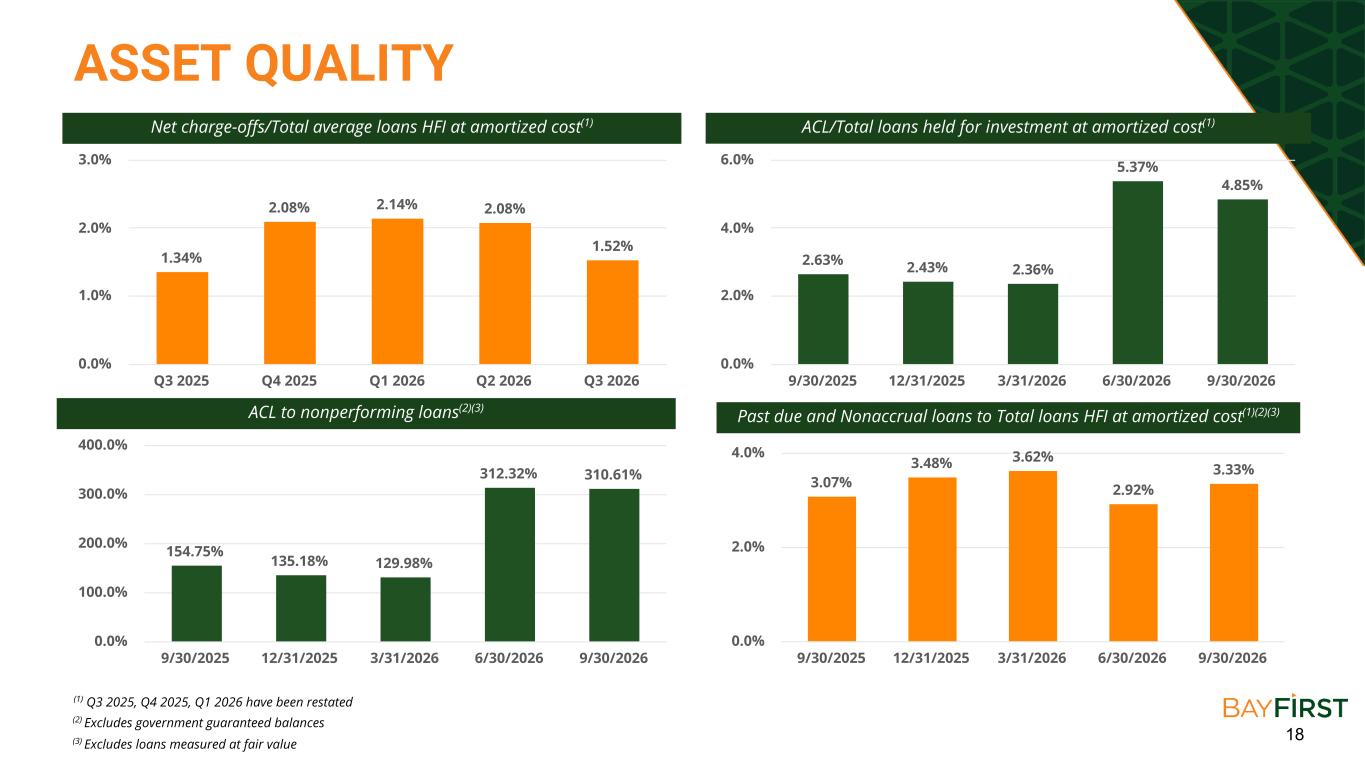
18 ASSET QUALITY 1.34% 2.08% 2.14% 2.08% 1.52% Q3 2025 Q4 2025 Q1 2026 Q2 2026 Q3 2026 0.0% 1.0% 2.0% 3.0% Net charge-offs/Total average loans HFI at amortized cost(1) ACL/Total loans held for investment at amortized cost(1) 2.63% 2.43% 2.36% 5.37% 4.85% 9/30/2025 12/31/2025 3/31/2026 6/30/2026 9/30/2026 0.0% 2.0% 4.0% 6.0% ACL to nonperforming loans(2)(3) Past due and Nonaccrual loans to Total loans HFI at amortized cost(1)(2)(3) 154.75% 135.18% 129.98% 312.32% 310.61% 9/30/2025 12/31/2025 3/31/2026 6/30/2026 9/30/2026 0.0% 100.0% 200.0% 300.0% 400.0% 3.07% 3.48% 3.62% 2.92% 3.33% 9/30/2025 12/31/2025 3/31/2026 6/30/2026 9/30/2026 0.0% 2.0% 4.0% (2) Excludes government guaranteed balances (3) Excludes loans measured at fair value (1) Q3 2025, Q4 2025, Q1 2026 have been restated
19 APPENDIX
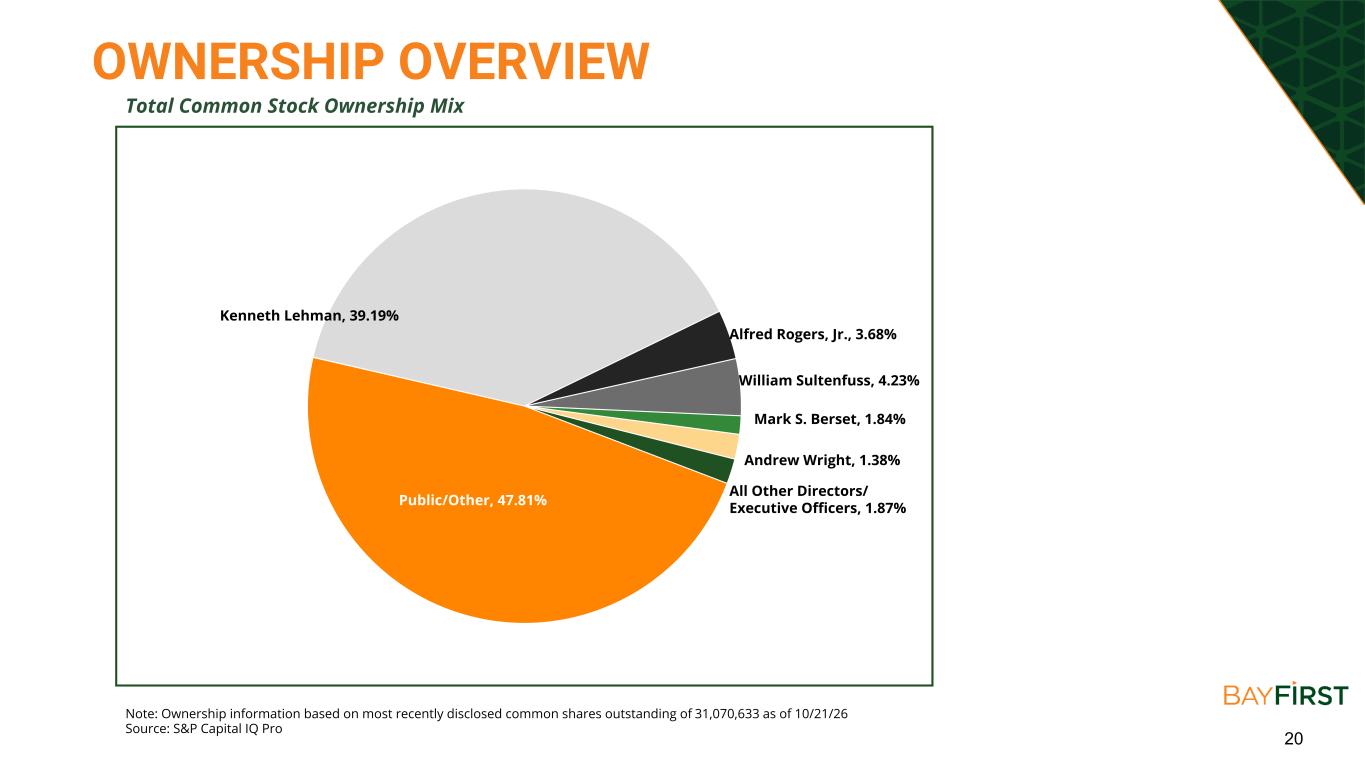
20 OWNERSHIP OVERVIEW Total Common Stock Ownership Mix Note: Ownership information based on most recently disclosed common shares outstanding of 31,070,633 as of 10/21/26 Source: S&P Capital IQ Pro Kenneth Lehman, 39.19% Alfred Rogers, Jr., 3.68% William Sultenfuss, 4.23% Andrew Wright, 1.38% Mark S. Berset, 1.84% All Other Directors/ Executive Officers, 1.87%Public/Other, 47.81%
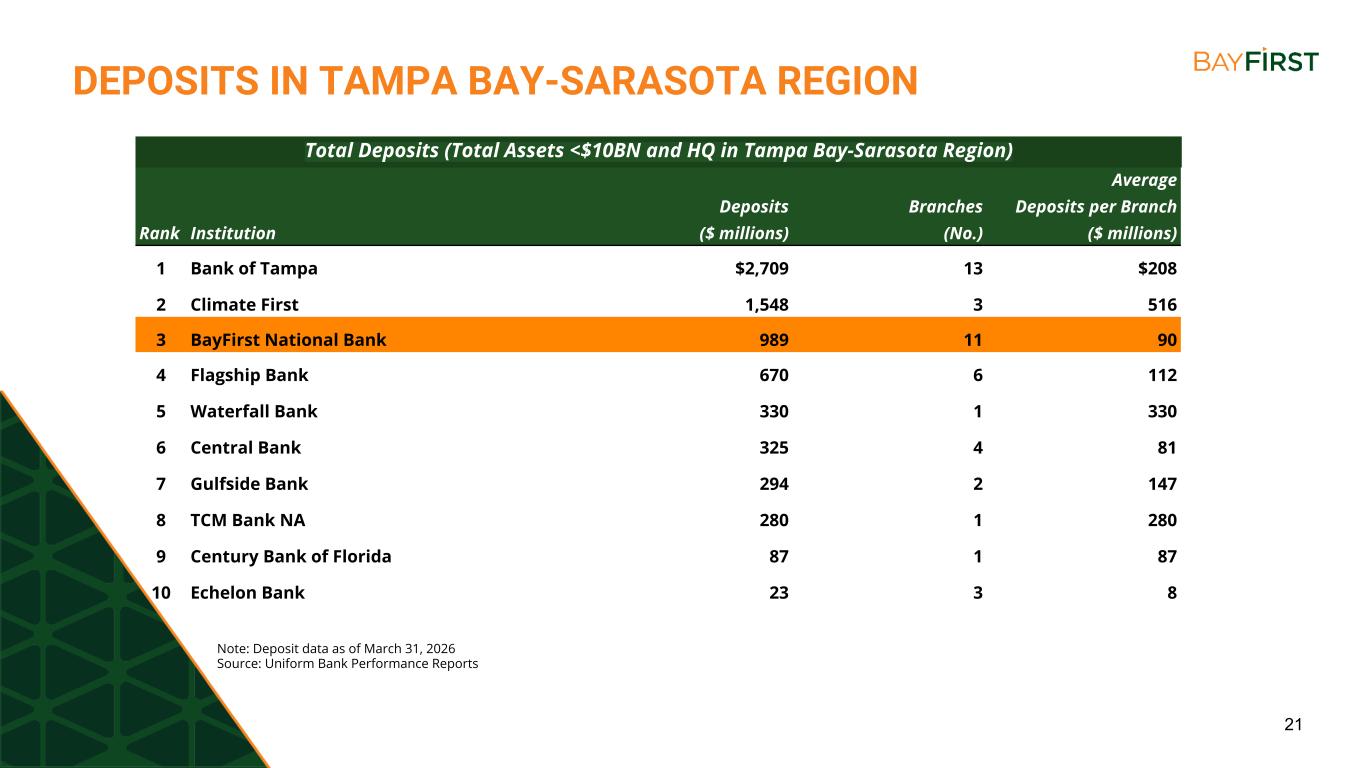
21 DEPOSITS IN TAMPA BAY-SARASOTA REGION Total Deposits (Total Assets <$10BN and HQ in Tampa Bay-Sarasota Region) Note: Deposit data as of March 31, 2026 Source: Uniform Bank Performance Reports Average Deposits Branches Deposits per Branch Rank Institution ($ millions) (No.) ($ millions) 1 Bank of Tampa $2,709 13 $208 2 Climate First 1,548 3 516 3 BayFirst National Bank 989 11 90 4 Flagship Bank 670 6 112 5 Waterfall Bank 330 1 330 6 Central Bank 325 4 81 7 Gulfside Bank 294 2 147 8 TCM Bank NA 280 1 280 9 Century Bank of Florida 87 1 87 10 Echelon Bank 23 3 8
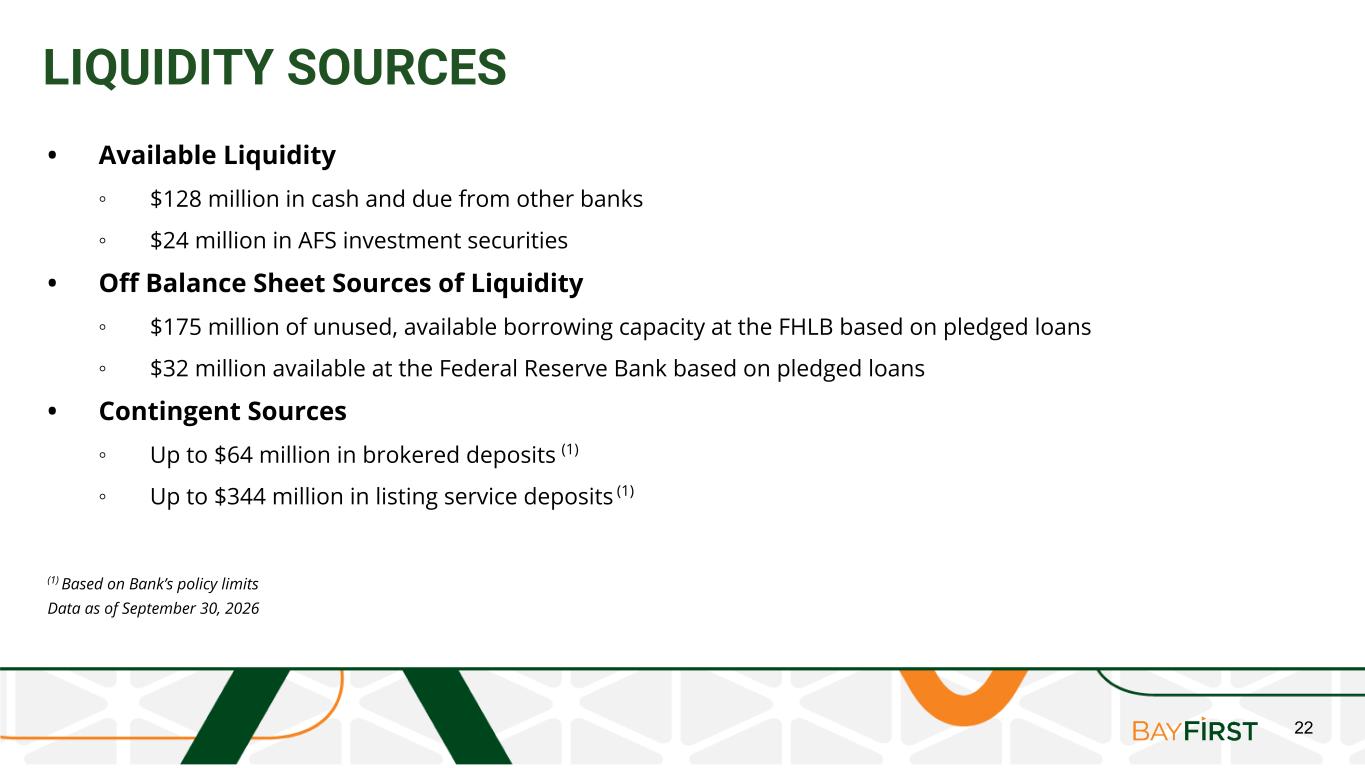
22 LIQUIDITY SOURCES • Available Liquidity ◦ $128 million in cash and due from other banks ◦ $24 million in AFS investment securities • Off Balance Sheet Sources of Liquidity ◦ $175 million of unused, available borrowing capacity at the FHLB based on pledged loans ◦ $32 million available at the Federal Reserve Bank based on pledged loans • Contingent Sources ◦ Up to $64 million in brokered deposits (1) ◦ Up to $344 million in listing service deposits (1) (1) Based on Bank’s policy limits Data as of September 30, 2026
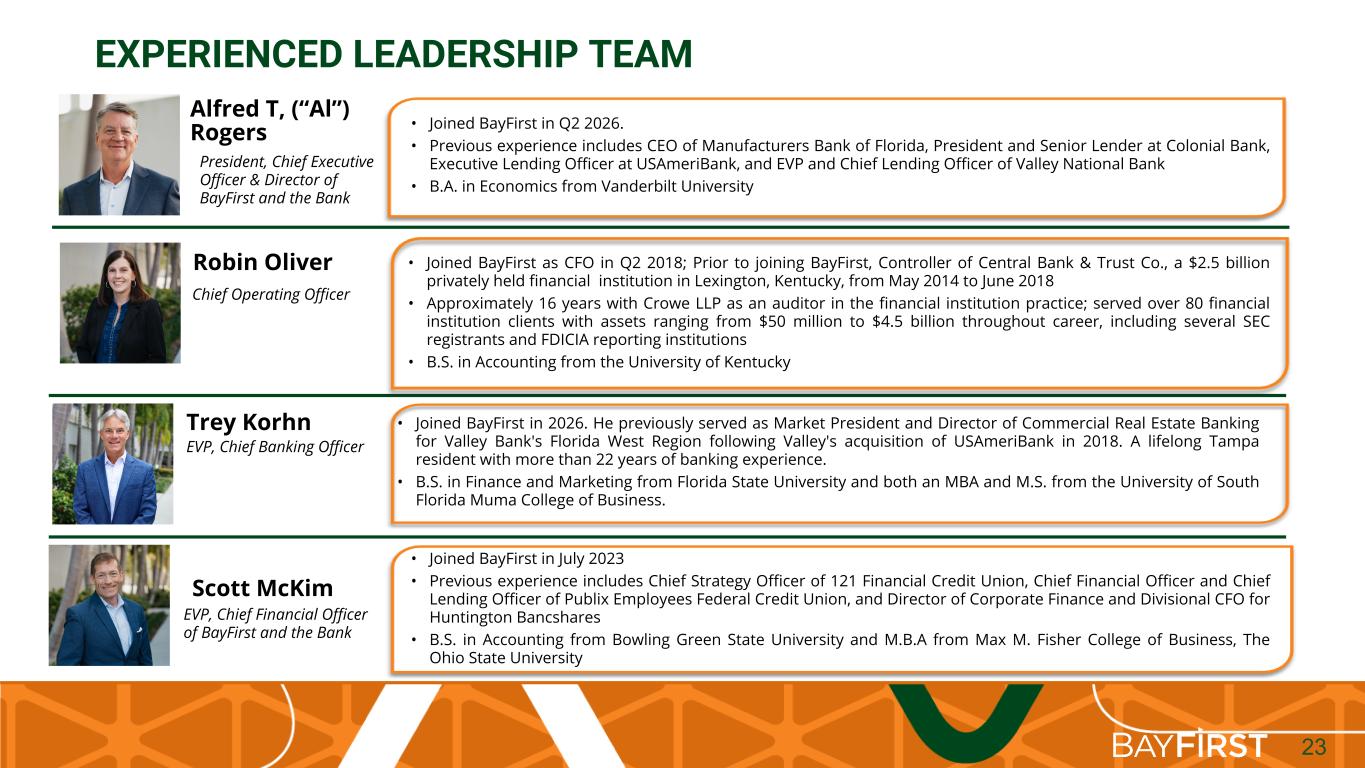
23 EXPERIENCED LEADERSHIP TEAM • Joined BayFirst as CFO in Q2 2018; Prior to joining BayFirst, Controller of Central Bank & Trust Co., a $2.5 billion privately held financial institution in Lexington, Kentucky, from May 2014 to June 2018 • Approximately 16 years with Crowe LLP as an auditor in the financial institution practice; served over 80 financial institution clients with assets ranging from $50 million to $4.5 billion throughout career, including several SEC registrants and FDICIA reporting institutions • B.S. in Accounting from the University of Kentucky • Joined BayFirst in Q2 2026. • Previous experience includes CEO of Manufacturers Bank of Florida, President and Senior Lender at Colonial Bank, Executive Lending Officer at USAmeriBank, and EVP and Chief Lending Officer of Valley National Bank • B.A. in Economics from Vanderbilt University Robin Oliver Alfred T, (“Al”) Rogers President, Chief Executive Officer & Director of BayFirst and the Bank Chief Operating Officer Scott McKim EVP, Chief Financial Officer of BayFirst and the Bank • Joined BayFirst in July 2023 • Previous experience includes Chief Strategy Officer of 121 Financial Credit Union, Chief Financial Officer and Chief Lending Officer of Publix Employees Federal Credit Union, and Director of Corporate Finance and Divisional CFO for Huntington Bancshares • B.S. in Accounting from Bowling Green State University and M.B.A from Max M. Fisher College of Business, The Ohio State University • Joined BayFirst in 2026. He previously served as Market President and Director of Commercial Real Estate Banking for Valley Bank's Florida West Region following Valley's acquisition of USAmeriBank in 2018. A lifelong Tampa resident with more than 22 years of banking experience. • B.S. in Finance and Marketing from Florida State University and both an MBA and M.S. from the University of South Florida Muma College of Business. Trey Korhn EVP, Chief Banking Officer
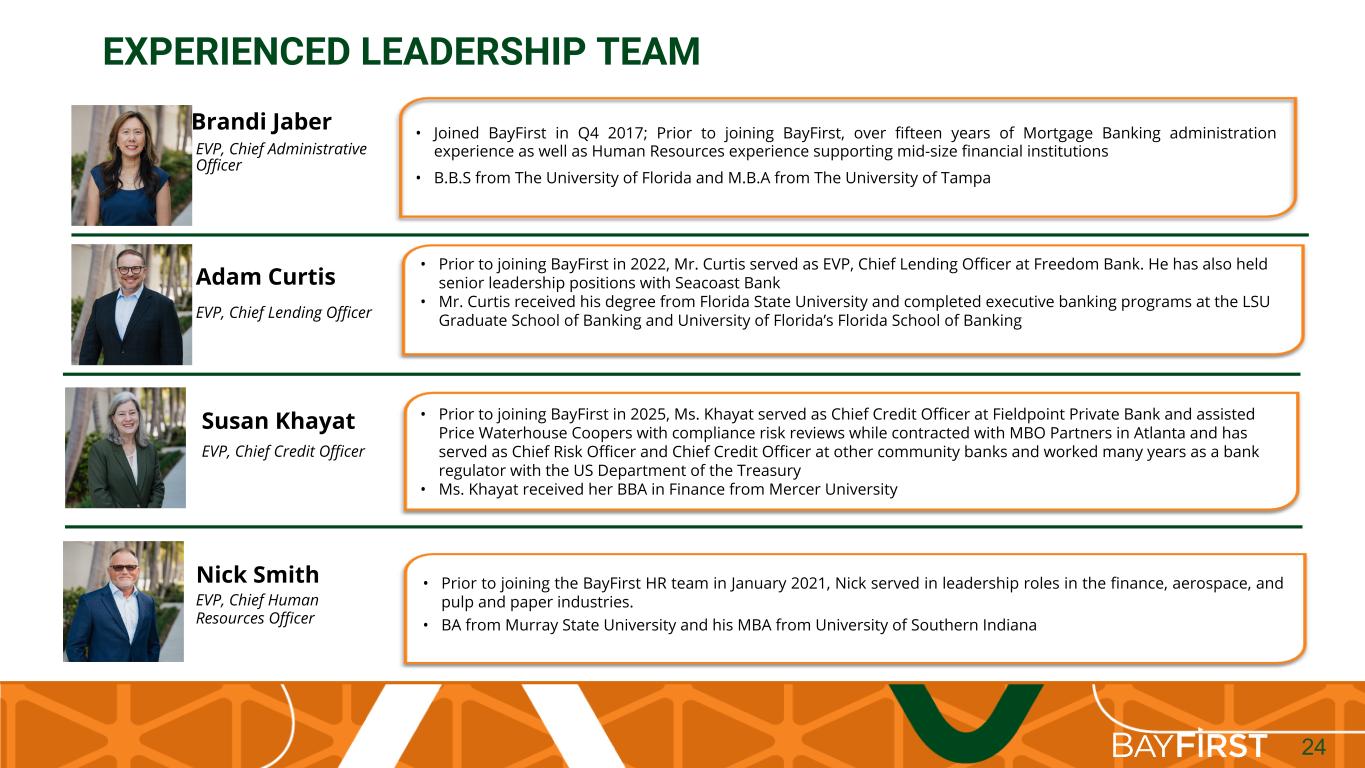
24 EXPERIENCED LEADERSHIP TEAM • Joined BayFirst in Q4 2017; Prior to joining BayFirst, over fifteen years of Mortgage Banking administration experience as well as Human Resources experience supporting mid-size financial institutions • B.B.S from The University of Florida and M.B.A from The University of Tampa Brandi Jaber Susan Khayat EVP, Chief Administrative Officer EVP, Chief Credit Officer Nick Smith EVP, Chief Human Resources Officer • Prior to joining the BayFirst HR team in January 2021, Nick served in leadership roles in the finance, aerospace, and pulp and paper industries. • BA from Murray State University and his MBA from University of Southern Indiana • Prior to joining BayFirst in 2025, Ms. Khayat served as Chief Credit Officer at Fieldpoint Private Bank and assisted Price Waterhouse Coopers with compliance risk reviews while contracted with MBO Partners in Atlanta and has served as Chief Risk Officer and Chief Credit Officer at other community banks and worked many years as a bank regulator with the US Department of the Treasury • Ms. Khayat received her BBA in Finance from Mercer University • Prior to joining BayFirst in 2022, Mr. Curtis served as EVP, Chief Lending Officer at Freedom Bank. He has also held senior leadership positions with Seacoast Bank • Mr. Curtis received his degree from Florida State University and completed executive banking programs at the LSU Graduate School of Banking and University of Florida’s Florida School of Banking Adam Curtis EVP, Chief Lending Officer