Shareholder Report
Aug. 31, 2026
USD ($)
Holding
What were the fund costs during the last year ?
(Based on a hypothetical $10,000 investment)
| Fund (Class) | Costs of a $10,000 investment | Costs paid as a percentage of a $10,000 investment |
| Equity Income Fund (Class C/JHERX) |
$204 | 1.83% |
Management’s Discussion of Fund Performance
SUMMARY OF RESULTS
Equity Income Fund (Class C/JHERX) returned 22.63% (excluding sales charges) for the year ended August 31, 2026. U.S. equities delivered a robust gain in the annual period, albeit with a brief stretch of weakness in March following the start of the conflict in Iran. Investors were encouraged by the highly favorable backdrop of healthy economic growth trends, strong corporate earnings, and supportive U.S. Federal Reserve policy. The value style outpaced the broader market, providing a tailwind for the fund.
TOP PERFORMANCE CONTRIBUTORS
Information technology | The fund’s holdings in the sector performed very well as a group and were the largest contributor to its absolute return. A number of semiconductor stocks benefiting from the artificial intelligence infrastructure buildout, including Samsung Electronics Company, Ltd., Applied Materials, Inc., Advanced Micro Devices, Inc., and Intel Corp., were the top contributors in both the sector and the fund as a whole.
Financials and health care | Citigroup, Inc. and Merck & Company, Inc. were key contributors in the two sectors, respectively.
Industrials and energy | The railway stock CSX Corp. was the top performer in industrials, and TotalEnergies SE led the way in energy.
TOP PERFORMANCE DETRACTORS
Real estate | Some of the fund’s positions in the sector finished with modest losses, due in part to rising long-term bond yields.
Consumer staples | Several holdings lost ground on concerns that the companies would be unable to pass along higher input costs to consumers. Kimberly-Clark Corp. was the largest detractor in the sector.
The views expressed in this report are those of the portfolio management team and are subject to change. They are not meant as investment advice.
Fund Performance
The following graph compares the initial and subsequent account values at the end of each of the most recently completed 10 fiscal years of the fund (or for the life of the fund, if shorter). It assumes a $10,000 initial investment in the fund and in an appropriate, broad-based securities market index for the same period.
GROWTH OF $10,000
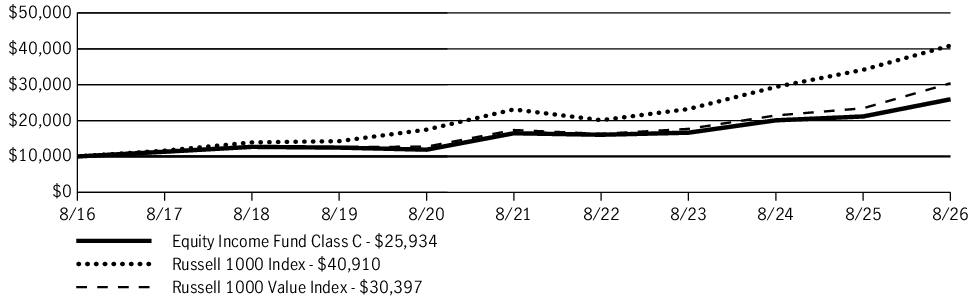
| AVERAGE ANNUAL TOTAL RETURN | 1 Year | 5 Years | 10 Years |
| Equity Income Fund (Class C/JHERX) | 21.84% | 9.51% | 10.00% |
| Equity Income Fund (Class C/JHERX)—excluding sales charge | 22.63% | 9.51% | 10.00% |
| Russell 1000 Index | 19.77% | 12.10% | 15.13% |
| Russell 1000 Value Index | 29.72% | 11.84% | 11.76% |
Fund Statistics
| Fund net assets | $513,534,492 |
| Total number of portfolio holdings | 117 |
| Total advisory fees paid (net) | $3,753,316 |
| Portfolio turnover rate | 30% |
Graphical Representation of Holdings
The tables below show the investment makeup of the fund, representing a percentage of the total net assets of the fund.
Top Ten Holdings
| Microsoft Corp. | 6.3% |
| Amazon.com, Inc. | 5.9% |
| Apple, Inc. | 4.3% |
| MetLife, Inc. | 2.2% |
| The Charles Schwab Corp. | 1.8% |
| JPMorgan Chase & Co. | 1.8% |
| TotalEnergies SE | 1.8% |
| The Southern Company | 1.7% |
| ConocoPhillips | 1.6% |
| Citigroup, Inc. | 1.6% |
Sector Composition
| Financials | 19.8% |
| Information technology | 16.8% |
| Health care | 13.5% |
| Industrials | 12.4% |
| Energy | 9.0% |
| Consumer discretionary | 7.9% |
| Consumer staples | 6.2% |
| Utilities | 4.9% |
| Materials | 3.2% |
| Real estate | 2.9% |
| Communication services | 2.7% |
| Short-term investments and other | 0.7% |
Holdings may not have been held by the fund for the entire period and are subject to change without notice. Portfolio composition is subject to review in accordance with the fund’s investment strategy and may vary in the future. Current and future portfolio holdings are subject to risk and may change at any time.
Top Ten Holdings
| Microsoft Corp. | 6.3% |
| Amazon.com, Inc. | 5.9% |
| Apple, Inc. | 4.3% |
| MetLife, Inc. | 2.2% |
| The Charles Schwab Corp. | 1.8% |
| JPMorgan Chase & Co. | 1.8% |
| TotalEnergies SE | 1.8% |
| The Southern Company | 1.7% |
| ConocoPhillips | 1.6% |
| Citigroup, Inc. | 1.6% |
What were the fund costs during the last year ?
(Based on a hypothetical $10,000 investment)
| Fund (Class) | Costs of a $10,000 investment | Costs paid as a percentage of a $10,000 investment |
| Equity Income Fund (Class A/JHEIX) |
$126 | 1.13% |
Management’s Discussion of Fund Performance
SUMMARY OF RESULTS
Equity Income Fund (Class A/JHEIX) returned 23.48% (excluding sales charges) for the year ended August 31, 2026. U.S. equities delivered a robust gain in the annual period, albeit with a brief stretch of weakness in March following the start of the conflict in Iran. Investors were encouraged by the highly favorable backdrop of healthy economic growth trends, strong corporate earnings, and supportive U.S. Federal Reserve policy. The value style outpaced the broader market, providing a tailwind for the fund.
TOP PERFORMANCE CONTRIBUTORS
Information technology | The fund’s holdings in the sector performed very well as a group and were the largest contributor to its absolute return. A number of semiconductor stocks benefiting from the artificial intelligence infrastructure buildout, including Samsung Electronics Company, Ltd., Applied Materials, Inc., Advanced Micro Devices, Inc., and Intel Corp., were the top contributors in both the sector and the fund as a whole.
Financials and health care | Citigroup, Inc. and Merck & Company, Inc. were key contributors in the two sectors, respectively.
Industrials and energy | The railway stock CSX Corp. was the top performer in industrials, and TotalEnergies SE led the way in energy.
TOP PERFORMANCE DETRACTORS
Real estate | Some of the fund’s positions in the sector finished with modest losses, due in part to rising long-term bond yields.
Consumer staples | Several holdings lost ground on concerns that the companies would be unable to pass along higher input costs to consumers. Kimberly-Clark Corp. was the largest detractor in the sector.
The views expressed in this report are those of the portfolio management team and are subject to change. They are not meant as investment advice.
Fund Performance
The following graph compares the initial and subsequent account values at the end of each of the most recently completed 10 fiscal years of the fund (or for the life of the fund, if shorter). It assumes a $10,000 initial investment in the fund and in an appropriate, broad-based securities market index for the same period.
GROWTH OF $10,000
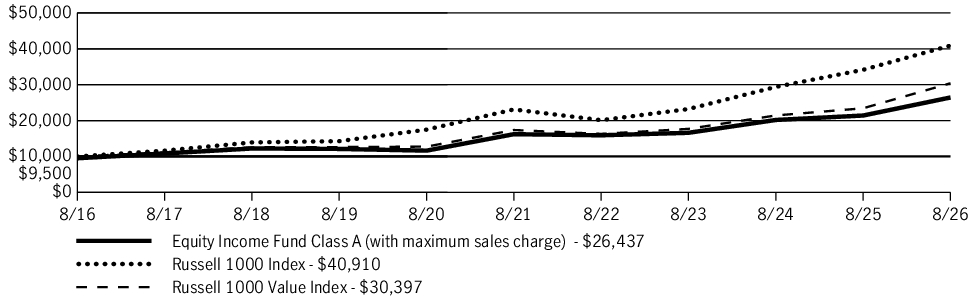
| AVERAGE ANNUAL TOTAL RETURN | 1 Year | 5 Years | 10 Years |
| Equity Income Fund (Class A/JHEIX) | 17.30% | 9.15% | 10.21% |
| Equity Income Fund (Class A/JHEIX)—excluding sales charge | 23.48% | 10.28% | 10.78% |
| Russell 1000 Index | 19.77% | 12.10% | 15.13% |
| Russell 1000 Value Index | 29.72% | 11.84% | 11.76% |
Fund Statistics
| Fund net assets | $513,534,492 |
| Total number of portfolio holdings | 117 |
| Total advisory fees paid (net) | $3,753,316 |
| Portfolio turnover rate | 30% |
Graphical Representation of Holdings
The tables below show the investment makeup of the fund, representing a percentage of the total net assets of the fund.
Top Ten Holdings
| Microsoft Corp. | 6.3% |
| Amazon.com, Inc. | 5.9% |
| Apple, Inc. | 4.3% |
| MetLife, Inc. | 2.2% |
| The Charles Schwab Corp. | 1.8% |
| JPMorgan Chase & Co. | 1.8% |
| TotalEnergies SE | 1.8% |
| The Southern Company | 1.7% |
| ConocoPhillips | 1.6% |
| Citigroup, Inc. | 1.6% |
Sector Composition
| Financials | 19.8% |
| Information technology | 16.8% |
| Health care | 13.5% |
| Industrials | 12.4% |
| Energy | 9.0% |
| Consumer discretionary | 7.9% |
| Consumer staples | 6.2% |
| Utilities | 4.9% |
| Materials | 3.2% |
| Real estate | 2.9% |
| Communication services | 2.7% |
| Short-term investments and other | 0.7% |
Holdings may not have been held by the fund for the entire period and are subject to change without notice. Portfolio composition is subject to review in accordance with the fund’s investment strategy and may vary in the future. Current and future portfolio holdings are subject to risk and may change at any time.
Top Ten Holdings
| Microsoft Corp. | 6.3% |
| Amazon.com, Inc. | 5.9% |
| Apple, Inc. | 4.3% |
| MetLife, Inc. | 2.2% |
| The Charles Schwab Corp. | 1.8% |
| JPMorgan Chase & Co. | 1.8% |
| TotalEnergies SE | 1.8% |
| The Southern Company | 1.7% |
| ConocoPhillips | 1.6% |
| Citigroup, Inc. | 1.6% |
What were the fund costs during the last year ?
(Based on a hypothetical $10,000 investment)
| Fund (Class) | Costs of a $10,000 investment | Costs paid as a percentage of a $10,000 investment |
| Equity Income Fund (Class 1/JIEMX) |
$86 | 0.77% |
Management’s Discussion of Fund Performance
SUMMARY OF RESULTS
Equity Income Fund (Class 1/JIEMX) returned 24.00% for the year ended August 31, 2026. U.S. equities delivered a robust gain in the annual period, albeit with a brief stretch of weakness in March following the start of the conflict in Iran. Investors were encouraged by the highly favorable backdrop of healthy economic growth trends, strong corporate earnings, and supportive U.S. Federal Reserve policy. The value style outpaced the broader market, providing a tailwind for the fund.
TOP PERFORMANCE CONTRIBUTORS
Information technology | The fund’s holdings in the sector performed very well as a group and were the largest contributor to its absolute return. A number of semiconductor stocks benefiting from the artificial intelligence infrastructure buildout, including Samsung Electronics Company, Ltd., Applied Materials, Inc., Advanced Micro Devices, Inc., and Intel Corp., were the top contributors in both the sector and the fund as a whole.
Financials and health care | Citigroup, Inc. and Merck & Company, Inc. were key contributors in the two sectors, respectively.
Industrials and energy | The railway stock CSX Corp. was the top performer in industrials, and TotalEnergies SE led the way in energy.
TOP PERFORMANCE DETRACTORS
Real estate | Some of the fund’s positions in the sector finished with modest losses, due in part to rising long-term bond yields.
Consumer staples | Several holdings lost ground on concerns that the companies would be unable to pass along higher input costs to consumers. Kimberly-Clark Corp. was the largest detractor in the sector.
The views expressed in this report are those of the portfolio management team and are subject to change. They are not meant as investment advice.
Fund Performance
The following graph compares the initial and subsequent account values at the end of each of the most recently completed 10 fiscal years of the fund (or for the life of the fund, if shorter). It assumes a $10,000 initial investment in the fund and in an appropriate, broad-based securities market index for the same period.
GROWTH OF $10,000
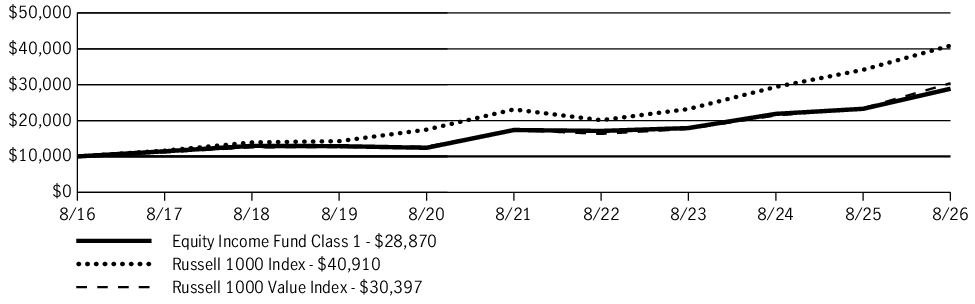
| AVERAGE ANNUAL TOTAL RETURN | 1 Year | 5 Years | 10 Years |
| Equity Income Fund (Class 1/JIEMX) | 24.00% | 10.70% | 11.18% |
| Russell 1000 Index | 19.77% | 12.10% | 15.13% |
| Russell 1000 Value Index | 29.72% | 11.84% | 11.76% |
Fund Statistics
| Fund net assets | $513,534,492 |
| Total number of portfolio holdings | 117 |
| Total advisory fees paid (net) | $3,753,316 |
| Portfolio turnover rate | 30% |
Graphical Representation of Holdings
The tables below show the investment makeup of the fund, representing a percentage of the total net assets of the fund.
Top Ten Holdings
| Microsoft Corp. | 6.3% |
| Amazon.com, Inc. | 5.9% |
| Apple, Inc. | 4.3% |
| MetLife, Inc. | 2.2% |
| The Charles Schwab Corp. | 1.8% |
| JPMorgan Chase & Co. | 1.8% |
| TotalEnergies SE | 1.8% |
| The Southern Company | 1.7% |
| ConocoPhillips | 1.6% |
| Citigroup, Inc. | 1.6% |
Sector Composition
| Financials | 19.8% |
| Information technology | 16.8% |
| Health care | 13.5% |
| Industrials | 12.4% |
| Energy | 9.0% |
| Consumer discretionary | 7.9% |
| Consumer staples | 6.2% |
| Utilities | 4.9% |
| Materials | 3.2% |
| Real estate | 2.9% |
| Communication services | 2.7% |
| Short-term investments and other | 0.7% |
Holdings may not have been held by the fund for the entire period and are subject to change without notice. Portfolio composition is subject to review in accordance with the fund’s investment strategy and may vary in the future. Current and future portfolio holdings are subject to risk and may change at any time.
Top Ten Holdings
| Microsoft Corp. | 6.3% |
| Amazon.com, Inc. | 5.9% |
| Apple, Inc. | 4.3% |
| MetLife, Inc. | 2.2% |
| The Charles Schwab Corp. | 1.8% |
| JPMorgan Chase & Co. | 1.8% |
| TotalEnergies SE | 1.8% |
| The Southern Company | 1.7% |
| ConocoPhillips | 1.6% |
| Citigroup, Inc. | 1.6% |
What were the fund costs during the last year ?
(Based on a hypothetical $10,000 investment)
| Fund (Class) | Costs of a $10,000 investment | Costs paid as a percentage of a $10,000 investment |
| Fundamental All Cap Core Fund (Class A/JFCAX) |
$116 | 1.12% |
Management’s Discussion of Fund Performance
SUMMARY OF RESULTS
Fundamental All Cap Core Fund (Class A/JFCAX) returned 7.10% (excluding sales charges) for the year ended August 31, 2026. Significant factors affecting fund performance during the period included a substantial rally for U.S. stocks, driven by stronger-than-expected corporate profits, positive economic growth, and the continuation of robust capital investment in artificial intelligence (AI) infrastructure.
TOP PERFORMANCE CONTRIBUTORS
Alphabet, Inc. | The online advertising and search company experienced strong growth in its cloud services business, resulting primarily from increasing AI workloads.
Taiwan Semiconductor Manufacturing Company, Ltd. | The chipmaker remained an indispensable component in the global semiconductor supply chain as AI-fueled demand remained robust.
Samsung Electronics Company, Ltd. | Growing global demand for high-bandwidth memory, particularly for usage in AI chips and data centers, helped boost this stock.
TOP PERFORMANCE DETRACTORS
Lennar Corp. | The homebuilder struggled due to a sluggish real estate market brought on by homebuyer affordability issues, including relatively high mortgage rates and stubbornly elevated home prices.
Group 1 Automotive, Inc. | Depressed auto sales volumes weighed on the stock of this car dealership group amid high vehicle prices and financing rates.
Workday, Inc. | The maker of human resources software came under pressure from fears about potential decelerating revenue growth due to competition from AI.
The views expressed in this report are those of the portfolio management team and are subject to change. They are not meant as investment advice.
Fund Performance
The following graph compares the initial and subsequent account values at the end of each of the most recently completed 10 fiscal years of the fund (or for the life of the fund, if shorter). It assumes a $10,000 initial investment in the fund and in an appropriate, broad-based securities market index for the same period.
GROWTH OF $10,000
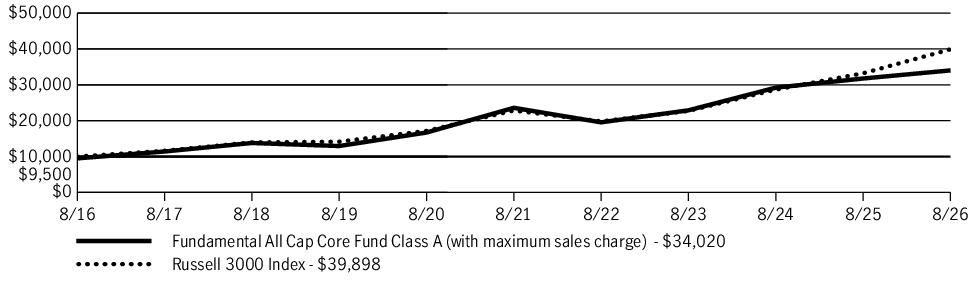
| AVERAGE ANNUAL TOTAL RETURN | 1 Year | 5 Years | 10 Years |
| Fundamental All Cap Core Fund (Class A/JFCAX) | 1.75% | 6.50% | 13.02% |
| Fundamental All Cap Core Fund (Class A/JFCAX)—excluding sales charge | 7.10% | 7.60% | 13.61% |
| Russell 3000 Index | 20.10% | 11.80% | 14.84% |
Fund Statistics
| Fund net assets | $433,735,105 |
| Total number of portfolio holdings | 49 |
| Total advisory fees paid (net) | $3,156,201 |
| Portfolio turnover rate | 42% |
Graphical Representation of Holdings
The tables below show the investment makeup of the fund, representing a percentage of the total net assets of the fund.
Top Ten Holdings
| Microsoft Corp. | 9.2% |
| Amazon.com, Inc. | 7.5% |
| Broadcom, Inc. | 4.5% |
| Alphabet, Inc., Class A | 4.5% |
| Meta Platforms, Inc., Class A | 4.4% |
| KKR & Company, Inc. | 4.4% |
| Taiwan Semiconductor Manufacturing Company, Ltd., ADR | 3.9% |
| NVIDIA Corp. | 3.7% |
| Roper Technologies, Inc. | 3.2% |
| Cheniere Energy, Inc. | 2.8% |
Sector Composition
| Information technology | 32.1% |
| Consumer discretionary | 17.1% |
| Communication services | 14.5% |
| Health care | 13.9% |
| Financials | 8.6% |
| Industrials | 5.2% |
| Energy | 2.8% |
| Real estate | 2.7% |
| Materials | 1.7% |
| Consumer staples | 1.0% |
| Short-term investments and other | 0.4% |
Holdings may not have been held by the fund for the entire period and are subject to change without notice. Portfolio composition is subject to review in accordance with the fund’s investment strategy and may vary in the future. Current and future portfolio holdings are subject to risk and may change at any time.
Top Ten Holdings
| Microsoft Corp. | 9.2% |
| Amazon.com, Inc. | 7.5% |
| Broadcom, Inc. | 4.5% |
| Alphabet, Inc., Class A | 4.5% |
| Meta Platforms, Inc., Class A | 4.4% |
| KKR & Company, Inc. | 4.4% |
| Taiwan Semiconductor Manufacturing Company, Ltd., ADR | 3.9% |
| NVIDIA Corp. | 3.7% |
| Roper Technologies, Inc. | 3.2% |
| Cheniere Energy, Inc. | 2.8% |
What were the fund costs during the last year ?
(Based on a hypothetical $10,000 investment)
| Fund (Class) | Costs of a $10,000 investment | Costs paid as a percentage of a $10,000 investment |
| Fundamental All Cap Core Fund (Class C/JFCCX) |
$188 | 1.82% |
Management’s Discussion of Fund Performance
SUMMARY OF RESULTS
Fundamental All Cap Core Fund (Class C/JFCCX) returned 6.33% (excluding sales charges) for the year ended August 31, 2026. Significant factors affecting fund performance during the period included a substantial rally for U.S. stocks, driven by stronger-than-expected corporate profits, positive economic growth, and the continuation of robust capital investment in artificial intelligence (AI) infrastructure.
TOP PERFORMANCE CONTRIBUTORS
Alphabet, Inc. | The online advertising and search company experienced strong growth in its cloud services business, resulting primarily from increasing AI workloads.
Taiwan Semiconductor Manufacturing Company, Ltd. | The chipmaker remained an indispensable component in the global semiconductor supply chain as AI-fueled demand remained robust.
Samsung Electronics Company, Ltd. | Growing global demand for high-bandwidth memory, particularly for usage in AI chips and data centers, helped boost this stock.
TOP PERFORMANCE DETRACTORS
Lennar Corp. | The homebuilder struggled due to a sluggish real estate market brought on by homebuyer affordability issues, including relatively high mortgage rates and stubbornly elevated home prices.
Group 1 Automotive, Inc. | Depressed auto sales volumes weighed on the stock of this car dealership group amid high vehicle prices and financing rates.
Workday, Inc. | The maker of human resources software came under pressure from fears about potential decelerating revenue growth due to competition from AI.
The views expressed in this report are those of the portfolio management team and are subject to change. They are not meant as investment advice.
Fund Performance
The following graph compares the initial and subsequent account values at the end of each of the most recently completed 10 fiscal years of the fund (or for the life of the fund, if shorter). It assumes a $10,000 initial investment in the fund and in an appropriate, broad-based securities market index for the same period.
GROWTH OF $10,000
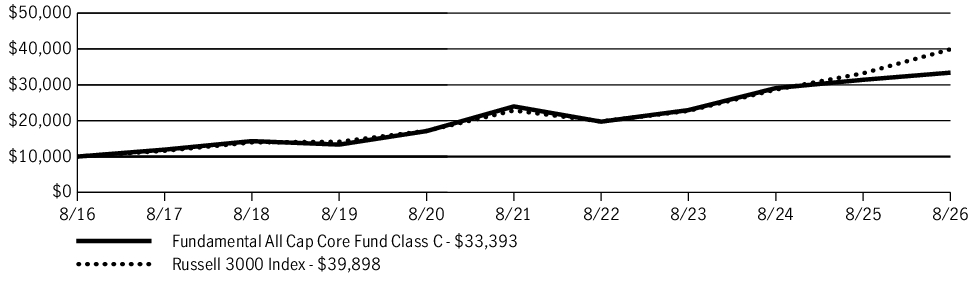
| AVERAGE ANNUAL TOTAL RETURN | 1 Year | 5 Years | 10 Years |
| Fundamental All Cap Core Fund (Class C/JFCCX) | 5.38% | 6.84% | 12.81% |
| Fundamental All Cap Core Fund (Class C/JFCCX)—excluding sales charge | 6.33% | 6.84% | 12.81% |
| Russell 3000 Index | 20.10% | 11.80% | 14.84% |
Fund Statistics
| Fund net assets | $433,735,105 |
| Total number of portfolio holdings | 49 |
| Total advisory fees paid (net) | $3,156,201 |
| Portfolio turnover rate | 42% |
Graphical Representation of Holdings
The tables below show the investment makeup of the fund, representing a percentage of the total net assets of the fund.
Top Ten Holdings
| Microsoft Corp. | 9.2% |
| Amazon.com, Inc. | 7.5% |
| Broadcom, Inc. | 4.5% |
| Alphabet, Inc., Class A | 4.5% |
| Meta Platforms, Inc., Class A | 4.4% |
| KKR & Company, Inc. | 4.4% |
| Taiwan Semiconductor Manufacturing Company, Ltd., ADR | 3.9% |
| NVIDIA Corp. | 3.7% |
| Roper Technologies, Inc. | 3.2% |
| Cheniere Energy, Inc. | 2.8% |
Sector Composition
| Information technology | 32.1% |
| Consumer discretionary | 17.1% |
| Communication services | 14.5% |
| Health care | 13.9% |
| Financials | 8.6% |
| Industrials | 5.2% |
| Energy | 2.8% |
| Real estate | 2.7% |
| Materials | 1.7% |
| Consumer staples | 1.0% |
| Short-term investments and other | 0.4% |
Holdings may not have been held by the fund for the entire period and are subject to change without notice. Portfolio composition is subject to review in accordance with the fund’s investment strategy and may vary in the future. Current and future portfolio holdings are subject to risk and may change at any time.
Top Ten Holdings
| Microsoft Corp. | 9.2% |
| Amazon.com, Inc. | 7.5% |
| Broadcom, Inc. | 4.5% |
| Alphabet, Inc., Class A | 4.5% |
| Meta Platforms, Inc., Class A | 4.4% |
| KKR & Company, Inc. | 4.4% |
| Taiwan Semiconductor Manufacturing Company, Ltd., ADR | 3.9% |
| NVIDIA Corp. | 3.7% |
| Roper Technologies, Inc. | 3.2% |
| Cheniere Energy, Inc. | 2.8% |
What were the fund costs during the last year ?
(Based on a hypothetical $10,000 investment)
| Fund (Class) | Costs of a $10,000 investment | Costs paid as a percentage of a $10,000 investment |
| Fundamental All Cap Core Fund (Class I/JFCIX) |
$85 | 0.82% |
Management’s Discussion of Fund Performance
SUMMARY OF RESULTS
Fundamental All Cap Core Fund (Class I/JFCIX) returned 7.39% for the year ended August 31, 2026. Significant factors affecting fund performance during the period included a substantial rally for U.S. stocks, driven by stronger-than-expected corporate profits, positive economic growth, and the continuation of robust capital investment in artificial intelligence (AI) infrastructure.
TOP PERFORMANCE CONTRIBUTORS
Alphabet, Inc. | The online advertising and search company experienced strong growth in its cloud services business, resulting primarily from increasing AI workloads.
Taiwan Semiconductor Manufacturing Company, Ltd. | The chipmaker remained an indispensable component in the global semiconductor supply chain as AI-fueled demand remained robust.
Samsung Electronics Company, Ltd. | Growing global demand for high-bandwidth memory, particularly for usage in AI chips and data centers, helped boost this stock.
TOP PERFORMANCE DETRACTORS
Lennar Corp. | The homebuilder struggled due to a sluggish real estate market brought on by homebuyer affordability issues, including relatively high mortgage rates and stubbornly elevated home prices.
Group 1 Automotive, Inc. | Depressed auto sales volumes weighed on the stock of this car dealership group amid high vehicle prices and financing rates.
Workday, Inc. | The maker of human resources software came under pressure from fears about potential decelerating revenue growth due to competition from AI.
The views expressed in this report are those of the portfolio management team and are subject to change. They are not meant as investment advice.
Fund Performance
The following graph compares the initial and subsequent account values at the end of each of the most recently completed 10 fiscal years of the fund (or for the life of the fund, if shorter). It assumes a $250,000 initial investment in the fund and in an appropriate, broad-based securities market index for the same period.
GROWTH OF $250,000
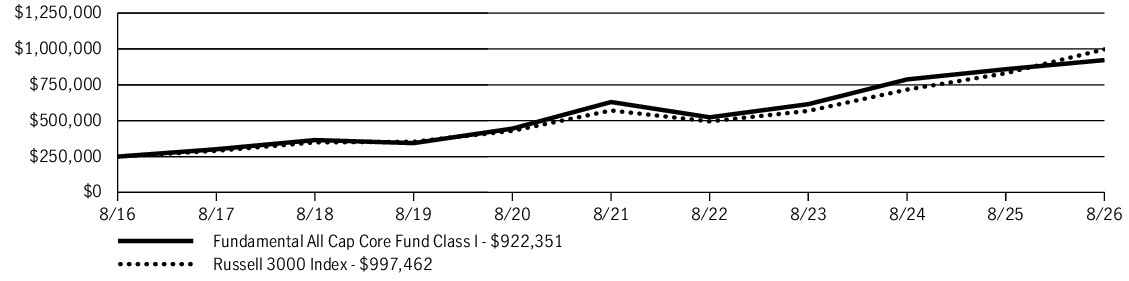
| AVERAGE ANNUAL TOTAL RETURN | 1 Year | 5 Years | 10 Years |
| Fundamental All Cap Core Fund (Class I/JFCIX) | 7.39% | 7.91% | 13.95% |
| Russell 3000 Index | 20.10% | 11.80% | 14.84% |
Fund Statistics
| Fund net assets | $433,735,105 |
| Total number of portfolio holdings | 49 |
| Total advisory fees paid (net) | $3,156,201 |
| Portfolio turnover rate | 42% |
Graphical Representation of Holdings
The tables below show the investment makeup of the fund, representing a percentage of the total net assets of the fund.
Top Ten Holdings
| Microsoft Corp. | 9.2% |
| Amazon.com, Inc. | 7.5% |
| Broadcom, Inc. | 4.5% |
| Alphabet, Inc., Class A | 4.5% |
| Meta Platforms, Inc., Class A | 4.4% |
| KKR & Company, Inc. | 4.4% |
| Taiwan Semiconductor Manufacturing Company, Ltd., ADR | 3.9% |
| NVIDIA Corp. | 3.7% |
| Roper Technologies, Inc. | 3.2% |
| Cheniere Energy, Inc. | 2.8% |
Sector Composition
| Information technology | 32.1% |
| Consumer discretionary | 17.1% |
| Communication services | 14.5% |
| Health care | 13.9% |
| Financials | 8.6% |
| Industrials | 5.2% |
| Energy | 2.8% |
| Real estate | 2.7% |
| Materials | 1.7% |
| Consumer staples | 1.0% |
| Short-term investments and other | 0.4% |
Holdings may not have been held by the fund for the entire period and are subject to change without notice. Portfolio composition is subject to review in accordance with the fund’s investment strategy and may vary in the future. Current and future portfolio holdings are subject to risk and may change at any time.
Top Ten Holdings
| Microsoft Corp. | 9.2% |
| Amazon.com, Inc. | 7.5% |
| Broadcom, Inc. | 4.5% |
| Alphabet, Inc., Class A | 4.5% |
| Meta Platforms, Inc., Class A | 4.4% |
| KKR & Company, Inc. | 4.4% |
| Taiwan Semiconductor Manufacturing Company, Ltd., ADR | 3.9% |
| NVIDIA Corp. | 3.7% |
| Roper Technologies, Inc. | 3.2% |
| Cheniere Energy, Inc. | 2.8% |
What were the fund costs during the last year ?
(Based on a hypothetical $10,000 investment)
| Fund (Class) | Costs of a $10,000 investment | Costs paid as a percentage of a $10,000 investment |
| Fundamental All Cap Core Fund (Class R2/JFACX) |
$125 | 1.21% |
Management’s Discussion of Fund Performance
SUMMARY OF RESULTS
Fundamental All Cap Core Fund (Class R2/JFACX) returned 6.97% for the year ended August 31, 2026. Significant factors affecting fund performance during the period included a substantial rally for U.S. stocks, driven by stronger-than-expected corporate profits, positive economic growth, and the continuation of robust capital investment in artificial intelligence (AI) infrastructure.
TOP PERFORMANCE CONTRIBUTORS
Alphabet, Inc. | The online advertising and search company experienced strong growth in its cloud services business, resulting primarily from increasing AI workloads.
Taiwan Semiconductor Manufacturing Company, Ltd. | The chipmaker remained an indispensable component in the global semiconductor supply chain as AI-fueled demand remained robust.
Samsung Electronics Company, Ltd. | Growing global demand for high-bandwidth memory, particularly for usage in AI chips and data centers, helped boost this stock.
TOP PERFORMANCE DETRACTORS
Lennar Corp. | The homebuilder struggled due to a sluggish real estate market brought on by homebuyer affordability issues, including relatively high mortgage rates and stubbornly elevated home prices.
Group 1 Automotive, Inc. | Depressed auto sales volumes weighed on the stock of this car dealership group amid high vehicle prices and financing rates.
Workday, Inc. | The maker of human resources software came under pressure from fears about potential decelerating revenue growth due to competition from AI.
The views expressed in this report are those of the portfolio management team and are subject to change. They are not meant as investment advice.
Fund Performance
The following graph compares the initial and subsequent account values at the end of each of the most recently completed 10 fiscal years of the fund (or for the life of the fund, if shorter). It assumes a $10,000 initial investment in the fund and in an appropriate, broad-based securities market index for the same period.
GROWTH OF $10,000
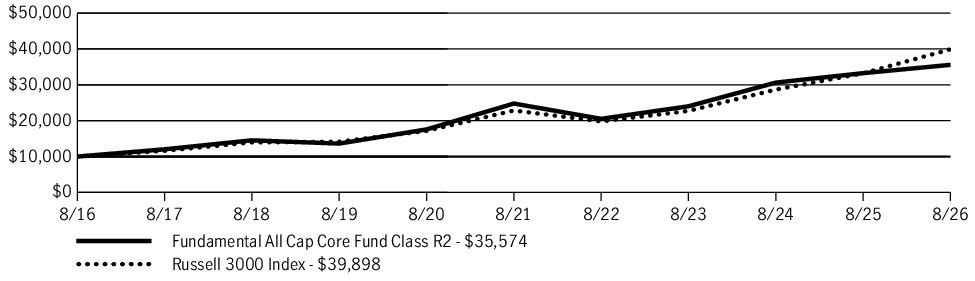
| AVERAGE ANNUAL TOTAL RETURN | 1 Year | 5 Years | 10 Years |
| Fundamental All Cap Core Fund (Class R2/JFACX) | 6.97% | 7.50% | 13.53% |
| Russell 3000 Index | 20.10% | 11.80% | 14.84% |
Fund Statistics
| Fund net assets | $433,735,105 |
| Total number of portfolio holdings | 49 |
| Total advisory fees paid (net) | $3,156,201 |
| Portfolio turnover rate | 42% |
Graphical Representation of Holdings
The tables below show the investment makeup of the fund, representing a percentage of the total net assets of the fund.
Top Ten Holdings
| Microsoft Corp. | 9.2% |
| Amazon.com, Inc. | 7.5% |
| Broadcom, Inc. | 4.5% |
| Alphabet, Inc., Class A | 4.5% |
| Meta Platforms, Inc., Class A | 4.4% |
| KKR & Company, Inc. | 4.4% |
| Taiwan Semiconductor Manufacturing Company, Ltd., ADR | 3.9% |
| NVIDIA Corp. | 3.7% |
| Roper Technologies, Inc. | 3.2% |
| Cheniere Energy, Inc. | 2.8% |
Sector Composition
| Information technology | 32.1% |
| Consumer discretionary | 17.1% |
| Communication services | 14.5% |
| Health care | 13.9% |
| Financials | 8.6% |
| Industrials | 5.2% |
| Energy | 2.8% |
| Real estate | 2.7% |
| Materials | 1.7% |
| Consumer staples | 1.0% |
| Short-term investments and other | 0.4% |
Holdings may not have been held by the fund for the entire period and are subject to change without notice. Portfolio composition is subject to review in accordance with the fund’s investment strategy and may vary in the future. Current and future portfolio holdings are subject to risk and may change at any time.
Top Ten Holdings
| Microsoft Corp. | 9.2% |
| Amazon.com, Inc. | 7.5% |
| Broadcom, Inc. | 4.5% |
| Alphabet, Inc., Class A | 4.5% |
| Meta Platforms, Inc., Class A | 4.4% |
| KKR & Company, Inc. | 4.4% |
| Taiwan Semiconductor Manufacturing Company, Ltd., ADR | 3.9% |
| NVIDIA Corp. | 3.7% |
| Roper Technologies, Inc. | 3.2% |
| Cheniere Energy, Inc. | 2.8% |
What were the fund costs during the last year ?
(Based on a hypothetical $10,000 investment)
| Fund (Class) | Costs of a $10,000 investment | Costs paid as a percentage of a $10,000 investment |
| Fundamental All Cap Core Fund (Class R4/JFARX) |
$99 | 0.96% |
Management’s Discussion of Fund Performance
SUMMARY OF RESULTS
Fundamental All Cap Core Fund (Class R4/JFARX) returned 7.27% for the year ended August 31, 2026. Significant factors affecting fund performance during the period included a substantial rally for U.S. stocks, driven by stronger-than-expected corporate profits, positive economic growth, and the continuation of robust capital investment in artificial intelligence (AI) infrastructure.
TOP PERFORMANCE CONTRIBUTORS
Alphabet, Inc. | The online advertising and search company experienced strong growth in its cloud services business, resulting primarily from increasing AI workloads.
Taiwan Semiconductor Manufacturing Company, Ltd. | The chipmaker remained an indispensable component in the global semiconductor supply chain as AI-fueled demand remained robust.
Samsung Electronics Company, Ltd. | Growing global demand for high-bandwidth memory, particularly for usage in AI chips and data centers, helped boost this stock.
TOP PERFORMANCE DETRACTORS
Lennar Corp. | The homebuilder struggled due to a sluggish real estate market brought on by homebuyer affordability issues, including relatively high mortgage rates and stubbornly elevated home prices.
Group 1 Automotive, Inc. | Depressed auto sales volumes weighed on the stock of this car dealership group amid high vehicle prices and financing rates.
Workday, Inc. | The maker of human resources software came under pressure from fears about potential decelerating revenue growth due to competition from AI.
The views expressed in this report are those of the portfolio management team and are subject to change. They are not meant as investment advice.
Fund Performance
The following graph compares the initial and subsequent account values at the end of each of the most recently completed 10 fiscal years of the fund (or for the life of the fund, if shorter). It assumes a $10,000 initial investment in the fund and in an appropriate, broad-based securities market index for the same period.
GROWTH OF $10,000
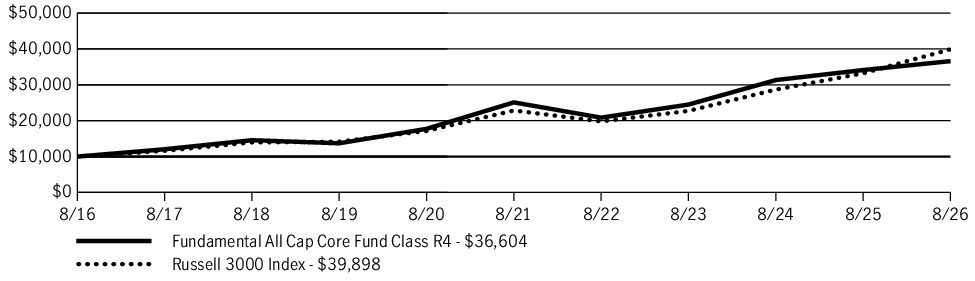
| AVERAGE ANNUAL TOTAL RETURN | 1 Year | 5 Years | 10 Years |
| Fundamental All Cap Core Fund (Class R4/JFARX) | 7.27% | 7.83% | 13.86% |
| Russell 3000 Index | 20.10% | 11.80% | 14.84% |
Fund Statistics
| Fund net assets | $433,735,105 |
| Total number of portfolio holdings | 49 |
| Total advisory fees paid (net) | $3,156,201 |
| Portfolio turnover rate | 42% |
Graphical Representation of Holdings
The tables below show the investment makeup of the fund, representing a percentage of the total net assets of the fund.
Top Ten Holdings
| Microsoft Corp. | 9.2% |
| Amazon.com, Inc. | 7.5% |
| Broadcom, Inc. | 4.5% |
| Alphabet, Inc., Class A | 4.5% |
| Meta Platforms, Inc., Class A | 4.4% |
| KKR & Company, Inc. | 4.4% |
| Taiwan Semiconductor Manufacturing Company, Ltd., ADR | 3.9% |
| NVIDIA Corp. | 3.7% |
| Roper Technologies, Inc. | 3.2% |
| Cheniere Energy, Inc. | 2.8% |
Sector Composition
| Information technology | 32.1% |
| Consumer discretionary | 17.1% |
| Communication services | 14.5% |
| Health care | 13.9% |
| Financials | 8.6% |
| Industrials | 5.2% |
| Energy | 2.8% |
| Real estate | 2.7% |
| Materials | 1.7% |
| Consumer staples | 1.0% |
| Short-term investments and other | 0.4% |
Holdings may not have been held by the fund for the entire period and are subject to change without notice. Portfolio composition is subject to review in accordance with the fund’s investment strategy and may vary in the future. Current and future portfolio holdings are subject to risk and may change at any time.
Top Ten Holdings
| Microsoft Corp. | 9.2% |
| Amazon.com, Inc. | 7.5% |
| Broadcom, Inc. | 4.5% |
| Alphabet, Inc., Class A | 4.5% |
| Meta Platforms, Inc., Class A | 4.4% |
| KKR & Company, Inc. | 4.4% |
| Taiwan Semiconductor Manufacturing Company, Ltd., ADR | 3.9% |
| NVIDIA Corp. | 3.7% |
| Roper Technologies, Inc. | 3.2% |
| Cheniere Energy, Inc. | 2.8% |
What were the fund costs during the last year ?
(Based on a hypothetical $10,000 investment)
| Fund (Class) | Costs of a $10,000 investment | Costs paid as a percentage of a $10,000 investment |
| Fundamental All Cap Core Fund (Class R6/JFAIX) |
$75 | 0.72% |
Management’s Discussion of Fund Performance
SUMMARY OF RESULTS
Fundamental All Cap Core Fund (Class R6/JFAIX) returned 7.51% for the year ended August 31, 2026. Significant factors affecting fund performance during the period included a substantial rally for U.S. stocks, driven by stronger-than-expected corporate profits, positive economic growth, and the continuation of robust capital investment in artificial intelligence (AI) infrastructure.
TOP PERFORMANCE CONTRIBUTORS
Alphabet, Inc. | The online advertising and search company experienced strong growth in its cloud services business, resulting primarily from increasing AI workloads.
Taiwan Semiconductor Manufacturing Company, Ltd. | The chipmaker remained an indispensable component in the global semiconductor supply chain as AI-fueled demand remained robust.
Samsung Electronics Company, Ltd. | Growing global demand for high-bandwidth memory, particularly for usage in AI chips and data centers, helped boost this stock.
TOP PERFORMANCE DETRACTORS
Lennar Corp. | The homebuilder struggled due to a sluggish real estate market brought on by homebuyer affordability issues, including relatively high mortgage rates and stubbornly elevated home prices.
Group 1 Automotive, Inc. | Depressed auto sales volumes weighed on the stock of this car dealership group amid high vehicle prices and financing rates.
Workday, Inc. | The maker of human resources software came under pressure from fears about potential decelerating revenue growth due to competition from AI.
The views expressed in this report are those of the portfolio management team and are subject to change. They are not meant as investment advice.
Fund Performance
The following graph compares the initial and subsequent account values at the end of each of the most recently completed 10 fiscal years of the fund (or for the life of the fund, if shorter). It assumes a $1,000,000 initial investment in the fund and in an appropriate, broad-based securities market index for the same period.
GROWTH OF $1,000,000
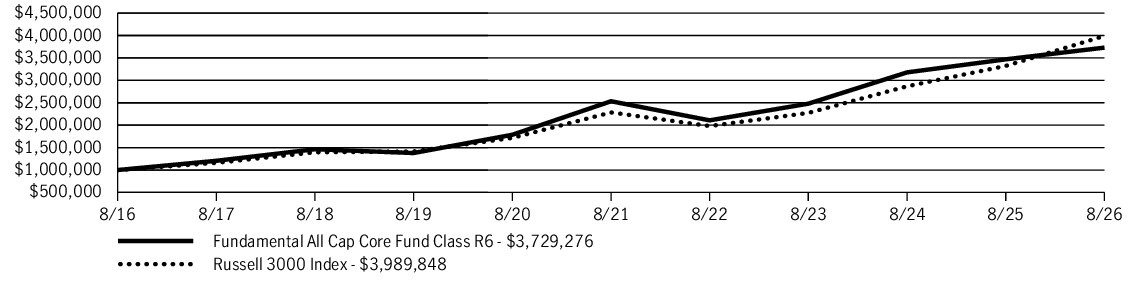
| AVERAGE ANNUAL TOTAL RETURN | 1 Year | 5 Years | 10 Years |
| Fundamental All Cap Core Fund (Class R6/JFAIX) | 7.51% | 8.04% | 14.07% |
| Russell 3000 Index | 20.10% | 11.80% | 14.84% |
Fund Statistics
| Fund net assets | $433,735,105 |
| Total number of portfolio holdings | 49 |
| Total advisory fees paid (net) | $3,156,201 |
| Portfolio turnover rate | 42% |
Graphical Representation of Holdings
The tables below show the investment makeup of the fund, representing a percentage of the total net assets of the fund.
Top Ten Holdings
| Microsoft Corp. | 9.2% |
| Amazon.com, Inc. | 7.5% |
| Broadcom, Inc. | 4.5% |
| Alphabet, Inc., Class A | 4.5% |
| Meta Platforms, Inc., Class A | 4.4% |
| KKR & Company, Inc. | 4.4% |
| Taiwan Semiconductor Manufacturing Company, Ltd., ADR | 3.9% |
| NVIDIA Corp. | 3.7% |
| Roper Technologies, Inc. | 3.2% |
| Cheniere Energy, Inc. | 2.8% |
Sector Composition
| Information technology | 32.1% |
| Consumer discretionary | 17.1% |
| Communication services | 14.5% |
| Health care | 13.9% |
| Financials | 8.6% |
| Industrials | 5.2% |
| Energy | 2.8% |
| Real estate | 2.7% |
| Materials | 1.7% |
| Consumer staples | 1.0% |
| Short-term investments and other | 0.4% |
Holdings may not have been held by the fund for the entire period and are subject to change without notice. Portfolio composition is subject to review in accordance with the fund’s investment strategy and may vary in the future. Current and future portfolio holdings are subject to risk and may change at any time.
Top Ten Holdings
| Microsoft Corp. | 9.2% |
| Amazon.com, Inc. | 7.5% |
| Broadcom, Inc. | 4.5% |
| Alphabet, Inc., Class A | 4.5% |
| Meta Platforms, Inc., Class A | 4.4% |
| KKR & Company, Inc. | 4.4% |
| Taiwan Semiconductor Manufacturing Company, Ltd., ADR | 3.9% |
| NVIDIA Corp. | 3.7% |
| Roper Technologies, Inc. | 3.2% |
| Cheniere Energy, Inc. | 2.8% |
What were the fund costs during the last year ?
(Based on a hypothetical $10,000 investment)
| Fund (Class) | Costs of a $10,000 investment | Costs paid as a percentage of a $10,000 investment |
| Multi-Asset Absolute Return Fund (Class R6/JHASX) |
$136 | 1.33% |
Management’s Discussion of Fund Performance
SUMMARY OF RESULTS
Multi-Asset Absolute Return Fund (Class R6/JHASX) returned 3.95% for the year ended August 31, 2026. The most significant factors during the reporting period included solid gains in global equity markets, rising interest rates, and currency market conditions.
TOP PERFORMANCE CONTRIBUTORS
Developed market stocks | Equities in developed countries contributed the most to fund performance, benefiting from stronger-than-expected corporate profits and resilient global economic growth.
Cash | A noteworthy level of income was received based on cash return not related to actual holdings.
Value stocks | The fund’s holdings of value-oriented stocks aided performance, particularly amid periods of risk aversion in global equity markets.
TOP PERFORMANCE DETRACTORS
Growth-oriented stocks | Growth stocks underperformed for the reporting period, adversely affected by sector rotation and valuation pressure.
Fixed-income securities | Rising interest rates globally put downward pressure on bond prices.
Foreign currency and futures holdings exposure | The fund’s defensive long/short positions in high-quality foreign currencies and futures holdings weighed on performance.
The views expressed in this report are those of the portfolio management team and are subject to change. They are not meant as investment advice.
Fund Performance
The following graph compares the initial and subsequent account values at the end of each of the most recently completed 10 fiscal years of the fund (or for the life of the fund, if shorter). It assumes a $1,000,000 initial investment in the fund and in an appropriate, broad-based securities market index for the same period.
GROWTH OF $1,000,000
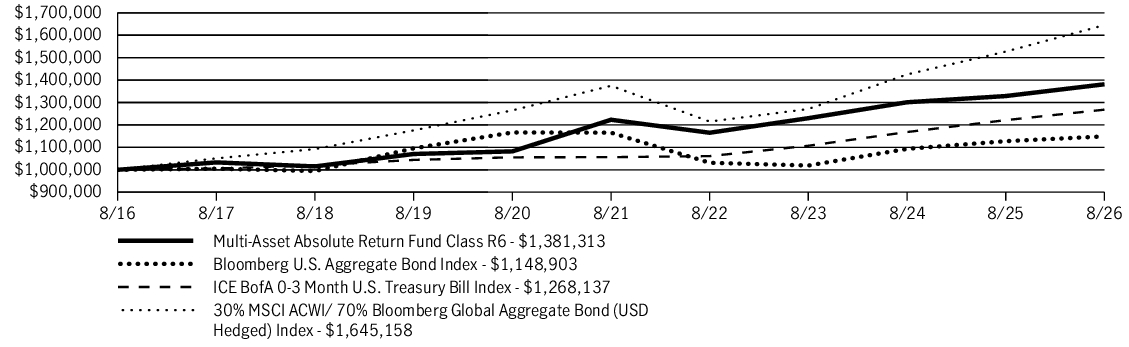
| AVERAGE ANNUAL TOTAL RETURN | 1 Year | 5 Years | 10 Years |
| Multi-Asset Absolute Return Fund (Class R6/JHASX) | 3.95% | 2.46% | 3.28% |
| Bloomberg U.S. Aggregate Bond Index | 1.89% | (0.29)% | 1.40% |
| ICE BofA 0-3 Month U.S. Treasury Bill Index | 3.82% | 3.72% | 2.40% |
| 30% MSCI ACWI/ 70% Bloomberg Global Aggregate Bond (USD Hedged) Index | 7.73% | 3.66% | 5.10% |
Fund Statistics
| Fund net assets | $246,306,655 |
| Total number of portfolio holdings | 264 |
| Total advisory fees paid (net) | $2,724,399 |
| Portfolio turnover rate | 144% |
Graphical Representation of Holdings
The tables below show the investment makeup of the fund, representing a percentage of the total net assets of the fund.
Portfolio Composition
| Common stocks | 61.2% |
| Information technology | 17.3% |
| Consumer staples | 10.0% |
| Health care | 9.6% |
| Financials | 6.7% |
| Industrials | 6.3% |
| Communication services | 4.8% |
| Consumer discretionary | 4.0% |
| Utilities | 1.4% |
| Materials | 1.1% |
| U.S. Government | 31.1% |
| Other assets and liabilities, net | 7.7% |
Country Composition
| United States | 77.8% |
| Japan | 4.4% |
| France | 3.0% |
| United Kingdom | 2.7% |
| South Korea | 1.6% |
| China | 1.6% |
| Netherlands | 1.5% |
| Taiwan | 1.3% |
| Switzerland | 1.2% |
| Germany | 1.2% |
| Other countries | 3.7% |
Holdings may not have been held by the fund for the entire period and are subject to change without notice. Portfolio composition is subject to review in accordance with the fund’s investment strategy and may vary in the future. Current and future portfolio holdings are subject to risk and may change at any time.
What were the fund costs during the last year ?
(Based on a hypothetical $10,000 investment)
| Fund (Class) | Costs of a $10,000 investment | Costs paid as a percentage of a $10,000 investment |
| Multi-Asset Absolute Return Fund (Class R2/JHARX) |
$177 | 1.74% |
Management’s Discussion of Fund Performance
SUMMARY OF RESULTS
Multi-Asset Absolute Return Fund (Class R2/JHARX) returned 3.59% for the year ended August 31, 2026. The most significant factors during the reporting period included solid gains in global equity markets, rising interest rates, and currency market conditions.
TOP PERFORMANCE CONTRIBUTORS
Developed market stocks | Equities in developed countries contributed the most to fund performance, benefiting from stronger-than-expected corporate profits and resilient global economic growth.
Cash | A noteworthy level of income was received based on cash return not related to actual holdings.
Value stocks | The fund’s holdings of value-oriented stocks aided performance, particularly amid periods of risk aversion in global equity markets.
TOP PERFORMANCE DETRACTORS
Growth-oriented stocks | Growth stocks underperformed for the reporting period, adversely affected by sector rotation and valuation pressure.
Fixed-income securities | Rising interest rates globally put downward pressure on bond prices.
Foreign currency and futures holdings exposure | The fund’s defensive long/short positions in high-quality foreign currencies and futures holdings weighed on performance.
The views expressed in this report are those of the portfolio management team and are subject to change. They are not meant as investment advice.
Fund Performance
The following graph compares the initial and subsequent account values at the end of each of the most recently completed 10 fiscal years of the fund (or for the life of the fund, if shorter). It assumes a $10,000 initial investment in the fund and in an appropriate, broad-based securities market index for the same period.
GROWTH OF $10,000
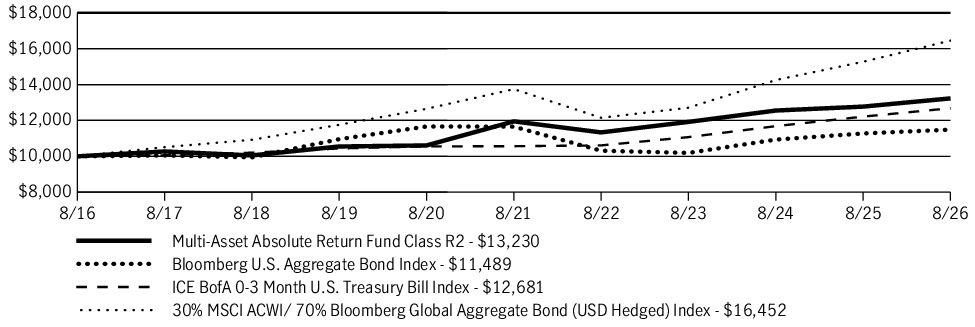
| AVERAGE ANNUAL TOTAL RETURN | 1 Year | 5 Years | 10 Years |
| Multi-Asset Absolute Return Fund (Class R2/JHARX) | 3.59% | 2.06% | 2.84% |
| Bloomberg U.S. Aggregate Bond Index | 1.89% | (0.29)% | 1.40% |
| ICE BofA 0-3 Month U.S. Treasury Bill Index | 3.82% | 3.72% | 2.40% |
| 30% MSCI ACWI/ 70% Bloomberg Global Aggregate Bond (USD Hedged) Index | 7.73% | 3.66% | 5.10% |
Fund Statistics
| Fund net assets | $246,306,655 |
| Total number of portfolio holdings | 264 |
| Total advisory fees paid (net) | $2,724,399 |
| Portfolio turnover rate | 144% |
Graphical Representation of Holdings
The tables below show the investment makeup of the fund, representing a percentage of the total net assets of the fund.
Portfolio Composition
| Common stocks | 61.2% |
| Information technology | 17.3% |
| Consumer staples | 10.0% |
| Health care | 9.6% |
| Financials | 6.7% |
| Industrials | 6.3% |
| Communication services | 4.8% |
| Consumer discretionary | 4.0% |
| Utilities | 1.4% |
| Materials | 1.1% |
| U.S. Government | 31.1% |
| Other assets and liabilities, net | 7.7% |
Country Composition
| United States | 77.8% |
| Japan | 4.4% |
| France | 3.0% |
| United Kingdom | 2.7% |
| South Korea | 1.6% |
| China | 1.6% |
| Netherlands | 1.5% |
| Taiwan | 1.3% |
| Switzerland | 1.2% |
| Germany | 1.2% |
| Other countries | 3.7% |
Holdings may not have been held by the fund for the entire period and are subject to change without notice. Portfolio composition is subject to review in accordance with the fund’s investment strategy and may vary in the future. Current and future portfolio holdings are subject to risk and may change at any time.
What were the fund costs during the last year ?
(Based on a hypothetical $10,000 investment)
| Fund (Class) | Costs of a $10,000 investment | Costs paid as a percentage of a $10,000 investment |
| Multi-Asset Absolute Return Fund (Class NAV) |
$136 | 1.33% |
Management’s Discussion of Fund Performance
SUMMARY OF RESULTS
Multi-Asset Absolute Return Fund (Class NAV) returned 3.94% for the year ended August 31, 2026. The most significant factors during the reporting period included solid gains in global equity markets, rising interest rates, and currency market conditions.
TOP PERFORMANCE CONTRIBUTORS
Developed market stocks | Equities in developed countries contributed the most to fund performance, benefiting from stronger-than-expected corporate profits and resilient global economic growth.
Cash | A noteworthy level of income was received based on cash return not related to actual holdings.
Value stocks | The fund’s holdings of value-oriented stocks aided performance, particularly amid periods of risk aversion in global equity markets.
TOP PERFORMANCE DETRACTORS
Growth-oriented stocks | Growth stocks underperformed for the reporting period, adversely affected by sector rotation and valuation pressure.
Fixed-income securities | Rising interest rates globally put downward pressure on bond prices.
Foreign currency and futures holdings exposure | The fund’s defensive long/short positions in high-quality foreign currencies and futures holdings weighed on performance.
The views expressed in this report are those of the portfolio management team and are subject to change. They are not meant as investment advice.
Fund Performance
The following graph compares the initial and subsequent account values at the end of each of the most recently completed 10 fiscal years of the fund (or for the life of the fund, if shorter). It assumes a $10,000 initial investment in the fund and in an appropriate, broad-based securities market index for the same period.
GROWTH OF $10,000
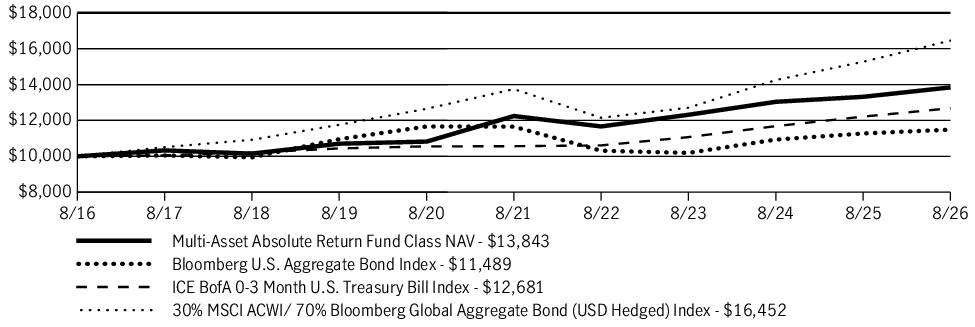
| AVERAGE ANNUAL TOTAL RETURN | 1 Year | 5 Years | 10 Years |
| Multi-Asset Absolute Return Fund (Class NAV) | 3.94% | 2.48% | 3.31% |
| Bloomberg U.S. Aggregate Bond Index | 1.89% | (0.29)% | 1.40% |
| ICE BofA 0-3 Month U.S. Treasury Bill Index | 3.82% | 3.72% | 2.40% |
| 30% MSCI ACWI/ 70% Bloomberg Global Aggregate Bond (USD Hedged) Index | 7.73% | 3.66% | 5.10% |
Fund Statistics
| Fund net assets | $246,306,655 |
| Total number of portfolio holdings | 264 |
| Total advisory fees paid (net) | $2,724,399 |
| Portfolio turnover rate | 144% |
Graphical Representation of Holdings
The tables below show the investment makeup of the fund, representing a percentage of the total net assets of the fund.
Portfolio Composition
| Common stocks | 61.2% |
| Information technology | 17.3% |
| Consumer staples | 10.0% |
| Health care | 9.6% |
| Financials | 6.7% |
| Industrials | 6.3% |
| Communication services | 4.8% |
| Consumer discretionary | 4.0% |
| Utilities | 1.4% |
| Materials | 1.1% |
| U.S. Government | 31.1% |
| Other assets and liabilities, net | 7.7% |
Country Composition
| United States | 77.8% |
| Japan | 4.4% |
| France | 3.0% |
| United Kingdom | 2.7% |
| South Korea | 1.6% |
| China | 1.6% |
| Netherlands | 1.5% |
| Taiwan | 1.3% |
| Switzerland | 1.2% |
| Germany | 1.2% |
| Other countries | 3.7% |
Holdings may not have been held by the fund for the entire period and are subject to change without notice. Portfolio composition is subject to review in accordance with the fund’s investment strategy and may vary in the future. Current and future portfolio holdings are subject to risk and may change at any time.
What were the fund costs during the last year ?
(Based on a hypothetical $10,000 investment)
| Fund (Class) | Costs of a $10,000 investment | Costs paid as a percentage of a $10,000 investment |
| Multi-Asset Absolute Return Fund (Class I/JHAIX) |
$147 | 1.44% |
Management’s Discussion of Fund Performance
SUMMARY OF RESULTS
Multi-Asset Absolute Return Fund (Class I/JHAIX) returned 3.88% for the year ended August 31, 2026. The most significant factors during the reporting period included solid gains in global equity markets, rising interest rates, and currency market conditions.
TOP PERFORMANCE CONTRIBUTORS
Developed market stocks | Equities in developed countries contributed the most to fund performance, benefiting from stronger-than-expected corporate profits and resilient global economic growth.
Cash | A noteworthy level of income was received based on cash return not related to actual holdings.
Value stocks | The fund’s holdings of value-oriented stocks aided performance, particularly amid periods of risk aversion in global equity markets.
TOP PERFORMANCE DETRACTORS
Growth-oriented stocks | Growth stocks underperformed for the reporting period, adversely affected by sector rotation and valuation pressure.
Fixed-income securities | Rising interest rates globally put downward pressure on bond prices.
Foreign currency and futures holdings exposure | The fund’s defensive long/short positions in high-quality foreign currencies and futures holdings weighed on performance.
The views expressed in this report are those of the portfolio management team and are subject to change. They are not meant as investment advice.
Fund Performance
The following graph compares the initial and subsequent account values at the end of each of the most recently completed 10 fiscal years of the fund (or for the life of the fund, if shorter). It assumes a $250,000 initial investment in the fund and in an appropriate, broad-based securities market index for the same period.
GROWTH OF $250,000
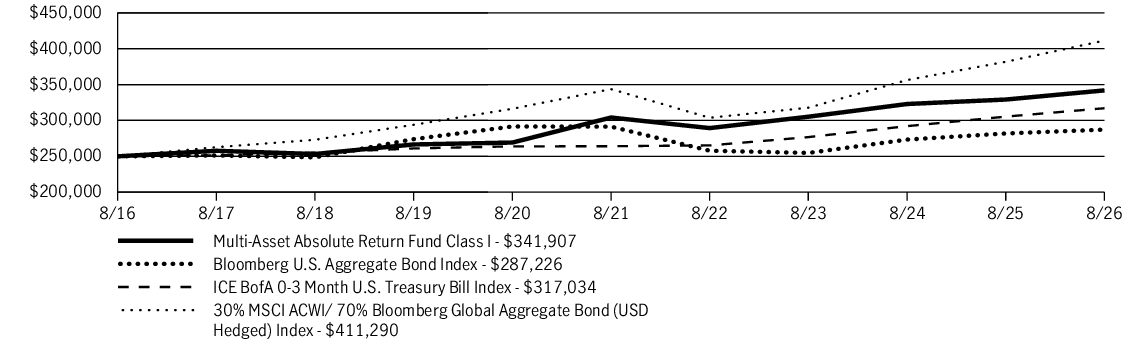
| AVERAGE ANNUAL TOTAL RETURN | 1 Year | 5 Years | 10 Years |
| Multi-Asset Absolute Return Fund (Class I/JHAIX) | 3.88% | 2.37% | 3.18% |
| Bloomberg U.S. Aggregate Bond Index | 1.89% | (0.29)% | 1.40% |
| ICE BofA 0-3 Month U.S. Treasury Bill Index | 3.82% | 3.72% | 2.40% |
| 30% MSCI ACWI/ 70% Bloomberg Global Aggregate Bond (USD Hedged) Index | 7.73% | 3.66% | 5.10% |
Fund Statistics
| Fund net assets | $246,306,655 |
| Total number of portfolio holdings | 264 |
| Total advisory fees paid (net) | $2,724,399 |
| Portfolio turnover rate | 144% |
Graphical Representation of Holdings
The tables below show the investment makeup of the fund, representing a percentage of the total net assets of the fund.
Portfolio Composition
| Common stocks | 61.2% |
| Information technology | 17.3% |
| Consumer staples | 10.0% |
| Health care | 9.6% |
| Financials | 6.7% |
| Industrials | 6.3% |
| Communication services | 4.8% |
| Consumer discretionary | 4.0% |
| Utilities | 1.4% |
| Materials | 1.1% |
| U.S. Government | 31.1% |
| Other assets and liabilities, net | 7.7% |
Country Composition
| United States | 77.8% |
| Japan | 4.4% |
| France | 3.0% |
| United Kingdom | 2.7% |
| South Korea | 1.6% |
| China | 1.6% |
| Netherlands | 1.5% |
| Taiwan | 1.3% |
| Switzerland | 1.2% |
| Germany | 1.2% |
| Other countries | 3.7% |
Holdings may not have been held by the fund for the entire period and are subject to change without notice. Portfolio composition is subject to review in accordance with the fund’s investment strategy and may vary in the future. Current and future portfolio holdings are subject to risk and may change at any time.
What were the fund costs during the last year ?
(Based on a hypothetical $10,000 investment)
| Fund (Class) | Costs of a $10,000 investment | Costs paid as a percentage of a $10,000 investment |
| Multi-Asset Absolute Return Fund (Class C/JHACX) |
$248 | 2.44% |
Management’s Discussion of Fund Performance
SUMMARY OF RESULTS
Multi-Asset Absolute Return Fund (Class C/JHACX) returned 2.93% (excluding sales charges) for the year ended August 31, 2026. The most significant factors during the reporting period included solid gains in global equity markets, rising interest rates, and currency market conditions.
TOP PERFORMANCE CONTRIBUTORS
Developed market stocks | Equities in developed countries contributed the most to fund performance, benefiting from stronger-than-expected corporate profits and resilient global economic growth.
Cash | A noteworthy level of income was received based on cash return not related to actual holdings.
Value stocks | The fund’s holdings of value-oriented stocks aided performance, particularly amid periods of risk aversion in global equity markets.
TOP PERFORMANCE DETRACTORS
Growth-oriented stocks | Growth stocks underperformed for the reporting period, adversely affected by sector rotation and valuation pressure.
Fixed-income securities | Rising interest rates globally put downward pressure on bond prices.
Foreign currency and futures holdings exposure | The fund’s defensive long/short positions in high-quality foreign currencies and futures holdings weighed on performance.
The views expressed in this report are those of the portfolio management team and are subject to change. They are not meant as investment advice.
Fund Performance
The following graph compares the initial and subsequent account values at the end of each of the most recently completed 10 fiscal years of the fund (or for the life of the fund, if shorter). It assumes a $10,000 initial investment in the fund and in an appropriate, broad-based securities market index for the same period.
GROWTH OF $10,000
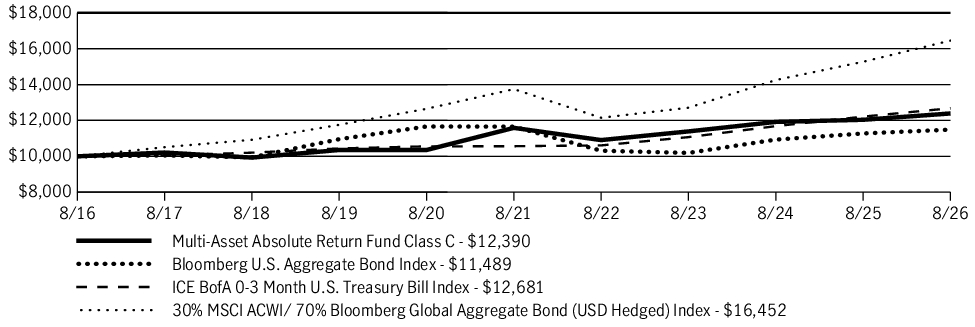
| AVERAGE ANNUAL TOTAL RETURN | 1 Year | 5 Years | 10 Years |
| Multi-Asset Absolute Return Fund (Class C/JHACX) | 1.93% | 1.35% | 2.17% |
| Multi-Asset Absolute Return Fund (Class C/JHACX)—excluding sales charge | 2.93% | 1.35% | 2.17% |
| Bloomberg U.S. Aggregate Bond Index | 1.89% | (0.29)% | 1.40% |
| ICE BofA 0-3 Month U.S. Treasury Bill Index | 3.82% | 3.72% | 2.40% |
| 30% MSCI ACWI/ 70% Bloomberg Global Aggregate Bond (USD Hedged) Index | 7.73% | 3.66% | 5.10% |
Fund Statistics
| Fund net assets | $246,306,655 |
| Total number of portfolio holdings | 264 |
| Total advisory fees paid (net) | $2,724,399 |
| Portfolio turnover rate | 144% |
Graphical Representation of Holdings
The tables below show the investment makeup of the fund, representing a percentage of the total net assets of the fund.
Portfolio Composition
| Common stocks | 61.2% |
| Information technology | 17.3% |
| Consumer staples | 10.0% |
| Health care | 9.6% |
| Financials | 6.7% |
| Industrials | 6.3% |
| Communication services | 4.8% |
| Consumer discretionary | 4.0% |
| Utilities | 1.4% |
| Materials | 1.1% |
| U.S. Government | 31.1% |
| Other assets and liabilities, net | 7.7% |
Country Composition
| United States | 77.8% |
| Japan | 4.4% |
| France | 3.0% |
| United Kingdom | 2.7% |
| South Korea | 1.6% |
| China | 1.6% |
| Netherlands | 1.5% |
| Taiwan | 1.3% |
| Switzerland | 1.2% |
| Germany | 1.2% |
| Other countries | 3.7% |
Holdings may not have been held by the fund for the entire period and are subject to change without notice. Portfolio composition is subject to review in accordance with the fund’s investment strategy and may vary in the future. Current and future portfolio holdings are subject to risk and may change at any time.
What were the fund costs during the last year ?
(Based on a hypothetical $10,000 investment)
| Fund (Class) | Costs of a $10,000 investment | Costs paid as a percentage of a $10,000 investment |
| Multi-Asset Absolute Return Fund (Class A/JHAAX) |
$177 | 1.74% |
Management’s Discussion of Fund Performance
SUMMARY OF RESULTS
Multi-Asset Absolute Return Fund (Class A/JHAAX) returned 3.57% (excluding sales charges) for the year ended August 31, 2026. The most significant factors during the reporting period included solid gains in global equity markets, rising interest rates, and currency market conditions.
TOP PERFORMANCE CONTRIBUTORS
Developed market stocks | Equities in developed countries contributed the most to fund performance, benefiting from stronger-than-expected corporate profits and resilient global economic growth.
Cash | A noteworthy level of income was received based on cash return not related to actual holdings.
Value stocks | The fund’s holdings of value-oriented stocks aided performance, particularly amid periods of risk aversion in global equity markets.
TOP PERFORMANCE DETRACTORS
Growth-oriented stocks | Growth stocks underperformed for the reporting period, adversely affected by sector rotation and valuation pressure.
Fixed-income securities | Rising interest rates globally put downward pressure on bond prices.
Foreign currency and futures holdings exposure | The fund’s defensive long/short positions in high-quality foreign currencies and futures holdings weighed on performance.
The views expressed in this report are those of the portfolio management team and are subject to change. They are not meant as investment advice.
Fund Performance
The following graph compares the initial and subsequent account values at the end of each of the most recently completed 10 fiscal years of the fund (or for the life of the fund, if shorter). It assumes a $10,000 initial investment in the fund and in an appropriate, broad-based securities market index for the same period.
GROWTH OF $10,000
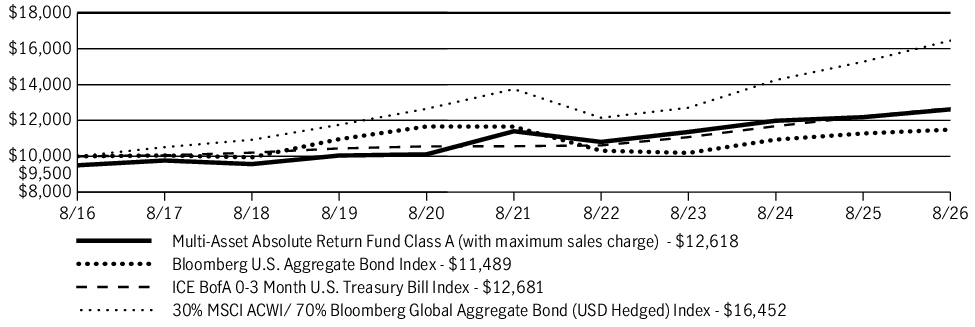
| AVERAGE ANNUAL TOTAL RETURN | 1 Year | 5 Years | 10 Years |
| Multi-Asset Absolute Return Fund (Class A/JHAAX) | (1.65)% | 1.02% | 2.35% |
| Multi-Asset Absolute Return Fund (Class A/JHAAX)—excluding sales charge | 3.57% | 2.06% | 2.88% |
| Bloomberg U.S. Aggregate Bond Index | 1.89% | (0.29)% | 1.40% |
| ICE BofA 0-3 Month U.S. Treasury Bill Index | 3.82% | 3.72% | 2.40% |
| 30% MSCI ACWI/ 70% Bloomberg Global Aggregate Bond (USD Hedged) Index | 7.73% | 3.66% | 5.10% |
Fund Statistics
| Fund net assets | $246,306,655 |
| Total number of portfolio holdings | 264 |
| Total advisory fees paid (net) | $2,724,399 |
| Portfolio turnover rate | 144% |
Graphical Representation of Holdings
The tables below show the investment makeup of the fund, representing a percentage of the total net assets of the fund.
Portfolio Composition
| Common stocks | 61.2% |
| Information technology | 17.3% |
| Consumer staples | 10.0% |
| Health care | 9.6% |
| Financials | 6.7% |
| Industrials | 6.3% |
| Communication services | 4.8% |
| Consumer discretionary | 4.0% |
| Utilities | 1.4% |
| Materials | 1.1% |
| U.S. Government | 31.1% |
| Other assets and liabilities, net | 7.7% |
Country Composition
| United States | 77.8% |
| Japan | 4.4% |
| France | 3.0% |
| United Kingdom | 2.7% |
| South Korea | 1.6% |
| China | 1.6% |
| Netherlands | 1.5% |
| Taiwan | 1.3% |
| Switzerland | 1.2% |
| Germany | 1.2% |
| Other countries | 3.7% |
Holdings may not have been held by the fund for the entire period and are subject to change without notice. Portfolio composition is subject to review in accordance with the fund’s investment strategy and may vary in the future. Current and future portfolio holdings are subject to risk and may change at any time.
What were the fund costs during the last year ?
(Based on a hypothetical $10,000 investment)
| Fund (Class) | Costs of a $10,000 investment | Costs paid as a percentage of a $10,000 investment |
| Global Equity Fund (Class A/JHGEX) |
$138 | 1.28% |
Management’s Discussion of Fund Performance
SUMMARY OF RESULTS
Global Equity Fund (Class A/JHGEX) returned 14.87% (excluding sales charges) for the year ended August 31, 2026. Significant factors affecting fund performance during the period included a healthy rally in global stock markets, driven by stronger-than-expected corporate profits, resilient global economic growth, and the continuation of robust capital investment in artificial intelligence (AI) infrastructure.
TOP PERFORMANCE CONTRIBUTORS
Information technology | The information technology sector was the fund’s top-performing sector.
Samsung Electronics Company, Ltd. | Growing global demand for high-bandwidth memory, particularly for usage in AI chips and data centers, helped boost this stock.
Taiwan Semiconductor Manufacturing Company, Ltd. | The chipmaker remained an indispensable component in the global semiconductor supply chain as AI-fueled demand remained robust.
TOP PERFORMANCE DETRACTORS
Consumer discretionary | The consumer discretionary sector was one of two sectors in the portfolio to decline for the period amid weaker consumer sentiment in many regions of the globe.
AutoZone, Inc. | Softer revenue growth outside of the U.S. and increased competition domestically weighed on shares of the auto parts retailer.
Lennar Corp. | The homebuilder struggled due to a sluggish real estate market brought on by homebuyer affordability issues, including relatively high mortgage rates and stubbornly elevated home prices.
The views expressed in this report are those of the portfolio management team and are subject to change. They are not meant as investment advice.
Fund Performance
The following graph compares the initial and subsequent account values at the end of each of the most recently completed 10 fiscal years of the fund (or for the life of the fund, if shorter). It assumes a $10,000 initial investment in the fund and in an appropriate, broad-based securities market index for the same period.
GROWTH OF $10,000
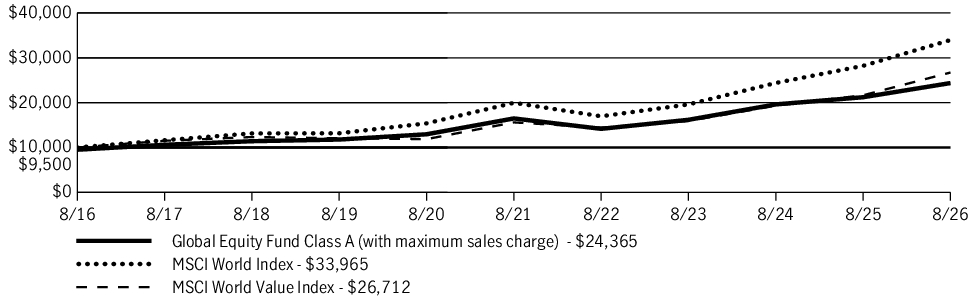
| AVERAGE ANNUAL TOTAL RETURN | 1 Year | 5 Years | 10 Years |
| Global Equity Fund (Class A/JHGEX) | 9.13% | 7.03% | 9.31% |
| Global Equity Fund (Class A/JHGEX)—excluding sales charge | 14.87% | 8.14% | 9.88% |
| MSCI World Index | 20.37% | 11.21% | 13.01% |
| MSCI World Value Index | 23.41% | 11.36% | 10.32% |
Fund Statistics
| Fund net assets | $1,091,712,086 |
| Total number of portfolio holdings | 66 |
| Total advisory fees paid (net) | $7,374,571 |
| Portfolio turnover rate | 82% |
Graphical Representation of Holdings
The tables below show the investment makeup of the fund, representing a percentage of the total net assets of the fund.
Top Ten Holdings
| Microsoft Corp. | 6.1% |
| Alphabet, Inc., Class A | 3.0% |
| Taiwan Semiconductor Manufacturing Company, Ltd. | 2.1% |
| Sumitomo Mitsui Trust Group, Inc. | 2.1% |
| McKesson Corp. | 2.1% |
| Sony Group Corp. | 2.1% |
| Anheuser-Busch InBev SA/NV | 2.0% |
| CRH PLC | 2.0% |
| British American Tobacco PLC | 2.0% |
| Bank of Ireland Group PLC | 2.0% |
Sector Composition
| Financials | 19.4% |
| Information technology | 13.8% |
| Industrials | 10.3% |
| Health care | 9.7% |
| Materials | 8.9% |
| Consumer discretionary | 8.8% |
| Communication services | 8.2% |
| Consumer staples | 7.9% |
| Energy | 6.9% |
| Utilities | 3.8% |
| Real estate | 1.0% |
| Short-term investments and other | 1.3% |
Country Composition
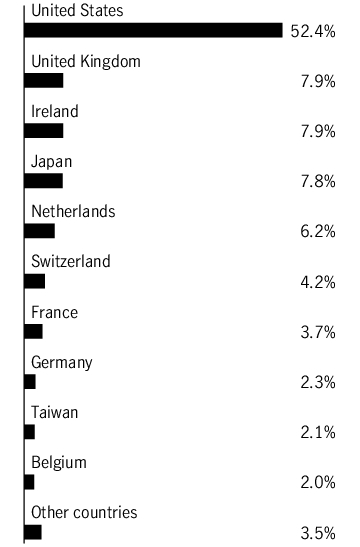
Holdings may not have been held by the fund for the entire period and are subject to change without notice. Portfolio composition is subject to review in accordance with the fund’s investment strategy and may vary in the future. Current and future portfolio holdings are subject to risk and may change at any time.
Top Ten Holdings
| Microsoft Corp. | 6.1% |
| Alphabet, Inc., Class A | 3.0% |
| Taiwan Semiconductor Manufacturing Company, Ltd. | 2.1% |
| Sumitomo Mitsui Trust Group, Inc. | 2.1% |
| McKesson Corp. | 2.1% |
| Sony Group Corp. | 2.1% |
| Anheuser-Busch InBev SA/NV | 2.0% |
| CRH PLC | 2.0% |
| British American Tobacco PLC | 2.0% |
| Bank of Ireland Group PLC | 2.0% |
What were the fund costs during the last year ?
(Based on a hypothetical $10,000 investment)
| Fund (Class) | Costs of a $10,000 investment | Costs paid as a percentage of a $10,000 investment |
| Global Equity Fund (Class C/JGECX) |
$212 | 1.98% |
Management’s Discussion of Fund Performance
SUMMARY OF RESULTS
Global Equity Fund (Class C/JGECX) returned 14.14% (excluding sales charges) for the year ended August 31, 2026. Significant factors affecting fund performance during the period included a healthy rally in global stock markets, driven by stronger-than-expected corporate profits, resilient global economic growth, and the continuation of robust capital investment in artificial intelligence (AI) infrastructure.
TOP PERFORMANCE CONTRIBUTORS
Information technology | The information technology sector was the fund’s top-performing sector.
Samsung Electronics Company, Ltd. | Growing global demand for high-bandwidth memory, particularly for usage in AI chips and data centers, helped boost this stock.
Taiwan Semiconductor Manufacturing Company, Ltd. | The chipmaker remained an indispensable component in the global semiconductor supply chain as AI-fueled demand remained robust.
TOP PERFORMANCE DETRACTORS
Consumer discretionary | The consumer discretionary sector was one of two sectors in the portfolio to decline for the period amid weaker consumer sentiment in many regions of the globe.
AutoZone, Inc. | Softer revenue growth outside of the U.S. and increased competition domestically weighed on shares of the auto parts retailer.
Lennar Corp. | The homebuilder struggled due to a sluggish real estate market brought on by homebuyer affordability issues, including relatively high mortgage rates and stubbornly elevated home prices.
The views expressed in this report are those of the portfolio management team and are subject to change. They are not meant as investment advice.
Fund Performance
The following graph compares the initial and subsequent account values at the end of each of the most recently completed 10 fiscal years of the fund (or for the life of the fund, if shorter). It assumes a $10,000 initial investment in the fund and in an appropriate, broad-based securities market index for the same period.
GROWTH OF $10,000
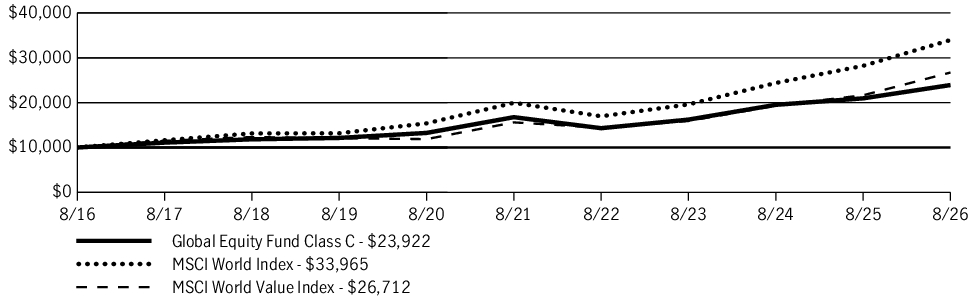
| AVERAGE ANNUAL TOTAL RETURN | 1 Year | 5 Years | 10 Years |
| Global Equity Fund (Class C/JGECX) | 13.14% | 7.38% | 9.11% |
| Global Equity Fund (Class C/JGECX)—excluding sales charge | 14.14% | 7.38% | 9.11% |
| MSCI World Index | 20.37% | 11.21% | 13.01% |
| MSCI World Value Index | 23.41% | 11.36% | 10.32% |
Fund Statistics
| Fund net assets | $1,091,712,086 |
| Total number of portfolio holdings | 66 |
| Total advisory fees paid (net) | $7,374,571 |
| Portfolio turnover rate | 82% |
Graphical Representation of Holdings
The tables below show the investment makeup of the fund, representing a percentage of the total net assets of the fund.
Top Ten Holdings
| Microsoft Corp. | 6.1% |
| Alphabet, Inc., Class A | 3.0% |
| Taiwan Semiconductor Manufacturing Company, Ltd. | 2.1% |
| Sumitomo Mitsui Trust Group, Inc. | 2.1% |
| McKesson Corp. | 2.1% |
| Sony Group Corp. | 2.1% |
| Anheuser-Busch InBev SA/NV | 2.0% |
| CRH PLC | 2.0% |
| British American Tobacco PLC | 2.0% |
| Bank of Ireland Group PLC | 2.0% |
Sector Composition
| Financials | 19.4% |
| Information technology | 13.8% |
| Industrials | 10.3% |
| Health care | 9.7% |
| Materials | 8.9% |
| Consumer discretionary | 8.8% |
| Communication services | 8.2% |
| Consumer staples | 7.9% |
| Energy | 6.9% |
| Utilities | 3.8% |
| Real estate | 1.0% |
| Short-term investments and other | 1.3% |
Country Composition
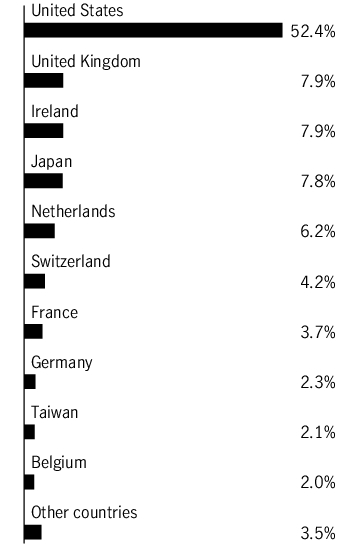
Holdings may not have been held by the fund for the entire period and are subject to change without notice. Portfolio composition is subject to review in accordance with the fund’s investment strategy and may vary in the future. Current and future portfolio holdings are subject to risk and may change at any time.
Top Ten Holdings
| Microsoft Corp. | 6.1% |
| Alphabet, Inc., Class A | 3.0% |
| Taiwan Semiconductor Manufacturing Company, Ltd. | 2.1% |
| Sumitomo Mitsui Trust Group, Inc. | 2.1% |
| McKesson Corp. | 2.1% |
| Sony Group Corp. | 2.1% |
| Anheuser-Busch InBev SA/NV | 2.0% |
| CRH PLC | 2.0% |
| British American Tobacco PLC | 2.0% |
| Bank of Ireland Group PLC | 2.0% |
What were the fund costs during the last year ?
(Based on a hypothetical $10,000 investment)
| Fund (Class) | Costs of a $10,000 investment | Costs paid as a percentage of a $10,000 investment |
| Global Equity Fund (Class I/JGEFX) |
$106 | 0.98% |
Management’s Discussion of Fund Performance
SUMMARY OF RESULTS
Global Equity Fund (Class I/JGEFX) returned 15.34% for the year ended August 31, 2026. Significant factors affecting fund performance during the period included a healthy rally in global stock markets, driven by stronger-than-expected corporate profits, resilient global economic growth, and the continuation of robust capital investment in artificial intelligence (AI) infrastructure.
TOP PERFORMANCE CONTRIBUTORS
Information technology | The information technology sector was the fund’s top-performing sector.
Samsung Electronics Company, Ltd. | Growing global demand for high-bandwidth memory, particularly for usage in AI chips and data centers, helped boost this stock.
Taiwan Semiconductor Manufacturing Company, Ltd. | The chipmaker remained an indispensable component in the global semiconductor supply chain as AI-fueled demand remained robust.
TOP PERFORMANCE DETRACTORS
Consumer discretionary | The consumer discretionary sector was one of two sectors in the portfolio to decline for the period amid weaker consumer sentiment in many regions of the globe.
AutoZone, Inc. | Softer revenue growth outside of the U.S. and increased competition domestically weighed on shares of the auto parts retailer.
Lennar Corp. | The homebuilder struggled due to a sluggish real estate market brought on by homebuyer affordability issues, including relatively high mortgage rates and stubbornly elevated home prices.
The views expressed in this report are those of the portfolio management team and are subject to change. They are not meant as investment advice.
Fund Performance
The following graph compares the initial and subsequent account values at the end of each of the most recently completed 10 fiscal years of the fund (or for the life of the fund, if shorter). It assumes a $250,000 initial investment in the fund and in an appropriate, broad-based securities market index for the same period.
GROWTH OF $250,000
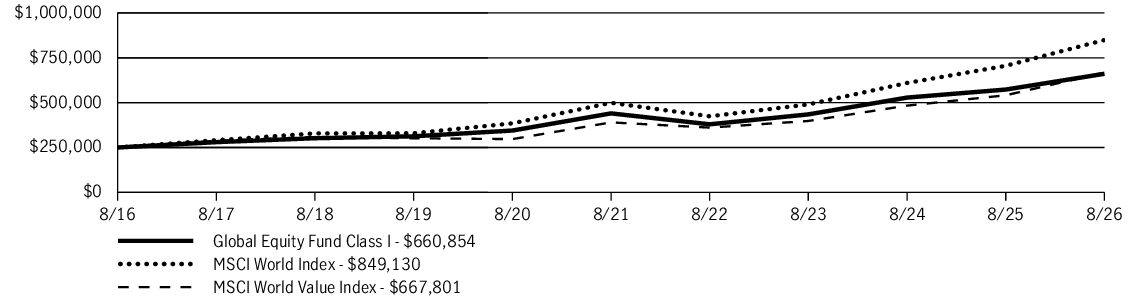
| AVERAGE ANNUAL TOTAL RETURN | 1 Year | 5 Years | 10 Years |
| Global Equity Fund (Class I/JGEFX) | 15.34% | 8.47% | 10.21% |
| MSCI World Index | 20.37% | 11.21% | 13.01% |
| MSCI World Value Index | 23.41% | 11.36% | 10.32% |
Fund Statistics
| Fund net assets | $1,091,712,086 |
| Total number of portfolio holdings | 66 |
| Total advisory fees paid (net) | $7,374,571 |
| Portfolio turnover rate | 82% |
Graphical Representation of Holdings
The tables below show the investment makeup of the fund, representing a percentage of the total net assets of the fund.
Top Ten Holdings
| Microsoft Corp. | 6.1% |
| Alphabet, Inc., Class A | 3.0% |
| Taiwan Semiconductor Manufacturing Company, Ltd. | 2.1% |
| Sumitomo Mitsui Trust Group, Inc. | 2.1% |
| McKesson Corp. | 2.1% |
| Sony Group Corp. | 2.1% |
| Anheuser-Busch InBev SA/NV | 2.0% |
| CRH PLC | 2.0% |
| British American Tobacco PLC | 2.0% |
| Bank of Ireland Group PLC | 2.0% |
Sector Composition
| Financials | 19.4% |
| Information technology | 13.8% |
| Industrials | 10.3% |
| Health care | 9.7% |
| Materials | 8.9% |
| Consumer discretionary | 8.8% |
| Communication services | 8.2% |
| Consumer staples | 7.9% |
| Energy | 6.9% |
| Utilities | 3.8% |
| Real estate | 1.0% |
| Short-term investments and other | 1.3% |
Country Composition
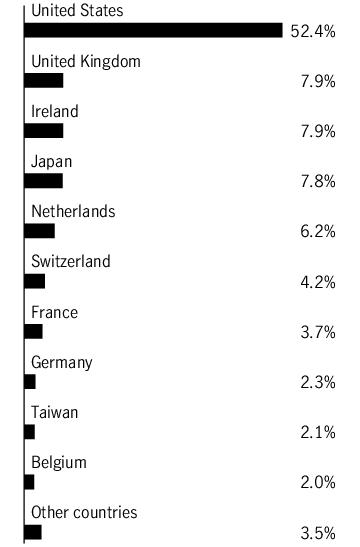
Holdings may not have been held by the fund for the entire period and are subject to change without notice. Portfolio composition is subject to review in accordance with the fund’s investment strategy and may vary in the future. Current and future portfolio holdings are subject to risk and may change at any time.
Top Ten Holdings
| Microsoft Corp. | 6.1% |
| Alphabet, Inc., Class A | 3.0% |
| Taiwan Semiconductor Manufacturing Company, Ltd. | 2.1% |
| Sumitomo Mitsui Trust Group, Inc. | 2.1% |
| McKesson Corp. | 2.1% |
| Sony Group Corp. | 2.1% |
| Anheuser-Busch InBev SA/NV | 2.0% |
| CRH PLC | 2.0% |
| British American Tobacco PLC | 2.0% |
| Bank of Ireland Group PLC | 2.0% |
What were the fund costs during the last year ?
(Based on a hypothetical $10,000 investment)
| Fund (Class) | Costs of a $10,000 investment | Costs paid as a percentage of a $10,000 investment |
| Global Equity Fund (Class NAV) |
$94 | 0.87% |
Management’s Discussion of Fund Performance
SUMMARY OF RESULTS
Global Equity Fund (Class NAV) returned 15.39% for the year ended August 31, 2026. Significant factors affecting fund performance during the period included a healthy rally in global stock markets, driven by stronger-than-expected corporate profits, resilient global economic growth, and the continuation of robust capital investment in artificial intelligence (AI) infrastructure.
TOP PERFORMANCE CONTRIBUTORS
Information technology | The information technology sector was the fund’s top-performing sector.
Samsung Electronics Company, Ltd. | Growing global demand for high-bandwidth memory, particularly for usage in AI chips and data centers, helped boost this stock.
Taiwan Semiconductor Manufacturing Company, Ltd. | The chipmaker remained an indispensable component in the global semiconductor supply chain as AI-fueled demand remained robust.
TOP PERFORMANCE DETRACTORS
Consumer discretionary | The consumer discretionary sector was one of two sectors in the portfolio to decline for the period amid weaker consumer sentiment in many regions of the globe.
AutoZone, Inc. | Softer revenue growth outside of the U.S. and increased competition domestically weighed on shares of the auto parts retailer.
Lennar Corp. | The homebuilder struggled due to a sluggish real estate market brought on by homebuyer affordability issues, including relatively high mortgage rates and stubbornly elevated home prices.
The views expressed in this report are those of the portfolio management team and are subject to change. They are not meant as investment advice.
Fund Performance
The following graph compares the initial and subsequent account values at the end of each of the most recently completed 10 fiscal years of the fund (or for the life of the fund, if shorter). It assumes a $10,000 initial investment in the fund and in an appropriate, broad-based securities market index for the same period.
GROWTH OF $10,000
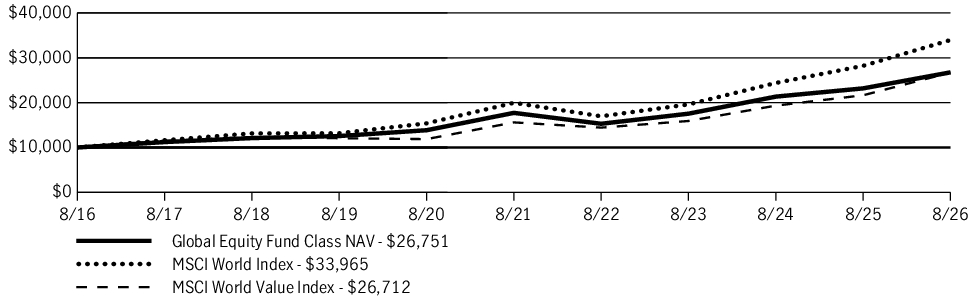
| AVERAGE ANNUAL TOTAL RETURN | 1 Year | 5 Years | 10 Years |
| Global Equity Fund (Class NAV) | 15.39% | 8.59% | 10.34% |
| MSCI World Index | 20.37% | 11.21% | 13.01% |
| MSCI World Value Index | 23.41% | 11.36% | 10.32% |
Fund Statistics
| Fund net assets | $1,091,712,086 |
| Total number of portfolio holdings | 66 |
| Total advisory fees paid (net) | $7,374,571 |
| Portfolio turnover rate | 82% |
Graphical Representation of Holdings
The tables below show the investment makeup of the fund, representing a percentage of the total net assets of the fund.
Top Ten Holdings
| Microsoft Corp. | 6.1% |
| Alphabet, Inc., Class A | 3.0% |
| Taiwan Semiconductor Manufacturing Company, Ltd. | 2.1% |
| Sumitomo Mitsui Trust Group, Inc. | 2.1% |
| McKesson Corp. | 2.1% |
| Sony Group Corp. | 2.1% |
| Anheuser-Busch InBev SA/NV | 2.0% |
| CRH PLC | 2.0% |
| British American Tobacco PLC | 2.0% |
| Bank of Ireland Group PLC | 2.0% |
Sector Composition
| Financials | 19.4% |
| Information technology | 13.8% |
| Industrials | 10.3% |
| Health care | 9.7% |
| Materials | 8.9% |
| Consumer discretionary | 8.8% |
| Communication services | 8.2% |
| Consumer staples | 7.9% |
| Energy | 6.9% |
| Utilities | 3.8% |
| Real estate | 1.0% |
| Short-term investments and other | 1.3% |
Country Composition
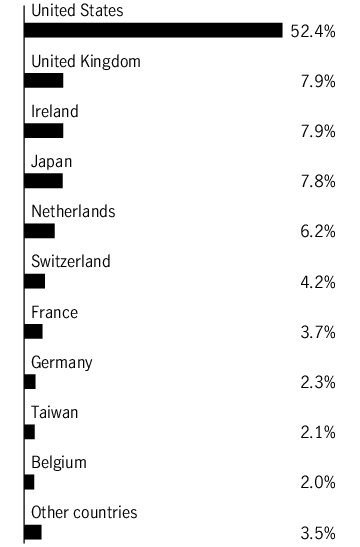
Holdings may not have been held by the fund for the entire period and are subject to change without notice. Portfolio composition is subject to review in accordance with the fund’s investment strategy and may vary in the future. Current and future portfolio holdings are subject to risk and may change at any time.
Top Ten Holdings
| Microsoft Corp. | 6.1% |
| Alphabet, Inc., Class A | 3.0% |
| Taiwan Semiconductor Manufacturing Company, Ltd. | 2.1% |
| Sumitomo Mitsui Trust Group, Inc. | 2.1% |
| McKesson Corp. | 2.1% |
| Sony Group Corp. | 2.1% |
| Anheuser-Busch InBev SA/NV | 2.0% |
| CRH PLC | 2.0% |
| British American Tobacco PLC | 2.0% |
| Bank of Ireland Group PLC | 2.0% |
What were the fund costs during the last year ?
(Based on a hypothetical $10,000 investment)
| Fund (Class) | Costs of a $10,000 investment | Costs paid as a percentage of a $10,000 investment |
| Global Equity Fund (Class R2/JGERX) |
$148 | 1.38% |
Management’s Discussion of Fund Performance
SUMMARY OF RESULTS
Global Equity Fund (Class R2/JGERX) returned 14.88% for the year ended August 31, 2026. Significant factors affecting fund performance during the period included a healthy rally in global stock markets, driven by stronger-than-expected corporate profits, resilient global economic growth, and the continuation of robust capital investment in artificial intelligence (AI) infrastructure.
TOP PERFORMANCE CONTRIBUTORS
Information technology | The information technology sector was the fund’s top-performing sector.
Samsung Electronics Company, Ltd. | Growing global demand for high-bandwidth memory, particularly for usage in AI chips and data centers, helped boost this stock.
Taiwan Semiconductor Manufacturing Company, Ltd. | The chipmaker remained an indispensable component in the global semiconductor supply chain as AI-fueled demand remained robust.
TOP PERFORMANCE DETRACTORS
Consumer discretionary | The consumer discretionary sector was one of two sectors in the portfolio to decline for the period amid weaker consumer sentiment in many regions of the globe.
AutoZone, Inc. | Softer revenue growth outside of the U.S. and increased competition domestically weighed on shares of the auto parts retailer.
Lennar Corp. | The homebuilder struggled due to a sluggish real estate market brought on by homebuyer affordability issues, including relatively high mortgage rates and stubbornly elevated home prices.
The views expressed in this report are those of the portfolio management team and are subject to change. They are not meant as investment advice.
Fund Performance
The following graph compares the initial and subsequent account values at the end of each of the most recently completed 10 fiscal years of the fund (or for the life of the fund, if shorter). It assumes a $10,000 initial investment in the fund and in an appropriate, broad-based securities market index for the same period.
GROWTH OF $10,000
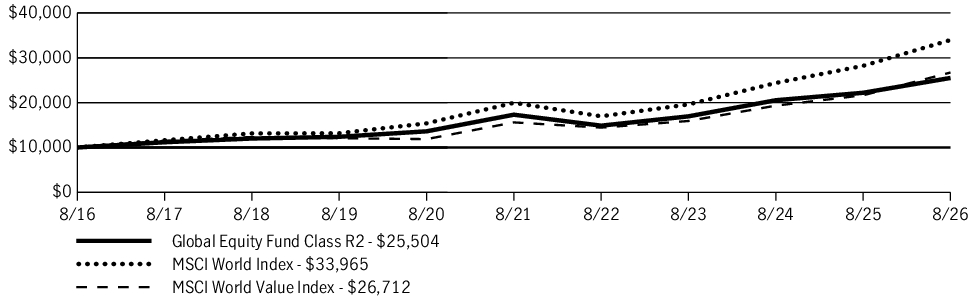
| AVERAGE ANNUAL TOTAL RETURN | 1 Year | 5 Years | 10 Years |
| Global Equity Fund (Class R2/JGERX) | 14.88% | 8.06% | 9.81% |
| MSCI World Index | 20.37% | 11.21% | 13.01% |
| MSCI World Value Index | 23.41% | 11.36% | 10.32% |
Fund Statistics
| Fund net assets | $1,091,712,086 |
| Total number of portfolio holdings | 66 |
| Total advisory fees paid (net) | $7,374,571 |
| Portfolio turnover rate | 82% |
Graphical Representation of Holdings
The tables below show the investment makeup of the fund, representing a percentage of the total net assets of the fund.
Top Ten Holdings
| Microsoft Corp. | 6.1% |
| Alphabet, Inc., Class A | 3.0% |
| Taiwan Semiconductor Manufacturing Company, Ltd. | 2.1% |
| Sumitomo Mitsui Trust Group, Inc. | 2.1% |
| McKesson Corp. | 2.1% |
| Sony Group Corp. | 2.1% |
| Anheuser-Busch InBev SA/NV | 2.0% |
| CRH PLC | 2.0% |
| British American Tobacco PLC | 2.0% |
| Bank of Ireland Group PLC | 2.0% |
Sector Composition
| Financials | 19.4% |
| Information technology | 13.8% |
| Industrials | 10.3% |
| Health care | 9.7% |
| Materials | 8.9% |
| Consumer discretionary | 8.8% |
| Communication services | 8.2% |
| Consumer staples | 7.9% |
| Energy | 6.9% |
| Utilities | 3.8% |
| Real estate | 1.0% |
| Short-term investments and other | 1.3% |
Country Composition
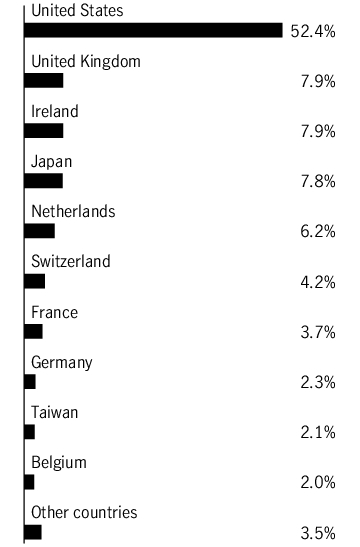
Holdings may not have been held by the fund for the entire period and are subject to change without notice. Portfolio composition is subject to review in accordance with the fund’s investment strategy and may vary in the future. Current and future portfolio holdings are subject to risk and may change at any time.
Top Ten Holdings
| Microsoft Corp. | 6.1% |
| Alphabet, Inc., Class A | 3.0% |
| Taiwan Semiconductor Manufacturing Company, Ltd. | 2.1% |
| Sumitomo Mitsui Trust Group, Inc. | 2.1% |
| McKesson Corp. | 2.1% |
| Sony Group Corp. | 2.1% |
| Anheuser-Busch InBev SA/NV | 2.0% |
| CRH PLC | 2.0% |
| British American Tobacco PLC | 2.0% |
| Bank of Ireland Group PLC | 2.0% |
What were the fund costs during the last year ?
(Based on a hypothetical $10,000 investment)
| Fund (Class) | Costs of a $10,000 investment | Costs paid as a percentage of a $10,000 investment |
| Global Equity Fund (Class R4/JGETX) |
$122 | 1.13% |
Management’s Discussion of Fund Performance
SUMMARY OF RESULTS
Global Equity Fund (Class R4/JGETX) returned 15.11% for the year ended August 31, 2026. Significant factors affecting fund performance during the period included a healthy rally in global stock markets, driven by stronger-than-expected corporate profits, resilient global economic growth, and the continuation of robust capital investment in artificial intelligence (AI) infrastructure.
TOP PERFORMANCE CONTRIBUTORS
Information technology | The information technology sector was the fund’s top-performing sector.
Samsung Electronics Company, Ltd. | Growing global demand for high-bandwidth memory, particularly for usage in AI chips and data centers, helped boost this stock.
Taiwan Semiconductor Manufacturing Company, Ltd. | The chipmaker remained an indispensable component in the global semiconductor supply chain as AI-fueled demand remained robust.
TOP PERFORMANCE DETRACTORS
Consumer discretionary | The consumer discretionary sector was one of two sectors in the portfolio to decline for the period amid weaker consumer sentiment in many regions of the globe.
AutoZone, Inc. | Softer revenue growth outside of the U.S. and increased competition domestically weighed on shares of the auto parts retailer.
Lennar Corp. | The homebuilder struggled due to a sluggish real estate market brought on by homebuyer affordability issues, including relatively high mortgage rates and stubbornly elevated home prices.
The views expressed in this report are those of the portfolio management team and are subject to change. They are not meant as investment advice.
Fund Performance
The following graph compares the initial and subsequent account values at the end of each of the most recently completed 10 fiscal years of the fund (or for the life of the fund, if shorter). It assumes a $10,000 initial investment in the fund and in an appropriate, broad-based securities market index for the same period.
GROWTH OF $10,000
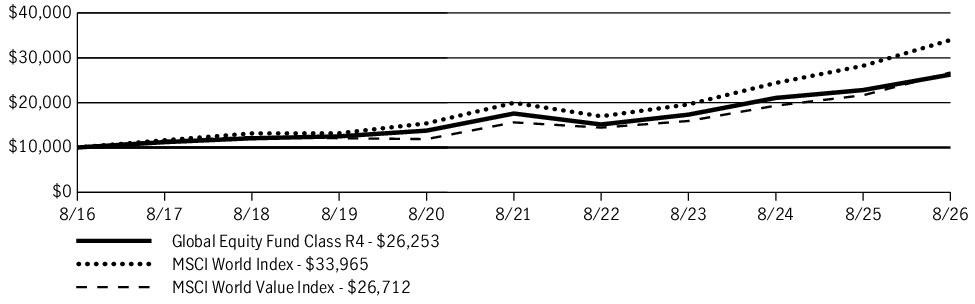
| AVERAGE ANNUAL TOTAL RETURN | 1 Year | 5 Years | 10 Years |
| Global Equity Fund (Class R4/JGETX) | 15.11% | 8.36% | 10.13% |
| MSCI World Index | 20.37% | 11.21% | 13.01% |
| MSCI World Value Index | 23.41% | 11.36% | 10.32% |
Fund Statistics
| Fund net assets | $1,091,712,086 |
| Total number of portfolio holdings | 66 |
| Total advisory fees paid (net) | $7,374,571 |
| Portfolio turnover rate | 82% |
Graphical Representation of Holdings
The tables below show the investment makeup of the fund, representing a percentage of the total net assets of the fund.
Top Ten Holdings
| Microsoft Corp. | 6.1% |
| Alphabet, Inc., Class A | 3.0% |
| Taiwan Semiconductor Manufacturing Company, Ltd. | 2.1% |
| Sumitomo Mitsui Trust Group, Inc. | 2.1% |
| McKesson Corp. | 2.1% |
| Sony Group Corp. | 2.1% |
| Anheuser-Busch InBev SA/NV | 2.0% |
| CRH PLC | 2.0% |
| British American Tobacco PLC | 2.0% |
| Bank of Ireland Group PLC | 2.0% |
Sector Composition
| Financials | 19.4% |
| Information technology | 13.8% |
| Industrials | 10.3% |
| Health care | 9.7% |
| Materials | 8.9% |
| Consumer discretionary | 8.8% |
| Communication services | 8.2% |
| Consumer staples | 7.9% |
| Energy | 6.9% |
| Utilities | 3.8% |
| Real estate | 1.0% |
| Short-term investments and other | 1.3% |
Country Composition
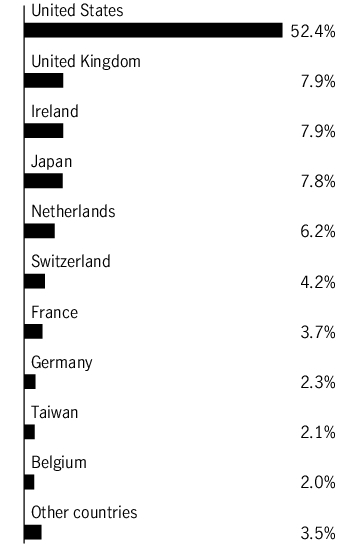
Holdings may not have been held by the fund for the entire period and are subject to change without notice. Portfolio composition is subject to review in accordance with the fund’s investment strategy and may vary in the future. Current and future portfolio holdings are subject to risk and may change at any time.
Top Ten Holdings
| Microsoft Corp. | 6.1% |
| Alphabet, Inc., Class A | 3.0% |
| Taiwan Semiconductor Manufacturing Company, Ltd. | 2.1% |
| Sumitomo Mitsui Trust Group, Inc. | 2.1% |
| McKesson Corp. | 2.1% |
| Sony Group Corp. | 2.1% |
| Anheuser-Busch InBev SA/NV | 2.0% |
| CRH PLC | 2.0% |
| British American Tobacco PLC | 2.0% |
| Bank of Ireland Group PLC | 2.0% |
What were the fund costs during the last year ?
(Based on a hypothetical $10,000 investment)
| Fund (Class) | Costs of a $10,000 investment | Costs paid as a percentage of a $10,000 investment |
| Global Equity Fund (Class R6/JGEMX) |
$95 | 0.88% |
Management’s Discussion of Fund Performance
SUMMARY OF RESULTS
Global Equity Fund (Class R6/JGEMX) returned 15.40% for the year ended August 31, 2026. Significant factors affecting fund performance during the period included a healthy rally in global stock markets, driven by stronger-than-expected corporate profits, resilient global economic growth, and the continuation of robust capital investment in artificial intelligence (AI) infrastructure.
TOP PERFORMANCE CONTRIBUTORS
Information technology | The information technology sector was the fund’s top-performing sector.
Samsung Electronics Company, Ltd. | Growing global demand for high-bandwidth memory, particularly for usage in AI chips and data centers, helped boost this stock.
Taiwan Semiconductor Manufacturing Company, Ltd. | The chipmaker remained an indispensable component in the global semiconductor supply chain as AI-fueled demand remained robust.
TOP PERFORMANCE DETRACTORS
Consumer discretionary | The consumer discretionary sector was one of two sectors in the portfolio to decline for the period amid weaker consumer sentiment in many regions of the globe.
AutoZone, Inc. | Softer revenue growth outside of the U.S. and increased competition domestically weighed on shares of the auto parts retailer.
Lennar Corp. | The homebuilder struggled due to a sluggish real estate market brought on by homebuyer affordability issues, including relatively high mortgage rates and stubbornly elevated home prices.
The views expressed in this report are those of the portfolio management team and are subject to change. They are not meant as investment advice.
Fund Performance
The following graph compares the initial and subsequent account values at the end of each of the most recently completed 10 fiscal years of the fund (or for the life of the fund, if shorter). It assumes a $1,000,000 initial investment in the fund and in an appropriate, broad-based securities market index for the same period.
GROWTH OF $1,000,000
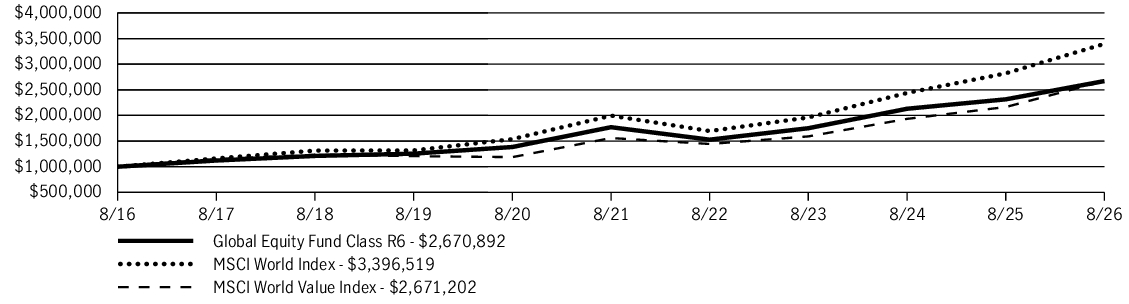
| AVERAGE ANNUAL TOTAL RETURN | 1 Year | 5 Years | 10 Years |
| Global Equity Fund (Class R6/JGEMX) | 15.40% | 8.56% | 10.32% |
| MSCI World Index | 20.37% | 11.21% | 13.01% |
| MSCI World Value Index | 23.41% | 11.36% | 10.32% |
Fund Statistics
| Fund net assets | $1,091,712,086 |
| Total number of portfolio holdings | 66 |
| Total advisory fees paid (net) | $7,374,571 |
| Portfolio turnover rate | 82% |
Graphical Representation of Holdings
The tables below show the investment makeup of the fund, representing a percentage of the total net assets of the fund.
Top Ten Holdings
| Microsoft Corp. | 6.1% |
| Alphabet, Inc., Class A | 3.0% |
| Taiwan Semiconductor Manufacturing Company, Ltd. | 2.1% |
| Sumitomo Mitsui Trust Group, Inc. | 2.1% |
| McKesson Corp. | 2.1% |
| Sony Group Corp. | 2.1% |
| Anheuser-Busch InBev SA/NV | 2.0% |
| CRH PLC | 2.0% |
| British American Tobacco PLC | 2.0% |
| Bank of Ireland Group PLC | 2.0% |
Sector Composition
| Financials | 19.4% |
| Information technology | 13.8% |
| Industrials | 10.3% |
| Health care | 9.7% |
| Materials | 8.9% |
| Consumer discretionary | 8.8% |
| Communication services | 8.2% |
| Consumer staples | 7.9% |
| Energy | 6.9% |
| Utilities | 3.8% |
| Real estate | 1.0% |
| Short-term investments and other | 1.3% |
Country Composition
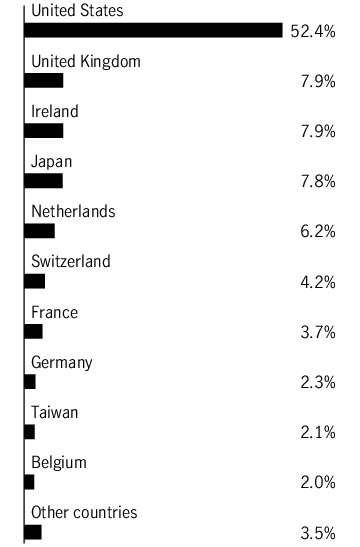
Holdings may not have been held by the fund for the entire period and are subject to change without notice. Portfolio composition is subject to review in accordance with the fund’s investment strategy and may vary in the future. Current and future portfolio holdings are subject to risk and may change at any time.
Top Ten Holdings
| Microsoft Corp. | 6.1% |
| Alphabet, Inc., Class A | 3.0% |
| Taiwan Semiconductor Manufacturing Company, Ltd. | 2.1% |
| Sumitomo Mitsui Trust Group, Inc. | 2.1% |
| McKesson Corp. | 2.1% |
| Sony Group Corp. | 2.1% |
| Anheuser-Busch InBev SA/NV | 2.0% |
| CRH PLC | 2.0% |
| British American Tobacco PLC | 2.0% |
| Bank of Ireland Group PLC | 2.0% |