Shareholder Report
Aug. 31, 2026
USD ($)
Holding
What were the fund costs during the last year ?
(Based on a hypothetical $10,000 investment)
| Fund (Class) | Costs of a $10,000 investment | Costs paid as a percentage of a $10,000 investment |
| Core Bond Fund (Class NAV/JHCDX) |
$61 | 0.61% |
Management’s Discussion of Fund Performance
SUMMARY OF RESULTS
Core Bond Fund (Class NAV/JHCDX) returned 1.55% for the year ended August 31, 2026. High-quality fixed income performed reasonably well during the period, as higher overall yields more than offset weakness resulting from rising interest rates, which were driven by geopolitical conflict, accelerated capital expenditures for artificial intelligence (AI) investment, and sticky inflation.
TOP PERFORMANCE CONTRIBUTORS
Agency mortgage-backed securities | Positions in agency mortgage-backed passthroughs were the largest contributor to performance. Agency collateralized mortgage obligations (CMOs) were also strong contributors.
Asset-backed securities and corporate bonds | Asset-backed securities and corporate bonds issued by financial institutions were also significant contributors to performance.
TOP PERFORMANCE DETRACTORS
U.S. Treasuries | Holdings in longer maturity Treasuries detracted from performance, as yields were not fully able to offset the impact of higher interest rates in this part of the yield curve.
Technology bonds | Holdings in corporate bonds in the technology sector detracted from performance, as concerns over the magnitude of debt issuance used to fund AI-related capital expenditures grew.
The views expressed in this report are those of the portfolio management team and are subject to change. They are not meant as investment advice.
Fund Performance
The following graph compares the initial and subsequent account values at the end of each of the most recently completed 10 fiscal years of the fund (or for the life of the fund, if shorter). It assumes a $10,000 initial investment in the fund and in an appropriate, broad-based securities market index for the same period.
GROWTH OF $10,000
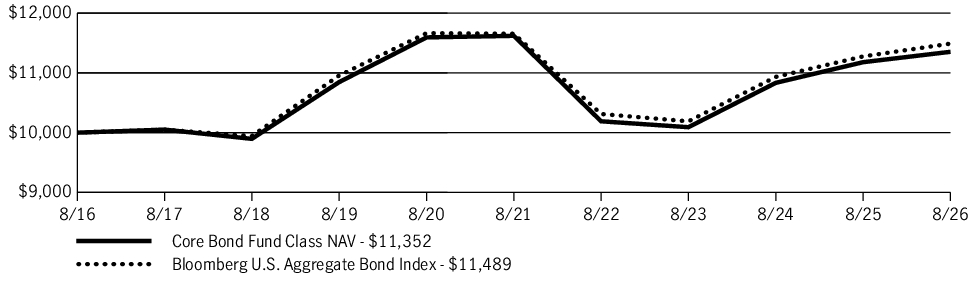
| AVERAGE ANNUAL TOTAL RETURN | 1 Year | 5 Years | 10 Years |
| Core Bond Fund (Class NAV/JHCDX) | 1.55% | (0.46)% | 1.28% |
| Bloomberg U.S. Aggregate Bond Index | 1.89% | (0.29)% | 1.40% |
Fund Statistics
| Fund net assets | $1,687,035,911 |
| Total number of portfolio holdings | 946 |
| Total advisory fees paid (net) | $9,588,543 |
| Portfolio turnover rate | 277% |
Graphical Representation of Holdings
The tables below show the investment makeup of the fund, representing a percentage of the total investments of the fund.
Portfolio Composition
| U.S. Government | 30.4% |
| U.S. Government Agency | 29.2% |
| Corporate bonds | 24.2% |
| Collateralized mortgage obligations – U.S. Government Agency | 5.7% |
| Asset-backed securities | 5.3% |
| Collateralized mortgage obligations – Commercial and residential | 1.2% |
| Foreign government obligations | 0.9% |
| Municipal bonds | 0.1% |
| Short-term investments | 3.0% |
Quality Composition
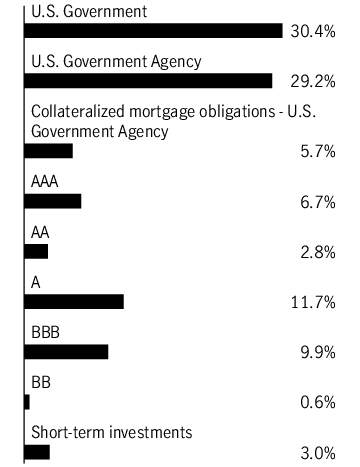
Ratings are from Moody’s Investors Service, Inc. If not available, we have used S&P Global Ratings. In the absence of ratings from these agencies, we have used Fitch Ratings, Inc. “Not rated” securities are those with no ratings available from these agencies. All ratings are as of 8-31-26 and do not reflect subsequent downgrades or upgrades, if any.
Holdings may not have been held by the fund for the entire period and are subject to change without notice. Portfolio composition is subject to review in accordance with the fund’s investment strategy and may vary in the future. Current and future portfolio holdings are subject to risk and may change at any time.
Ratings are from Moody’s Investors Service, Inc. If not available, we have used S&P Global Ratings. In the absence of ratings from these agencies, we have used Fitch Ratings, Inc. “Not rated” securities are those with no ratings available from these agencies. All ratings are as of 8-31-26 and do not reflect subsequent downgrades or upgrades, if any.
What were the fund costs during the last year ?
(Based on a hypothetical $10,000 investment)
| Fund (Class) | Costs of a $10,000 investment | Costs paid as a percentage of a $10,000 investment |
| Mid Value Fund (Class NAV/JMVNX) |
$94 | 0.85% |
Management’s Discussion of Fund Performance
SUMMARY OF RESULTS
Mid Value Fund (Class NAV/JMVNX) returned 22.00% for the year ended August 31, 2026. U.S. equity markets generated strong gains in the 12-month period. Stocks advanced in late 2025, supported by resilient economic growth, Federal Reserve interest rate cuts, solid corporate earnings, and ongoing enthusiasm surrounding artificial intelligence (AI). Markets experienced periods of heightened volatility in 2026 as investors weighed tariff-related inflation concerns, shifting interest rate expectations, and conflict in the Middle East, which drove sharp swings in oil prices. Despite these headwinds, equities recovered from periodic sell-offs and reached new highs, supported by generally strong corporate earnings and continued optimism surrounding AI-related investment.
TOP PERFORMANCE CONTRIBUTORS
Sandisk Corp. | This NAND memory company was the leading absolute contributor to performance as shares surged amid increased recognition of the company’s value potential following its spinoff from Western Digital Corp., supported by sharply higher NAND pricing, substantial margin expansion, and strong AI-driven storage demand.
Western Digital Corp. | The pure-play hard disk drive (HDD) company following its flash business spinoff also aided performance as shares benefited from strong hyperscale cloud HDD demand, higher exabyte volumes, favorable pricing, margin expansion, and durable AI-driven storage demand.
TOP PERFORMANCE DETRACTORS
Perrigo Company PLC | The consumer self-care company detracted the most from absolute performance as soft over-the-counter consumption and persistent infant formula challenges pressured sales and led to reduced expectations, while lower expected cash flows and weaker business prospects resulted in significant goodwill impairments.
Verra Mobility Corp. | The smart mobility technology company also hindered performance as shares declined sharply in May after major customer Avis Budget terminated a significant commercial services contract, prompting management to cut full-year guidance.
The views expressed in this report are those of the portfolio management team and are subject to change. They are not meant as investment advice.
Fund Performance
The following graph compares the initial and subsequent account values at the end of each of the most recently completed 10 fiscal years of the fund (or for the life of the fund, if shorter). It assumes a $10,000 initial investment in the fund and in an appropriate, broad-based securities market index for the same period.
GROWTH OF $10,000
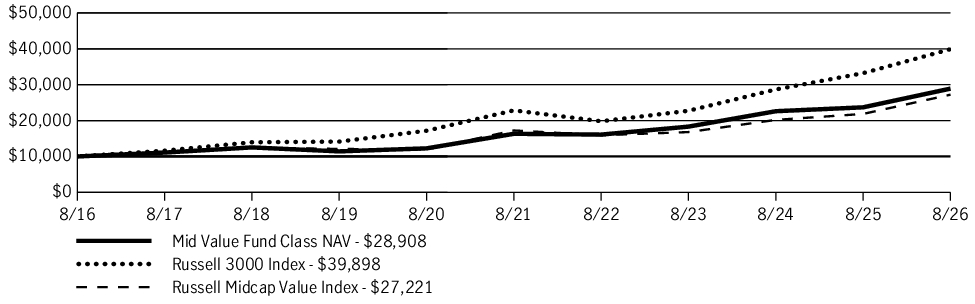
| AVERAGE ANNUAL TOTAL RETURN | 1 Year | 5 Years | 10 Years |
| Mid Value Fund (Class NAV/JMVNX) | 22.00% | 12.12% | 11.20% |
| Russell 3000 Index | 20.10% | 11.80% | 14.84% |
| Russell Midcap Value Index | 24.55% | 9.56% | 10.53% |
Fund Statistics
| Fund net assets | $1,224,953,021 |
| Total number of portfolio holdings | 133 |
| Total advisory fees paid (net) | $10,531,755 |
| Portfolio turnover rate | 48% |
Graphical Representation of Holdings
The tables below show the investment makeup of the fund, representing a percentage of the total net assets of the fund.
Top Ten Holdings
| Corpay, Inc. | 1.9% |
| Phillips 66 | 1.7% |
| Lamb Weston Holdings, Inc. | 1.6% |
| Voya Financial, Inc. | 1.5% |
| StandardAero, Inc. | 1.4% |
| Fortive Corp. | 1.4% |
| Concentra Group Holdings Parent, Inc. | 1.3% |
| Baker Hughes Company | 1.3% |
| Lazard, Inc. | 1.2% |
| Ameren Corp. | 1.2% |
Sector Composition
| Industrials | 19.0% |
| Financials | 19.0% |
| Information technology | 12.3% |
| Energy | 8.9% |
| Real estate | 8.6% |
| Health care | 8.6% |
| Consumer discretionary | 6.7% |
| Utilities | 6.3% |
| Consumer staples | 4.7% |
| Materials | 4.4% |
| Short-term investments and other | 1.5% |
Holdings may not have been held by the fund for the entire period and are subject to change without notice. Portfolio composition is subject to review in accordance with the fund’s investment strategy and may vary in the future. Current and future portfolio holdings are subject to risk and may change at any time.
Top Ten Holdings
| Corpay, Inc. | 1.9% |
| Phillips 66 | 1.7% |
| Lamb Weston Holdings, Inc. | 1.6% |
| Voya Financial, Inc. | 1.5% |
| StandardAero, Inc. | 1.4% |
| Fortive Corp. | 1.4% |
| Concentra Group Holdings Parent, Inc. | 1.3% |
| Baker Hughes Company | 1.3% |
| Lazard, Inc. | 1.2% |
| Ameren Corp. | 1.2% |
What were the fund costs during the last year ?
(Based on a hypothetical $10,000 investment)
| Fund (Class) | Costs of a $10,000 investment | Costs paid as a percentage of a $10,000 investment |
| Capital Appreciation Value Fund (Class NAV/JCAVX) |
$86 | 0.82% |
Management’s Discussion of Fund Performance
SUMMARY OF RESULTS
Capital Appreciation Value Fund (Class NAV/JCAVX) returned 10.24% for the year ended August 31, 2026. U.S. equity markets generated strong gains in the 12-month period. Stocks advanced in late 2025, supported by resilient economic growth, Federal Reserve interest rate cuts, solid corporate earnings, and ongoing enthusiasm surrounding artificial intelligence (AI). Markets experienced periods of heightened volatility in 2026 as investors weighed tariff-related inflation concerns, shifting interest rate expectations, and conflict in the Middle East, which drove sharp swings in oil prices. Despite these headwinds, equities recovered from periodic sell-offs and reached new highs, supported by generally strong corporate earnings and continued optimism surrounding AI-related investment.
TOP PERFORMANCE CONTRIBUTORS
Advanced Micro Devices, Inc. | The leading semiconductor company contributed to absolute returns during the year as its partnership with OpenAI and continued demand for AI-related processors supported its shares.
Apple, Inc. | A position in the company also contributed to absolute returns as investor enthusiasm for new product launches and strong earnings reports supported its shares during the year.
TOP PERFORMANCE DETRACTORS
PTC, Inc. | As a leading computer-aided design and product life-cycle management software provider, PTC detracted from absolute returns during the year as muted guidance, the divestiture of its industrial internet of things business, and competitive concerns weighed on shares.
Meta Platforms, Inc. | Shares of the company detracted from absolute returns as investors remained concerned about the company's increased investment in AI infrastructure throughout the period.
The views expressed in this report are those of the portfolio management team and are subject to change. They are not meant as investment advice.
Fund Performance
The following graph compares the initial and subsequent account values at the end of each of the most recently completed 10 fiscal years of the fund (or for the life of the fund, if shorter). It assumes a $10,000 initial investment in the fund and in an appropriate, broad-based securities market index for the same period.
GROWTH OF $10,000
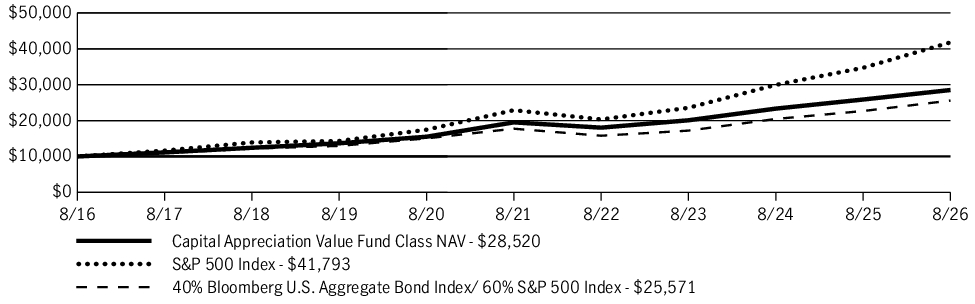
| AVERAGE ANNUAL TOTAL RETURN | 1 Year | 5 Years | 10 Years |
| Capital Appreciation Value Fund (Class NAV/JCAVX) | 10.24% | 7.90% | 11.05% |
| S&P 500 Index | 20.38% | 12.79% | 15.37% |
| 40% Bloomberg U.S. Aggregate Bond Index/ 60% S&P 500 Index | 12.82% | 7.59% | 9.84% |
Fund Statistics
| Fund net assets | $1,335,287,184 |
| Total number of portfolio holdings | 245 |
| Total advisory fees paid (net) | $9,504,811 |
| Portfolio turnover rate | 144% |
Graphical Representation of Holdings
The tables below show the investment makeup of the fund, representing a percentage of the total net assets of the fund.
Top Ten Holdings
| Microsoft Corp. | 4.1% |
| NVIDIA Corp. | 3.5% |
| Amazon.com, Inc. | 3.4% |
| U.S. Treasury Note, 4.250%, 06/30/2033 | 3.0% |
| U.S. Treasury Note, 3.500%, 02/28/2031 | 2.4% |
| CenterPoint Energy, Inc. | 2.4% |
| Advanced Micro Devices, Inc. | 2.3% |
| Cencora, Inc. | 2.3% |
| Apple, Inc. | 2.1% |
| Meta Platforms, Inc., Class A | 2.0% |
Portfolio Composition
| Common stocks | 61.3% |
| U.S. Government | 15.1% |
| Corporate bonds | 9.1% |
| Term loans | 7.7% |
| Short-term investments and other | 6.8% |
Holdings may not have been held by the fund for the entire period and are subject to change without notice. Portfolio composition is subject to review in accordance with the fund’s investment strategy and may vary in the future. Current and future portfolio holdings are subject to risk and may change at any time.
Top Ten Holdings
| Microsoft Corp. | 4.1% |
| NVIDIA Corp. | 3.5% |
| Amazon.com, Inc. | 3.4% |
| U.S. Treasury Note, 4.250%, 06/30/2033 | 3.0% |
| U.S. Treasury Note, 3.500%, 02/28/2031 | 2.4% |
| CenterPoint Energy, Inc. | 2.4% |
| Advanced Micro Devices, Inc. | 2.3% |
| Cencora, Inc. | 2.3% |
| Apple, Inc. | 2.1% |
| Meta Platforms, Inc., Class A | 2.0% |
What were the fund costs during the last year ?
(Based on a hypothetical $10,000 investment)
| Fund (Class) | Costs of a $10,000 investment | Costs paid as a percentage of a $10,000 investment |
| International Strategic Equity Allocation Fund (Class NAV) |
$63 | 0.56% |
Management’s Discussion of Fund Performance
SUMMARY OF RESULTS
International Strategic Equity Allocation Fund (Class NAV) returned 26.73% for the year ended August 31, 2026. International equity markets advanced during the period, supported by solid corporate earnings growth, continued investment in artificial intelligence (AI) related infrastructure, resilient economic activity, and generally accommodative monetary policies. Periodic volatility stemming from geopolitical tensions, higher energy prices, and trade policy uncertainty tempered gains but did not derail overall positive market performance.
TOP PERFORMANCE CONTRIBUTORS
Information technology stocks | The information technology sector contributed the most to absolute performance. Holdings in Taiwan Semiconductor Manufacturing Company, Ltd. were an indispensable component in the global semiconductor supply chain as AI-fueled demand remained robust.
Samsung Electronics Company, Ltd. | Growing global demand for high-bandwidth memory, particularly for usage in AI chips and datacenters, helped boost this stock.
TOP PERFORMANCE DETRACTORS
Communication services | This was the only sector detracting from absolute performance primarily as a result of holdings in Tencent Holdings, Ltd.
Certain other holdings | Other weak performers included SAP SE, Xiaomi Corp., and Novo Nordisk A/S.
The views expressed in this report are those of the portfolio management team and are subject to change. They are not meant as investment advice.
Fund Performance
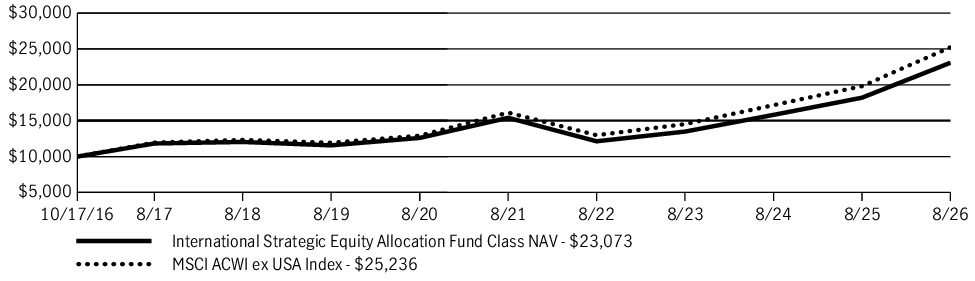
The following graph compares the initial and subsequent account values at the end of each of the most recently completed 10 fiscal years of the fund (or for the life of the fund, if shorter). It assumes a $10,000 initial investment in the fund and in an appropriate, broad-based securities market index for the same period.
GROWTH OF $10,000
| AVERAGE ANNUAL TOTAL RETURN | 1 Year | 5 Years | Since inception |
| International Strategic Equity Allocation Fund (Class NAV) | 26.73% | 8.42% | 8.84% |
| MSCI ACWI ex USA Index | 27.35% | 9.37% | 9.83% |
Fund Statistics
| Fund net assets | $5,438,015,862 |
| Total number of portfolio holdings | 1,966 |
| Total advisory fees paid (net) | $24,360,213 |
| Portfolio turnover rate | 29% |
Graphical Representation of Holdings
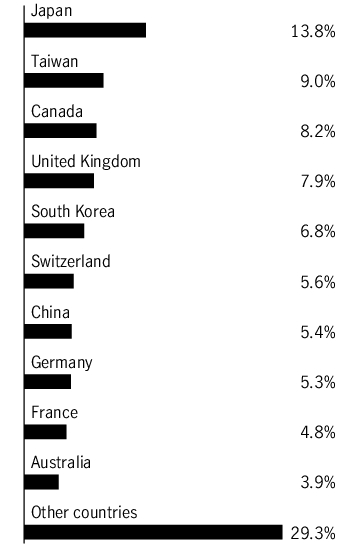
The tables below show the investment makeup of the fund, representing a percentage of the total net assets of the fund.
Top Ten Holdings
| Taiwan Semiconductor Manufacturing Company, Ltd. | 5.0% |
| Samsung Electronics Company, Ltd. | 2.4% |
| SK Hynix, Inc. | 1.8% |
| ASML Holding NV | 1.8% |
| HSBC Holdings PLC | 0.9% |
| Tencent Holdings, Ltd. | 0.9% |
| Roche Holding AG | 0.8% |
| Royal Bank of Canada | 0.8% |
| Novartis AG | 0.7% |
| Shell PLC | 0.7% |
Sector Composition
| Financials | 25.3% |
| Information technology | 20.4% |
| Industrials | 13.8% |
| Consumer discretionary | 7.7% |
| Materials | 7.0% |
| Health care | 6.7% |
| Consumer staples | 4.9% |
| Energy | 4.8% |
| Communication services | 4.3% |
| Utilities | 3.0% |
| Real estate | 1.2% |
| Short-term investments and other | 0.9% |
Country Composition
Holdings may not have been held by the fund for the entire period and are subject to change without notice. Portfolio composition is subject to review in accordance with the fund’s investment strategy and may vary in the future. Current and future portfolio holdings are subject to risk and may change at any time.
Top Ten Holdings
| Taiwan Semiconductor Manufacturing Company, Ltd. | 5.0% |
| Samsung Electronics Company, Ltd. | 2.4% |
| SK Hynix, Inc. | 1.8% |
| ASML Holding NV | 1.8% |
| HSBC Holdings PLC | 0.9% |
| Tencent Holdings, Ltd. | 0.9% |
| Roche Holding AG | 0.8% |
| Royal Bank of Canada | 0.8% |
| Novartis AG | 0.7% |
| Shell PLC | 0.7% |
This report describes changes to the fund that occurred during the reporting period.
What were the fund costs during the last year ?
(Based on a hypothetical $10,000 investment)
| Fund (Class) | Costs of a $10,000 investment | Costs paid as a percentage of a $10,000 investment |
| U.S. Sector Rotation Fund (Class NAV) |
$58 | 0.53% |
Management’s Discussion of Fund Performance
SUMMARY OF RESULTS
U.S. Sector Rotation Fund (Class NAV) returned 19.75% for the year ended August 31, 2026. U.S. equities delivered a robust gain in the annual period, albeit with a brief stretch of weakness in March following the start of the conflict in Iran. Investors were encouraged by the highly favorable backdrop of healthy economic growth trends, strong corporate earnings, and supportive U.S. Federal Reserve policy, as well as optimism about artificial intelligence (AI).
TOP PERFORMANCE CONTRIBUTORS
Information technology | Stocks in this sector made the largest contribution to absolute performance due to the combination of their return and sizable portfolio weighting. The semiconductor stocks Apple, Inc., NVIDIA Corp., and Micron Technology, Inc. all performed well.
Health care | Eli Lilly & Company, which continued to benefit from strong demand for its weight loss drugs, also added to absolute performance.
Communication services | Alphabet, Inc. was a leading contributor in this sector along with Warner Brothers Discovery, Inc., and Verizon Communications, Inc.
TOP PERFORMANCE DETRACTORS
Specific individual holdings | Shares of Meta Platforms, Inc. came under pressure on concerns that the company’s significant investments in AI were reducing its free cash flow. Netflix, Inc., which lagged due to slower subscriber growth and declining viewer engagement, was another key detractor.
Certain software stocks | Although the fund’s information technology holdings performed well overall, certain software stocks—including Microsoft Corp. and Oracle Corp.—were notable detractors.
The views expressed in this report are those of the portfolio management team and are subject to change. They are not meant as investment advice.
Fund Performance
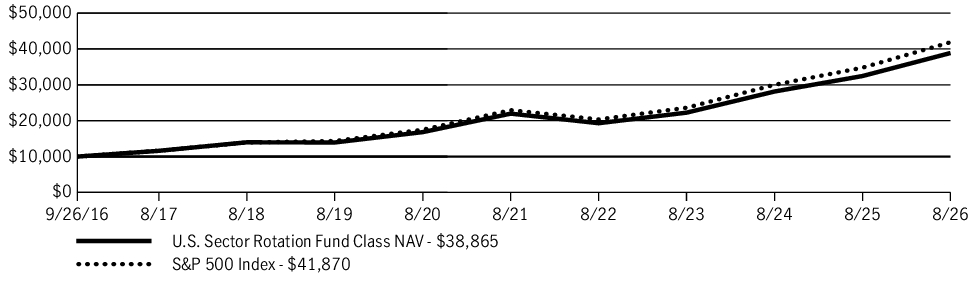
The following graph compares the initial and subsequent account values at the end of each of the most recently completed 10 fiscal years of the fund (or for the life of the fund, if shorter). It assumes a $10,000 initial investment in the fund and in an appropriate, broad-based securities market index for the same period.
GROWTH OF $10,000
| AVERAGE ANNUAL TOTAL RETURN | 1 Year | 5 Years | Since inception |
| U.S. Sector Rotation Fund (Class NAV) | 19.75% | 12.08% | 14.65% |
| S&P 500 Index | 20.38% | 12.79% | 15.51% |
Fund Statistics
| Fund net assets | $5,076,222,203 |
| Total number of portfolio holdings | 508 |
| Total advisory fees paid (net) | $24,883,870 |
| Portfolio turnover rate | 18% |
Graphical Representation of Holdings
The tables below show the investment makeup of the fund, representing a percentage of the total net assets of the fund.
Top Ten Holdings
| NVIDIA Corp. | 7.9% |
| Apple, Inc. | 6.9% |
| Microsoft Corp. | 5.6% |
| Amazon.com, Inc. | 3.6% |
| Alphabet, Inc., Class A | 2.9% |
| Broadcom, Inc. | 2.6% |
| Alphabet, Inc., Class C | 2.3% |
| Meta Platforms, Inc., Class A | 1.8% |
| Micron Technology, Inc. | 1.6% |
| Tesla, Inc. | 1.5% |
Sector Composition
| Information technology | 37.0% |
| Financials | 12.0% |
| Health care | 9.2% |
| Communication services | 9.1% |
| Consumer discretionary | 8.7% |
| Industrials | 7.9% |
| Consumer staples | 4.2% |
| Energy | 3.5% |
| Materials | 1.8% |
| Utilities | 1.7% |
| Real estate | 1.7% |
| Short-term investments and other | 3.2% |
Holdings may not have been held by the fund for the entire period and are subject to change without notice. Portfolio composition is subject to review in accordance with the fund’s investment strategy and may vary in the future. Current and future portfolio holdings are subject to risk and may change at any time.
Top Ten Holdings
| NVIDIA Corp. | 7.9% |
| Apple, Inc. | 6.9% |
| Microsoft Corp. | 5.6% |
| Amazon.com, Inc. | 3.6% |
| Alphabet, Inc., Class A | 2.9% |
| Broadcom, Inc. | 2.6% |
| Alphabet, Inc., Class C | 2.3% |
| Meta Platforms, Inc., Class A | 1.8% |
| Micron Technology, Inc. | 1.6% |
| Tesla, Inc. | 1.5% |
Material Fund Changes
At a special meeting of shareholders of the fund held on May 26, 2026, the fund’s shareholders approved a proposal to change the fund’s diversification status from diversified to non-diversified effective on June 1, 2026 (the Effective Date). In connection with this change, non-diversified risk was added to the fund’s Prospectus.
This is a summary of certain changes to the fund since 9-1-25 . For more complete information, please refer to the fund’s prospectus. The currently effective prospectus is available at jhinvestments.com/underlying-funds or by calling 800-344-1029.