
Franklin BSP Realty Trust Third Quarter 2026 Supplemental Information
B E N E F I T S T R E E T P A R T N E R S 2 Important Information The information herein relates to the Company’s business and financial information as of September 30, 2026 and does not reflect subsequent developments. Risk Factors Investing in and owning our common stock involves a high degree of risk. For a discussion of these risks, see the section entitled “Risk Factors” in our Annual Report on Form 10- K filed with the SEC on February 25, 2026, and the risk disclosures in our subsequent periodic reports filed with the SEC, including our Quarterly Report on Form 10-Q for the quarter ended September 30, 2026. Forward-Looking Statements Certain statements included in this presentation are forward-looking statements. Those statements include statements regarding the intent, belief or current expectations of Franklin BSP Realty Trust, Inc. (“FBRT” or the “Company”) and may include the assumptions on which such statements are based, and generally are identified by the use of words such as "may," "will," "seeks," "anticipates," "believes," "estimates," "expects," "plans," "intends," "should" or similar expressions. Actual results may differ materially from those contemplated by such forward-looking statements. Factors that could cause actual outcomes to differ materially from our forward-looking statements include macroeconomic factors in the United States including inflation, changing interest rates and economic contraction, impairments in the value of real estate property securing our loans or that we own, the extent of any recoveries on delinquent loans, and the financial stability of our borrowers, and the other factors set forth in the risk factors section of our most recent Form 10-K and Form 10-Q. The extent to which these factors impact us and our borrowers will depend on future developments, which are highly uncertain and cannot be predicted with confidence. Further, forward-looking statements speak only as of the date they are made, and we undertake no obligation to update or revise forward-looking statements to reflect changed assumptions, the occurrence of unanticipated events or changes to future operating results over time, except as required by law. Additional Important Information The summary information provided in this presentation does not purport to be complete and no obligation to update or otherwise revise such information is being assumed. Nothing shall be relied upon as a promise or representation as to the future performance of the Company. This summary is not an offer to sell securities and is not soliciting an offer to buy securities in any jurisdiction where the offer or sale is not permitted. This summary is not advice, a recommendation or an offer to enter into any transaction with us or any of our affiliated funds. There is no guarantee that any of the goals, targets or objectives described in this summary will be achieved. The information contained herein is not intended to provide, and should not be relied upon for, accounting, legal, ERISA or tax advice or investment recommendations. Investors should also seek advice from their own independent tax, accounting, financial, ERISA, investment and legal advisors to properly assess the merits and risks associated with their investment in light of their own financial condition and other circumstances. The information contained herein is qualified in its entirety by reference to our most recent Annual Report on Form 10-K and Quarterly Report on Form 10-Q. You may obtain a copy of the most recent Annual Report or Quarterly Report by calling (844) 785-4393 and/or visiting www.fbrtreit.com. This presentation contains information regarding FBRT’s financial results that is calculated and presented on the basis of methodologies other than in accordance with accounting principles generally accepted in the United States (“GAAP”), including Distributable Earnings. Please refer to the appendix for the reconciliation of the applicable GAAP financial measures to non-GAAP financial measures. PAST PERFORMANCE IS NOT A GUARANTEE OR INDICATIVE OF FUTURE RESULTS. INVESTMENTS INVOLVE SIGNIFICANT RISKS, INCLUDING LOSS OF THE ENTIRE INVESTMENT. There is no guarantee that any of the estimates, targets or projections illustrated in this summary will be achieved. Any references herein to any of the Company’s past or present investments, portfolio characteristics, or performance, have been provided for illustrative purposes only. It should not be assumed that these investments were or will be profitable or that any future investments will be profitable or will equal the performance of these investments. There can be no guarantee that the investment objective of the Company will be achieved. Any investment entails a risk of loss. An investor could lose all or substantially all of his or her investment. Please refer to our most recent Annual Report on Form 10-K and Quarterly Report on Form 10-Q for a more complete list of risk factors. The following slides contain summaries of certain financial information about the Company. The information contained in this presentation is summary information that is intended to be considered in the context of our filings with the Securities and Exchange Commission and other public announcements that we may make, by press release or otherwise, from time to time.
FBRT 3Q 2026 Financial Update
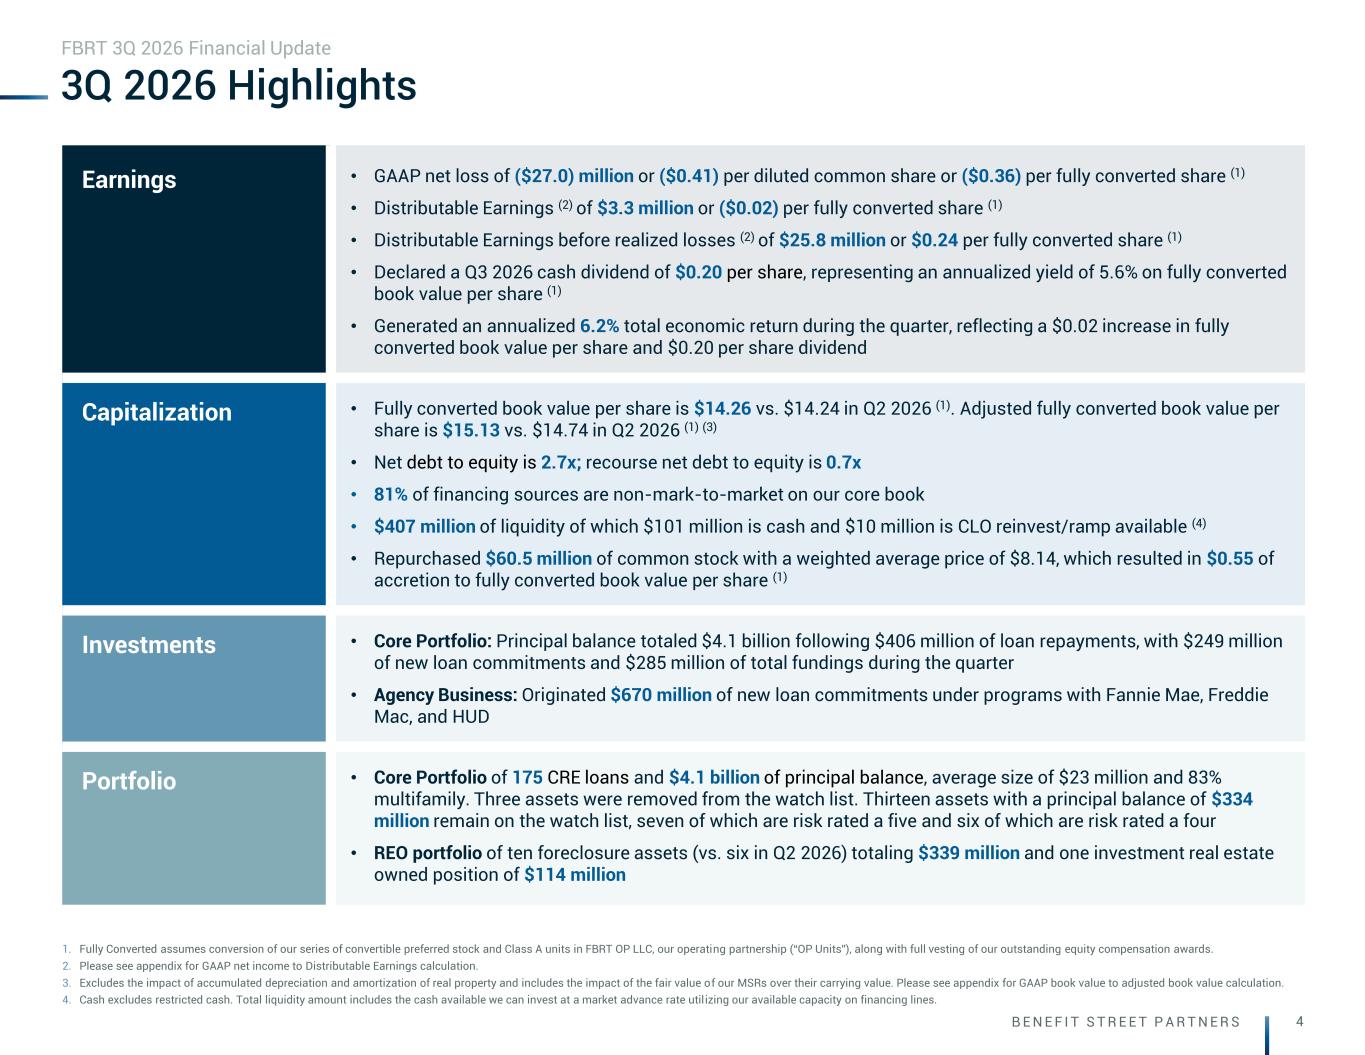
B E N E F I T S T R E E T P A R T N E R S 4 3Q 2026 Highlights 1. Fully Converted assumes conversion of our series of convertible preferred stock and Class A units in FBRT OP LLC, our operating partnership (“OP Units”), along with full vesting of our outstanding equity compensation awards. 2. Please see appendix for GAAP net income to Distributable Earnings calculation. 3. Excludes the impact of accumulated depreciation and amortization of real property and includes the impact of the fair value of our MSRs over their carrying value. Please see appendix for GAAP book value to adjusted book value calculation. 4. Cash excludes restricted cash. Total liquidity amount includes the cash available we can invest at a market advance rate utilizing our available capacity on financing lines. FBRT 3Q 2026 Financial Update Earnings • GAAP net loss of ($27.0) million or ($0.41) per diluted common share or ($0.36) per fully converted share (1) • Distributable Earnings (2) of $3.3 million or ($0.02) per fully converted share (1) • Distributable Earnings before realized losses (2) of $25.8 million or $0.24 per fully converted share (1) • Declared a Q3 2026 cash dividend of $0.20 per share, representing an annualized yield of 5.6% on fully converted book value per share (1) • Generated an annualized 6.2% total economic return during the quarter, reflecting a $0.02 increase in fully converted book value per share and $0.20 per share dividend Capitalization • Fully converted book value per share is $14.26 vs. $14.24 in Q2 2026 (1). Adjusted fully converted book value per share is $15.13 vs. $14.74 in Q2 2026 (1) (3) • Net debt to equity is 2.7x; recourse net debt to equity is 0.7x • 81% of financing sources are non-mark-to-market on our core book • $407 million of liquidity of which $101 million is cash and $10 million is CLO reinvest/ramp available (4) • Repurchased $60.5 million of common stock with a weighted average price of $8.14, which resulted in $0.55 of accretion to fully converted book value per share (1) Investments • Core Portfolio: Principal balance totaled $4.1 billion following $406 million of loan repayments, with $249 million of new loan commitments and $285 million of total fundings during the quarter • Agency Business: Originated $670 million of new loan commitments under programs with Fannie Mae, Freddie Mac, and HUD Portfolio • Core Portfolio of 175 CRE loans and $4.1 billion of principal balance, average size of $23 million and 83% multifamily. Three assets were removed from the watch list. Thirteen assets with a principal balance of $334 million remain on the watch list, seven of which are risk rated a five and six of which are risk rated a four • REO portfolio of ten foreclosure assets (vs. six in Q2 2026) totaling $339 million and one investment real estate owned position of $114 million
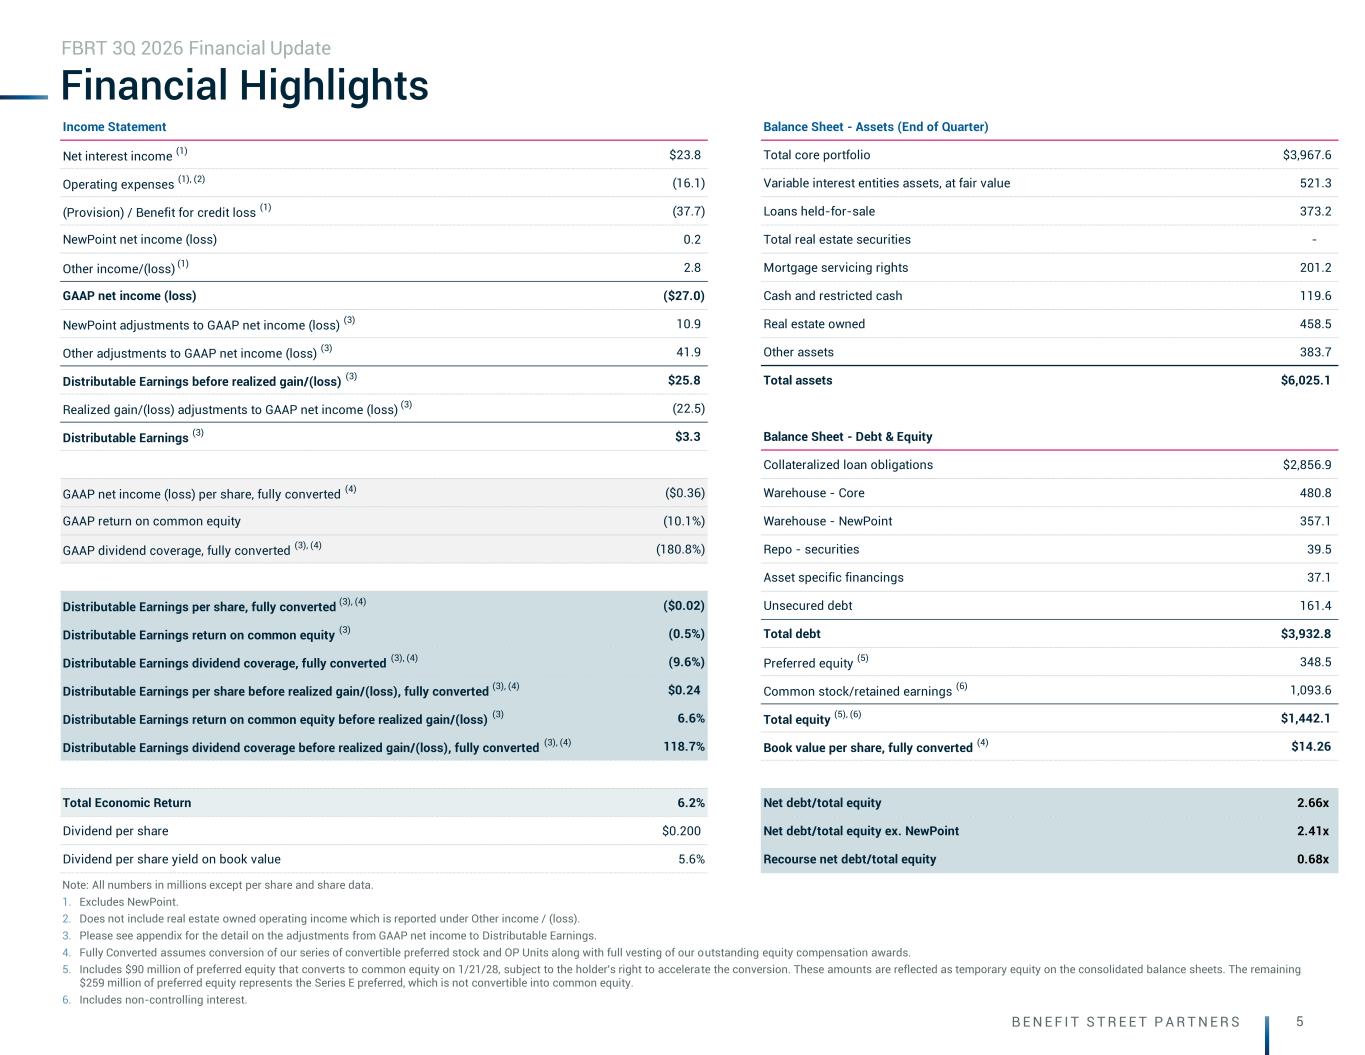
B E N E F I T S T R E E T P A R T N E R S 5 Income Statement Balance Sheet - Assets (End of Quarter) Net interest income (1) $23.8 Total core portfolio $3,967.6 Operating expenses (1), (2) (16.1) Variable interest entities assets, at fair value 521.3 (Provision) / Benefit for credit loss (1) (37.7) Loans held-for-sale 373.2 NewPoint net income (loss) 0.2 Total real estate securities - Other income/(loss) (1) 2.8 Mortgage servicing rights 201.2 GAAP net income (loss) ($27.0) Cash and restricted cash 119.6 NewPoint adjustments to GAAP net income (loss) (3) 10.9 Real estate owned 458.5 Other adjustments to GAAP net income (loss) (3) 41.9 Other assets 383.7 Distributable Earnings before realized gain/(loss) (3) $25.8 Total assets $6,025.1 Realized gain/(loss) adjustments to GAAP net income (loss) (3) (22.5) Distributable Earnings (3) $3.3 Balance Sheet - Debt & Equity Collateralized loan obligations $2,856.9 GAAP net income (loss) per share, fully converted (4) ($0.36) Warehouse - Core 480.8 GAAP return on common equity (10.1%) Warehouse - NewPoint 357.1 GAAP dividend coverage, fully converted (3), (4) (180.8%) Repo - securities 39.5 Asset specific financings 37.1 Distributable Earnings per share, fully converted (3), (4) ($0.02) Unsecured debt 161.4 Distributable Earnings return on common equity (3) (0.5%) Total debt $3,932.8 Distributable Earnings dividend coverage, fully converted (3), (4) (9.6%) Preferred equity (5) 348.5 Distributable Earnings per share before realized gain/(loss), fully converted (3), (4) $0.24 Common stock/retained earnings (6) 1,093.6 Distributable Earnings return on common equity before realized gain/(loss) (3) 6.6% Total equity (5), (6) $1,442.1 Distributable Earnings dividend coverage before realized gain/(loss), fully converted (3), (4) 118.7% Book value per share, fully converted (4) $14.26 Total Economic Return 6.2% Net debt/total equity 2.66x Dividend per share $0.200 Net debt/total equity ex. NewPoint 2.41x Dividend per share yield on book value 5.6% Recourse net debt/total equity 0.68x Financial Highlights Note: All numbers in millions except per share and share data. 1. Excludes NewPoint. 2. Does not include real estate owned operating income which is reported under Other income / (loss). 3. Please see appendix for the detail on the adjustments from GAAP net income to Distributable Earnings. 4. Fully Converted assumes conversion of our series of convertible preferred stock and OP Units along with full vesting of our outstanding equity compensation awards. 5. Includes $90 million of preferred equity that converts to common equity on 1/21/28, subject to the holder's right to accelerate the conversion. These amounts are reflected as temporary equity on the consolidated balance sheets. The remaining $259 million of preferred equity represents the Series E preferred, which is not convertible into common equity. 6. Includes non-controlling interest. FBRT 3Q 2026 Financial Update
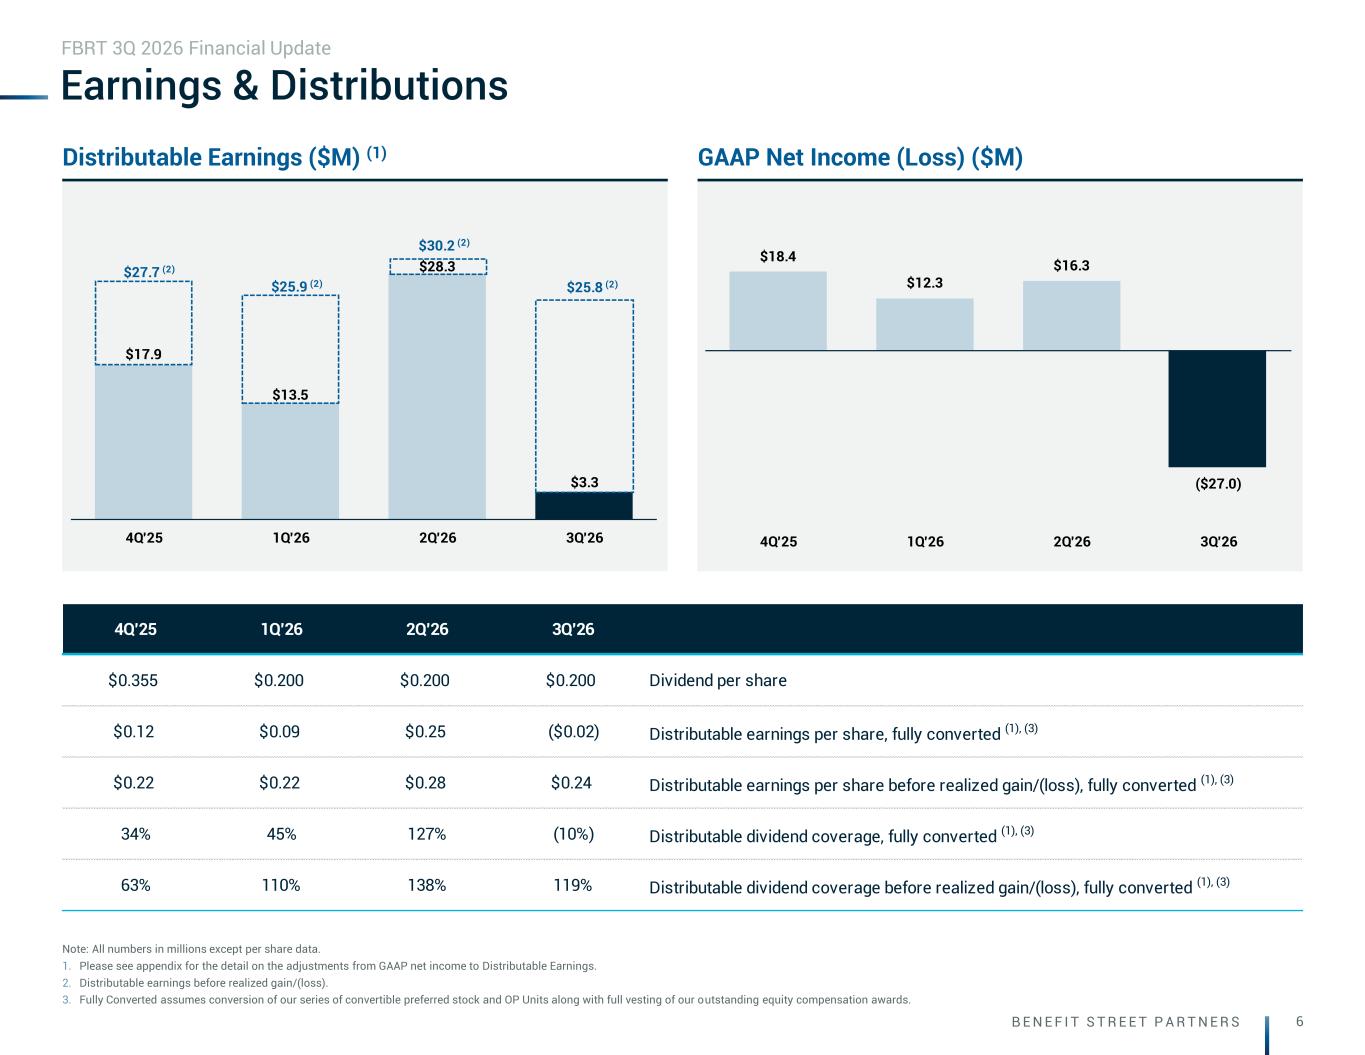
B E N E F I T S T R E E T P A R T N E R S 6 $17.9 $13.5 $28.3 $3.3 4Q'25 1Q'26 2Q'26 3Q'26 $25.9 (2) $25.8 (2) $27.7 (2) $30.2 (2) Earnings & Distributions Note: All numbers in millions except per share data. 1. Please see appendix for the detail on the adjustments from GAAP net income to Distributable Earnings. 2. Distributable earnings before realized gain/(loss). 3. Fully Converted assumes conversion of our series of convertible preferred stock and OP Units along with full vesting of our outstanding equity compensation awards. FBRT 3Q 2026 Financial Update Distributable Earnings ($M) (1) GAAP Net Income (Loss) ($M) $18.4 $12.3 $16.3 ($27.0) 4Q'25 1Q'26 2Q'26 3Q'26 4Q'25 1Q'26 2Q'26 3Q'26 $0.355 $0.200 $0.200 $0.200 Dividend per share $0.12 $0.09 $0.25 ($0.02) Distributable earnings per share, fully converted (1), (3) $0.22 $0.22 $0.28 $0.24 Distributable earnings per share before realized gain/(loss), fully converted (1), (3) 34% 45% 127% (10%) Distributable dividend coverage, fully converted (1), (3) 63% 110% 138% 119% Distributable dividend coverage before realized gain/(loss), fully converted (1), (3)
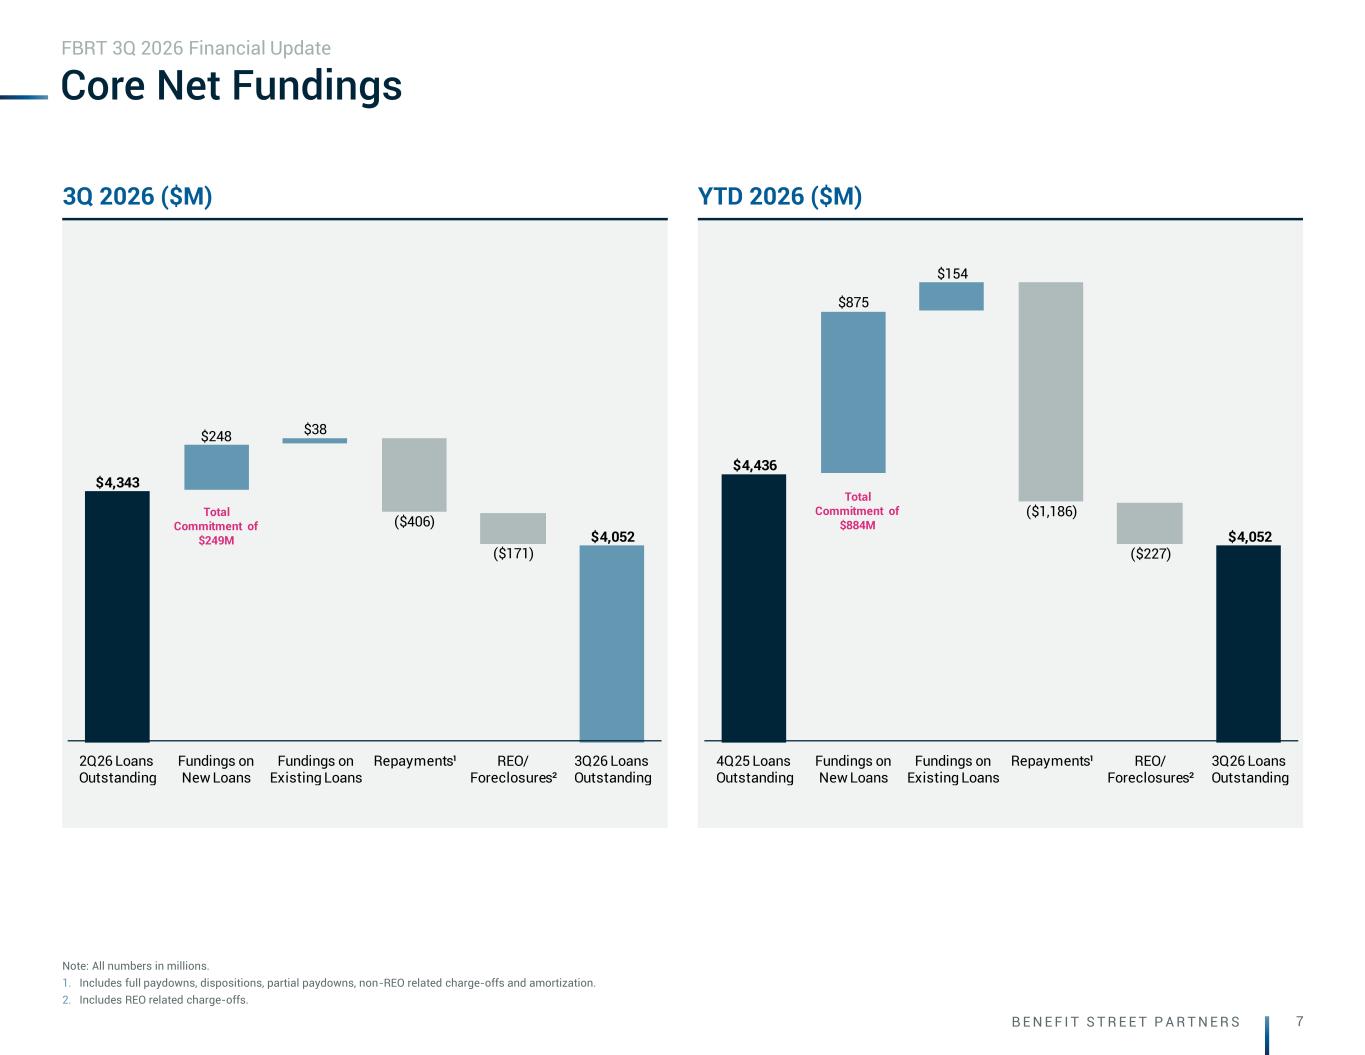
B E N E F I T S T R E E T P A R T N E R S 7 Core Net Fundings Note: All numbers in millions. 1. Includes full paydowns, dispositions, partial paydowns, non-REO related charge-offs and amortization. 2. Includes REO related charge-offs. FBRT 3Q 2026 Financial Update 3Q 2026 ($M) YTD 2026 ($M) $248 $38 ($406) $4,343 ($171) $4,052 2Q26 Loans Outstanding Fundings on New Loans Fundings on Existing Loans Repayments¹ REO/ Foreclosures² 3Q26 Loans Outstanding $875 $154 ($1,186) ($227) $4,436 $4,052 4Q25 Loans Outstanding Fundings on New Loans Fundings on Existing Loans Repayments¹ REO/ Foreclosures² 3Q26 Loans Outstanding Total Commitment of $884M Total Commitment of $249M
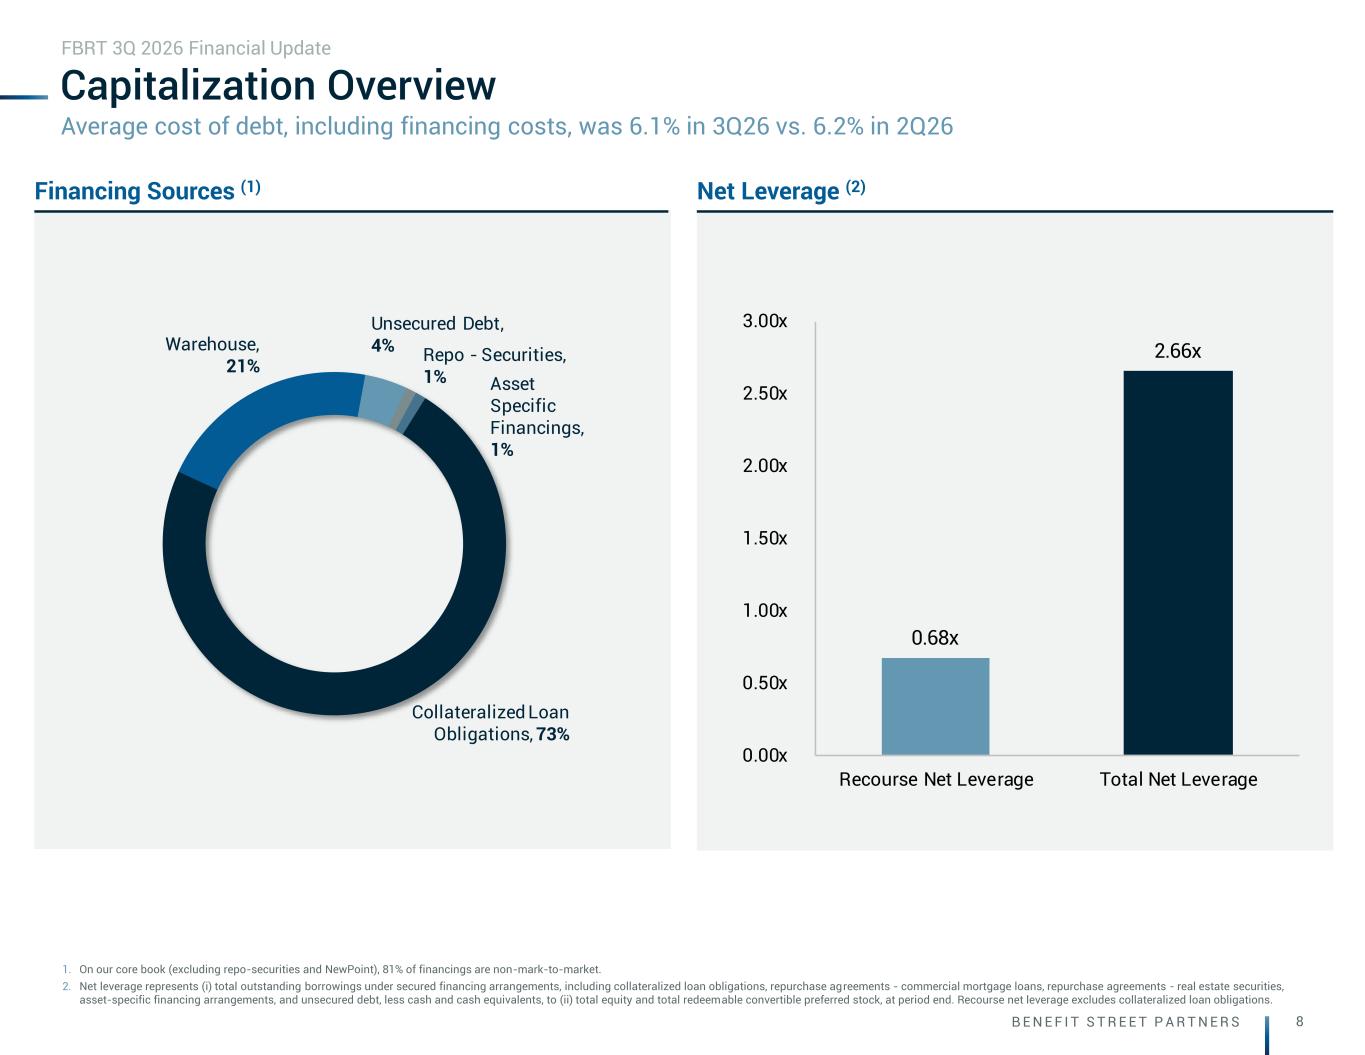
B E N E F I T S T R E E T P A R T N E R S 8 Collateralized Loan Obligations, 73% Warehouse, 21% Unsecured Debt, 4% Repo - Securities, 1% Asset Specific Financings, 1% Capitalization Overview 1. On our core book (excluding repo-securities and NewPoint), 81% of financings are non-mark-to-market. 2. Net leverage represents (i) total outstanding borrowings under secured financing arrangements, including collateralized loan obligations, repurchase agreements - commercial mortgage loans, repurchase agreements - real estate securities, asset-specific financing arrangements, and unsecured debt, less cash and cash equivalents, to (ii) total equity and total redeemable convertible preferred stock, at period end. Recourse net leverage excludes collateralized loan obligations. FBRT 3Q 2026 Financial Update Financing Sources (1) Net Leverage (2) Average cost of debt, including financing costs, was 6.1% in 3Q26 vs. 6.2% in 2Q26 0.68x 2.66x 0.00x 0.50x 1.00x 1.50x 2.00x 2.50x 3.00x Recourse Net Leverage Total Net Leverage
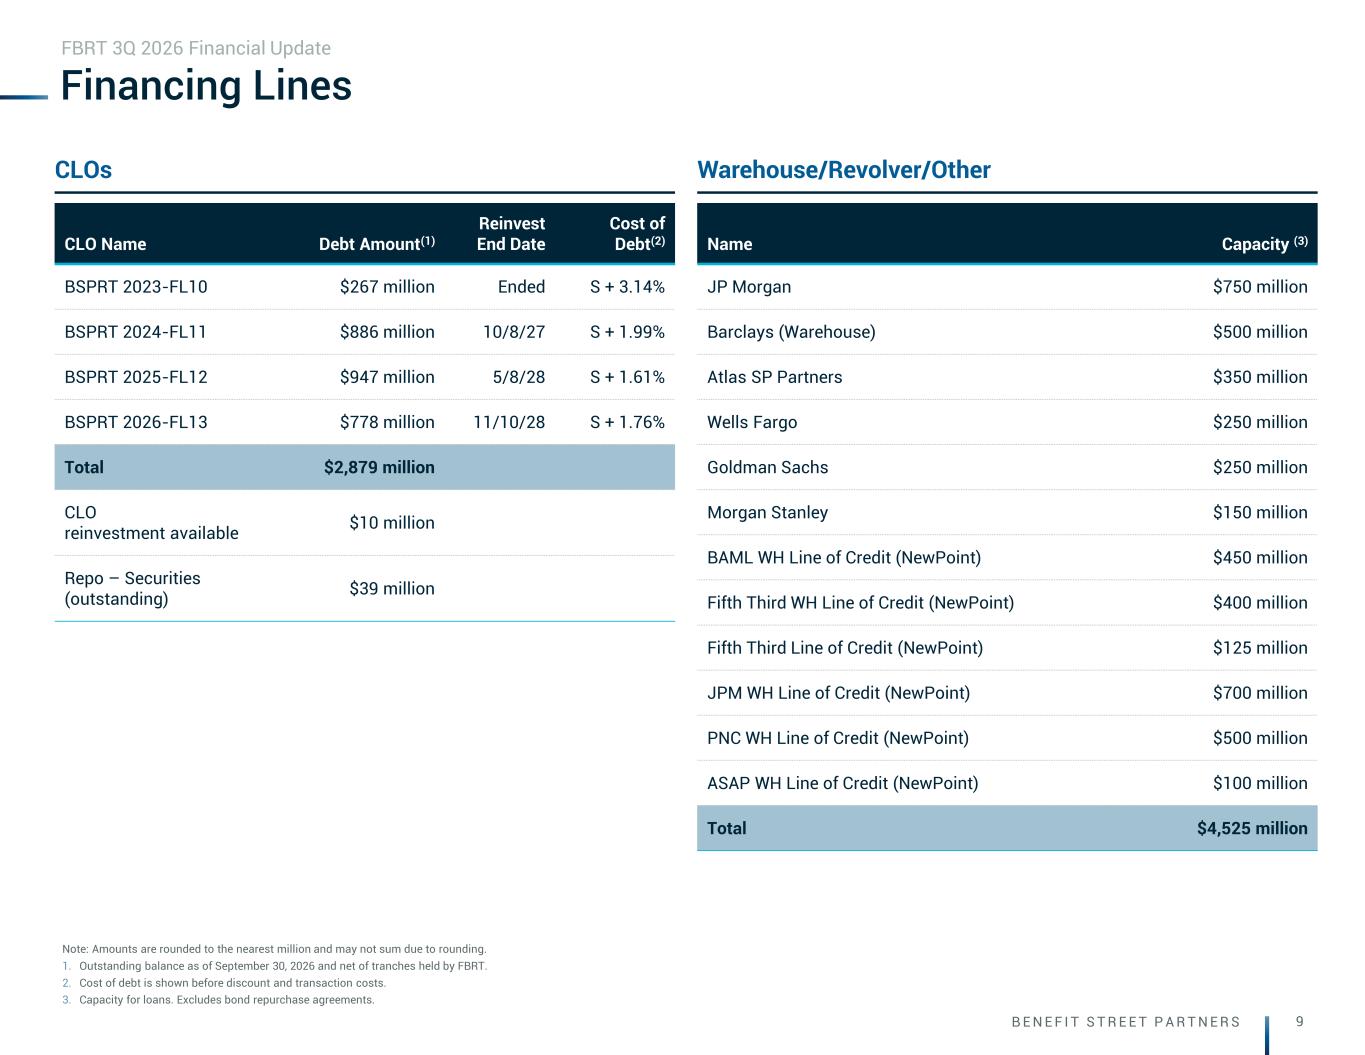
B E N E F I T S T R E E T P A R T N E R S 9 Financing Lines Note: Amounts are rounded to the nearest million and may not sum due to rounding. 1. Outstanding balance as of September 30, 2026 and net of tranches held by FBRT. 2. Cost of debt is shown before discount and transaction costs. 3. Capacity for loans. Excludes bond repurchase agreements. FBRT 3Q 2026 Financial Update CLOs Warehouse/Revolver/Other CLO Name Debt Amount(1) Reinvest End Date Cost of Debt(2) BSPRT 2023-FL10 $267 million Ended S + 3.14% BSPRT 2024-FL11 $886 million 10/8/27 S + 1.99% BSPRT 2025-FL12 $947 million 5/8/28 S + 1.61% BSPRT 2026-FL13 $778 million 11/10/28 S + 1.76% Total $2,879 million CLO reinvestment available $10 million Repo – Securities (outstanding) $39 million Name Capacity (3) JP Morgan $750 million Barclays (Warehouse) $500 million Atlas SP Partners $350 million Wells Fargo $250 million Goldman Sachs $250 million Morgan Stanley $150 million BAML WH Line of Credit (NewPoint) $450 million Fifth Third WH Line of Credit (NewPoint) $400 million Fifth Third Line of Credit (NewPoint) $125 million JPM WH Line of Credit (NewPoint) $700 million PNC WH Line of Credit (NewPoint) $500 million ASAP WH Line of Credit (NewPoint) $100 million Total $4,525 million
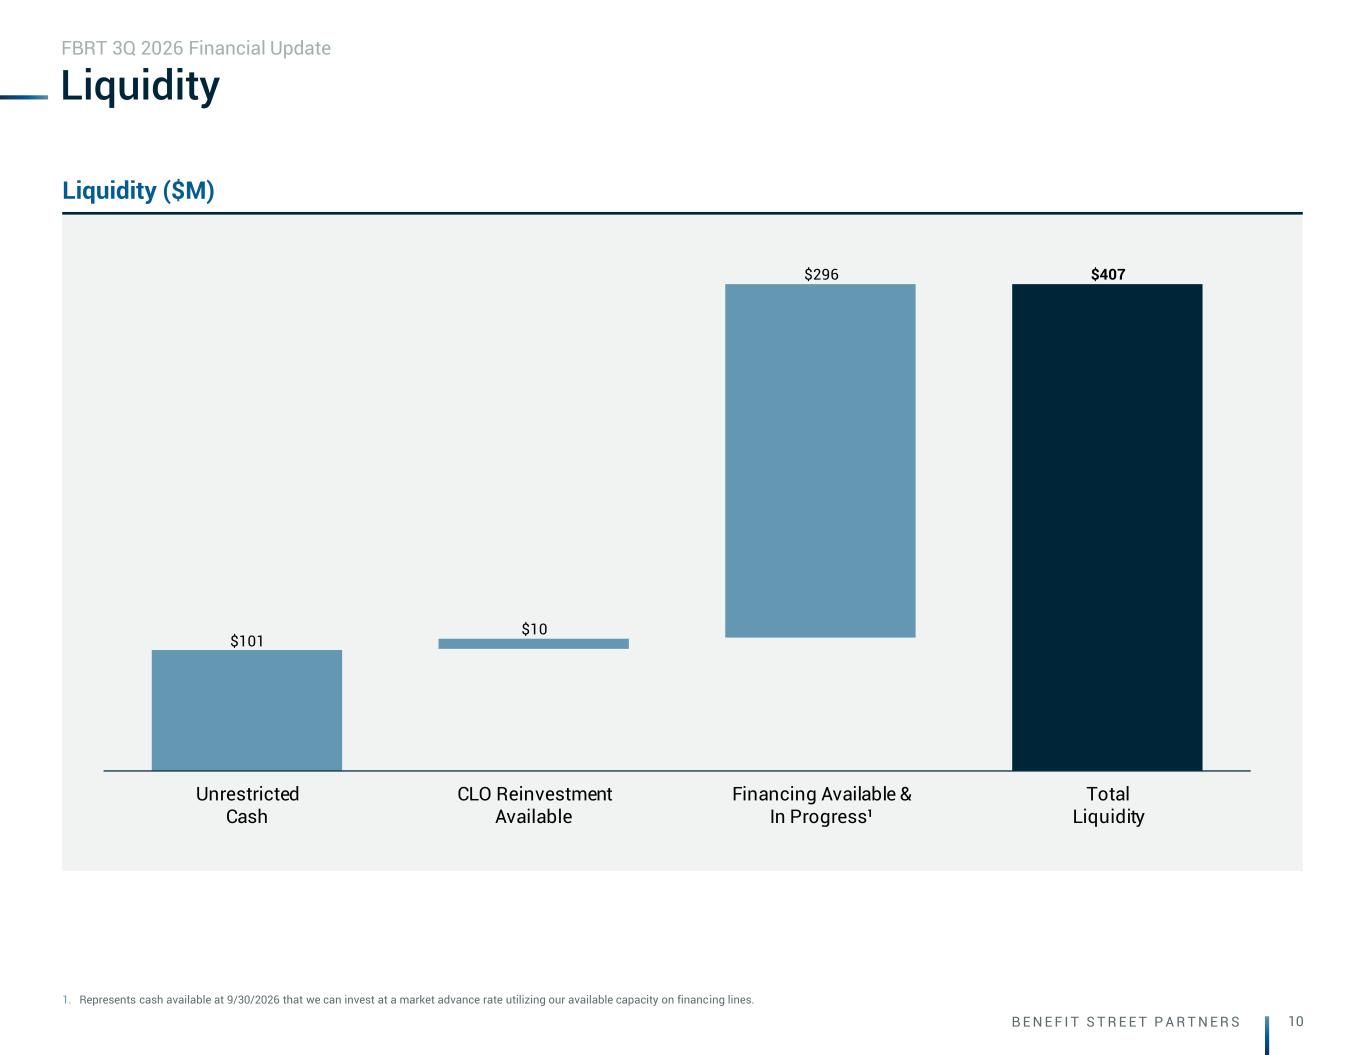
B E N E F I T S T R E E T P A R T N E R S 10 $101 $10 $296 $407 Unrestricted Cash CLO Reinvestment Available Financing Available & In Progress¹ Total Liquidity Liquidity ($M) Liquidity 1. Represents cash available at 9/30/2026 that we can invest at a market advance rate utilizing our available capacity on financing lines. FBRT 3Q 2026 Financial Update
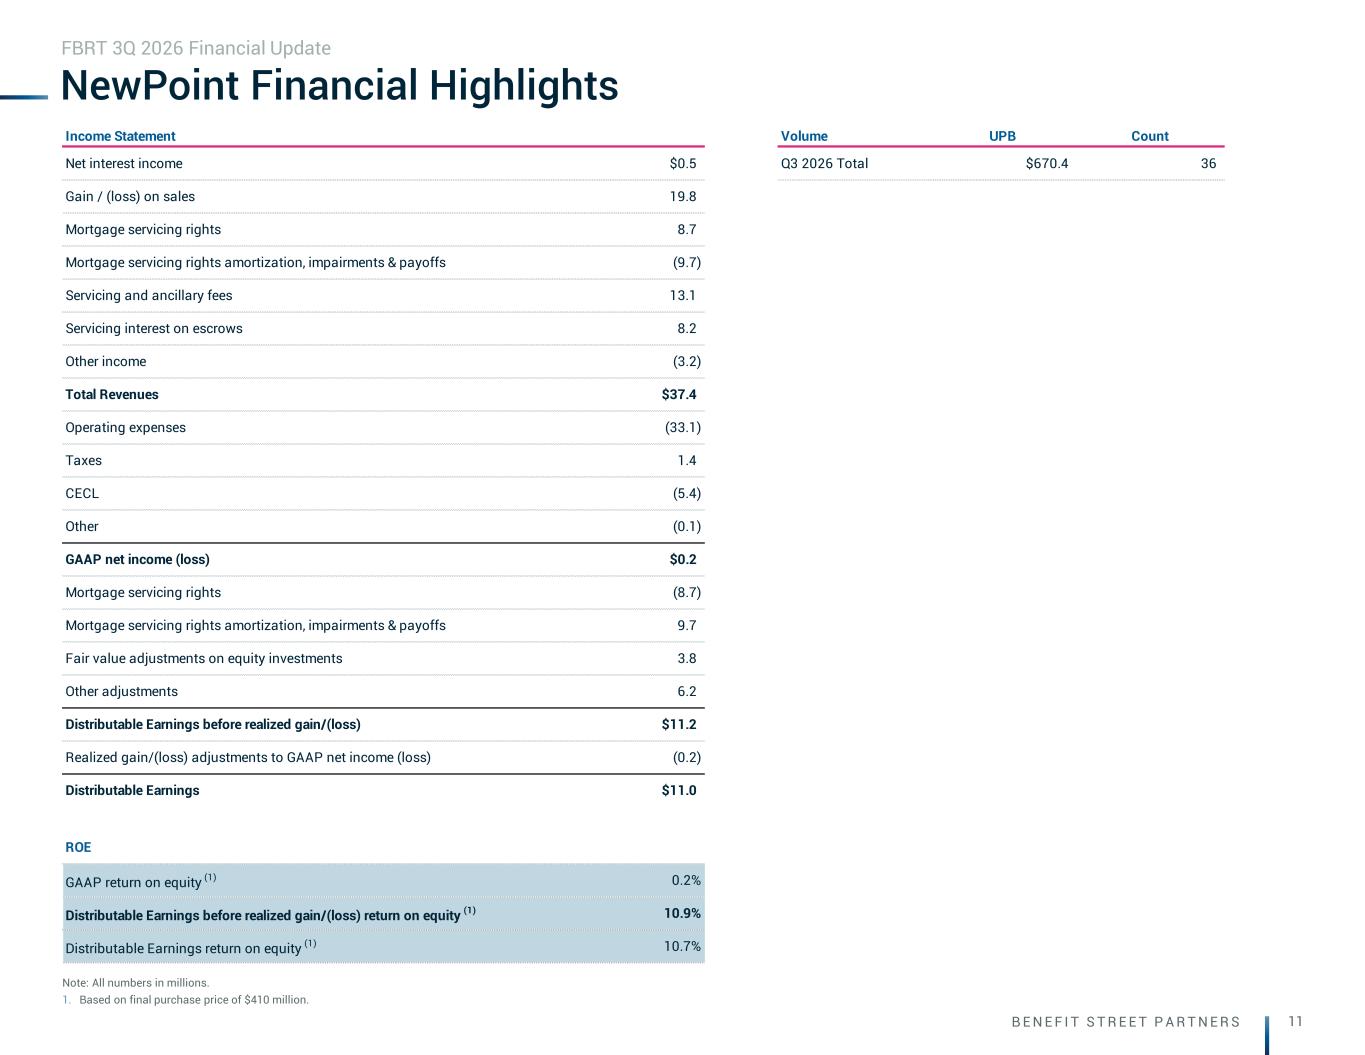
B E N E F I T S T R E E T P A R T N E R S 11 NewPoint Financial Highlights Note: All numbers in millions. 1. Based on final purchase price of $410 million. FBRT 3Q 2026 Financial Update Income Statement Volume UPB Count Net interest income $0.5 Q3 2026 Total $670.4 36 Gain / (loss) on sales 19.8 Mortgage servicing rights 8.7 Mortgage servicing rights amortization, impairments & payoffs (9.7) Servicing and ancillary fees 13.1 Servicing interest on escrows 8.2 Other income (3.2) Total Revenues $37.4 Operating expenses (33.1) Taxes 1.4 CECL (5.4) Other (0.1) GAAP net income (loss) $0.2 Mortgage servicing rights (8.7) Mortgage servicing rights amortization, impairments & payoffs 9.7 Fair value adjustments on equity investments 3.8 Other adjustments 6.2 Distributable Earnings before realized gain/(loss) $11.2 Realized gain/(loss) adjustments to GAAP net income (loss) (0.2) Distributable Earnings $11.0 ROE GAAP return on equity (1) 0.2% Distributable Earnings before realized gain/(loss) return on equity (1) 10.9% Distributable Earnings return on equity (1) 10.7%
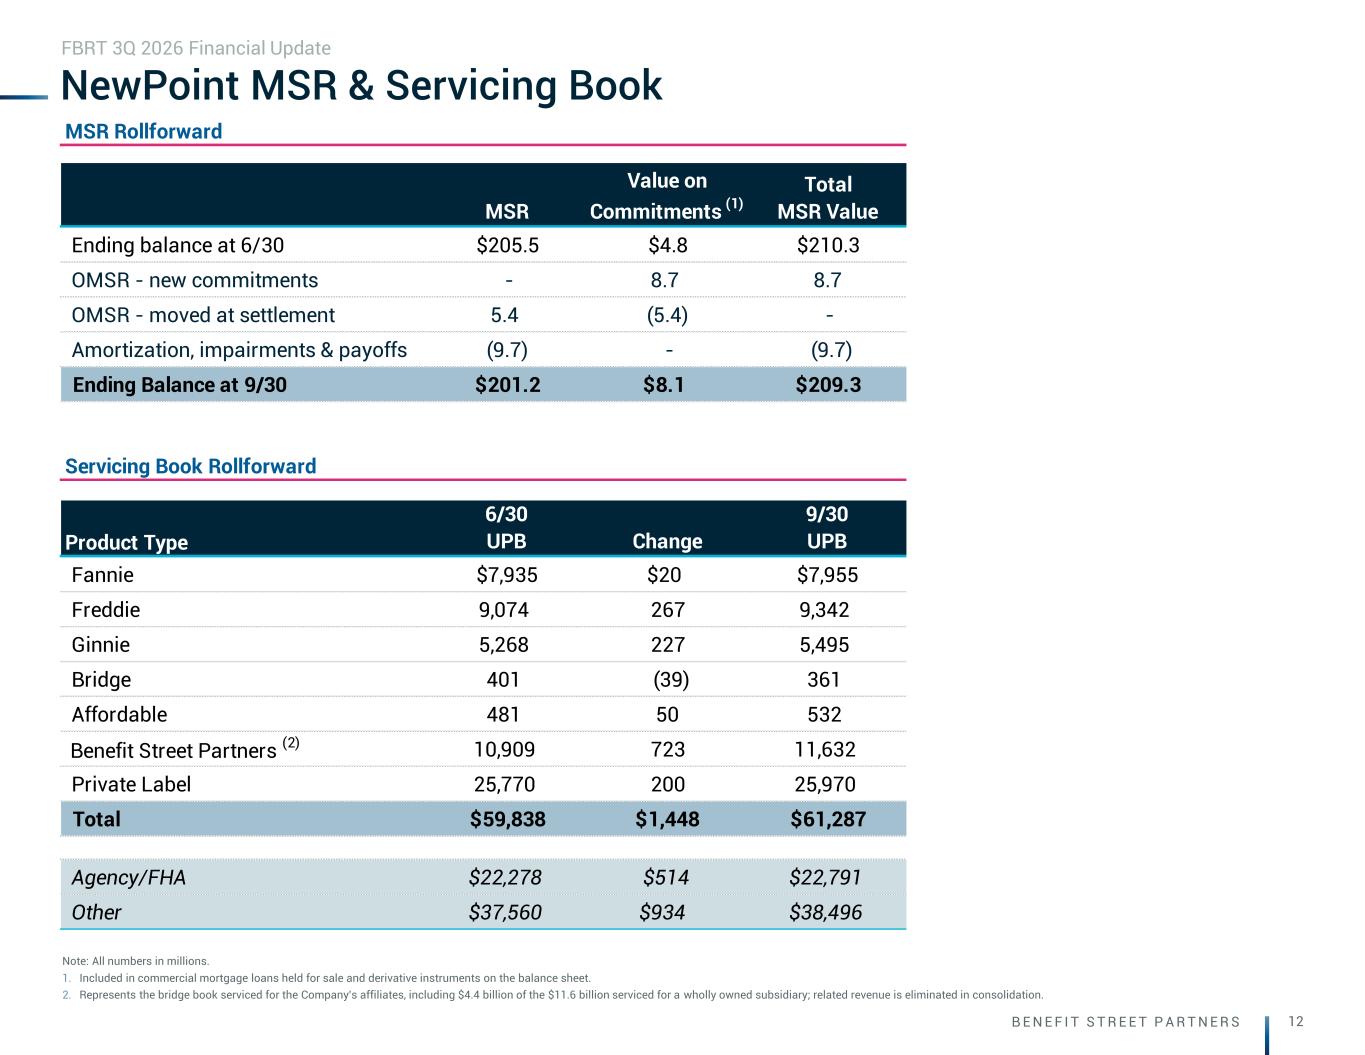
B E N E F I T S T R E E T P A R T N E R S 12 MSR Rollforward MSR Value on Commitments (1) Total MSR Value Ending balance at 6/30 $205.5 $4.8 $210.3 OMSR - new commitments - 8.7 8.7 OMSR - moved at settlement 5.4 (5.4) - Amortization, impairments & payoffs (9.7) - (9.7) Ending Balance at 9/30 $201.2 $8.1 $209.3 Servicing Book Rollforward Product Type 6/30 UPB Change 9/30 UPB Fannie $7,935 $20 $7,955 Freddie 9,074 267 9,342 Ginnie 5,268 227 5,495 Bridge 401 (39) 361 Affordable 481 50 532 Benefit Street Partners (2) 10,909 723 11,632 Private Label 25,770 200 25,970 Total $59,838 $1,448 $61,287 Agency/FHA $22,278 $514 $22,791 Other $37,560 $934 $38,496 NewPoint MSR & Servicing Book Note: All numbers in millions. 1. Included in commercial mortgage loans held for sale and derivative instruments on the balance sheet. 2. Represents the bridge book serviced for the Company's affiliates, including $4.4 billion of the $11.6 billion serviced for a wholly owned subsidiary; related revenue is eliminated in consolidation. FBRT 3Q 2026 Financial Update
Portfolio
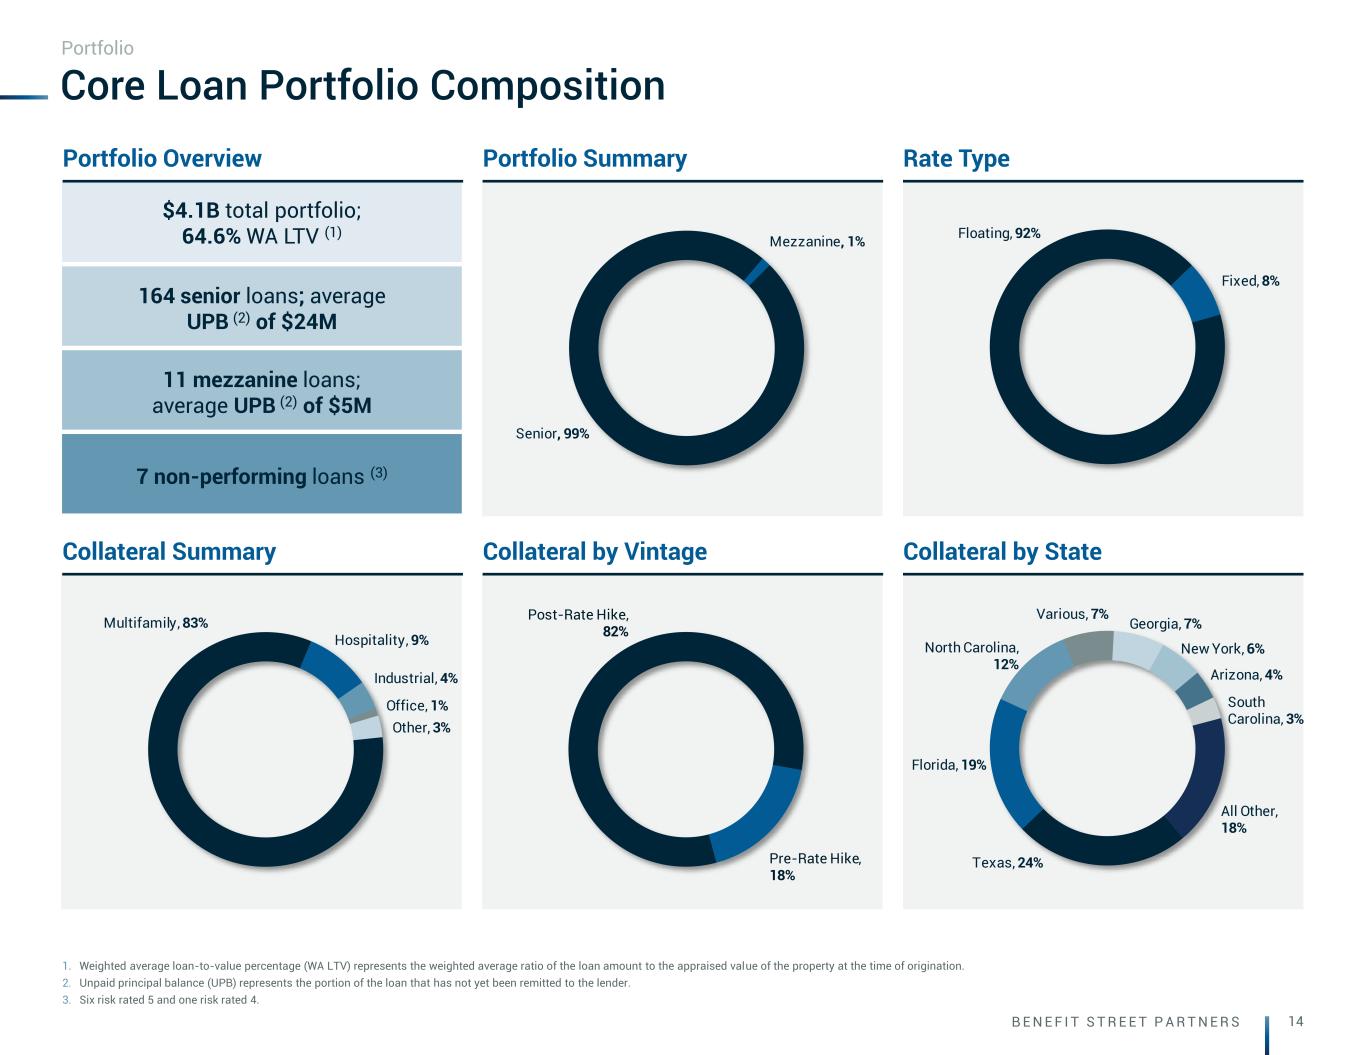
B E N E F I T S T R E E T P A R T N E R S 14 Post-Rate Hike, 82% Pre-Rate Hike, 18% Senior, 99% Mezzanine, 1% Floating, 92% Fixed, 8% Multifamily, 83% Hospitality, 9% Industrial, 4% Office, 1% Other, 3% Texas, 24% Florida, 19% North Carolina, 12% Various, 7% Georgia, 7% New York, 6% Arizona, 4% South Carolina, 3% All Other, 18% Core Loan Portfolio Composition 1. Weighted average loan-to-value percentage (WA LTV) represents the weighted average ratio of the loan amount to the appraised value of the property at the time of origination. 2. Unpaid principal balance (UPB) represents the portion of the loan that has not yet been remitted to the lender. 3. Six risk rated 5 and one risk rated 4. Portfolio $4.1B total portfolio; 64.6% WA LTV (1) Portfolio Summary Rate Type Collateral Summary Collateral by Vintage Collateral by State 164 senior loans; average UPB (2) of $24M 11 mezzanine loans; average UPB (2) of $5M 7 non-performing loans (3) Portfolio Overview
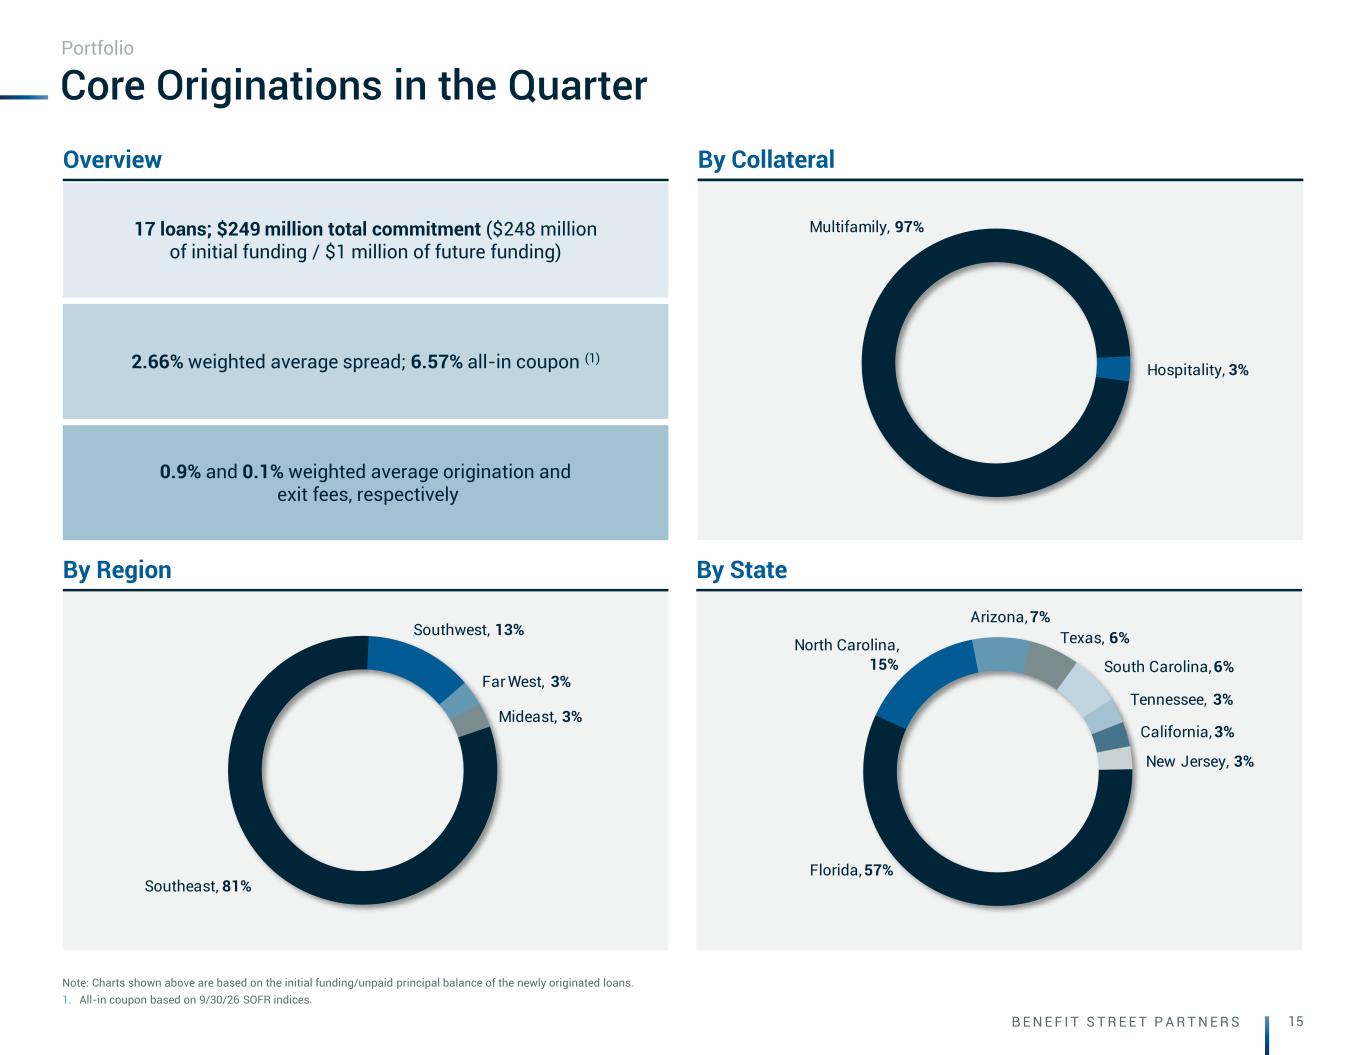
B E N E F I T S T R E E T P A R T N E R S 15 Southeast, 81% Southwest, 13% Far West, 3% Mideast, 3% Multifamily, 97% Hospitality, 3% Florida, 57% North Carolina, 15% Arizona, 7% Texas, 6% South Carolina, 6% Tennessee, 3% California, 3% New Jersey, 3% By Region By State 17 loans; $249 million total commitment ($248 million of initial funding / $1 million of future funding) 2.66% weighted average spread; 6.57% all-in coupon (1) 0.9% and 0.1% weighted average origination and exit fees, respectively By Collateral Core Originations in the Quarter Portfolio Overview Note: Charts shown above are based on the initial funding/unpaid principal balance of the newly originated loans. 1. All-in coupon based on 9/30/26 SOFR indices.
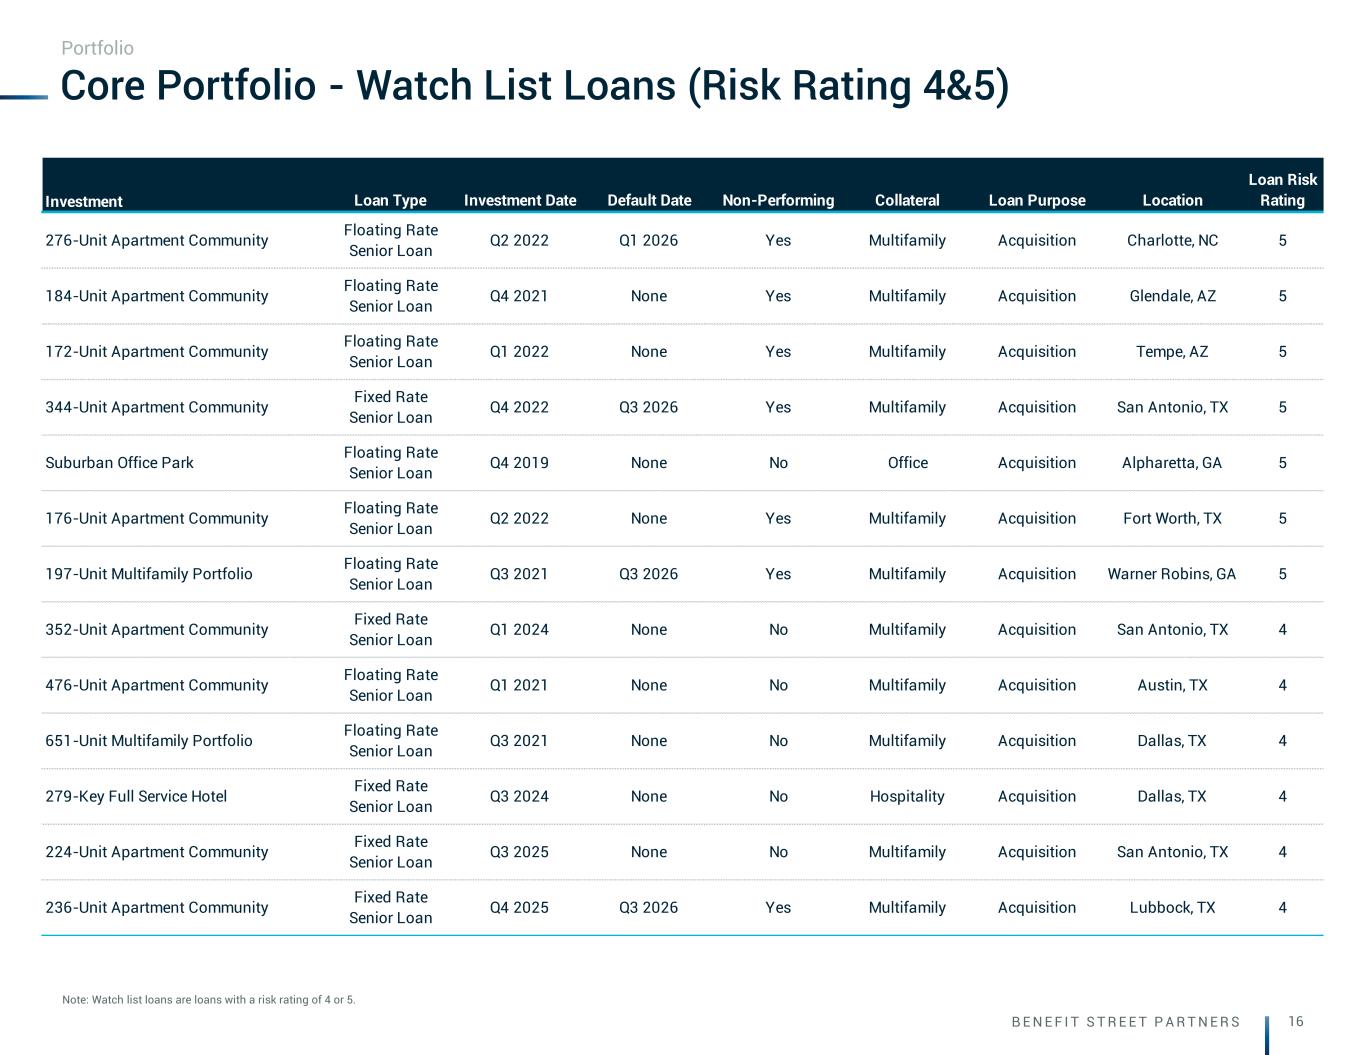
B E N E F I T S T R E E T P A R T N E R S 16 Investment Loan Type Investment Date Default Date Non-Performing Collateral Loan Purpose Location Loan Risk Rating 276-Unit Apartment Community Floating Rate Senior Loan Q2 2022 Q1 2026 Yes Multifamily Acquisition Charlotte, NC 5 184-Unit Apartment Community Floating Rate Senior Loan Q4 2021 None Yes Multifamily Acquisition Glendale, AZ 5 172-Unit Apartment Community Floating Rate Senior Loan Q1 2022 None Yes Multifamily Acquisition Tempe, AZ 5 344-Unit Apartment Community Fixed Rate Senior Loan Q4 2022 Q3 2026 Yes Multifamily Acquisition San Antonio, TX 5 Suburban Office Park Floating Rate Senior Loan Q4 2019 None No Office Acquisition Alpharetta, GA 5 176-Unit Apartment Community Floating Rate Senior Loan Q2 2022 None Yes Multifamily Acquisition Fort Worth, TX 5 197-Unit Multifamily Portfolio Floating Rate Senior Loan Q3 2021 Q3 2026 Yes Multifamily Acquisition Warner Robins, GA 5 352-Unit Apartment Community Fixed Rate Senior Loan Q1 2024 None No Multifamily Acquisition San Antonio, TX 4 476-Unit Apartment Community Floating Rate Senior Loan Q1 2021 None No Multifamily Acquisition Austin, TX 4 651-Unit Multifamily Portfolio Floating Rate Senior Loan Q3 2021 None No Multifamily Acquisition Dallas, TX 4 279-Key Full Service Hotel Fixed Rate Senior Loan Q3 2024 None No Hospitality Acquisition Dallas, TX 4 224-Unit Apartment Community Fixed Rate Senior Loan Q3 2025 None No Multifamily Acquisition San Antonio, TX 4 236-Unit Apartment Community Fixed Rate Senior Loan Q4 2025 Q3 2026 Yes Multifamily Acquisition Lubbock, TX 4 Core Portfolio - Watch List Loans (Risk Rating 4&5) Note: Watch list loans are loans with a risk rating of 4 or 5. Portfolio
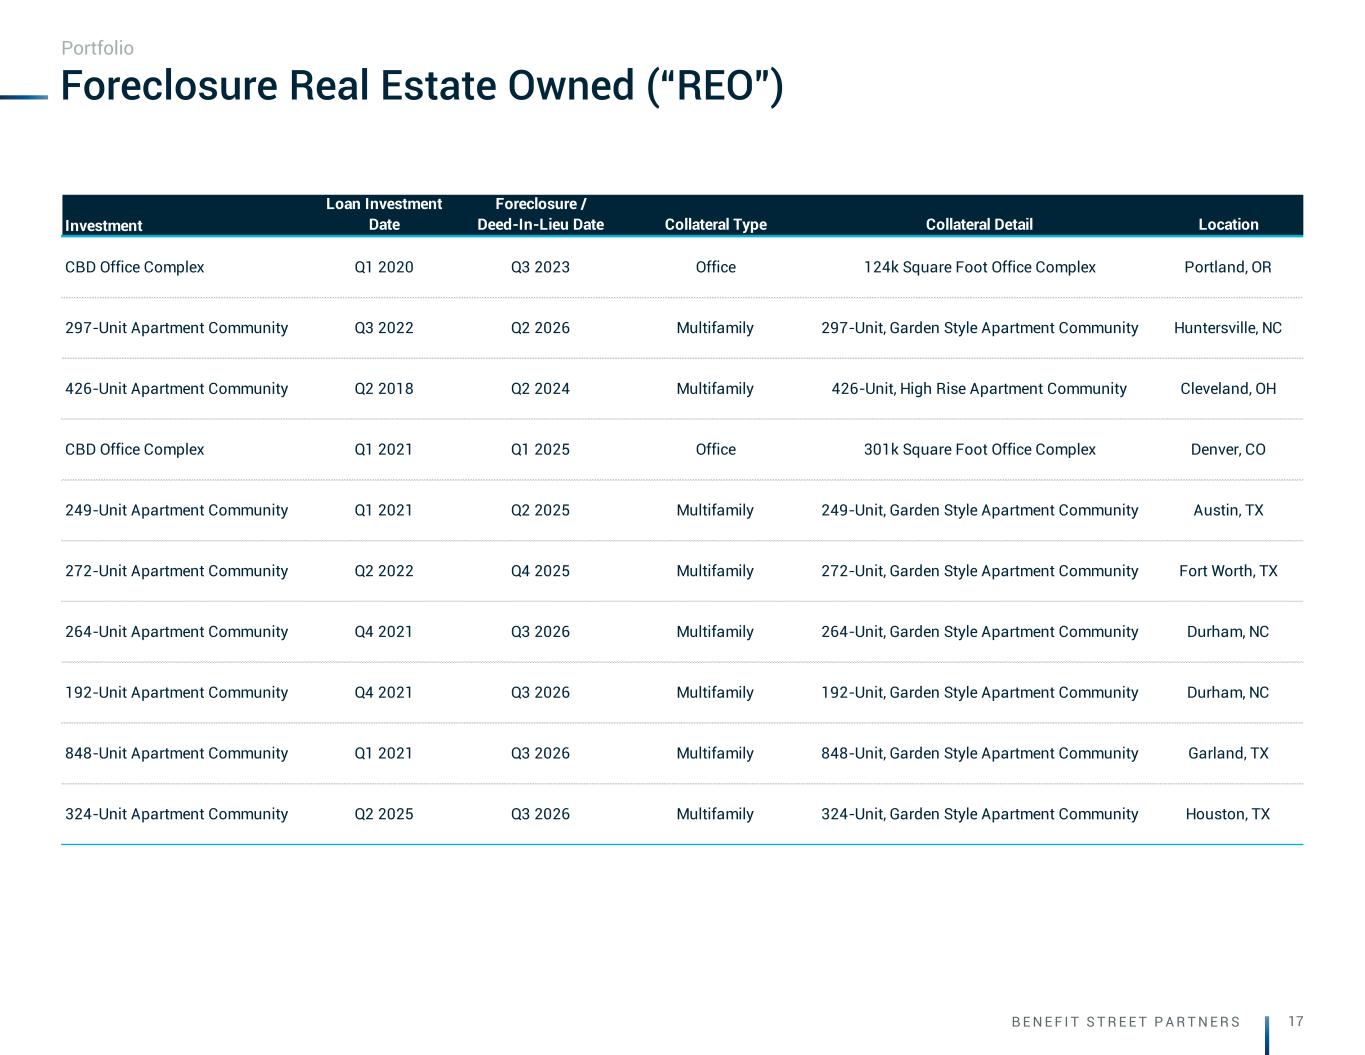
B E N E F I T S T R E E T P A R T N E R S 17 Investment Loan Investment Date Foreclosure / Deed-In-Lieu Date Collateral Type Collateral Detail Location CBD Office Complex Q1 2020 Q3 2023 Office 124k Square Foot Office Complex Portland, OR 297-Unit Apartment Community Q3 2022 Q2 2026 Multifamily 297-Unit, Garden Style Apartment Community Huntersville, NC 426-Unit Apartment Community Q2 2018 Q2 2024 Multifamily 426-Unit, High Rise Apartment Community Cleveland, OH CBD Office Complex Q1 2021 Q1 2025 Office 301k Square Foot Office Complex Denver, CO 249-Unit Apartment Community Q1 2021 Q2 2025 Multifamily 249-Unit, Garden Style Apartment Community Austin, TX 272-Unit Apartment Community Q2 2022 Q4 2025 Multifamily 272-Unit, Garden Style Apartment Community Fort Worth, TX 264-Unit Apartment Community Q4 2021 Q3 2026 Multifamily 264-Unit, Garden Style Apartment Community Durham, NC 192-Unit Apartment Community Q4 2021 Q3 2026 Multifamily 192-Unit, Garden Style Apartment Community Durham, NC 848-Unit Apartment Community Q1 2021 Q3 2026 Multifamily 848-Unit, Garden Style Apartment Community Garland, TX 324-Unit Apartment Community Q2 2025 Q3 2026 Multifamily 324-Unit, Garden Style Apartment Community Houston, TX Foreclosure Real Estate Owned (“REO”) Portfolio

Appendix
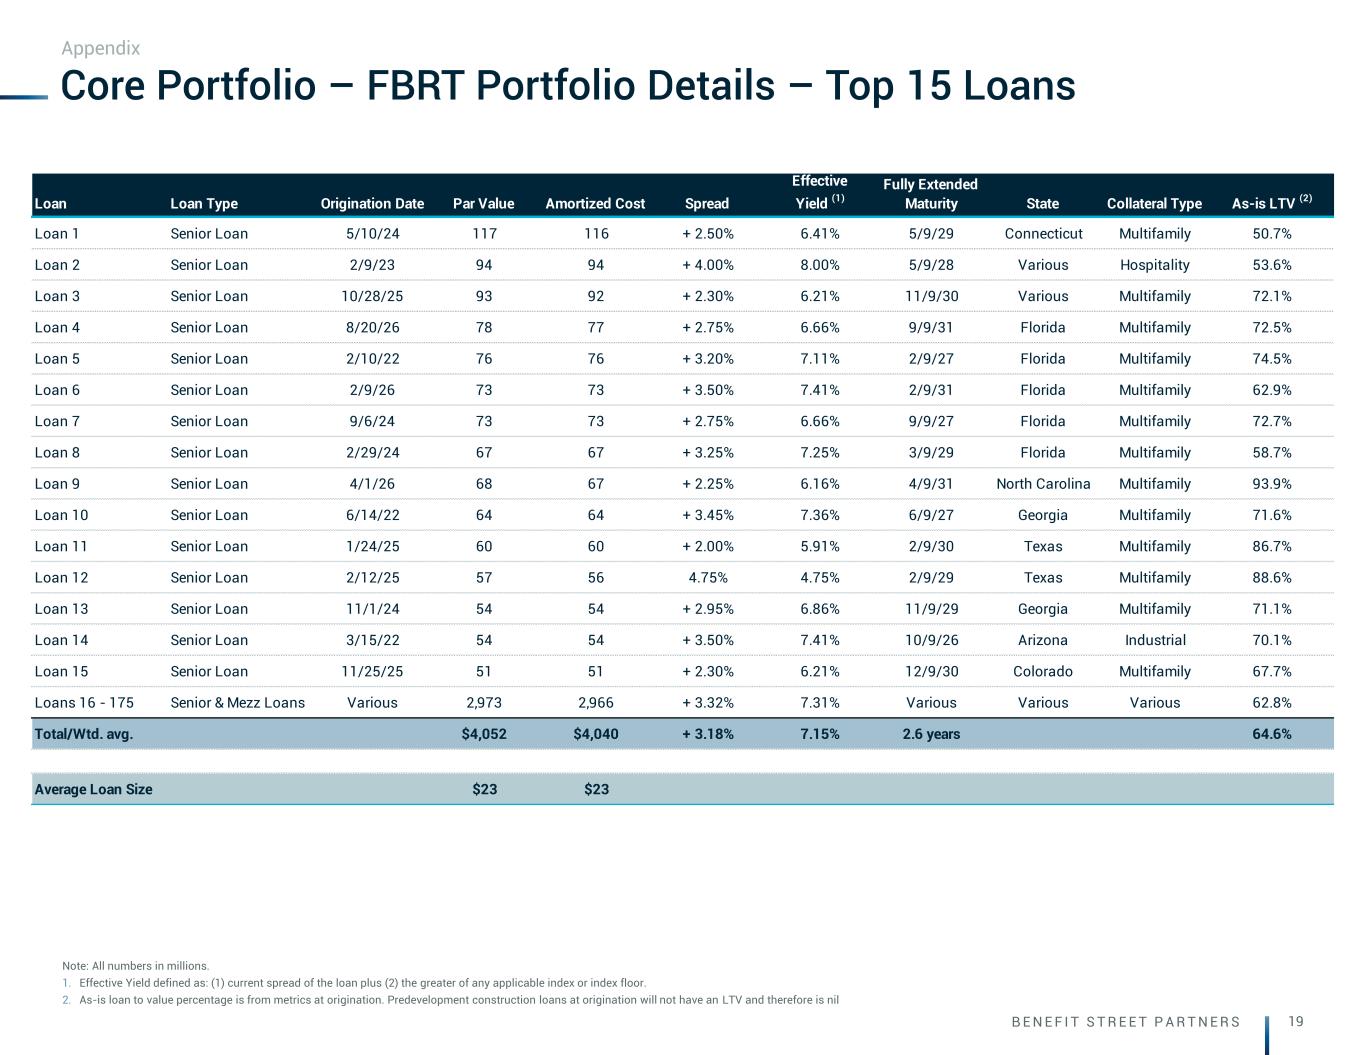
B E N E F I T S T R E E T P A R T N E R S 19 Core Portfolio – FBRT Portfolio Details – Top 15 Loans Note: All numbers in millions. 1. Effective Yield defined as: (1) current spread of the loan plus (2) the greater of any applicable index or index floor. 2. As-is loan to value percentage is from metrics at origination. Predevelopment construction loans at origination will not have an LTV and therefore is nil Appendix Loan Loan Type Origination Date Par Value Amortized Cost Spread Effective Yield (1) Fully Extended Maturity State Collateral Type As-is LTV (2) Loan 1 Senior Loan 5/10/24 117 116 + 2.50% 6.41% 5/9/29 Connecticut Multifamily 50.7% Loan 2 Senior Loan 2/9/23 94 94 + 4.00% 8.00% 5/9/28 Various Hospitality 53.6% Loan 3 Senior Loan 10/28/25 93 92 + 2.30% 6.21% 11/9/30 Various Multifamily 72.1% Loan 4 Senior Loan 8/20/26 78 77 + 2.75% 6.66% 9/9/31 Florida Multifamily 72.5% Loan 5 Senior Loan 2/10/22 76 76 + 3.20% 7.11% 2/9/27 Florida Multifamily 74.5% Loan 6 Senior Loan 2/9/26 73 73 + 3.50% 7.41% 2/9/31 Florida Multifamily 62.9% Loan 7 Senior Loan 9/6/24 73 73 + 2.75% 6.66% 9/9/27 Florida Multifamily 72.7% Loan 8 Senior Loan 2/29/24 67 67 + 3.25% 7.25% 3/9/29 Florida Multifamily 58.7% Loan 9 Senior Loan 4/1/26 68 67 + 2.25% 6.16% 4/9/31 North Carolina Multifamily 93.9% Loan 10 Senior Loan 6/14/22 64 64 + 3.45% 7.36% 6/9/27 Georgia Multifamily 71.6% Loan 11 Senior Loan 1/24/25 60 60 + 2.00% 5.91% 2/9/30 Texas Multifamily 86.7% Loan 12 Senior Loan 2/12/25 57 56 4.75% 4.75% 2/9/29 Texas Multifamily 88.6% Loan 13 Senior Loan 11/1/24 54 54 + 2.95% 6.86% 11/9/29 Georgia Multifamily 71.1% Loan 14 Senior Loan 3/15/22 54 54 + 3.50% 7.41% 10/9/26 Arizona Industrial 70.1% Loan 15 Senior Loan 11/25/25 51 51 + 2.30% 6.21% 12/9/30 Colorado Multifamily 67.7% Loans 16 - 175 Senior & Mezz Loans Various 2,973 2,966 + 3.32% 7.31% Various Various Various 62.8% Total/Wtd. avg. $4,052 $4,040 + 3.18% 7.15% 2.6 years 64.6% Average Loan Size $23 $23
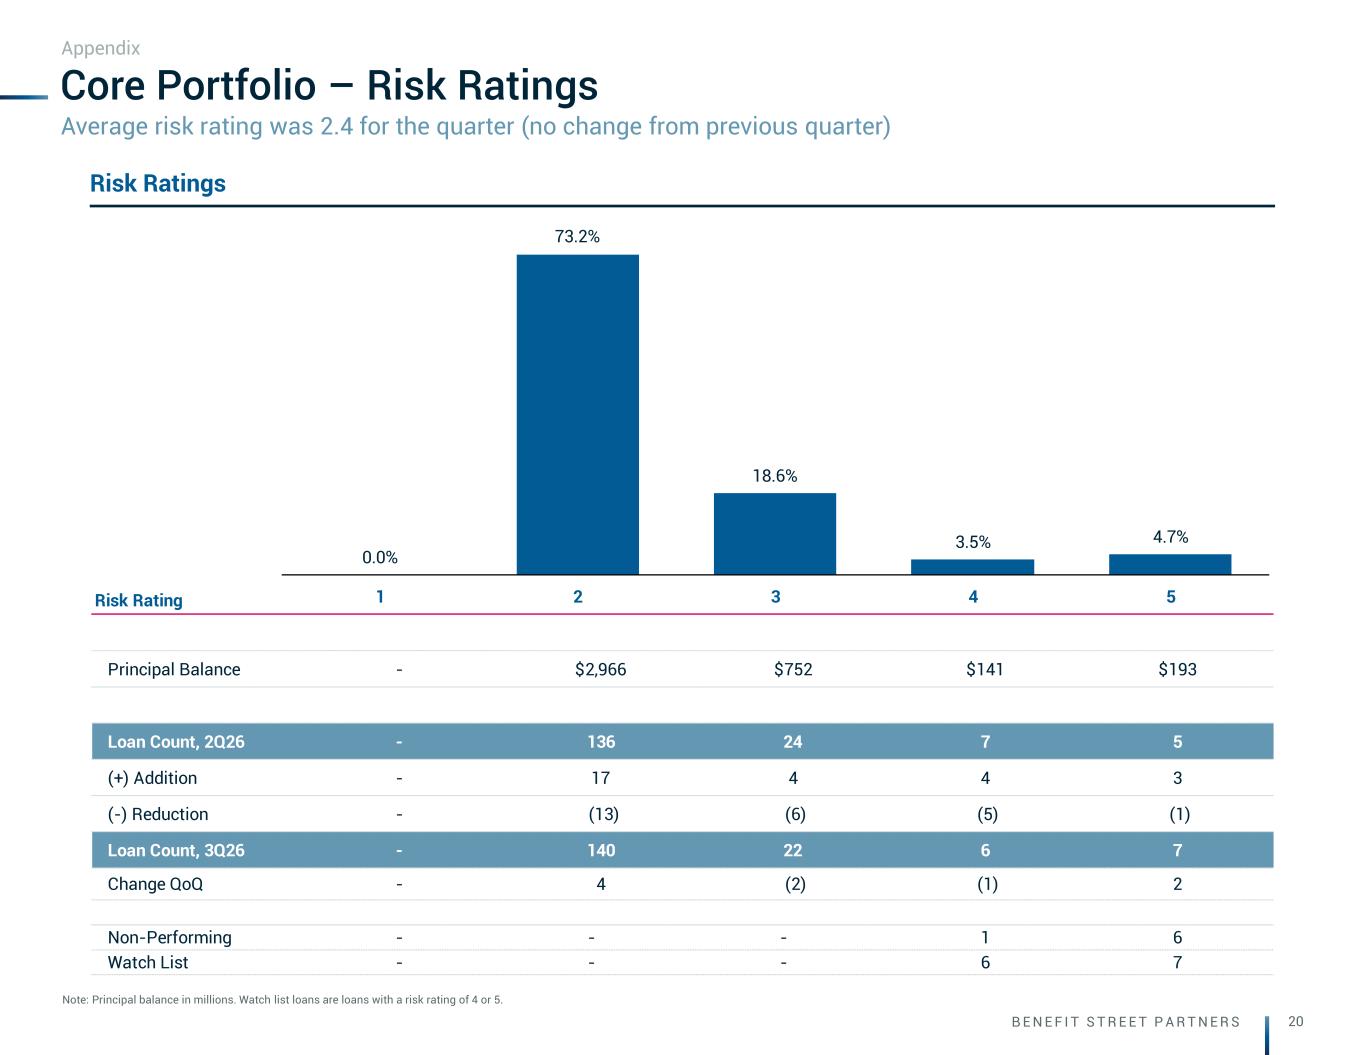
B E N E F I T S T R E E T P A R T N E R S 20 Average risk rating was 2.4 for the quarter (no change from previous quarter) Core Portfolio – Risk Ratings Note: Principal balance in millions. Watch list loans are loans with a risk rating of 4 or 5. Appendix Risk Ratings Risk Rating Principal Balance - $2,966 $752 $141 $193 Loan Count, 2Q26 - 136 24 7 5 (+) Addition - 17 4 4 3 (-) Reduction - (13) (6) (5) (1) Loan Count, 3Q26 - 140 22 6 7 Change QoQ - 4 (2) (1) 2 Non-Performing - - - 1 6 Watch List - - - 6 7 0.0% 73.2% 18.6% 3.5% 4.7% 1 2 3 4 5
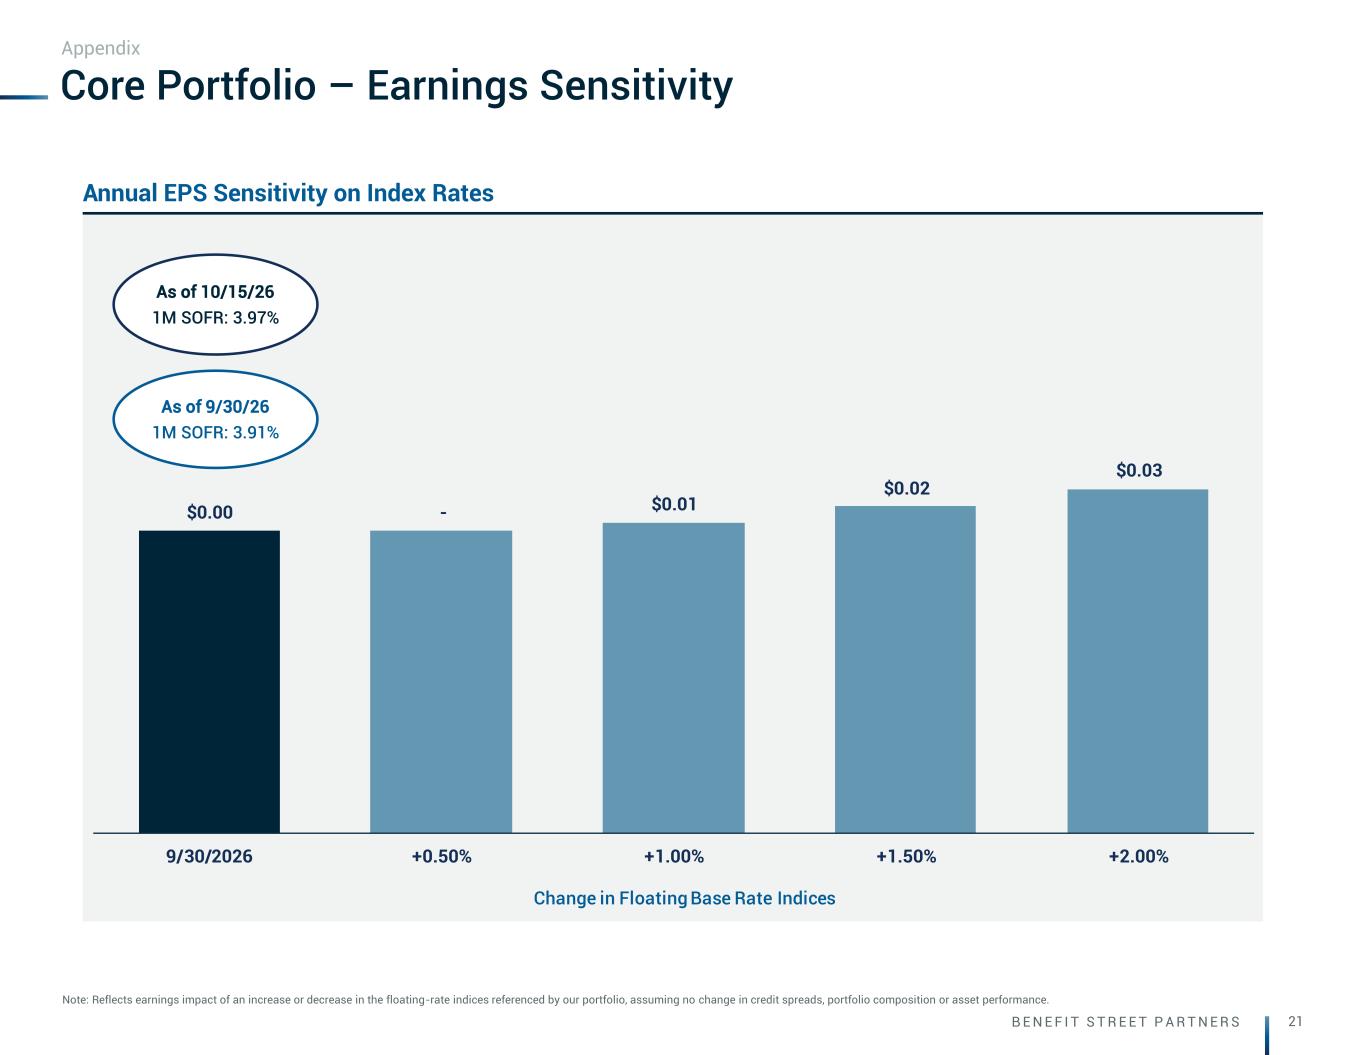
B E N E F I T S T R E E T P A R T N E R S 21 $0.00 - $0.01 $0.02 $0.03 9/30/2026 +0.50% +1.00% +1.50% +2.00% Change in Floating Base Rate Indices Core Portfolio – Earnings Sensitivity Note: Reflects earnings impact of an increase or decrease in the floating-rate indices referenced by our portfolio, assuming no change in credit spreads, portfolio composition or asset performance. Appendix Annual EPS Sensitivity on Index Rates As of 9/30/26 1M SOFR: 3.91% As of 10/15/26 1M SOFR: 3.97%
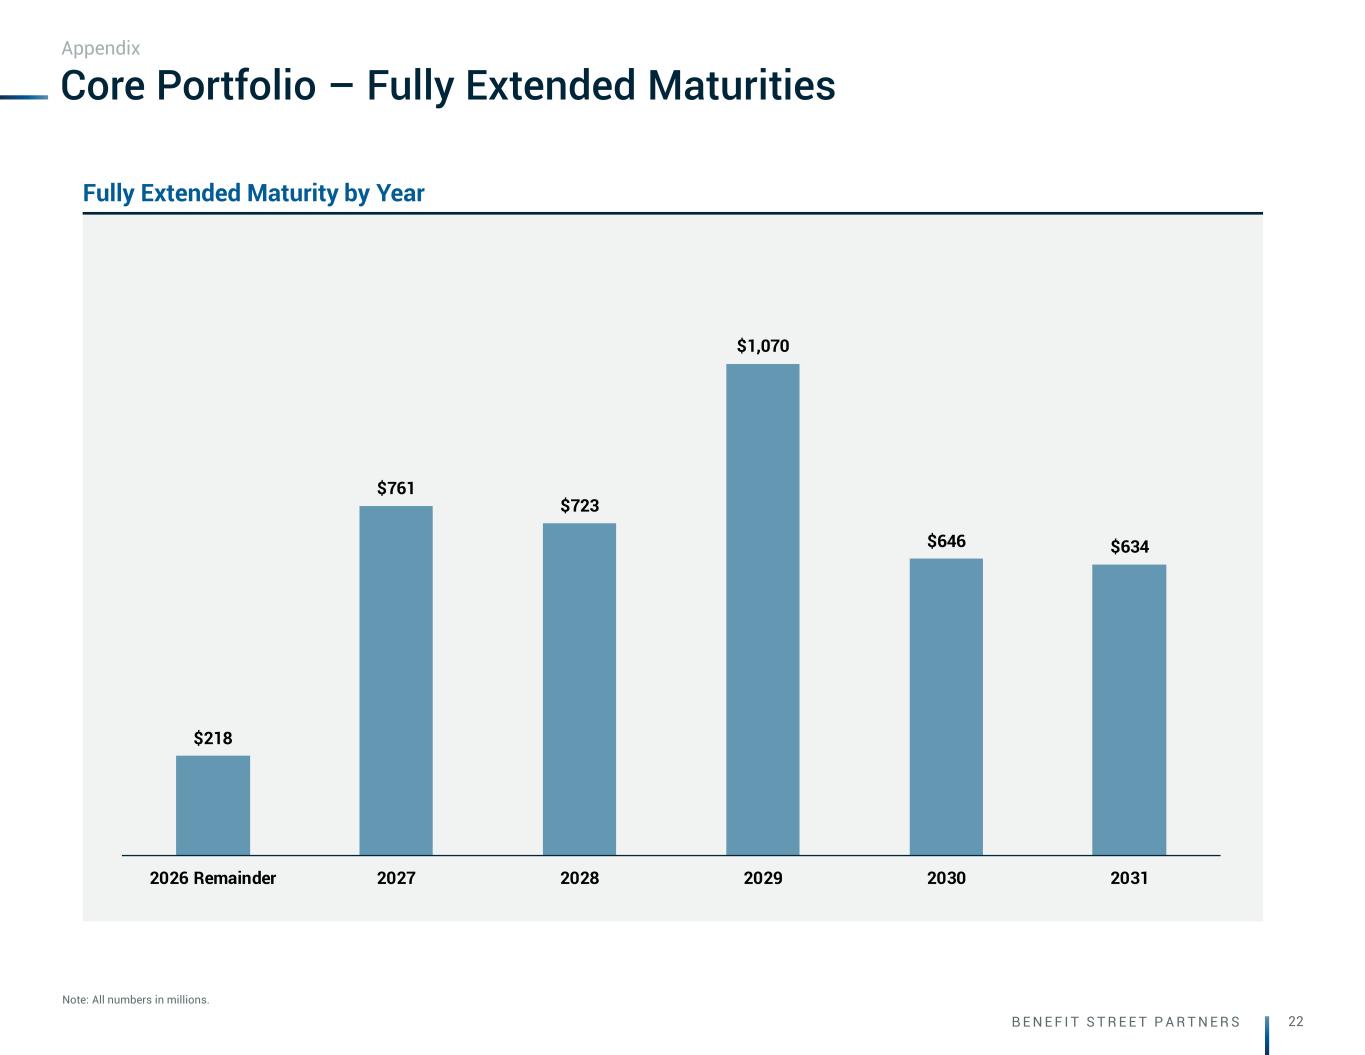
B E N E F I T S T R E E T P A R T N E R S 22 $218 $761 $723 $1,070 $646 $634 2026 Remainder 2027 2028 2029 2030 2031 Core Portfolio – Fully Extended Maturities Note: All numbers in millions. Appendix Fully Extended Maturity by Year
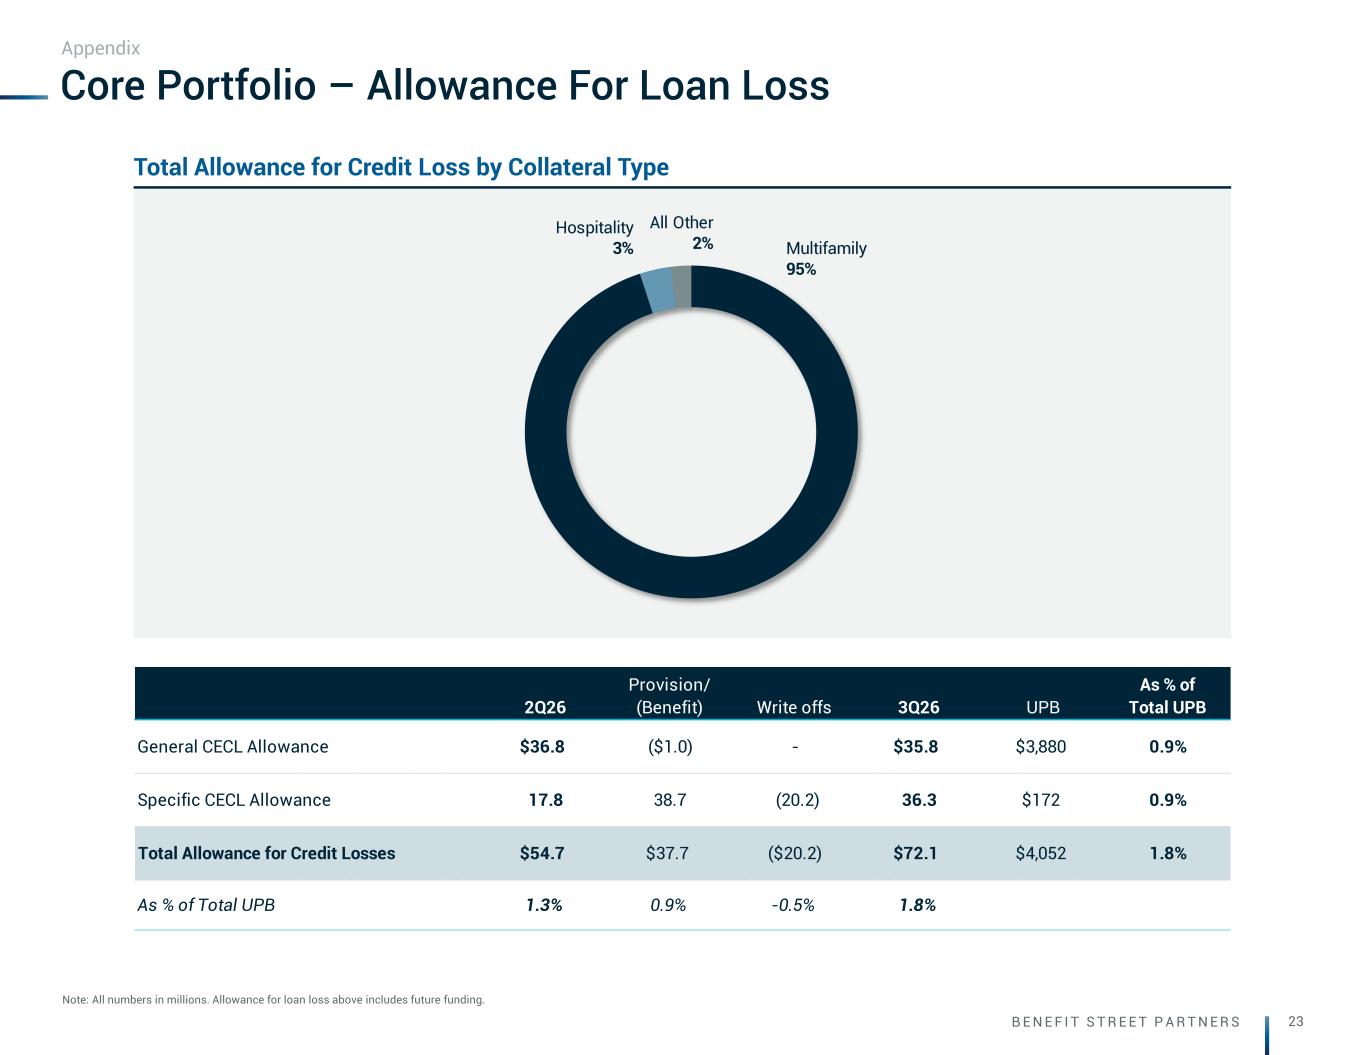
B E N E F I T S T R E E T P A R T N E R S 23 Multifamily 95% Hospitality 3% All Other 2% Core Portfolio – Allowance For Loan Loss Note: All numbers in millions. Allowance for loan loss above includes future funding. Appendix Total Allowance for Credit Loss by Collateral Type 2Q26 Provision/ (Benefit) Write offs 3Q26 UPB As % of Total UPB General CECL Allowance $36.8 ($1.0) - $35.8 $3,880 0.9% Specific CECL Allowance 17.8 38.7 (20.2) 36.3 $172 0.9% Total Allowance for Credit Losses $54.7 $37.7 ($20.2) $72.1 $4,052 1.8% As % of Total UPB 1.3% 0.9% -0.5% 1.8%
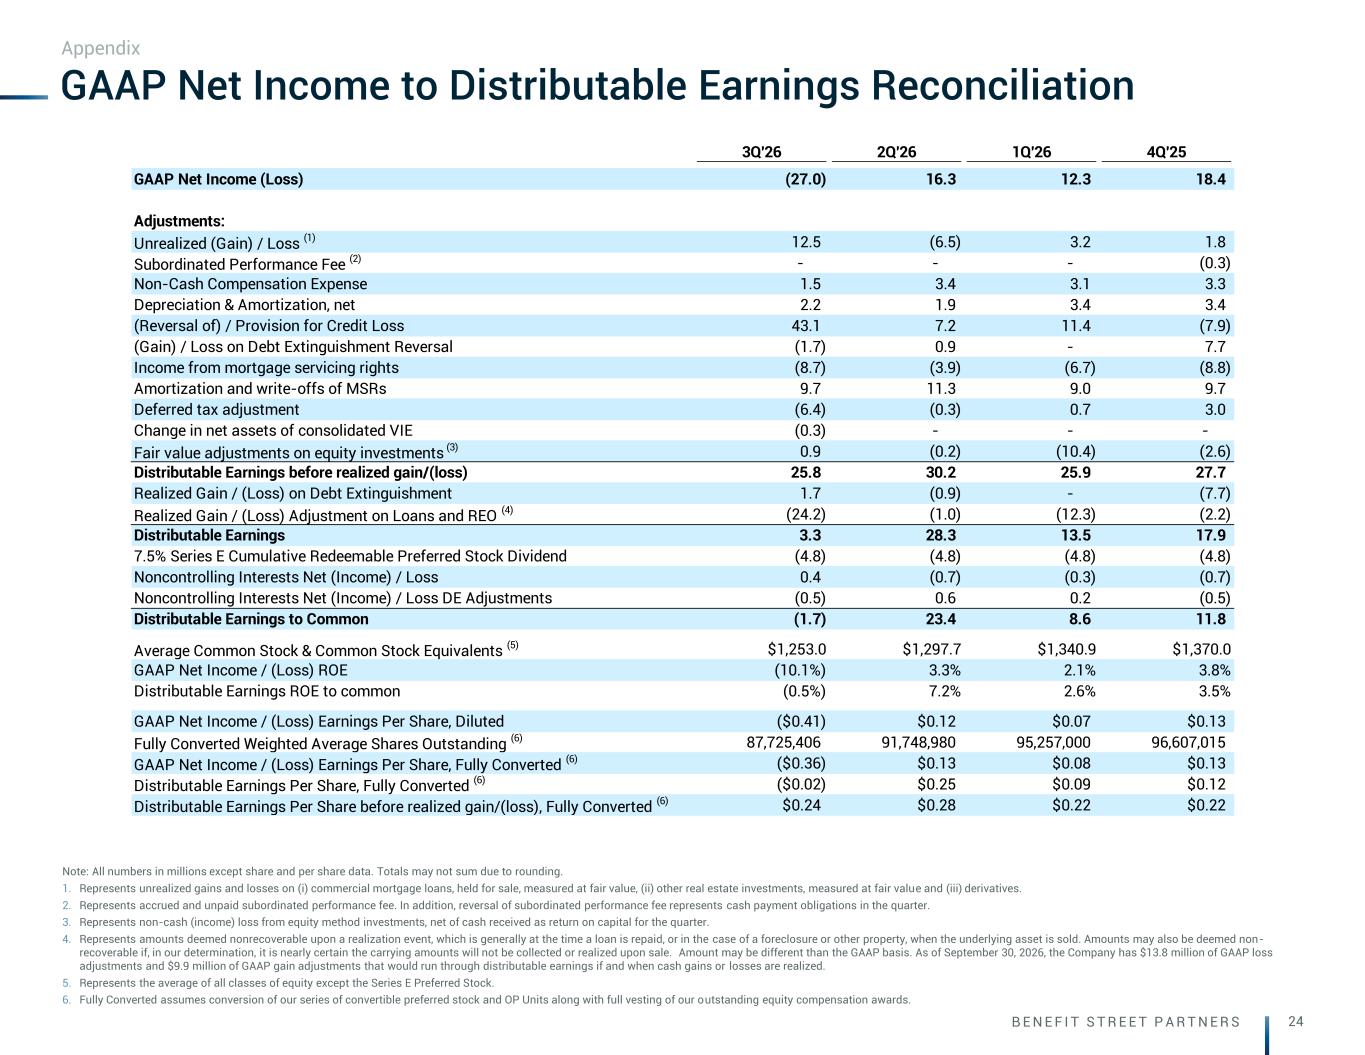
B E N E F I T S T R E E T P A R T N E R S 24 3Q'26 2Q'26 1Q'26 4Q'25 GAAP Net Income (Loss) (27.0) 16.3 12.3 18.4 Adjustments: Unrealized (Gain) / Loss (1) 12.5 (6.5) 3.2 1.8 Subordinated Performance Fee (2) - - - (0.3) Non-Cash Compensation Expense 1.5 3.4 3.1 3.3 Depreciation & Amortization, net 2.2 1.9 3.4 3.4 (Reversal of) / Provision for Credit Loss 43.1 7.2 11.4 (7.9) (Gain) / Loss on Debt Extinguishment Reversal (1.7) 0.9 - 7.7 Income from mortgage servicing rights (8.7) (3.9) (6.7) (8.8) Amortization and write-offs of MSRs 9.7 11.3 9.0 9.7 Deferred tax adjustment (6.4) (0.3) 0.7 3.0 Change in net assets of consolidated VIE (0.3) - - - Fair value adjustments on equity investments (3) 0.9 (0.2) (10.4) (2.6) Distributable Earnings before realized gain/(loss) 25.8 30.2 25.9 27.7 Realized Gain / (Loss) on Debt Extinguishment 1.7 (0.9) - (7.7) Realized Gain / (Loss) Adjustment on Loans and REO (4) (24.2) (1.0) (12.3) (2.2) Distributable Earnings 3.3 28.3 13.5 17.9 7.5% Series E Cumulative Redeemable Preferred Stock Dividend (4.8) (4.8) (4.8) (4.8) Noncontrolling Interests Net (Income) / Loss 0.4 (0.7) (0.3) (0.7) Noncontrolling Interests Net (Income) / Loss DE Adjustments (0.5) 0.6 0.2 (0.5) Distributable Earnings to Common (1.7) 23.4 8.6 11.8 Average Common Stock & Common Stock Equivalents (5) $1,253.0 $1,297.7 $1,340.9 $1,370.0 GAAP Net Income / (Loss) ROE (10.1%) 3.3% 2.1% 3.8% Distributable Earnings ROE to common (0.5%) 7.2% 2.6% 3.5% GAAP Net Income / (Loss) Earnings Per Share, Diluted ($0.41) $0.12 $0.07 $0.13 Fully Converted Weighted Average Shares Outstanding (6) 87,725,406 91,748,980 95,257,000 96,607,015 GAAP Net Income / (Loss) Earnings Per Share, Fully Converted (6) ($0.36) $0.13 $0.08 $0.13 Distributable Earnings Per Share, Fully Converted (6) ($0.02) $0.25 $0.09 $0.12 Distributable Earnings Per Share before realized gain/(loss), Fully Converted (6) $0.24 $0.28 $0.22 $0.22 GAAP Net Income to Distributable Earnings Reconciliation Note: All numbers in millions except share and per share data. Totals may not sum due to rounding. 1. Represents unrealized gains and losses on (i) commercial mortgage loans, held for sale, measured at fair value, (ii) other real estate investments, measured at fair value and (iii) derivatives. 2. Represents accrued and unpaid subordinated performance fee. In addition, reversal of subordinated performance fee represents cash payment obligations in the quarter. 3. Represents non-cash (income) loss from equity method investments, net of cash received as return on capital for the quarter. 4. Represents amounts deemed nonrecoverable upon a realization event, which is generally at the time a loan is repaid, or in the case of a foreclosure or other property, when the underlying asset is sold. Amounts may also be deemed non- recoverable if, in our determination, it is nearly certain the carrying amounts will not be collected or realized upon sale. Amount may be different than the GAAP basis. As of September 30, 2026, the Company has $13.8 million of GAAP loss adjustments and $9.9 million of GAAP gain adjustments that would run through distributable earnings if and when cash gains or losses are realized. 5. Represents the average of all classes of equity except the Series E Preferred Stock. 6. Fully Converted assumes conversion of our series of convertible preferred stock and OP Units along with full vesting of our outstanding equity compensation awards. Appendix
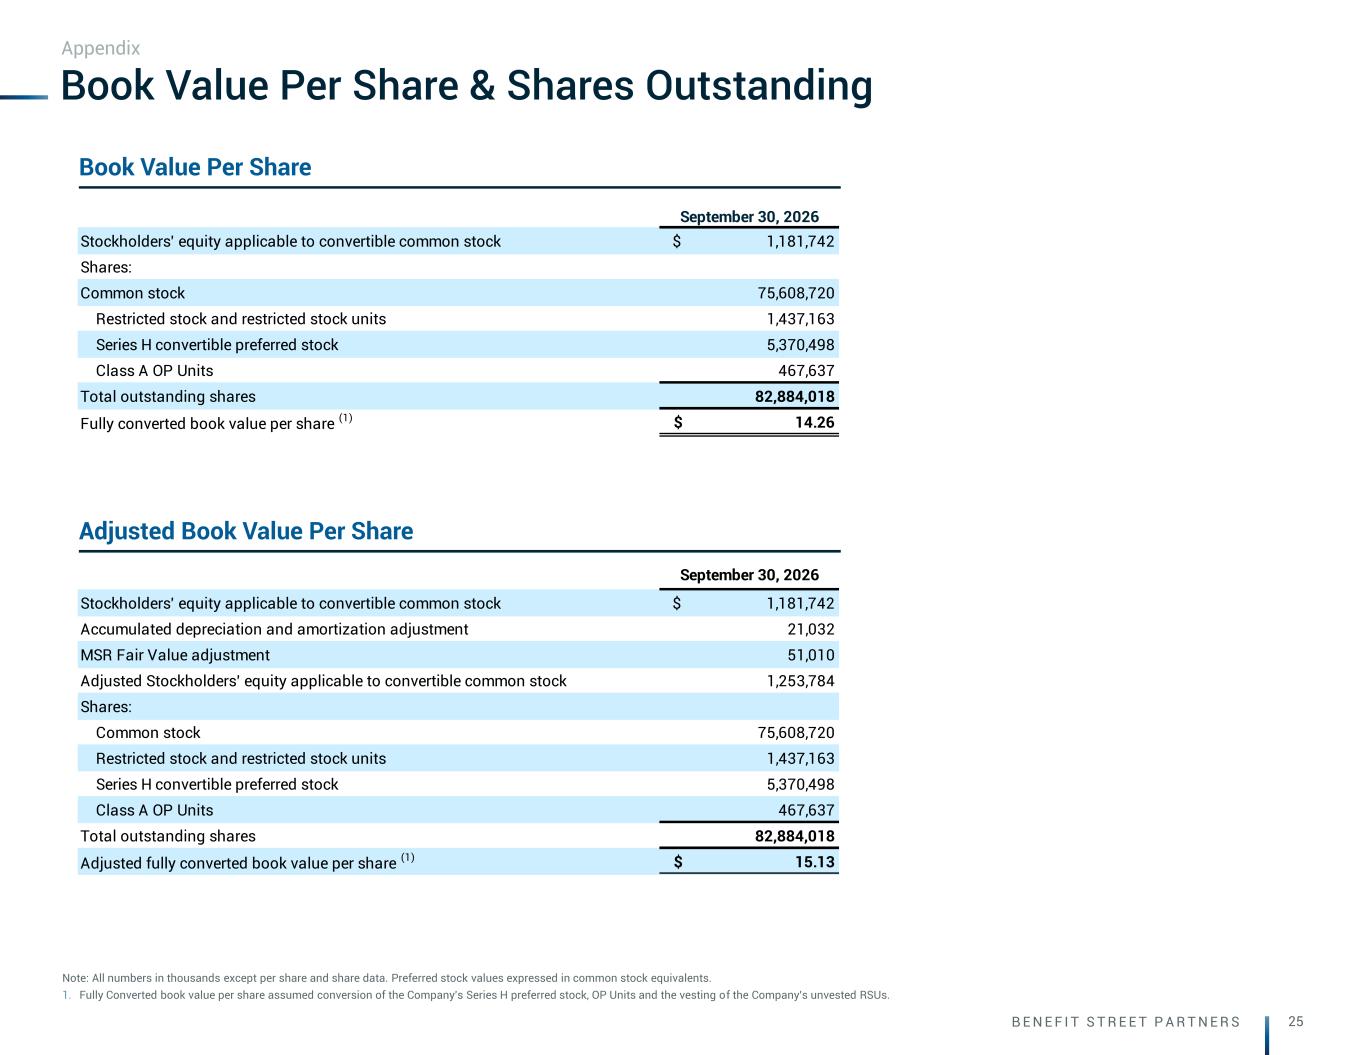
B E N E F I T S T R E E T P A R T N E R S 25 September 30, 2026 Stockholders' equity applicable to convertible common stock $ 1,181,742 Shares: Common stock 75,608,720 Restricted stock and restricted stock units 1,437,163 Series H convertible preferred stock 5,370,498 Class A OP Units 467,637 Total outstanding shares 82,884,018 Fully converted book value per share (1) $ 14.26 September 30, 2026 Stockholders' equity applicable to convertible common stock $ 1,181,742 Accumulated depreciation and amortization adjustment 21,032 MSR Fair Value adjustment 51,010 Adjusted Stockholders’ equity applicable to convertible common stock 1,253,784 Shares: Common stock 75,608,720 Restricted stock and restricted stock units 1,437,163 Series H convertible preferred stock 5,370,498 Class A OP Units 467,637 Total outstanding shares 82,884,018 Adjusted fully converted book value per share (1) $ 15.13 Book Value Per Share & Shares Outstanding Appendix Note: All numbers in thousands except per share and share data. Preferred stock values expressed in common stock equivalents. 1. Fully Converted book value per share assumed conversion of the Company's Series H preferred stock, OP Units and the vesting of the Company's unvested RSUs. Book Value Per Share Adjusted Book Value Per Share
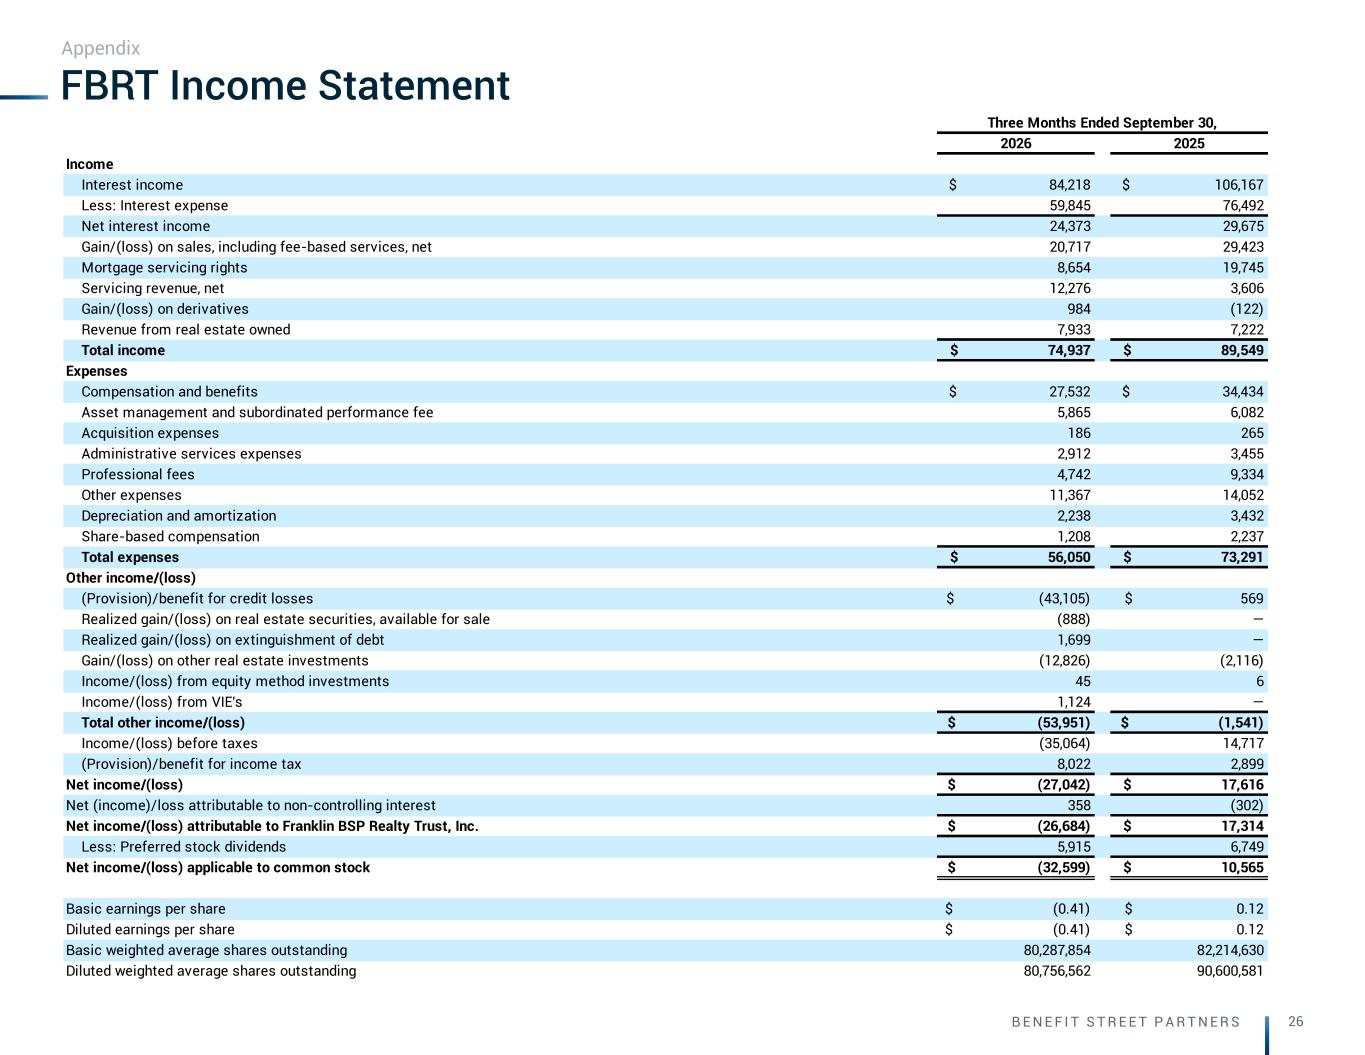
B E N E F I T S T R E E T P A R T N E R S 26 2026 2025 Income Interest income $ 84,218 $ 106,167 Less: Interest expense 59,845 76,492 Net interest income 24,373 29,675 Gain/(loss) on sales, including fee-based services, net 20,717 29,423 Mortgage servicing rights 8,654 19,745 Servicing revenue, net 12,276 3,606 Gain/(loss) on derivatives 984 (122) Revenue from real estate owned 7,933 7,222 Total income $ 74,937 $ 89,549 Expenses Compensation and benefits $ 27,532 $ 34,434 Asset management and subordinated performance fee 5,865 6,082 Acquisition expenses 186 265 Administrative services expenses 2,912 3,455 Professional fees 4,742 9,334 Other expenses 11,367 14,052 Depreciation and amortization 2,238 3,432 Share-based compensation 1,208 2,237 Total expenses $ 56,050 $ 73,291 Other income/(loss) (Provision)/benefit for credit losses $ (43,105) $ 569 Realized gain/(loss) on real estate securities, available for sale (888) — Realized gain/(loss) on extinguishment of debt 1,699 — Gain/(loss) on other real estate investments (12,826) (2,116) Income/(loss) from equity method investments 45 6 Income/(loss) from VIE's 1,124 — Total other income/(loss) $ (53,951) $ (1,541) Income/(loss) before taxes (35,064) 14,717 (Provision)/benefit for income tax 8,022 2,899 Net income/(loss) $ (27,042) $ 17,616 Net (income)/loss attributable to non-controlling interest 358 (302) Net income/(loss) attributable to Franklin BSP Realty Trust, Inc. $ (26,684) $ 17,314 Less: Preferred stock dividends 5,915 6,749 Net income/(loss) applicable to common stock $ (32,599) $ 10,565 Basic earnings per share $ (0.41) $ 0.12 Diluted earnings per share $ (0.41) $ 0.12 Basic weighted average shares outstanding 80,287,854 82,214,630 Diluted weighted average shares outstanding 80,756,562 90,600,581 Three Months Ended September 30, FBRT Income Statement Appendix
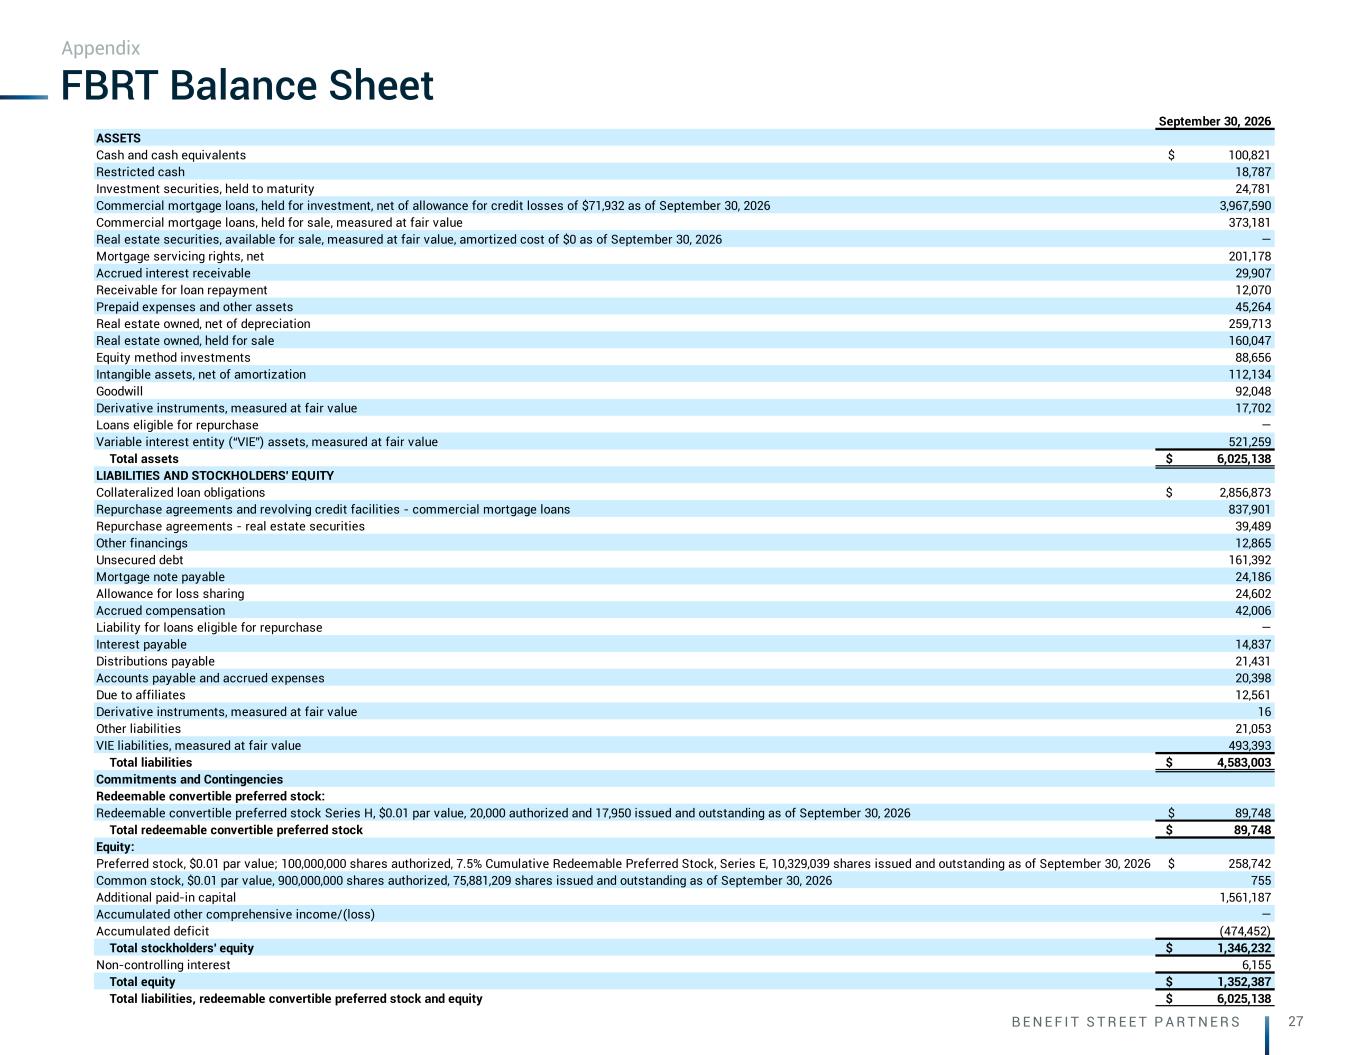
B E N E F I T S T R E E T P A R T N E R S 27 September 30, 2026 ASSETS Cash and cash equivalents $ 100,821 Restricted cash 18,787 Investment securities, held to maturity 24,781 Commercial mortgage loans, held for investment, net of allowance for credit losses of $71,932 as of September 30, 2026 3,967,590 Commercial mortgage loans, held for sale, measured at fair value 373,181 Real estate securities, available for sale, measured at fair value, amortized cost of $0 as of September 30, 2026 — Mortgage servicing rights, net 201,178 Accrued interest receivable 29,907 Receivable for loan repayment 12,070 Prepaid expenses and other assets 45,264 Real estate owned, net of depreciation 259,713 Real estate owned, held for sale 160,047 Equity method investments 88,656 Intangible assets, net of amortization 112,134 Goodwill 92,048 Derivative instruments, measured at fair value 17,702 Loans eligible for repurchase — Variable interest entity (“VIE”) assets, measured at fair value 521,259 Total assets $ 6,025,138 LIABILITIES AND STOCKHOLDERS' EQUITY Collateralized loan obligations $ 2,856,873 Repurchase agreements and revolving credit facilities - commercial mortgage loans 837,901 Repurchase agreements - real estate securities 39,489 Other financings 12,865 Unsecured debt 161,392 Mortgage note payable 24,186 Allowance for loss sharing 24,602 Accrued compensation 42,006 Liability for loans eligible for repurchase — Interest payable 14,837 Distributions payable 21,431 Accounts payable and accrued expenses 20,398 Due to affiliates 12,561 Derivative instruments, measured at fair value 16 Other liabilities 21,053 VIE liabilities, measured at fair value 493,393 Total liabilities $ 4,583,003 Commitments and Contingencies Redeemable convertible preferred stock: Redeemable convertible preferred stock Series H, $0.01 par value, 20,000 authorized and 17,950 issued and outstanding as of September 30, 2026 $ 89,748 Total redeemable convertible preferred stock $ 89,748 Equity: Preferred stock, $0.01 par value; 100,000,000 shares authorized, 7.5% Cumulative Redeemable Preferred Stock, Series E, 10,329,039 shares issued and outstanding as of September 30, 2026 $ 258,742 Common stock, $0.01 par value, 900,000,000 shares authorized, 75,881,209 shares issued and outstanding as of September 30, 2026 755 Additional paid-in capital 1,561,187 Accumulated other comprehensive income/(loss) — Accumulated deficit (474,452) Total stockholders' equity $ 1,346,232 Non-controlling interest 6,155 Total equity $ 1,352,387 Total liabilities, redeemable convertible preferred stock and equity $ 6,025,138 FBRT Balance Sheet Appendix
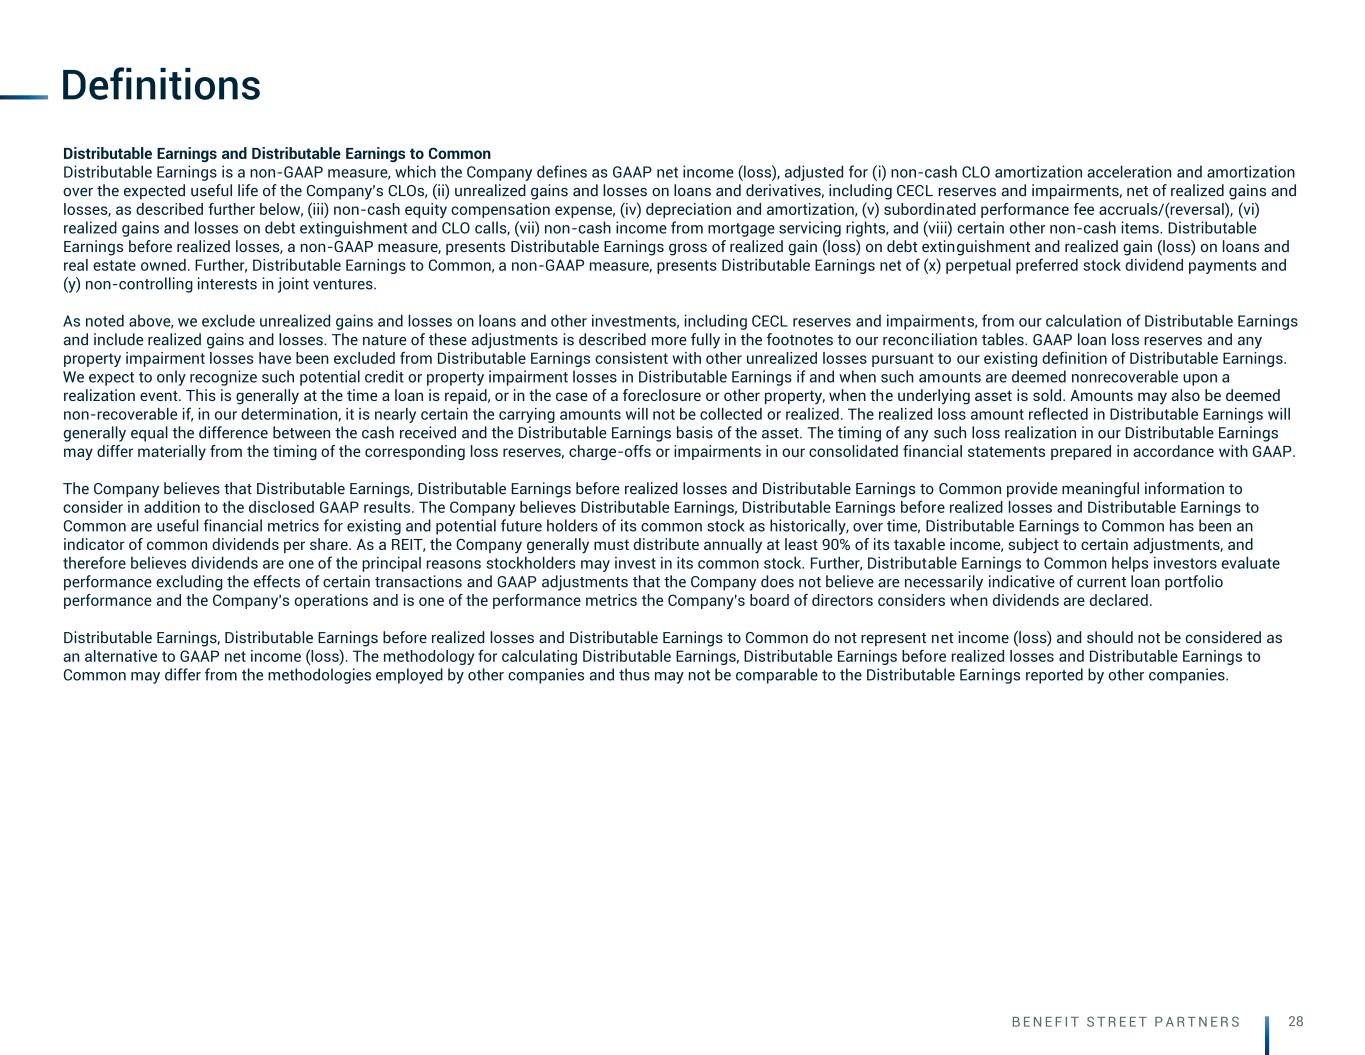
B E N E F I T S T R E E T P A R T N E R S 28 Definitions Distributable Earnings and Distributable Earnings to Common Distributable Earnings is a non-GAAP measure, which the Company defines as GAAP net income (loss), adjusted for (i) non-cash CLO amortization acceleration and amortization over the expected useful life of the Company's CLOs, (ii) unrealized gains and losses on loans and derivatives, including CECL reserves and impairments, net of realized gains and losses, as described further below, (iii) non-cash equity compensation expense, (iv) depreciation and amortization, (v) subordinated performance fee accruals/(reversal), (vi) realized gains and losses on debt extinguishment and CLO calls, (vii) non-cash income from mortgage servicing rights, and (viii) certain other non-cash items. Distributable Earnings before realized losses, a non-GAAP measure, presents Distributable Earnings gross of realized gain (loss) on debt extinguishment and realized gain (loss) on loans and real estate owned. Further, Distributable Earnings to Common, a non-GAAP measure, presents Distributable Earnings net of (x) perpetual preferred stock dividend payments and (y) non-controlling interests in joint ventures. As noted above, we exclude unrealized gains and losses on loans and other investments, including CECL reserves and impairments, from our calculation of Distributable Earnings and include realized gains and losses. The nature of these adjustments is described more fully in the footnotes to our reconciliation tables. GAAP loan loss reserves and any property impairment losses have been excluded from Distributable Earnings consistent with other unrealized losses pursuant to our existing definition of Distributable Earnings. We expect to only recognize such potential credit or property impairment losses in Distributable Earnings if and when such amounts are deemed nonrecoverable upon a realization event. This is generally at the time a loan is repaid, or in the case of a foreclosure or other property, when the underlying asset is sold. Amounts may also be deemed non-recoverable if, in our determination, it is nearly certain the carrying amounts will not be collected or realized. The realized loss amount reflected in Distributable Earnings will generally equal the difference between the cash received and the Distributable Earnings basis of the asset. The timing of any such loss realization in our Distributable Earnings may differ materially from the timing of the corresponding loss reserves, charge-offs or impairments in our consolidated financial statements prepared in accordance with GAAP. The Company believes that Distributable Earnings, Distributable Earnings before realized losses and Distributable Earnings to Common provide meaningful information to consider in addition to the disclosed GAAP results. The Company believes Distributable Earnings, Distributable Earnings before realized losses and Distributable Earnings to Common are useful financial metrics for existing and potential future holders of its common stock as historically, over time, Distributable Earnings to Common has been an indicator of common dividends per share. As a REIT, the Company generally must distribute annually at least 90% of its taxable income, subject to certain adjustments, and therefore believes dividends are one of the principal reasons stockholders may invest in its common stock. Further, Distributable Earnings to Common helps investors evaluate performance excluding the effects of certain transactions and GAAP adjustments that the Company does not believe are necessarily indicative of current loan portfolio performance and the Company's operations and is one of the performance metrics the Company's board of directors considers when dividends are declared. Distributable Earnings, Distributable Earnings before realized losses and Distributable Earnings to Common do not represent net income (loss) and should not be considered as an alternative to GAAP net income (loss). The methodology for calculating Distributable Earnings, Distributable Earnings before realized losses and Distributable Earnings to Common may differ from the methodologies employed by other companies and thus may not be comparable to the Distributable Earnings reported by other companies.
www.bspcredit.com London Cannon Place 78 Cannon Street London EC4N 6HL UK West Palm Beach 360 South Rosemary Avenue Suite 1510 West Palm Beach FL 33401 USA Boston 100 Federal Street 22nd Floor Boston MA 02110 USA New York One Madison Avenue Suite 1600 New York NY 10010 USA