The Fund’s investment objective is long-term capital appreciation. A modest amount of dividend income may be produced by the Fund’s equity securities.
This table describes the fees and expenses that you may pay if you buy, hold, and sell Fund shares. You may pay other fees, such as brokerage commissions and other fees to financial intermediaries, which are not reflected in this table and examples below.
(expenses that you pay each year as a percentage of the value of your investment) | ||||
Management Fees | 0.47% | |||
Distribution (12b‑1) Fees | None | |||
Other Expenses | 0.51% | |||
Total Annual Fund Operating Expenses | 0.98% | |||
This Example is intended to help you compare the cost of investing in the Fund with the cost of investing in other mutual funds. The Example assumes that you invest $10,000 in the Fund for the time periods indicated and then redeem or hold all of your shares at the end of those periods. The Example also assumes that your investment has a 5% return each year and that the Fund’s operating expenses remain the same.
1 Year | 3 Years | 5 Years | 10 Years | |
New Covenant Equity Fund | $100 | $312 | $542 | $1,201 |
1 Year | 3 Years | 5 Years | 10 Years | |
New Covenant Equity Fund | $100 | $312 | $542 | $1,201 |
The Fund pays transaction costs, such as commissions, when it buys and sells securities (or “turns over” its portfolio). A higher portfolio turnover rate may indicate higher transaction costs and may result in higher taxes when Fund shares are held in a taxable account. These costs, which are not reflected in annual Fund operating expenses or in the Example, affect the Fund’s performance. During the most recent fiscal year, the Fund’s portfolio turnover rate was 5% of the average value of its portfolio.
Under normal circumstances, the Fund may not invest less than 80% of its net assets (plus the amount of any borrowings for investment purposes) in equity and equity-related securities. The investment policy is non-fundamental and may be changed upon 60 days’ prior written notice to shareholders.
Under normal market conditions, the Fund will invest primarily in a diversified portfolio of equity and equity-related securities that are components of an index that represents broad exposure to the U.S. equity market (the “Index”), includes approximately 3,000 securities and is not concentrated in any particular industry. The Fund will seek generally to replicate the performance of the Index, subject to such variation as may arise as a result of implementation of the social-witness principles established by the General Assembly of the Presbyterian Church (U.S.A.), as reflected in Guidelines put forth by the Committee on Mission Responsibility Through Investment (the “Presbyterian Principles”) discussed below.
The Fund seeks to invest consistent with the Presbyterian Principles. In doing so, the Fund will not invest in certain companies, despite that company being a component in the Index. The Fund seeks to avoid investing in companies involved in tobacco, for-profit prisons, and some companies related to weapons production, antipersonnel land mines, handguns and assault weapons, or for environmental reasons. In addition, at times a company involved in serious human rights violations may also be screened out of the Fund. The Fund may also screen out other issuers when deemed appropriate to implement the Presbyterian Principles. The Fund’s investment performance will depend, among other things, on the Fund’s tracking of the Index and the performance of the Index. The Fund’s ability to track the performance of the Index will be affected by differences between the Index and the Fund’s portfolio resulting from adherence to the Presbyterian Principles, as well as by factors such as the size and timing of cash flows into and out of the Fund, and the Fund’s fees and expenses.
The Fund generally will attempt to invest in securities comprising the Index in approximately the same proportions as they are represented in the Index, subject to such changes resulting from implementation of the Presbyterian Principles. It may not be possible or practicable to purchase all of the securities composing the Index or to hold them in the same weightings as they are represented in the Index. In those cases, the Fund’s sub-adviser (the “Sub-Adviser”) may employ a sampling or optimization technique to replicate the Index. In seeking to track the performance of the Index, the Fund may invest in the following equity and equity-related securities, not all of which may be constituents of the Index: common stocks, preferred stocks, depositary receipts, rights, warrants, exchange-traded funds (ETFs), publicly traded equity real estate investment trusts (REITs), and futures contracts based on indexes of particular groups or varieties of securities.
The Sub-Adviser selects the Fund’s securities under the general supervision of SIMC. The Sub-Adviser’s investment strategy seeks to closely track the Index return, subject to such variations as arise from implementation of the Presbyterian Principles. The market capitalization and composition of the Index is subject to change. SIMC and the Sub-Adviser may sell securities that are represented in the Index or purchase securities that are not represented in the Index, prior to or after their removal or addition to the Index.
The Sub-Adviser also has the authority to vary from the Index: (i) to conform the Fund’s portfolio to the Presbyterian Principles; (ii) to favor, consistent with the Presbyterian Principles, securities of companies that are more highly ranked with respect to environmental, social and governance (ESG) criteria (e.g., company business models, corporate governance policies, relationships with stakeholders, and history of controversies) than other companies in the Fund’s portfolio; and (iii) to a lesser extent, manage risk and seek efficient trading costs.
The bar chart and the performance table below provide some indication of the risks of investing in the Fund by showing changes in the Fund’s performance from year to year for the past ten calendar years and by showing how the Fund’s average annual returns for 1, 5 and 10 years compared with those of a broad measure of market performance. The Fund’s past performance (before and after taxes) is not necessarily an indication of how the Fund will perform in the future. Updated performance information is available on the Fund’s website at www.NewCovenantFunds.com or by calling the Fund toll-free at 877‑835‑4531. On May 13, 2019, the Fund transitioned from an actively managed strategy to its current strategy of investing in equity securities that are components of the Index.
Best Quarter: 21.99% (06/30/20) Worst Quarter: -20.59% (03/31/20) The Fund’s total return (pre-tax) from January 1, 2026 to September 30, 2026 was 11.68%. |
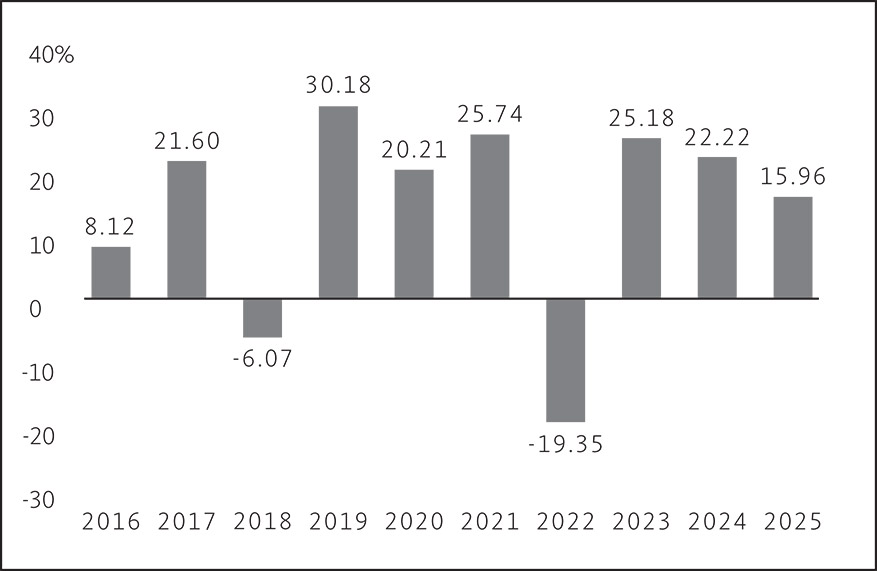
Best Quarter: 21.99% (06/30/20)
Worst Quarter: -20.59% (03/31/20)
The Fund’s total return (pre-tax) from January 1, 2026 to September 30, 2026 was 11.68%.
This table compares the Fund’s average annual total returns to those of a broad-based securities market index.
After-tax returns are calculated using the historical highest individual federal marginal income tax rates and do not reflect the impact of state and local taxes. Your actual after-tax returns will depend on your tax situation and may differ from those shown. After-tax returns shown are not relevant to investors who hold their Fund shares through tax-deferred arrangements, such as 401(k) plans or individual retirement accounts.
New Covenant Equity Fund | 1 Year | 5 Years | 10 Years | |||||
Fund Return Before Taxes | 15.96 | % | 12.46 | % | 13.27 | % | ||
Fund Return After Taxes on Distributions | 13.47 | % | 10.75 | % | 11.76 | % | ||
Fund Return After Taxes on Distributions and Sale of Fund Shares | 11.16 | % | 9.72 | % | 10.71 | % | ||
Russell 3000 Index Return (reflects no deduction for fees, expenses or taxes) | 17.15 | % | 13.15 | % | 14.29 | % | ||