Third-Quarter 2026 Supplemental Presentation October 28, 2026 2 This presentation contains forward-looking statements within the meaning of Private Securities Litigation Reform Act of 1995. These statements are based on Morningstar's current expectations about future events or future financial performance. Forward-looking statements by their nature address matters that are, to different degrees, uncertain, and often contain words such as "may," "could," "expect," "intend," "plan," "seek," "anticipate," "believe," "estimate," "predict," "potential," "prospects," or "continue." These statements involve known or unknown risks and uncertainties that may cause actual results to differ significantly from what Morningstar expects. More information about factors that could affect Morningstar's business and financial results are in its filings with the SEC, including its most recent Forms 8-K, 10-K, and 10-Q. Morningstar undertakes no obligation to publicly update any forward-looking statements as a result of new information, future events, or otherwise, except as required by law. 3 This presentation includes references to the non-GAAP financial measures listed below (including percentage growth or decline of those numbers). These non-GAAP measures may not be comparable to similarly titled measures reported by other companies. A reconciliation of non-GAAP financial measures to the most directly comparable GAAP financial measures is provided in the appendix to this presentation and in the Company's filings with the SEC, including its most recent Forms 8-K, 10-K, and 10-Q. "Organic Revenue" is consolidated revenue before (1) acquisitions and divestitures, (2) adoption of new accounting standards or revisions to accounting practices (accounting changes), and (3) the effect of foreign currency translations. "Adjusted Operating Income (Loss)" is consolidated operating income (loss) excluding (1) intangible amortization expense, (2) the impact of merger, acquisition, and divestiture-related activity which, when applicable, may include certain non-recurring expenses such as pre-deal due diligence, transaction costs, contingent consideration, severance, and post-close integration costs (M&A-related expenses), and (3) certain other one-time, non-recurring items which management does not consider when evaluating ongoing performance (other non-recurring items). "Adjusted Operating Margin" is operating margin excluding (1) intangible amortization expense, (2) M&A-related expenses, and (3) other non-recurring items. "Adjusted Operating Expense" is operating expenses excluding (1) intangible amortization expense, (2) M&A-related expenses, and (3) other non-recurring items. "Free Cash Flow" is cash provided by or used for operating activities less capital expenditures. "Free Cash Flow Conversion" is free cash flow divided by adjusted operating income. 4 Table of Contents Q3 26 Results Summary 5 Q3 26 Segment Detail 13 Appendix A: Additional Segment Detail 24 Appendix B: Reconciliations and Additional Information 38
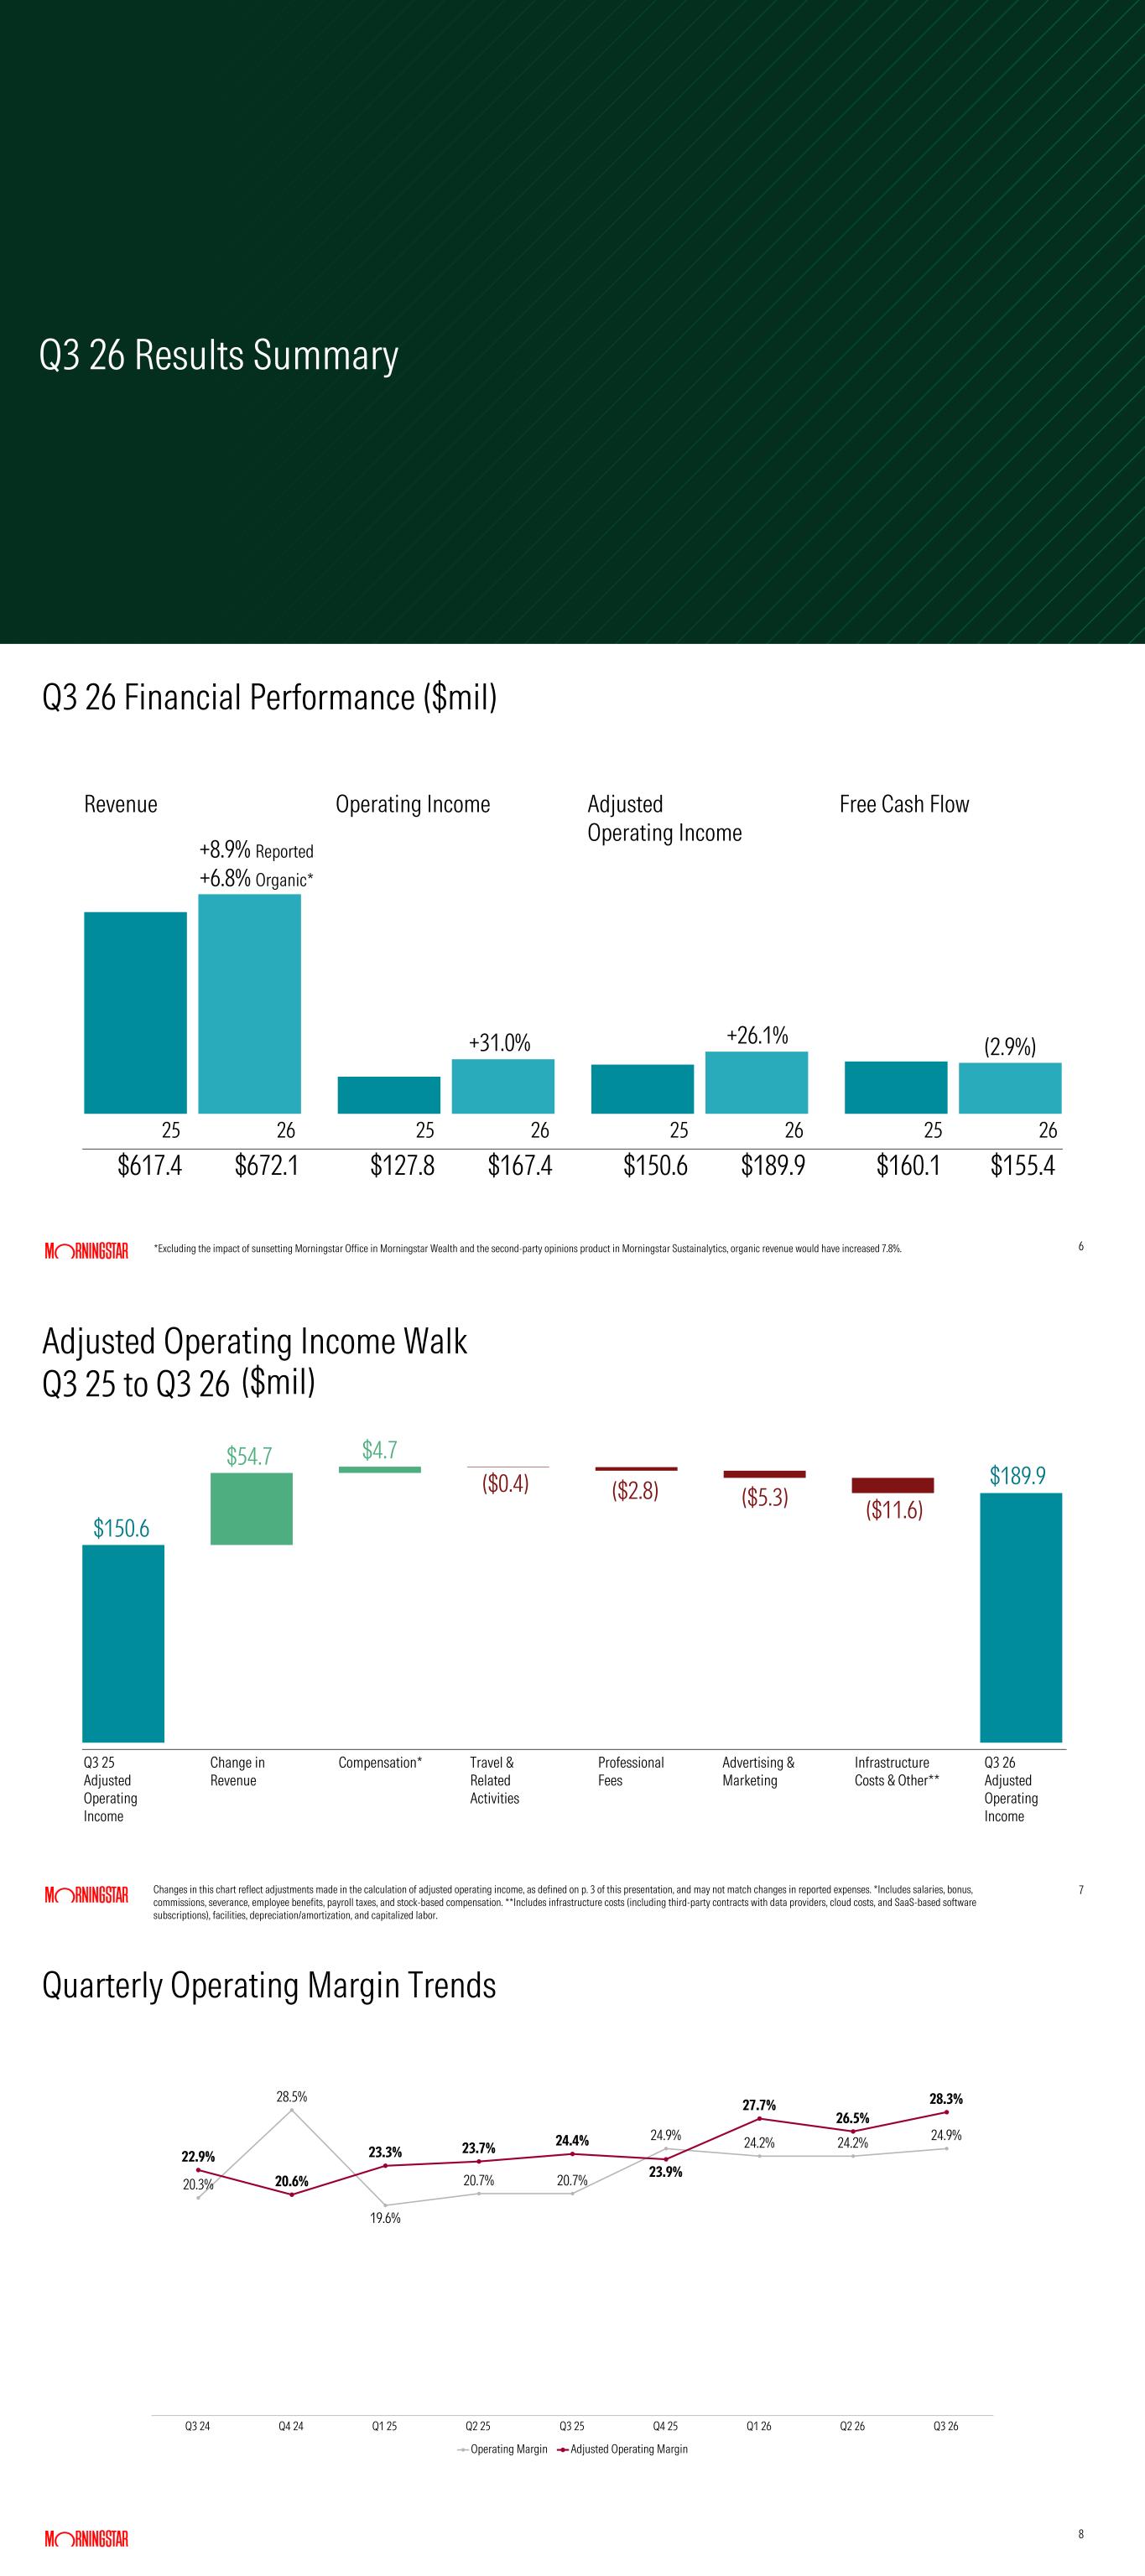
Q3 26 Results Summary 6 Q3 26 Financial Performance ($mil) +8.9% Reported +6.8% Organic* +26.1% (2.9%)+31.0% $617.4 $672.1 $127.8 $167.4 $150.6 $189.9 $160.1 $155.4 Revenue Operating Income Adjusted Operating Income Free Cash Flow 25 26 25 26 25 26 25 26 *Excluding the impact of sunsetting Morningstar Office in Morningstar Wealth and the second-party opinions product in Morningstar Sustainalytics, organic revenue would have increased 7.8%. 7 Adjusted Operating Income Walk Q3 25 to Q3 26 Q3 25 Adjusted Operating Income Change in Revenue Compensation* Travel & Related Activities Professional Fees Advertising & Marketing Infrastructure Costs & Other** Q3 26 Adjusted Operating Income Changes in this chart reflect adjustments made in the calculation of adjusted operating income, as defined on p. 3 of this presentation, and may not match changes in reported expenses. *Includes salaries, bonus, commissions, severance, employee benefits, payroll taxes, and stock-based compensation. **Includes infrastructure costs (including third-party contracts with data providers, cloud costs, and SaaS-based software subscriptions), facilities, depreciation/amortization, and capitalized labor. $150.6 $54.7 ($2.8) ($5.3)($0.4) ($11.6) $4.7 $189.9 ($mil) 8 Quarterly Operating Margin Trends 20.3% 28.5% 19.6% 20.7% 20.7% 24.9% 24.2% 24.2% 24.9% 22.9% 20.6% 23.3% 23.7% 24.4% 23.9% 27.7% 26.5% 28.3% Operating Margin Adjusted Operating Margin Q3 24 Q4 24 Q1 25 Q2 25 Q3 25 Q4 25 Q1 26 Q2 26 Q3 26
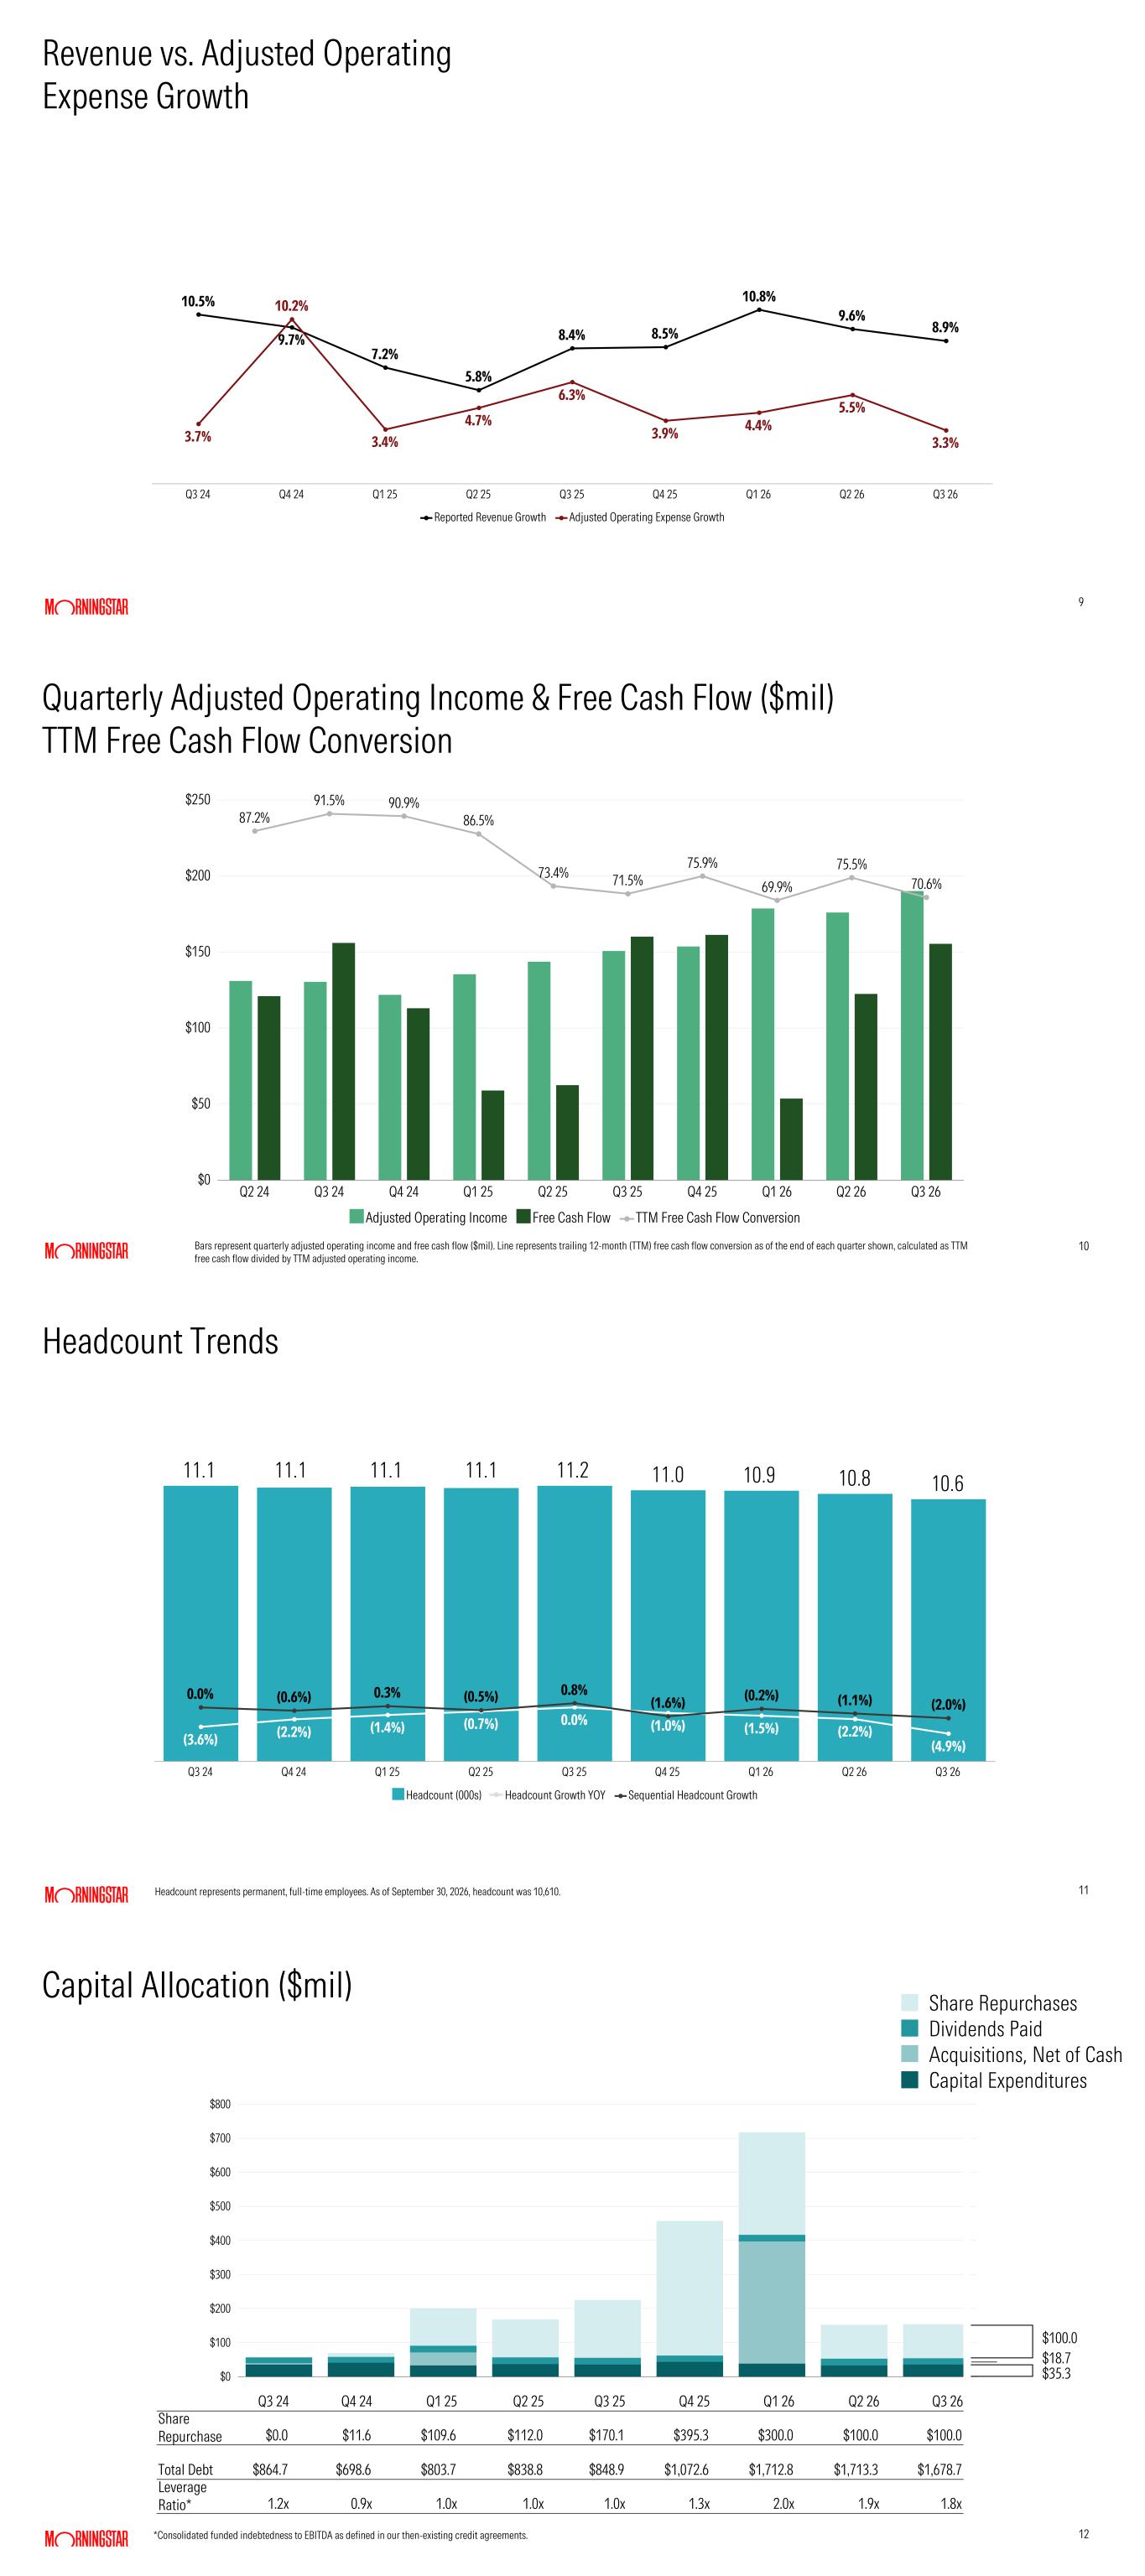
9 Revenue vs. Adjusted Operating Expense Growth 10.5% 9.7% 7.2% 5.8% 8.4% 8.5% 10.8% 9.6% 8.9% 3.7% 10.2% 3.4% 4.7% 6.3% 3.9% 4.4% 5.5% 3.3% Reported Revenue Growth Adjusted Operating Expense Growth Q3 24 Q4 24 Q1 25 Q2 25 Q3 25 Q4 25 Q1 26 Q2 26 Q3 26 10 Quarterly Adjusted Operating Income & Free Cash Flow ($mil) TTM Free Cash Flow Conversion 10 87.2% 91.5% 90.9% 86.5% 73.4% 71.5% 75.9% 69.9% 75.5% 70.6% Adjusted Operating Income Free Cash Flow TTM Free Cash Flow Conversion Q2 24 Q3 24 Q4 24 Q1 25 Q2 25 Q3 25 Q4 25 Q1 26 Q2 26 Q3 26 $0 $50 $100 $150 $200 $250 Bars represent quarterly adjusted operating income and free cash flow ($mil). Line represents trailing 12-month (TTM) free cash flow conversion as of the end of each quarter shown, calculated as TTM free cash flow divided by TTM adjusted operating income. 11 Headcount Trends Headcount represents permanent, full-time employees. As of September 30, 2026, headcount was 10,610. (3.6%) (2.2%) (1.4%) (0.7%) 0.0% (1.0%) (1.5%) (2.2%) (4.9%) 0.0% (0.6%) 0.3% (0.5%) 0.8% (1.6%) (0.2%) (1.1%) (2.0%) Headcount (000s) Headcount Growth YOY Sequential Headcount Growth Q3 24 Q4 24 Q1 25 Q2 25 Q3 25 Q4 25 Q1 26 Q2 26 Q3 26 11.1 11.1 11.1 11.1 11.2 11.0 10.9 10.8 10.6 12 Capital Allocation ($mil) 12 *Consolidated funded indebtedness to EBITDA as defined in our then-existing credit agreements. $0 $100 $200 $300 $400 $500 $600 $700 $800 Q3 24 Q4 24 Q1 25 Q2 25 Q3 25 Q4 25 Q1 26 Q2 26 Q3 26 Share Repurchase $0.0 $11.6 $109.6 $112.0 $170.1 $395.3 $300.0 $100.0 $100.0 Total Debt $864.7 $698.6 $803.7 $838.8 $848.9 $1,072.6 $1,712.8 $1,713.3 $1,678.7 Leverage Ratio* 1.2x 0.9x 1.0x 1.0x 1.0x 1.3x 2.0x 1.9x 1.8x Share Repurchases Dividends Paid Acquisitions, Net of Cash Capital Expenditures $100.0 $18.7 $35.3
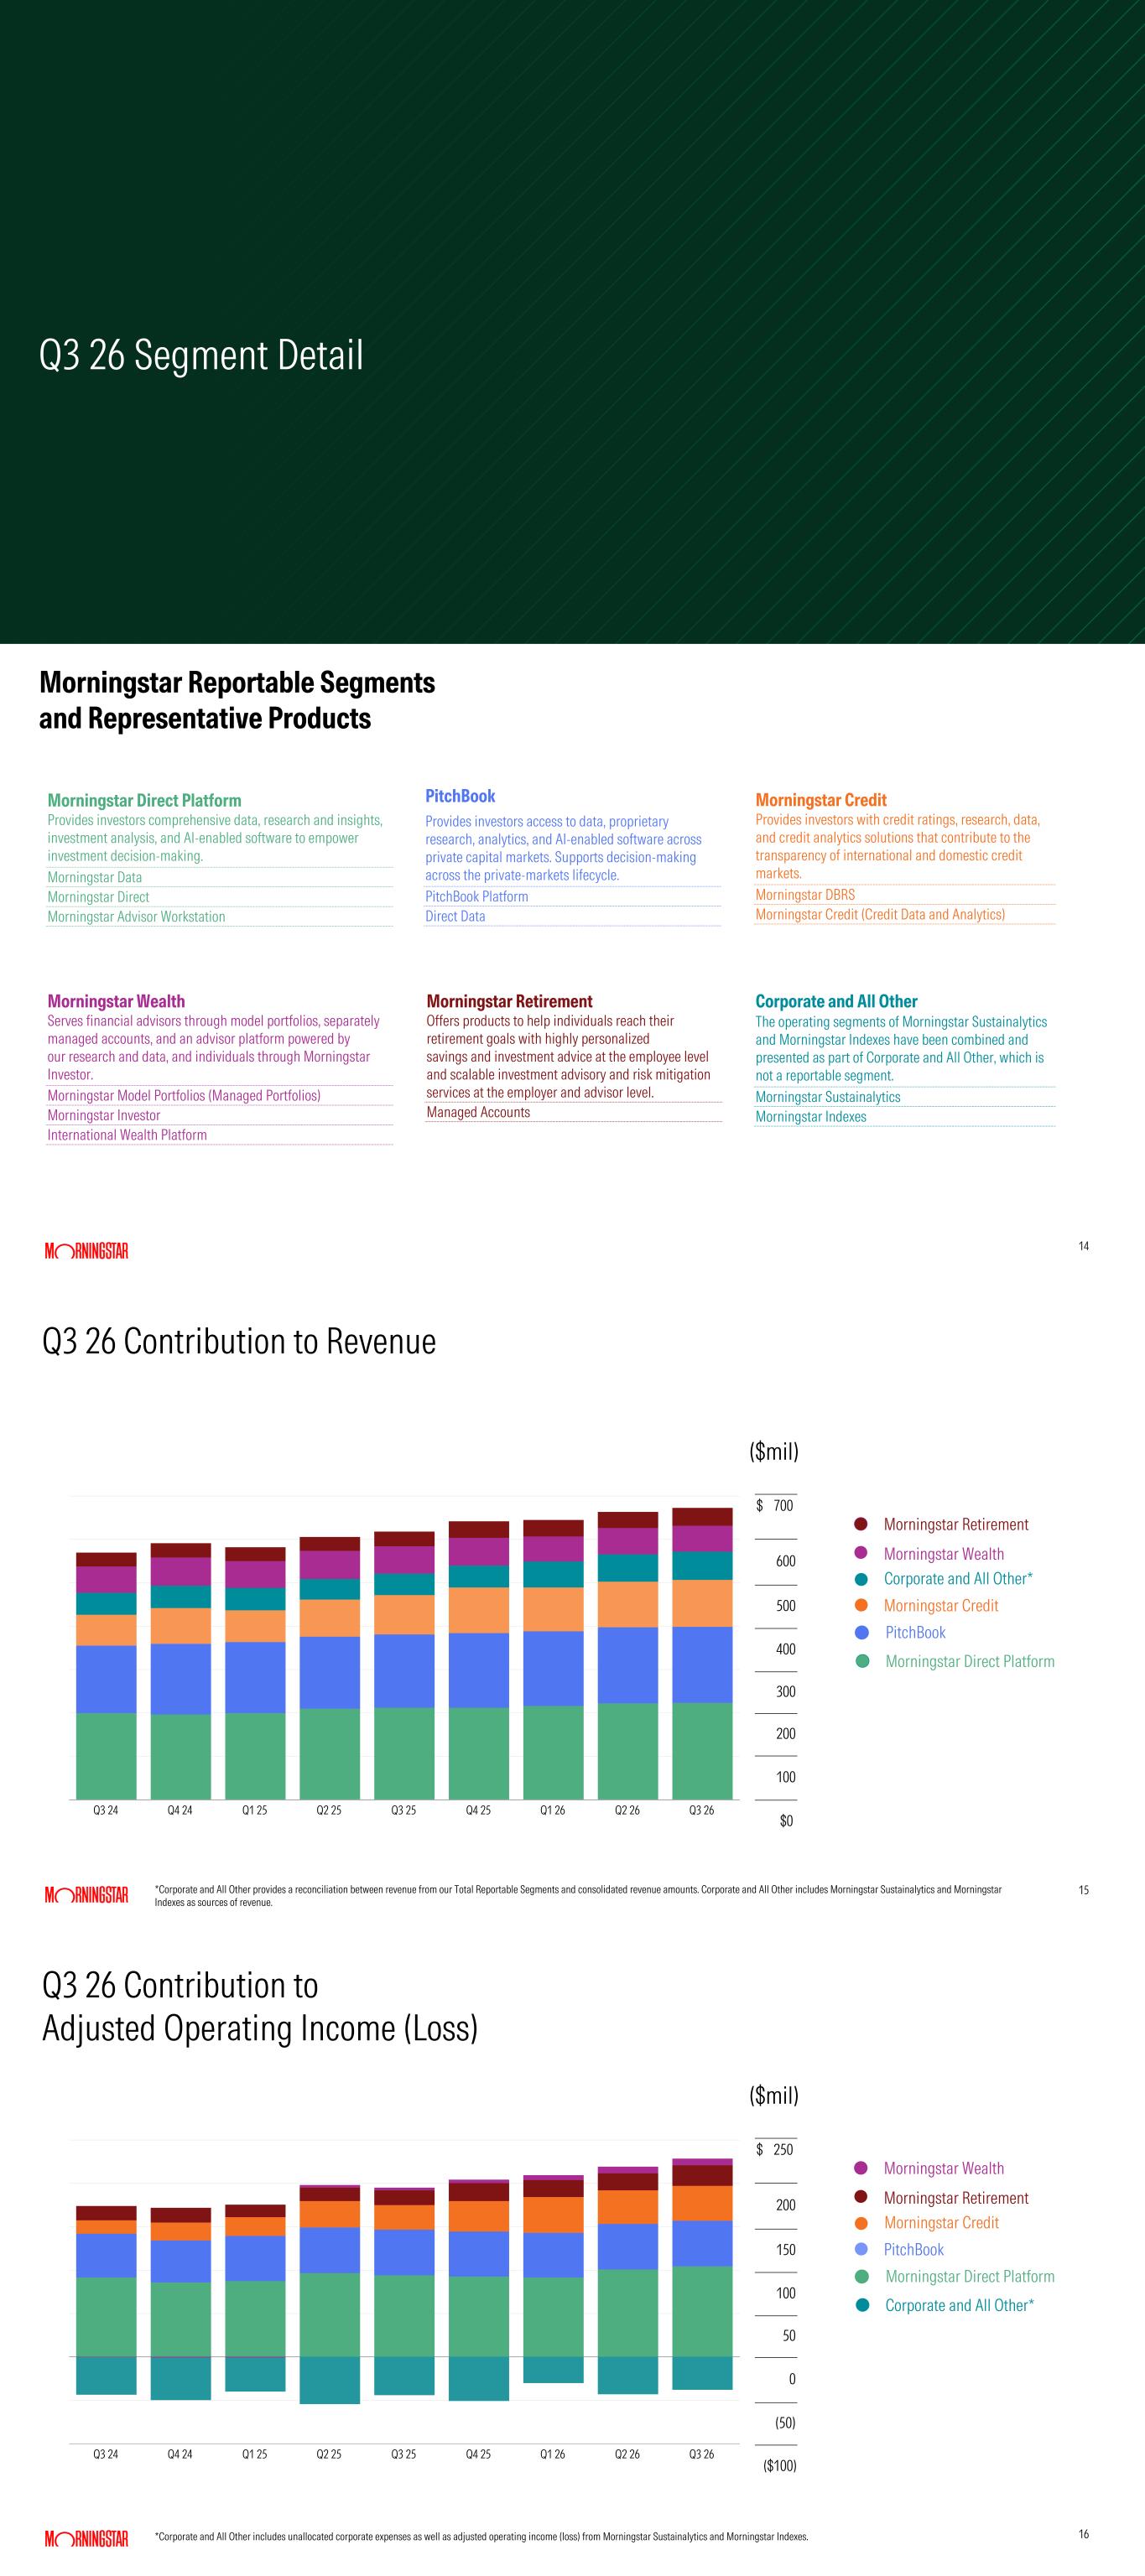
Q3 26 Segment Detail 14 Morningstar Reportable Segments and Representative Products Morningstar Direct Platform Provides investors comprehensive data, research and insights, investment analysis, and AI-enabled software to empower investment decision-making. Morningstar Data Morningstar Direct Morningstar Advisor Workstation PitchBook Provides investors access to data, proprietary research, analytics, and AI-enabled software across private capital markets. Supports decision-making across the private-markets lifecycle. PitchBook Platform Direct Data Morningstar Wealth Serves financial advisors through model portfolios, separately managed accounts, and an advisor platform powered by our research and data, and individuals through Morningstar Investor. Morningstar Model Portfolios (Managed Portfolios) Morningstar Investor International Wealth Platform Morningstar Credit Provides investors with credit ratings, research, data, and credit analytics solutions that contribute to the transparency of international and domestic credit markets. Morningstar DBRS Morningstar Credit (Credit Data and Analytics) Morningstar Retirement Offers products to help individuals reach their retirement goals with highly personalized savings and investment advice at the employee level and scalable investment advisory and risk mitigation services at the employer and advisor level. Managed Accounts Corporate and All Other The operating segments of Morningstar Sustainalytics and Morningstar Indexes have been combined and presented as part of Corporate and All Other, which is not a reportable segment. Morningstar Sustainalytics Morningstar Indexes 15 Q3 26 Contribution to Revenue 15 Q3 24 Q4 24 Q1 25 Q2 25 Q3 25 Q4 25 Q1 26 Q2 26 Q3 26 *Corporate and All Other provides a reconciliation between revenue from our Total Reportable Segments and consolidated revenue amounts. Corporate and All Other includes Morningstar Sustainalytics and Morningstar Indexes as sources of revenue. $ 700 600 500 400 300 200 100 $0 ($mil) PitchBook Morningstar Credit Corporate and All Other* Morningstar Retirement Morningstar Wealth Morningstar Direct Platform 16 Q3 26 Contribution to Adjusted Operating Income (Loss) 16 Q3 24 Q4 24 Q1 25 Q2 25 Q3 25 Q4 25 Q1 26 Q2 26 Q3 26 Morningstar Direct Platform *Corporate and All Other includes unallocated corporate expenses as well as adjusted operating income (loss) from Morningstar Sustainalytics and Morningstar Indexes. $ 250 200 150 100 50 0 (50) ($100) PitchBook Morningstar Credit Morningstar Wealth Morningstar Retirement Corporate and All Other* ($mil)
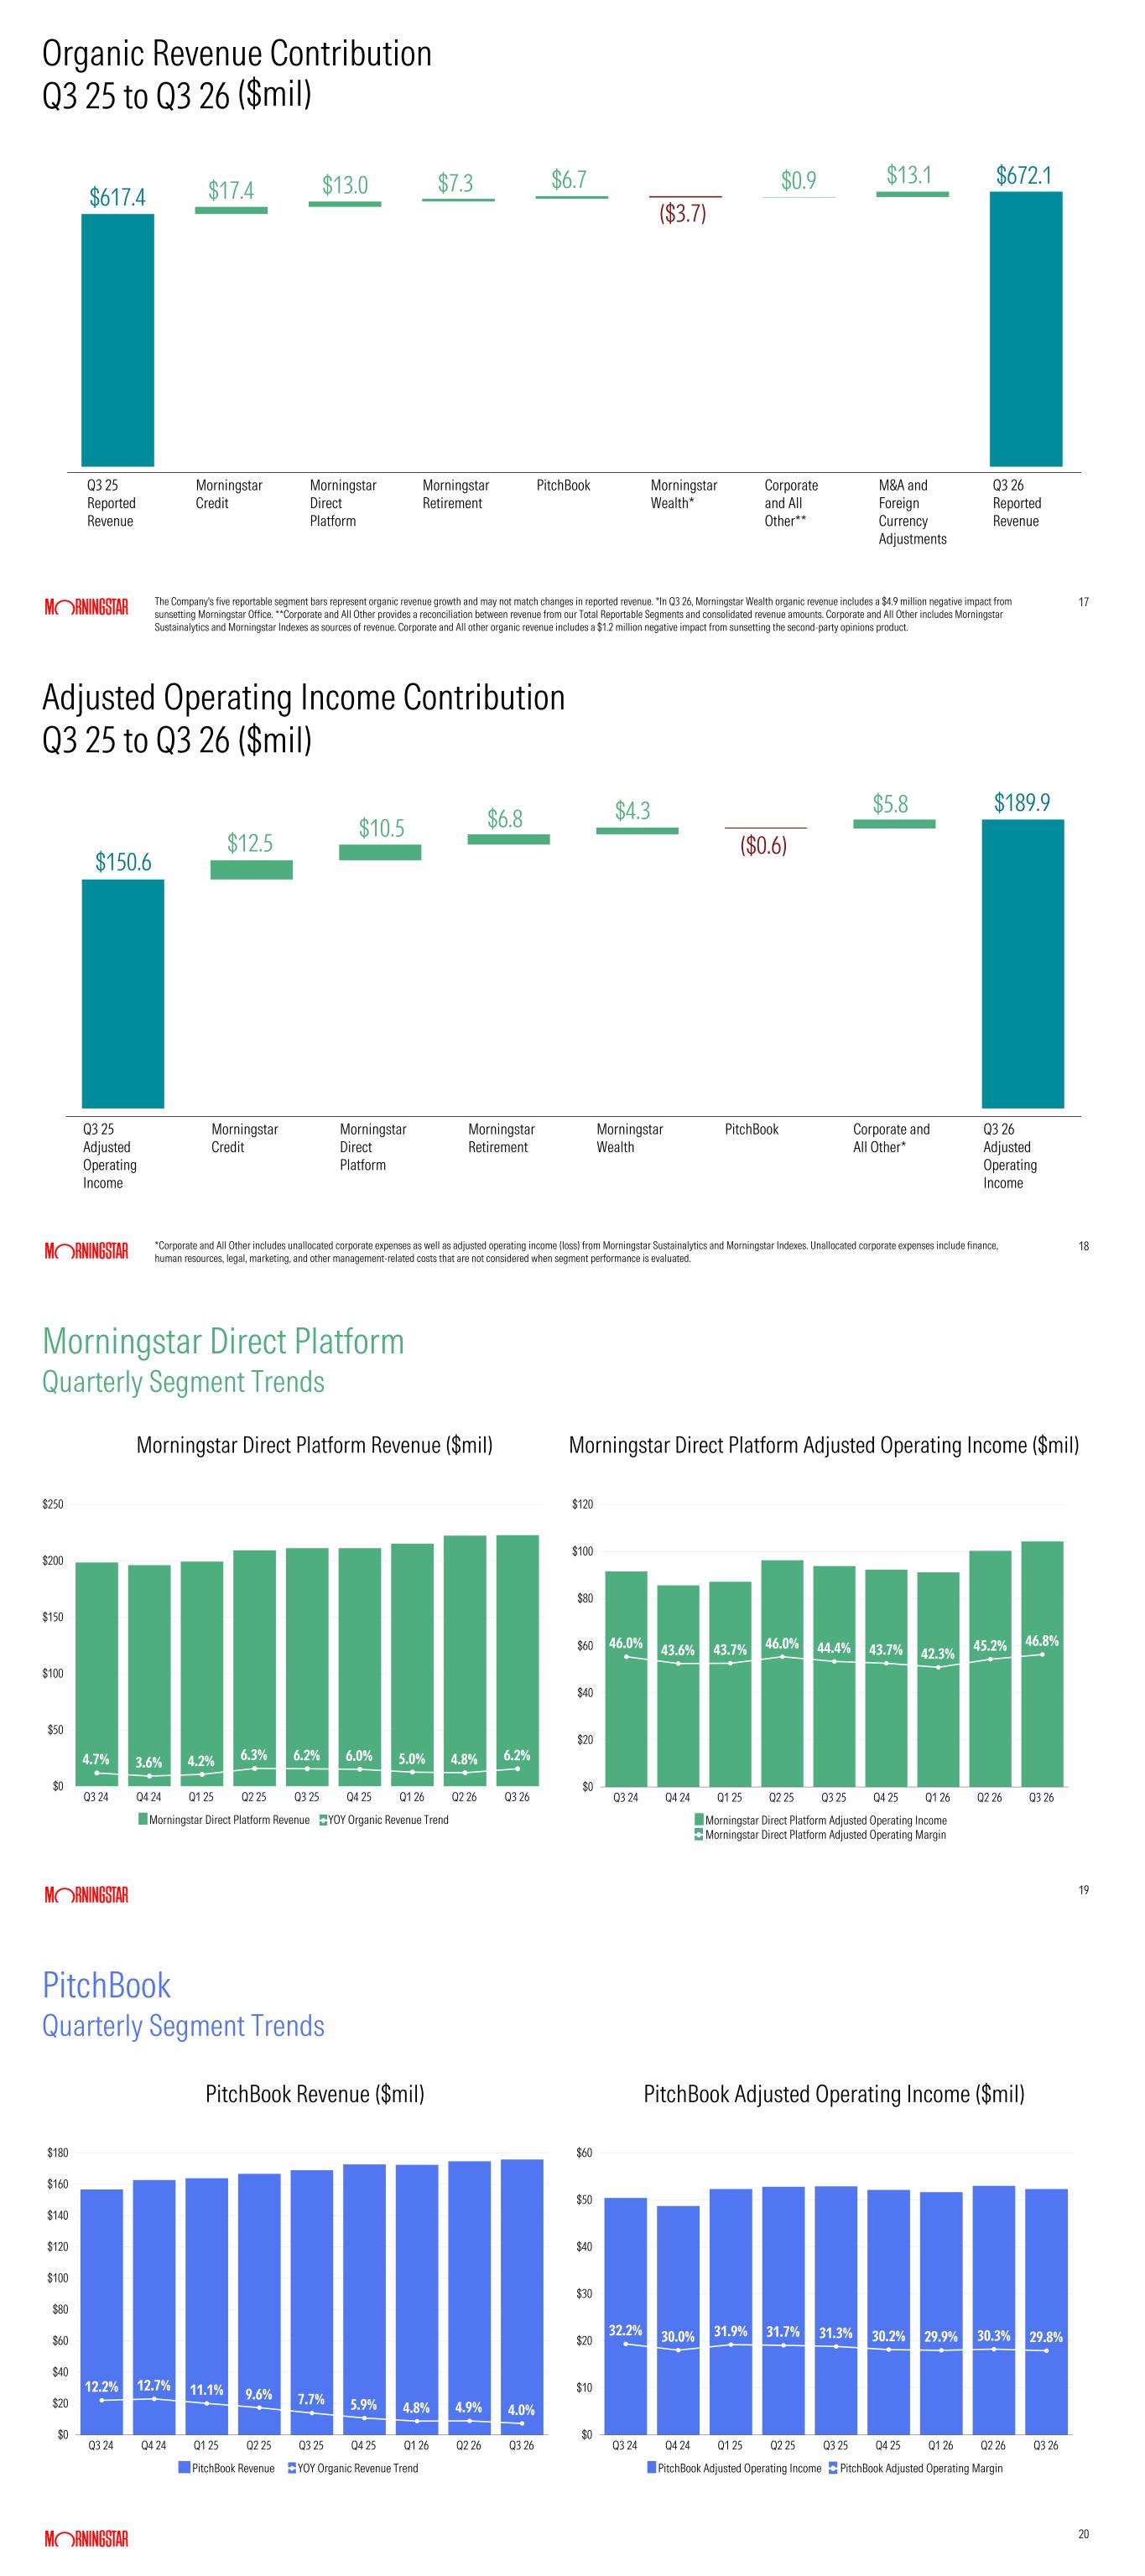
17 Organic Revenue Contribution Q3 25 to Q3 26 Q3 25 Reported Revenue Morningstar Credit Morningstar Direct Platform Morningstar Retirement PitchBook Morningstar Wealth* Corporate and All Other** M&A and Foreign Currency Adjustments Q3 26 Reported Revenue The Company's five reportable segment bars represent organic revenue growth and may not match changes in reported revenue. *In Q3 26, Morningstar Wealth organic revenue includes a $4.9 million negative impact from sunsetting Morningstar Office. **Corporate and All Other provides a reconciliation between revenue from our Total Reportable Segments and consolidated revenue amounts. Corporate and All Other includes Morningstar Sustainalytics and Morningstar Indexes as sources of revenue. Corporate and All other organic revenue includes a $1.2 million negative impact from sunsetting the second-party opinions product. $617.4 $7.3$17.4 $13.0 ($3.7) $6.7 $0.9 $13.1 $672.1 ($mil) 18 Adjusted Operating Income Contribution Q3 25 to Q3 26 ($mil) Q3 25 Adjusted Operating Income Morningstar Credit Morningstar Direct Platform Morningstar Retirement Morningstar Wealth PitchBook Corporate and All Other* Q3 26 Adjusted Operating Income *Corporate and All Other includes unallocated corporate expenses as well as adjusted operating income (loss) from Morningstar Sustainalytics and Morningstar Indexes. Unallocated corporate expenses include finance, human resources, legal, marketing, and other management-related costs that are not considered when segment performance is evaluated. $150.6 $10.5 $4.3$6.8 $12.5 $5.8 $189.9 ($0.6) 19 Morningstar Direct Platform Quarterly Segment Trends 19 4.7% 3.6% 4.2% 6.3% 6.2% 6.0% 5.0% 4.8% 6.2% Morningstar Direct Platform Revenue YOY Organic Revenue Trend Q3 24 Q4 24 Q1 25 Q2 25 Q3 25 Q4 25 Q1 26 Q2 26 Q3 26 $0 $50 $100 $150 $200 $250 46.0% 43.6% 43.7% 46.0% 44.4% 43.7% 42.3% 45.2% 46.8% Morningstar Direct Platform Adjusted Operating Income Morningstar Direct Platform Adjusted Operating Margin Q3 24 Q4 24 Q1 25 Q2 25 Q3 25 Q4 25 Q1 26 Q2 26 Q3 26 $0 $20 $40 $60 $80 $100 $120 Morningstar Direct Platform Revenue ($mil) Morningstar Direct Platform Adjusted Operating Income ($mil) 20 PitchBook Quarterly Segment Trends 20 12.2% 12.7% 11.1% 9.6% 7.7% 5.9% 4.8% 4.9% 4.0% PitchBook Revenue YOY Organic Revenue Trend Q3 24 Q4 24 Q1 25 Q2 25 Q3 25 Q4 25 Q1 26 Q2 26 Q3 26 $0 $20 $40 $60 $80 $100 $120 $140 $160 $180 32.2% 30.0% 31.9% 31.7% 31.3% 30.2% 29.9% 30.3% 29.8% PitchBook Adjusted Operating Income PitchBook Adjusted Operating Margin Q3 24 Q4 24 Q1 25 Q2 25 Q3 25 Q4 25 Q1 26 Q2 26 Q3 26 $0 $10 $20 $30 $40 $50 $60 PitchBook Revenue ($mil) PitchBook Adjusted Operating Income ($mil)
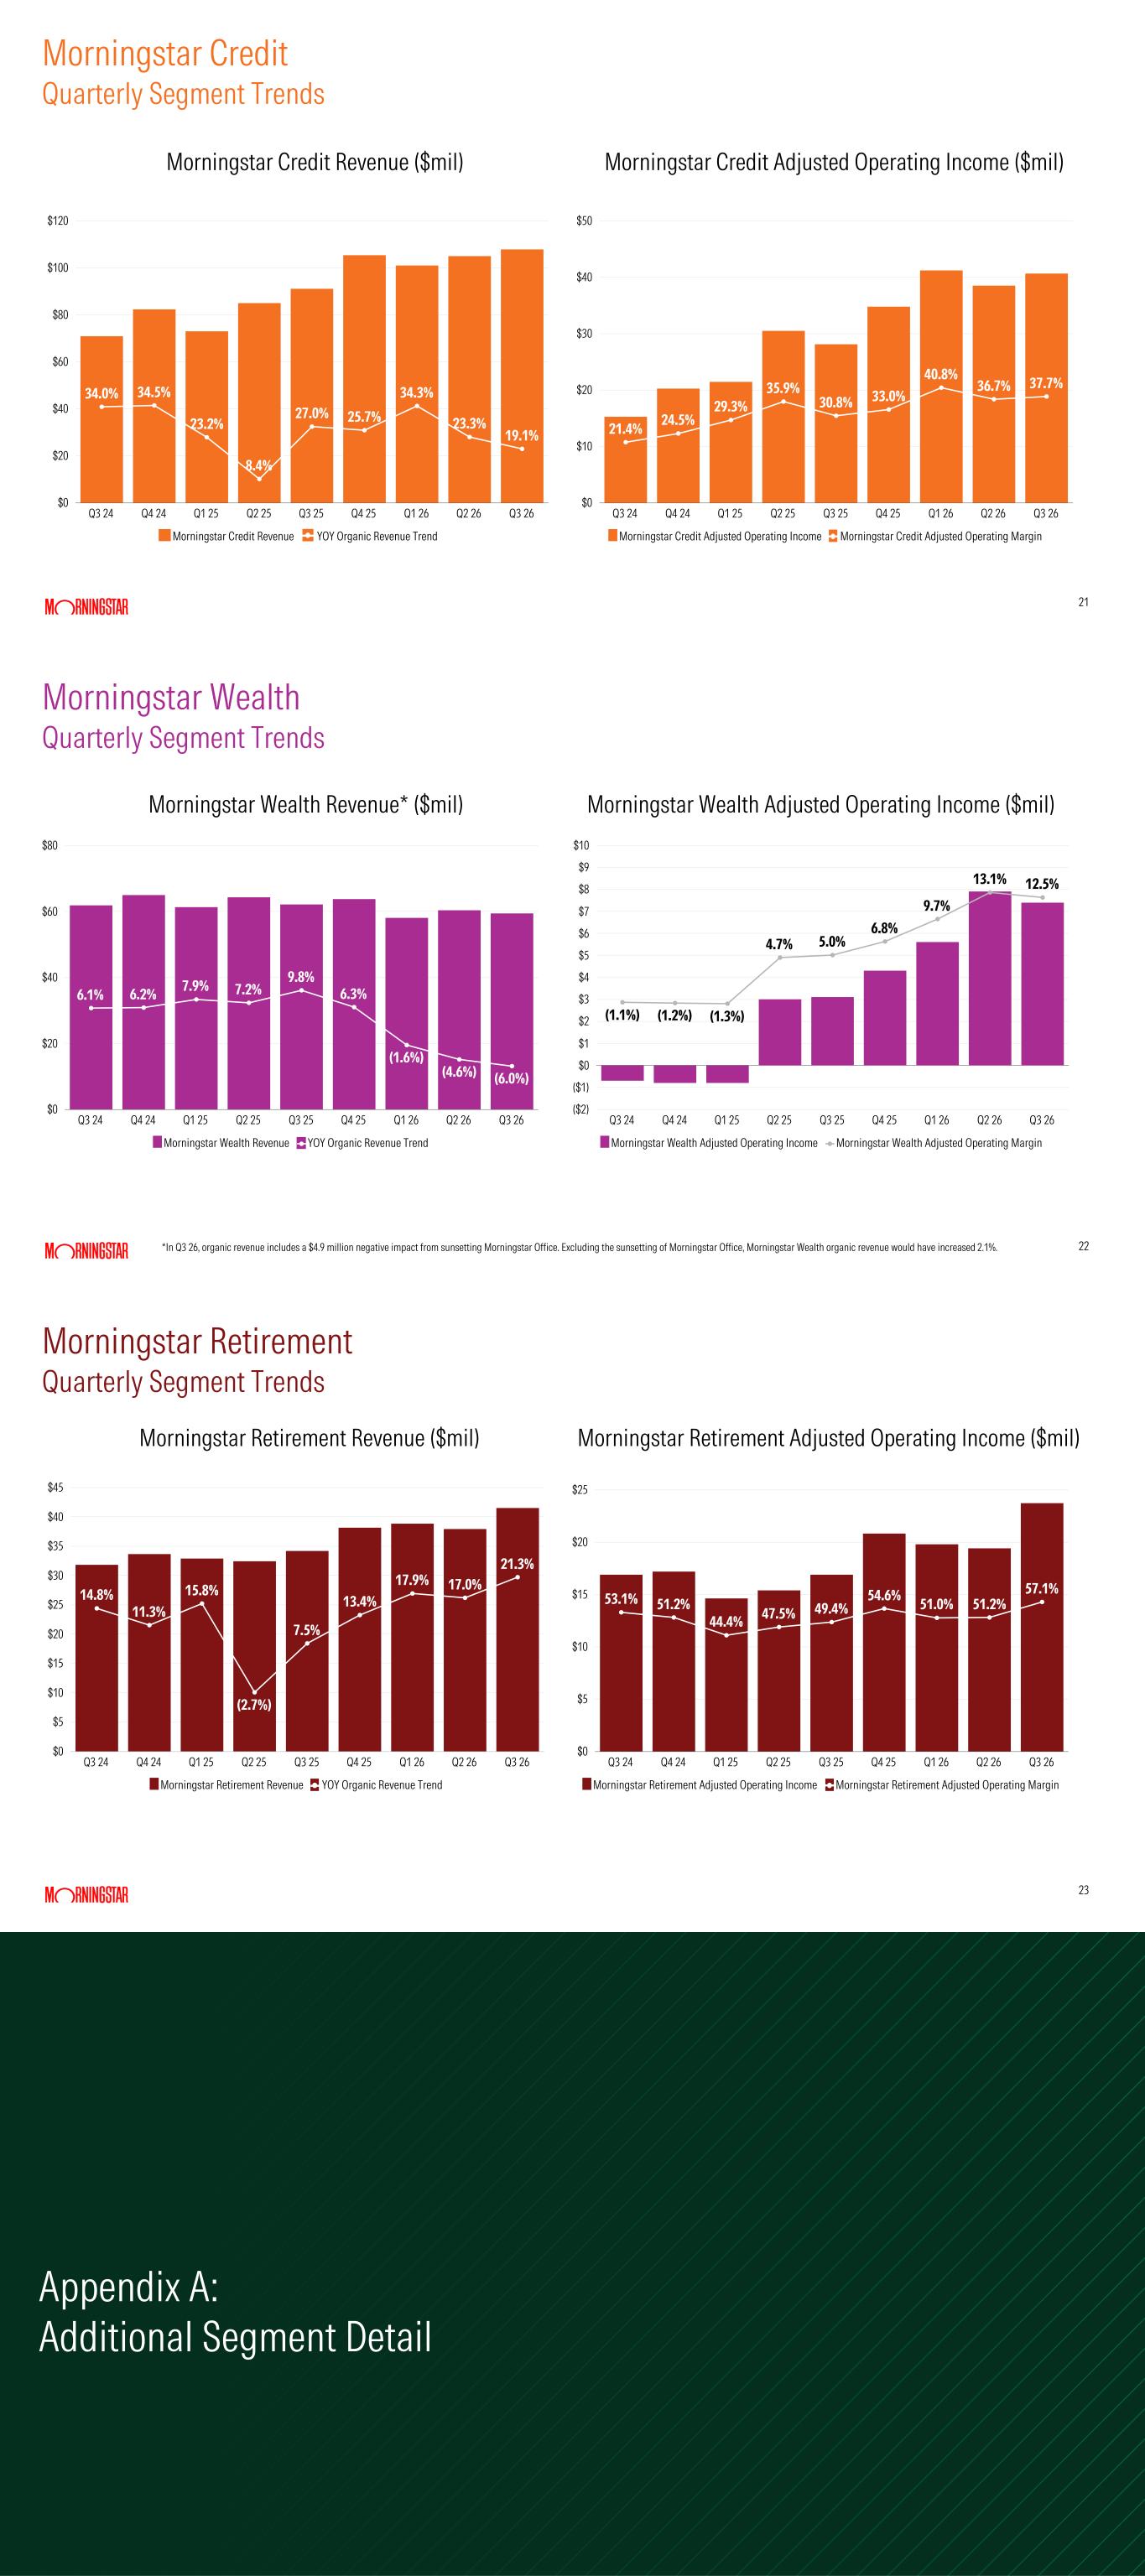
21 21 34.0% 34.5% 23.2% 8.4% 27.0% 25.7% 34.3% 23.3% 19.1% Morningstar Credit Revenue YOY Organic Revenue Trend Q3 24 Q4 24 Q1 25 Q2 25 Q3 25 Q4 25 Q1 26 Q2 26 Q3 26 $0 $20 $40 $60 $80 $100 $120 21.4% 24.5% 29.3% 35.9% 30.8% 33.0% 40.8% 36.7% 37.7% Morningstar Credit Adjusted Operating Income Morningstar Credit Adjusted Operating Margin Q3 24 Q4 24 Q1 25 Q2 25 Q3 25 Q4 25 Q1 26 Q2 26 Q3 26 $0 $10 $20 $30 $40 $50 Morningstar Credit Revenue ($mil) Morningstar Credit Adjusted Operating Income ($mil) Morningstar Credit Quarterly Segment Trends 22 Morningstar Wealth Quarterly Segment Trends 22 6.1% 6.2% 7.9% 7.2% 9.8% 6.3% (1.6%) (4.6%) (6.0%) Morningstar Wealth Revenue YOY Organic Revenue Trend Q3 24 Q4 24 Q1 25 Q2 25 Q3 25 Q4 25 Q1 26 Q2 26 Q3 26 $0 $20 $40 $60 $80 (1.1%) (1.2%) (1.3%) 4.7% 5.0% 6.8% 9.7% 13.1% 12.5% Morningstar Wealth Adjusted Operating Income Morningstar Wealth Adjusted Operating Margin Q3 24 Q4 24 Q1 25 Q2 25 Q3 25 Q4 25 Q1 26 Q2 26 Q3 26 ($2) ($1) $0 $1 $2 $3 $4 $5 $6 $7 $8 $9 $10 Morningstar Wealth Revenue* ($mil) Morningstar Wealth Adjusted Operating Income ($mil) *In Q3 26, organic revenue includes a $4.9 million negative impact from sunsetting Morningstar Office. Excluding the sunsetting of Morningstar Office, Morningstar Wealth organic revenue would have increased 2.1%. 23 Morningstar Retirement Quarterly Segment Trends 14.8% 11.3% 15.8% (2.7%) 7.5% 13.4% 17.9% 17.0% 21.3% Morningstar Retirement Revenue YOY Organic Revenue Trend Q3 24 Q4 24 Q1 25 Q2 25 Q3 25 Q4 25 Q1 26 Q2 26 Q3 26 $0 $5 $10 $15 $20 $25 $30 $35 $40 $45 53.1% 51.2% 44.4% 47.5% 49.4% 54.6% 51.0% 51.2% 57.1% Morningstar Retirement Adjusted Operating Income Morningstar Retirement Adjusted Operating Margin Q3 24 Q4 24 Q1 25 Q2 25 Q3 25 Q4 25 Q1 26 Q2 26 Q3 26 $0 $5 $10 $15 $20 $25 Morningstar Retirement Revenue ($mil) Morningstar Retirement Adjusted Operating Income ($mil) Appendix A: Additional Segment Detail
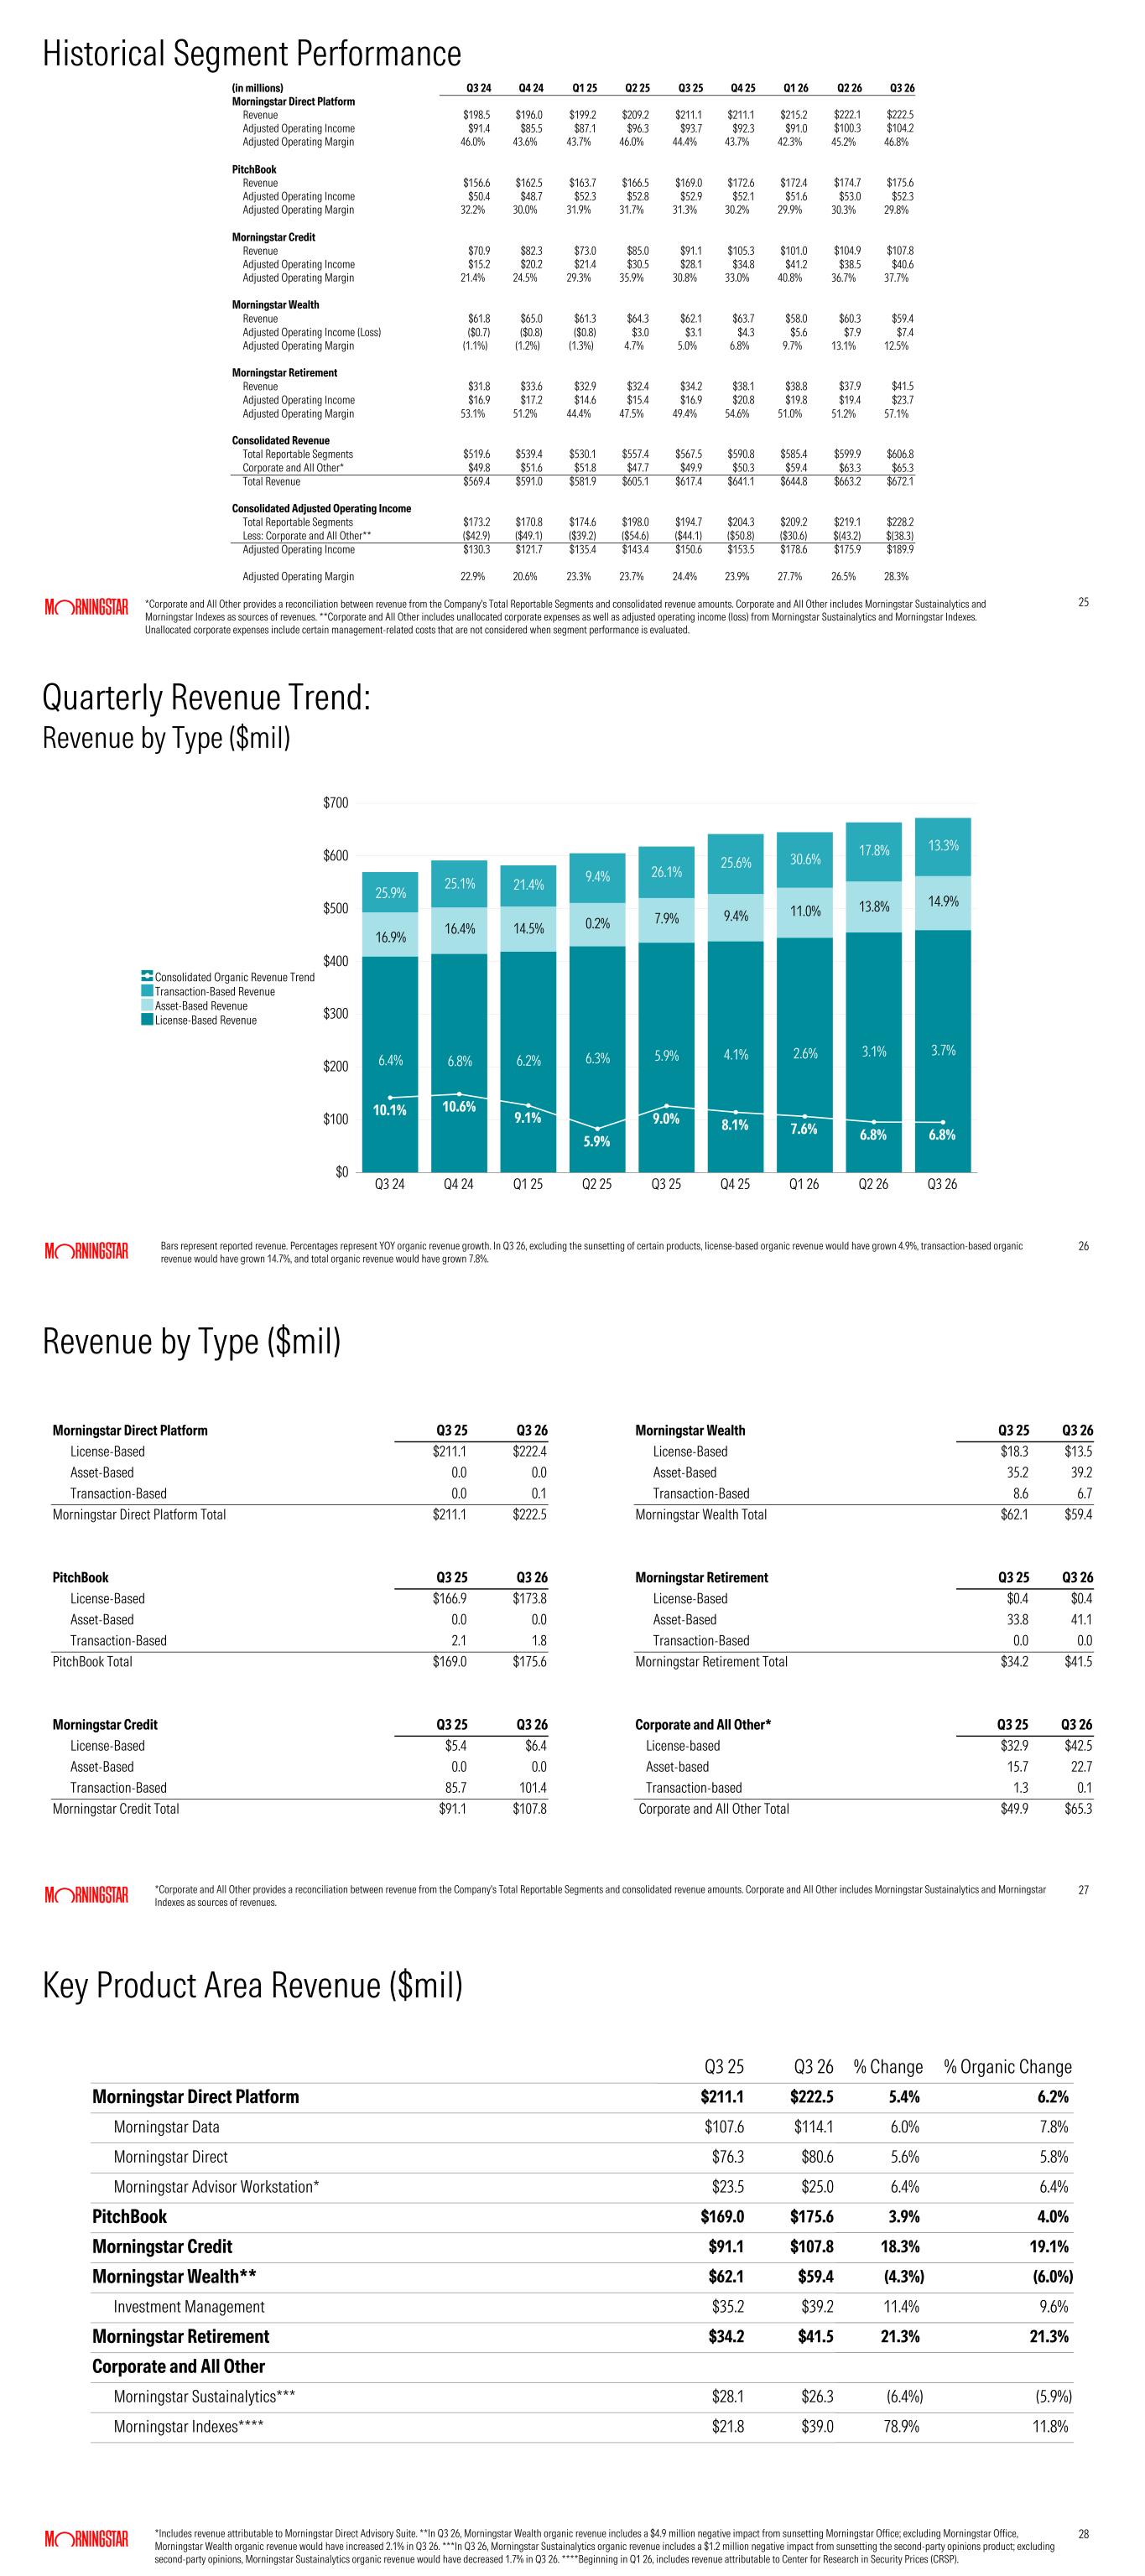
25 Historical Segment Performance *Corporate and All Other provides a reconciliation between revenue from the Company's Total Reportable Segments and consolidated revenue amounts. Corporate and All Other includes Morningstar Sustainalytics and Morningstar Indexes as sources of revenues. **Corporate and All Other includes unallocated corporate expenses as well as adjusted operating income (loss) from Morningstar Sustainalytics and Morningstar Indexes. Unallocated corporate expenses include certain management-related costs that are not considered when segment performance is evaluated. (in millions) Q3 24 Q4 24 Q1 25 Q2 25 Q3 25 Q4 25 Q1 26 Q2 26 Q3 26 Morningstar Direct Platform Revenue $198.5 $196.0 $199.2 $209.2 $211.1 $211.1 $215.2 $222.1 $222.5 Adjusted Operating Income $91.4 $85.5 $87.1 $96.3 $93.7 $92.3 $91.0 $100.3 $104.2 Adjusted Operating Margin 46.0% 43.6% 43.7% 46.0% 44.4% 43.7% 42.3% 45.2% 46.8% PitchBook Revenue $156.6 $162.5 $163.7 $166.5 $169.0 $172.6 $172.4 $174.7 $175.6 Adjusted Operating Income $50.4 $48.7 $52.3 $52.8 $52.9 $52.1 $51.6 $53.0 $52.3 Adjusted Operating Margin 32.2% 30.0% 31.9% 31.7% 31.3% 30.2% 29.9% 30.3% 29.8% Morningstar Credit Revenue $70.9 $82.3 $73.0 $85.0 $91.1 $105.3 $101.0 $104.9 $107.8 Adjusted Operating Income $15.2 $20.2 $21.4 $30.5 $28.1 $34.8 $41.2 $38.5 $40.6 Adjusted Operating Margin 21.4% 24.5% 29.3% 35.9% 30.8% 33.0% 40.8% 36.7% 37.7% Morningstar Wealth Revenue $61.8 $65.0 $61.3 $64.3 $62.1 $63.7 $58.0 $60.3 $59.4 Adjusted Operating Income (Loss) ($0.7) ($0.8) ($0.8) $3.0 $3.1 $4.3 $5.6 $7.9 $7.4 Adjusted Operating Margin (1.1%) (1.2%) (1.3%) 4.7% 5.0% 6.8% 9.7% 13.1% 12.5% Morningstar Retirement Revenue $31.8 $33.6 $32.9 $32.4 $34.2 $38.1 $38.8 $37.9 $41.5 Adjusted Operating Income $16.9 $17.2 $14.6 $15.4 $16.9 $20.8 $19.8 $19.4 $23.7 Adjusted Operating Margin 53.1% 51.2% 44.4% 47.5% 49.4% 54.6% 51.0% 51.2% 57.1% Consolidated Revenue Total Reportable Segments $519.6 $539.4 $530.1 $557.4 $567.5 $590.8 $585.4 $599.9 $606.8 Corporate and All Other* $49.8 $51.6 $51.8 $47.7 $49.9 $50.3 $59.4 $63.3 $65.3 Total Revenue $569.4 $591.0 $581.9 $605.1 $617.4 $641.1 $644.8 $663.2 $672.1 Consolidated Adjusted Operating Income Total Reportable Segments $173.2 $170.8 $174.6 $198.0 $194.7 $204.3 $209.2 $219.1 $228.2 Less: Corporate and All Other** ($42.9) ($49.1) ($39.2) ($54.6) ($44.1) ($50.8) ($30.6) $(43.2) $(38.3) Adjusted Operating Income $130.3 $121.7 $135.4 $143.4 $150.6 $153.5 $178.6 $175.9 $189.9 Adjusted Operating Margin 22.9% 20.6% 23.3% 23.7% 24.4% 23.9% 27.7% 26.5% 28.3% 26 Quarterly Revenue Trend: Revenue by Type ($mil) 10.1% 10.6% 9.1% 5.9% 9.0% 8.1% 7.6% 6.8% 6.8% Consolidated Organic Revenue Trend Transaction-Based Revenue Asset-Based Revenue License-Based Revenue Q3 24 Q4 24 Q1 25 Q2 25 Q3 25 Q4 25 Q1 26 Q2 26 Q3 26 $0 $100 $200 $300 $400 $500 $600 $700 25.9% 16.9% 6.4% 25.1% 16.4% 6.8% 21.4% 14.5% 6.2% 9.4% 0.2% 6.3% 26.1% 7.9% 5.9% 25.6% 9.4% 4.1% 30.6% 11.0% 2.6% 17.8% 13.8% 3.1% 13.3% 14.9% 3.7% Bars represent reported revenue. Percentages represent YOY organic revenue growth. In Q3 26, excluding the sunsetting of certain products, license-based organic revenue would have grown 4.9%, transaction-based organic revenue would have grown 14.7%, and total organic revenue would have grown 7.8%. 27 Revenue by Type ($mil) *Corporate and All Other provides a reconciliation between revenue from the Company's Total Reportable Segments and consolidated revenue amounts. Corporate and All Other includes Morningstar Sustainalytics and Morningstar Indexes as sources of revenues. Morningstar Direct Platform Q3 25 Q3 26 Morningstar Wealth Q3 25 Q3 26 License-Based $211.1 $222.4 License-Based $18.3 $13.5 Asset-Based 0.0 0.0 Asset-Based 35.2 39.2 Transaction-Based 0.0 0.1 Transaction-Based 8.6 6.7 Morningstar Direct Platform Total $211.1 $222.5 Morningstar Wealth Total $62.1 $59.4 PitchBook Q3 25 Q3 26 Morningstar Retirement Q3 25 Q3 26 License-Based $166.9 $173.8 License-Based $0.4 $0.4 Asset-Based 0.0 0.0 Asset-Based 33.8 41.1 Transaction-Based 2.1 1.8 Transaction-Based 0.0 0.0 PitchBook Total $169.0 $175.6 Morningstar Retirement Total $34.2 $41.5 Morningstar Credit Q3 25 Q3 26 Corporate and All Other* Q3 25 Q3 26 License-Based $5.4 $6.4 License-based $32.9 $42.5 Asset-Based 0.0 0.0 Asset-based 15.7 22.7 Transaction-Based 85.7 101.4 Transaction-based 1.3 0.1 Morningstar Credit Total $91.1 $107.8 Corporate and All Other Total $49.9 $65.3 28 Key Product Area Revenue ($mil) *Includes revenue attributable to Morningstar Direct Advisory Suite. **In Q3 26, Morningstar Wealth organic revenue includes a $4.9 million negative impact from sunsetting Morningstar Office; excluding Morningstar Office, Morningstar Wealth organic revenue would have increased 2.1% in Q3 26. ***In Q3 26, Morningstar Sustainalytics organic revenue includes a $1.2 million negative impact from sunsetting the second-party opinions product; excluding second-party opinions, Morningstar Sustainalytics organic revenue would have decreased 1.7% in Q3 26. ****Beginning in Q1 26, includes revenue attributable to Center for Research in Security Prices (CRSP). Q3 25 Q3 26 % Change % Organic Change Morningstar Direct Platform $211.1 $222.5 5.4% 6.2% Morningstar Data $107.6 $114.1 6.0% 7.8% Morningstar Direct $76.3 $80.6 5.6% 5.8% Morningstar Advisor Workstation* $23.5 $25.0 6.4% 6.4% PitchBook $169.0 $175.6 3.9% 4.0% Morningstar Credit $91.1 $107.8 18.3% 19.1% Morningstar Wealth** $62.1 $59.4 (4.3%) (6.0%) Investment Management $35.2 $39.2 11.4% 9.6% Morningstar Retirement $34.2 $41.5 21.3% 21.3% Corporate and All Other Morningstar Sustainalytics*** $28.1 $26.3 (6.4%) (5.9%) Morningstar Indexes**** $21.8 $39.0 78.9% 11.8%
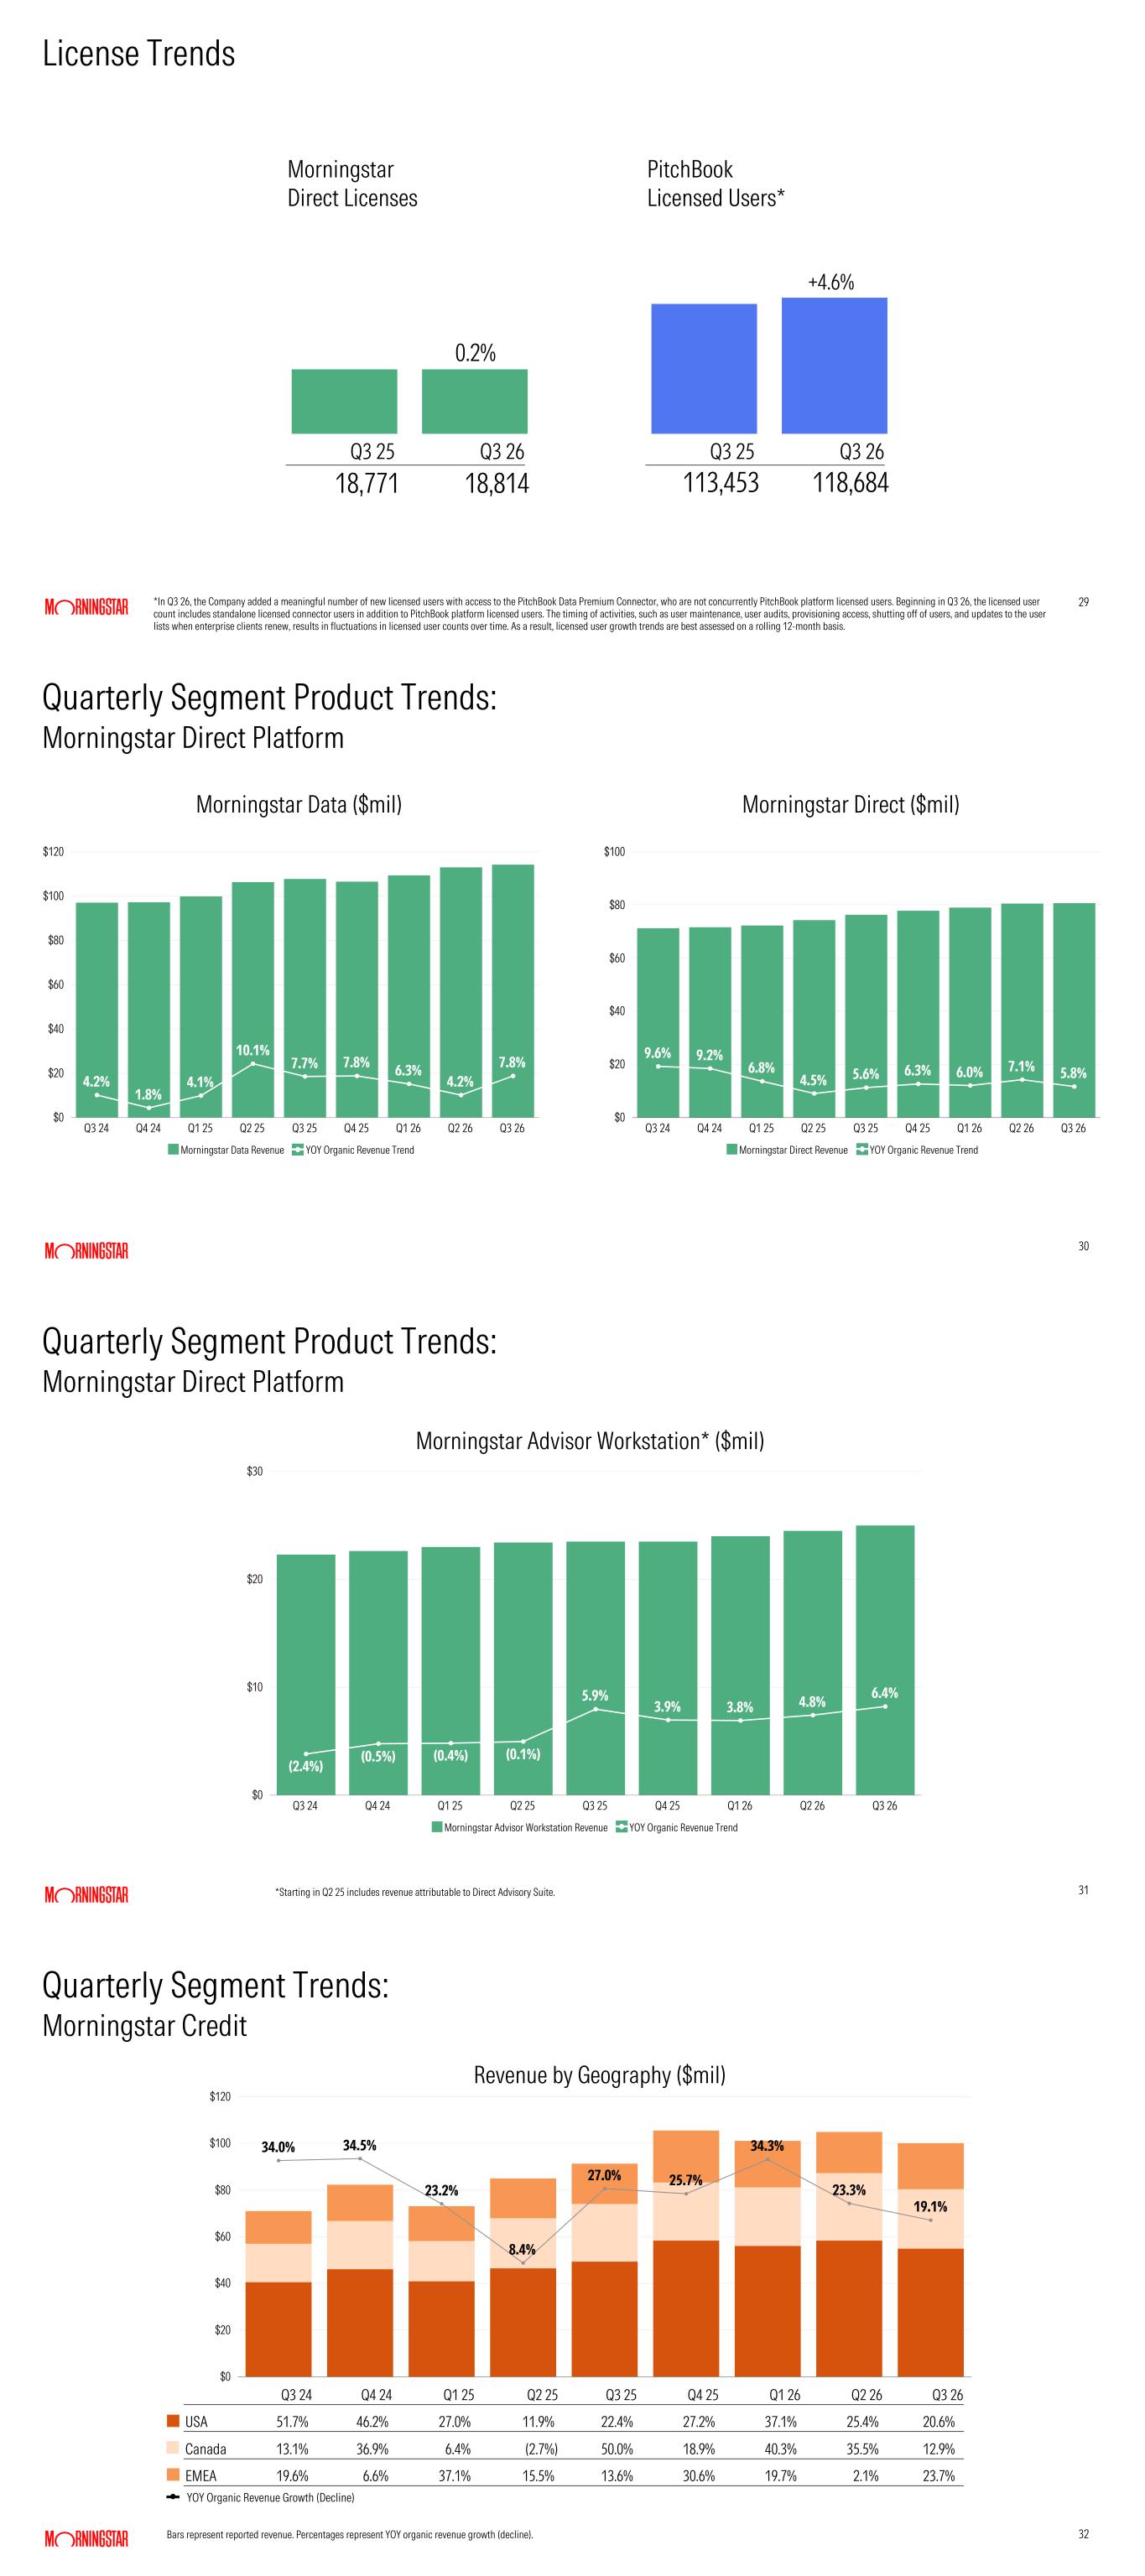
29 License Trends 29 *In Q3 26, the Company added a meaningful number of new licensed users with access to the PitchBook Data Premium Connector, who are not concurrently PitchBook platform licensed users. Beginning in Q3 26, the licensed user count includes standalone licensed connector users in addition to PitchBook platform licensed users. The timing of activities, such as user maintenance, user audits, provisioning access, shutting off of users, and updates to the user lists when enterprise clients renew, results in fluctuations in licensed user counts over time. As a result, licensed user growth trends are best assessed on a rolling 12-month basis. 0.2% 18,771 18,814 Morningstar Direct Licenses Q3 25 Q3 26 +4.6% 113,453 118,684 PitchBook Licensed Users* Q3 25 Q3 26 30 Quarterly Segment Product Trends: Morningstar Direct Platform 30 9.6% 9.2% 6.8% 4.5% 5.6% 6.3% 6.0% 7.1% 5.8% Morningstar Direct Revenue YOY Organic Revenue Trend Q3 24 Q4 24 Q1 25 Q2 25 Q3 25 Q4 25 Q1 26 Q2 26 Q3 26 $0 $20 $40 $60 $80 $100 4.2% 1.8% 4.1% 10.1% 7.7% 7.8% 6.3% 4.2% 7.8% Morningstar Data Revenue YOY Organic Revenue Trend Q3 24 Q4 24 Q1 25 Q2 25 Q3 25 Q4 25 Q1 26 Q2 26 Q3 26 $0 $20 $40 $60 $80 $100 $120 Morningstar Data ($mil) Morningstar Direct ($mil) 31 Quarterly Segment Product Trends: Morningstar Direct Platform 31 (2.4%) (0.5%) (0.4%) (0.1%) 5.9% 3.9% 3.8% 4.8% 6.4% Morningstar Advisor Workstation Revenue YOY Organic Revenue Trend Q3 24 Q4 24 Q1 25 Q2 25 Q3 25 Q4 25 Q1 26 Q2 26 Q3 26 $0 $10 $20 $30 *Starting in Q2 25 includes revenue attributable to Direct Advisory Suite. Morningstar Advisor Workstation* ($mil) 32 Quarterly Segment Trends: Morningstar Credit 32 Bars represent reported revenue. Percentages represent YOY organic revenue growth (decline). 34.0% 34.5% 23.2% 8.4% 27.0% 25.7% 34.3% 23.3% 19.1% $0 $20 $40 $60 $80 $100 $120 Revenue by Geography ($mil) Q3 24 Q4 24 Q1 25 Q2 25 Q3 25 Q4 25 Q1 26 Q2 26 Q3 26 USA 51.7% 46.2% 27.0% 11.9% 22.4% 27.2% 37.1% 25.4% 20.6% Canada 13.1% 36.9% 6.4% (2.7%) 50.0% 18.9% 40.3% 35.5% 12.9% EMEA 19.6% 6.6% 37.1% 15.5% 13.6% 30.6% 19.7% 2.1% 23.7% YOY Organic Revenue Growth (Decline)
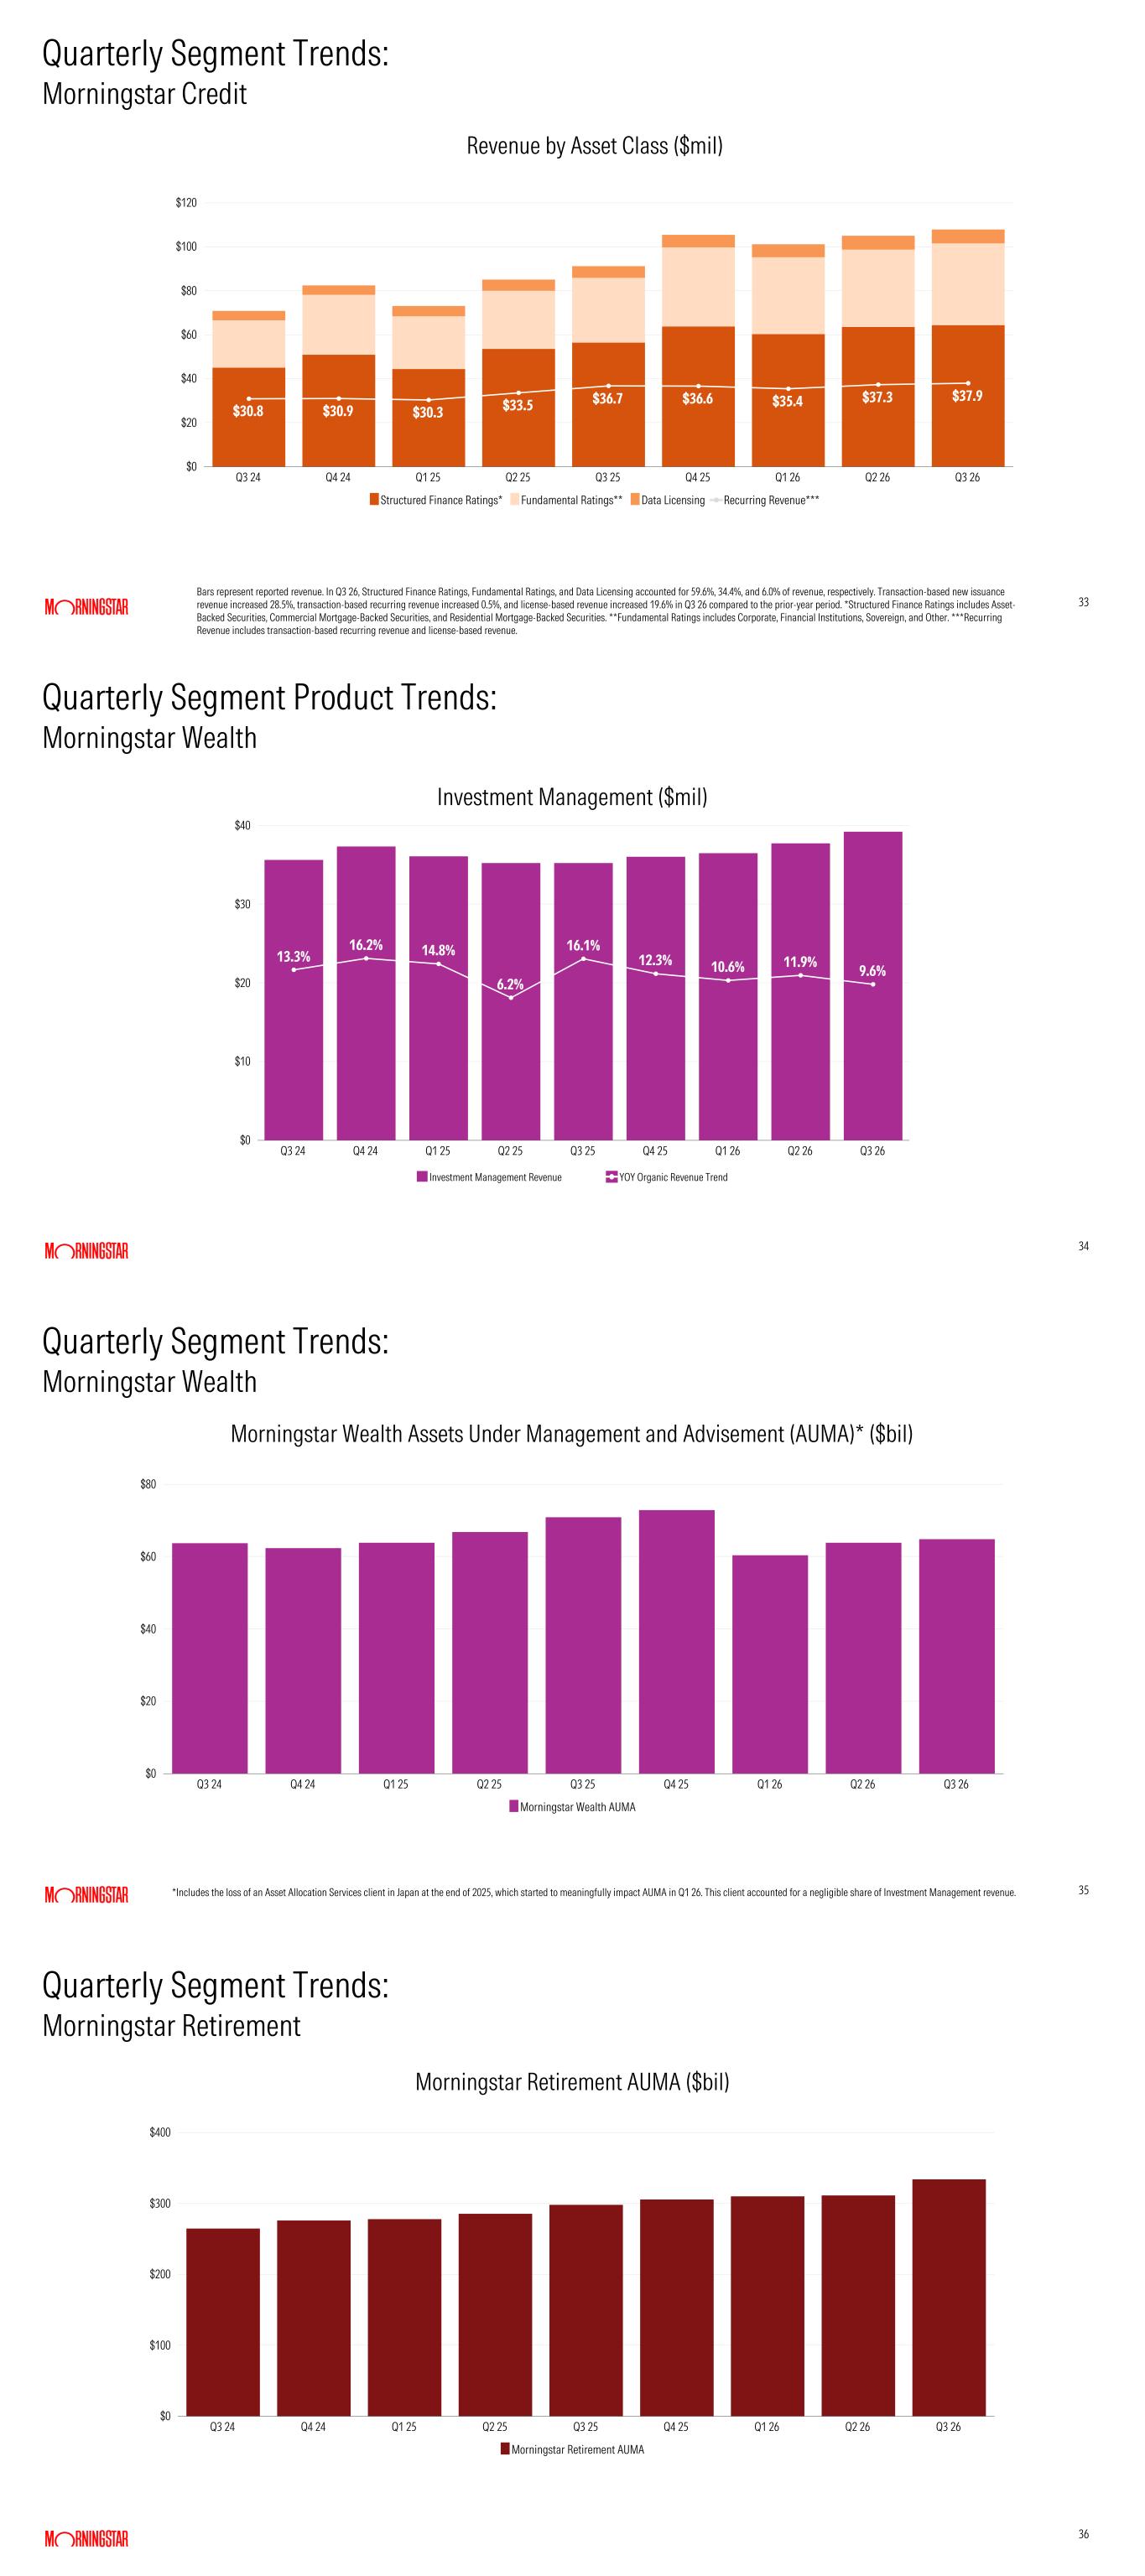
33 33 Bars represent reported revenue. In Q3 26, Structured Finance Ratings, Fundamental Ratings, and Data Licensing accounted for 59.6%, 34.4%, and 6.0% of revenue, respectively. Transaction-based new issuance revenue increased 28.5%, transaction-based recurring revenue increased 0.5%, and license-based revenue increased 19.6% in Q3 26 compared to the prior-year period. *Structured Finance Ratings includes Asset- Backed Securities, Commercial Mortgage-Backed Securities, and Residential Mortgage-Backed Securities. **Fundamental Ratings includes Corporate, Financial Institutions, Sovereign, and Other. ***Recurring Revenue includes transaction-based recurring revenue and license-based revenue. $30.8 $30.9 $30.3 $33.5 $36.7 $36.6 $35.4 $37.3 $37.9 Structured Finance Ratings* Fundamental Ratings** Data Licensing Recurring Revenue*** Q3 24 Q4 24 Q1 25 Q2 25 Q3 25 Q4 25 Q1 26 Q2 26 Q3 26 $0 $20 $40 $60 $80 $100 $120 Revenue by Asset Class ($mil) Quarterly Segment Trends: Morningstar Credit 34 Quarterly Segment Product Trends: Morningstar Wealth 34 13.3% 16.2% 14.8% 6.2% 16.1% 12.3% 10.6% 11.9% 9.6% Investment Management Revenue YOY Organic Revenue Trend Q3 24 Q4 24 Q1 25 Q2 25 Q3 25 Q4 25 Q1 26 Q2 26 Q3 26 $0 $10 $20 $30 $40 Investment Management ($mil) 35 35 Morningstar Wealth AUMA Q3 24 Q4 24 Q1 25 Q2 25 Q3 25 Q4 25 Q1 26 Q2 26 Q3 26 $0 $20 $40 $60 $80 Morningstar Wealth Assets Under Management and Advisement (AUMA)* ($bil) Quarterly Segment Trends: Morningstar Wealth *Includes the loss of an Asset Allocation Services client in Japan at the end of 2025, which started to meaningfully impact AUMA in Q1 26. This client accounted for a negligible share of Investment Management revenue. 36 36 Morningstar Retirement AUMA Q3 24 Q4 24 Q1 25 Q2 25 Q3 25 Q4 25 Q1 26 Q2 26 Q3 26 $0 $100 $200 $300 $400 Morningstar Retirement AUMA ($bil) Quarterly Segment Trends: Morningstar Retirement
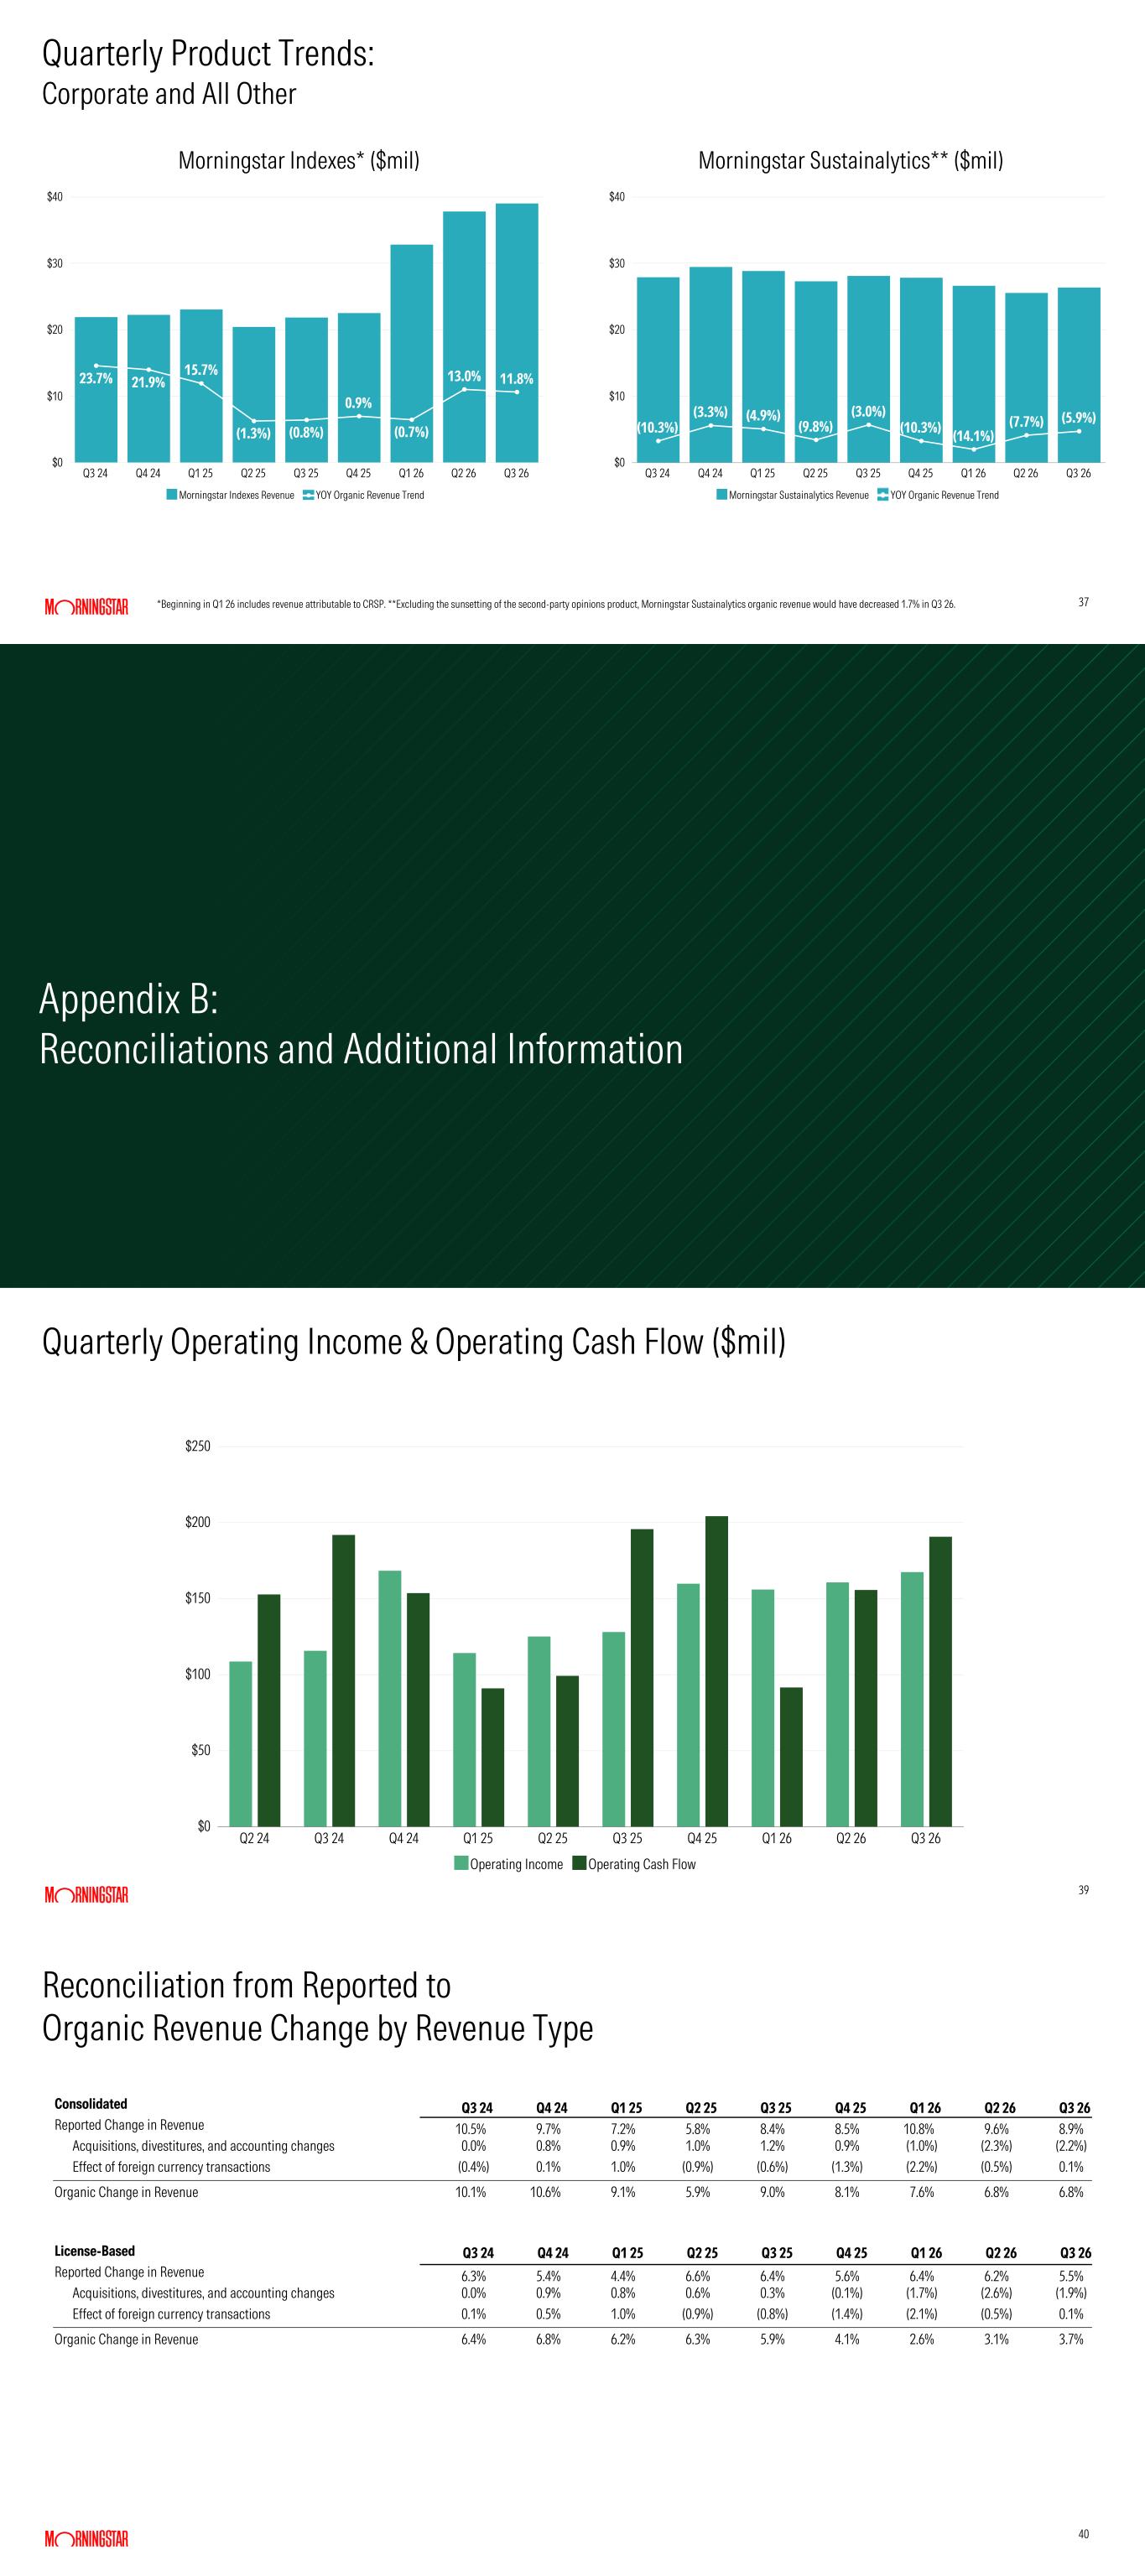
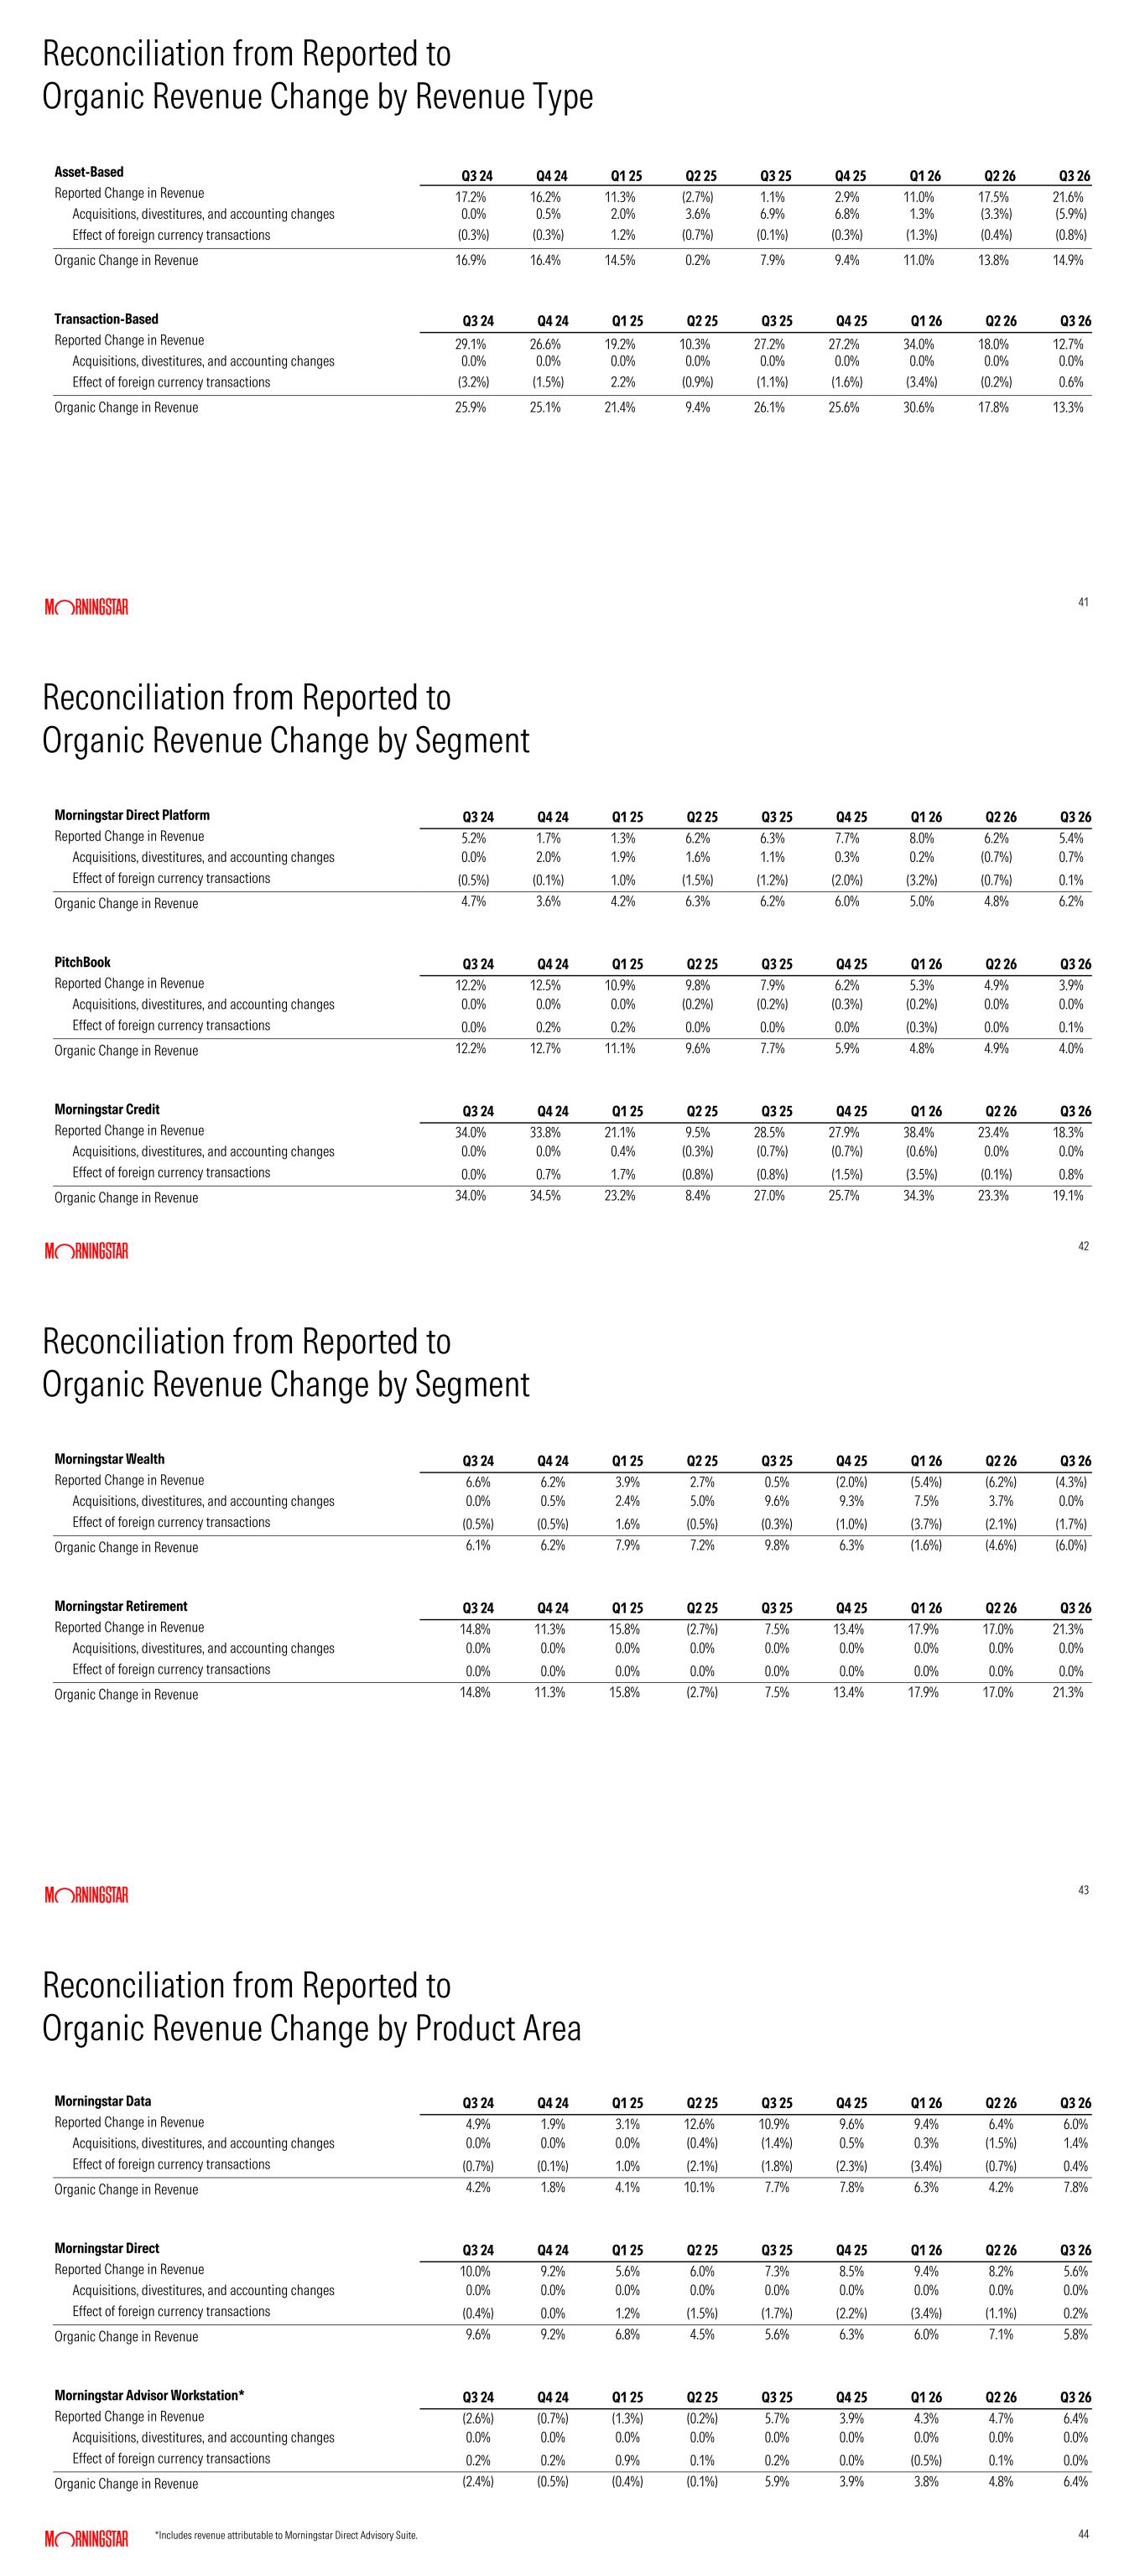
37 Quarterly Product Trends: Corporate and All Other 37 23.7% 21.9% 15.7% (1.3%) (0.8%) 0.9% (0.7%) 13.0% 11.8% Morningstar Indexes Revenue YOY Organic Revenue Trend Q3 24 Q4 24 Q1 25 Q2 25 Q3 25 Q4 25 Q1 26 Q2 26 Q3 26 $0 $10 $20 $30 $40 (10.3%) (3.3%) (4.9%) (9.8%) (3.0%) (10.3%) (14.1%) (7.7%) (5.9%) Morningstar Sustainalytics Revenue YOY Organic Revenue Trend Q3 24 Q4 24 Q1 25 Q2 25 Q3 25 Q4 25 Q1 26 Q2 26 Q3 26 $0 $10 $20 $30 $40 *Beginning in Q1 26 includes revenue attributable to CRSP. **Excluding the sunsetting of the second-party opinions product, Morningstar Sustainalytics organic revenue would have decreased 1.7% in Q3 26. Morningstar Indexes* ($mil) Morningstar Sustainalytics** ($mil) Appendix B: Reconciliations and Additional Information 39 Quarterly Operating Income & Operating Cash Flow ($mil) 39 Operating Income Operating Cash Flow Q2 24 Q3 24 Q4 24 Q1 25 Q2 25 Q3 25 Q4 25 Q1 26 Q2 26 Q3 26 $0 $50 $100 $150 $200 $250 40 Reconciliation from Reported to Organic Revenue Change by Revenue Type Consolidated Q3 24 Q4 24 Q1 25 Q2 25 Q3 25 Q4 25 Q1 26 Q2 26 Q3 26 Reported Change in Revenue 10.5% 9.7% 7.2% 5.8% 8.4% 8.5% 10.8% 9.6% 8.9% Acquisitions, divestitures, and accounting changes 0.0% 0.8% 0.9% 1.0% 1.2% 0.9% (1.0%) (2.3%) (2.2%) Effect of foreign currency transactions (0.4%) 0.1% 1.0% (0.9%) (0.6%) (1.3%) (2.2%) (0.5%) 0.1% Organic Change in Revenue 10.1% 10.6% 9.1% 5.9% 9.0% 8.1% 7.6% 6.8% 6.8% License-Based Q3 24 Q4 24 Q1 25 Q2 25 Q3 25 Q4 25 Q1 26 Q2 26 Q3 26 Reported Change in Revenue 6.3% 5.4% 4.4% 6.6% 6.4% 5.6% 6.4% 6.2% 5.5% Acquisitions, divestitures, and accounting changes 0.0% 0.9% 0.8% 0.6% 0.3% (0.1%) (1.7%) (2.6%) (1.9%) Effect of foreign currency transactions 0.1% 0.5% 1.0% (0.9%) (0.8%) (1.4%) (2.1%) (0.5%) 0.1% Organic Change in Revenue 6.4% 6.8% 6.2% 6.3% 5.9% 4.1% 2.6% 3.1% 3.7%
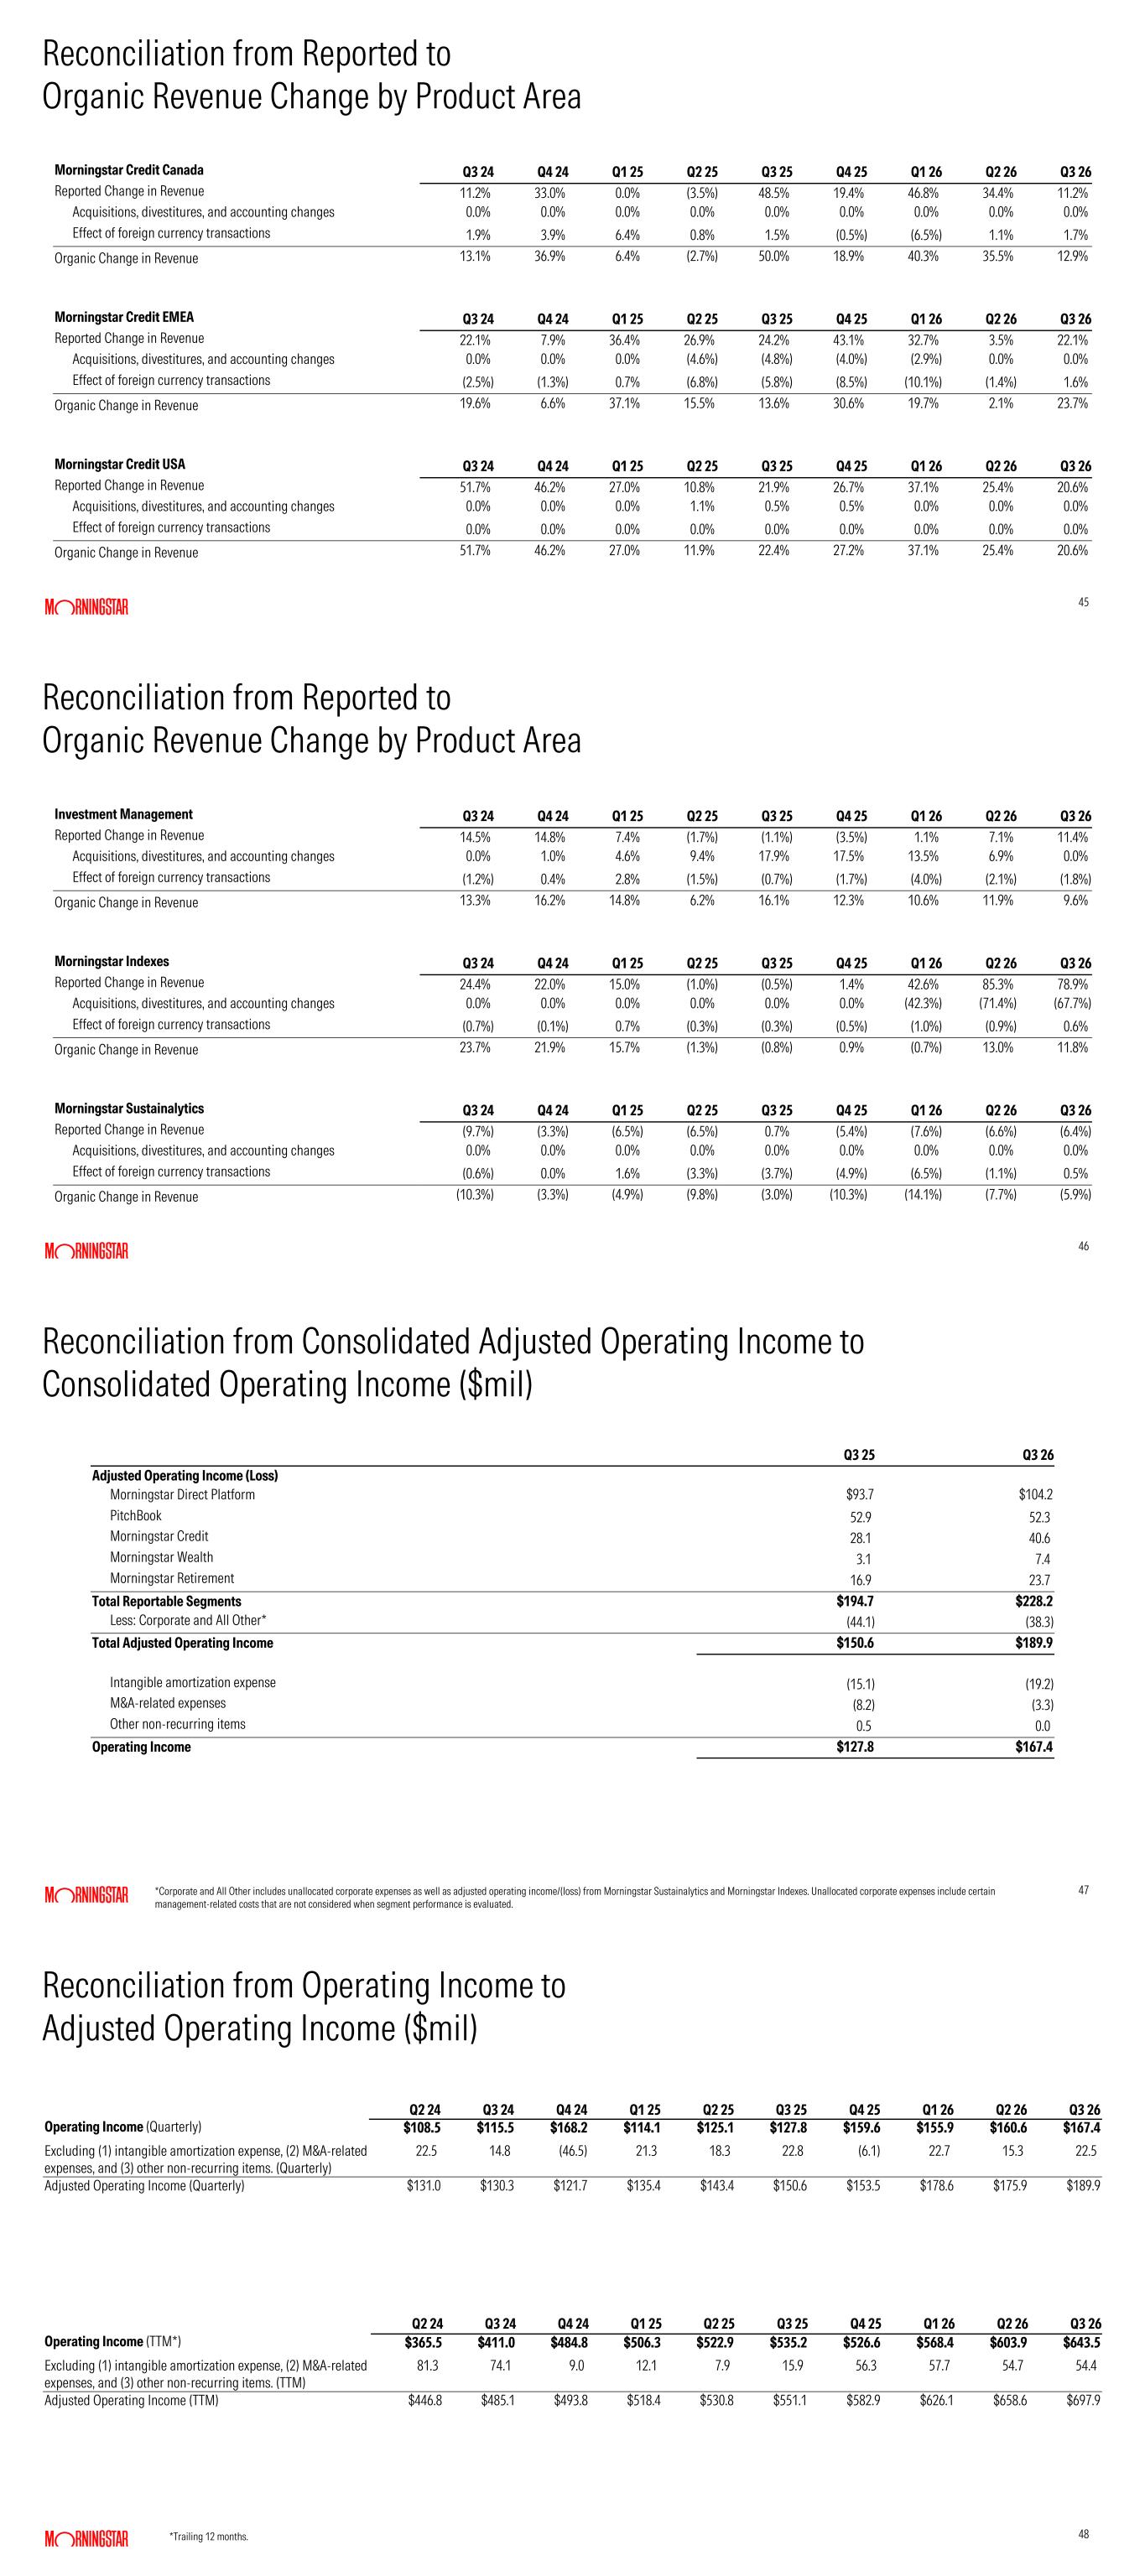
41 Reconciliation from Reported to Organic Revenue Change by Revenue Type Asset-Based Q3 24 Q4 24 Q1 25 Q2 25 Q3 25 Q4 25 Q1 26 Q2 26 Q3 26 Reported Change in Revenue 17.2% 16.2% 11.3% (2.7%) 1.1% 2.9% 11.0% 17.5% 21.6% Acquisitions, divestitures, and accounting changes 0.0% 0.5% 2.0% 3.6% 6.9% 6.8% 1.3% (3.3%) (5.9%) Effect of foreign currency transactions (0.3%) (0.3%) 1.2% (0.7%) (0.1%) (0.3%) (1.3%) (0.4%) (0.8%) Organic Change in Revenue 16.9% 16.4% 14.5% 0.2% 7.9% 9.4% 11.0% 13.8% 14.9% Transaction-Based Q3 24 Q4 24 Q1 25 Q2 25 Q3 25 Q4 25 Q1 26 Q2 26 Q3 26 Reported Change in Revenue 29.1% 26.6% 19.2% 10.3% 27.2% 27.2% 34.0% 18.0% 12.7% Acquisitions, divestitures, and accounting changes 0.0% 0.0% 0.0% 0.0% 0.0% 0.0% 0.0% 0.0% 0.0% Effect of foreign currency transactions (3.2%) (1.5%) 2.2% (0.9%) (1.1%) (1.6%) (3.4%) (0.2%) 0.6% Organic Change in Revenue 25.9% 25.1% 21.4% 9.4% 26.1% 25.6% 30.6% 17.8% 13.3% 42 Reconciliation from Reported to Organic Revenue Change by Segment Morningstar Direct Platform Q3 24 Q4 24 Q1 25 Q2 25 Q3 25 Q4 25 Q1 26 Q2 26 Q3 26 Reported Change in Revenue 5.2% 1.7% 1.3% 6.2% 6.3% 7.7% 8.0% 6.2% 5.4% Acquisitions, divestitures, and accounting changes 0.0% 2.0% 1.9% 1.6% 1.1% 0.3% 0.2% (0.7%) 0.7% Effect of foreign currency transactions (0.5%) (0.1%) 1.0% (1.5%) (1.2%) (2.0%) (3.2%) (0.7%) 0.1% Organic Change in Revenue 4.7% 3.6% 4.2% 6.3% 6.2% 6.0% 5.0% 4.8% 6.2% PitchBook Q3 24 Q4 24 Q1 25 Q2 25 Q3 25 Q4 25 Q1 26 Q2 26 Q3 26 Reported Change in Revenue 12.2% 12.5% 10.9% 9.8% 7.9% 6.2% 5.3% 4.9% 3.9% Acquisitions, divestitures, and accounting changes 0.0% 0.0% 0.0% (0.2%) (0.2%) (0.3%) (0.2%) 0.0% 0.0% Effect of foreign currency transactions 0.0% 0.2% 0.2% 0.0% 0.0% 0.0% (0.3%) 0.0% 0.1% Organic Change in Revenue 12.2% 12.7% 11.1% 9.6% 7.7% 5.9% 4.8% 4.9% 4.0% Morningstar Credit Q3 24 Q4 24 Q1 25 Q2 25 Q3 25 Q4 25 Q1 26 Q2 26 Q3 26 Reported Change in Revenue 34.0% 33.8% 21.1% 9.5% 28.5% 27.9% 38.4% 23.4% 18.3% Acquisitions, divestitures, and accounting changes 0.0% 0.0% 0.4% (0.3%) (0.7%) (0.7%) (0.6%) 0.0% 0.0% Effect of foreign currency transactions 0.0% 0.7% 1.7% (0.8%) (0.8%) (1.5%) (3.5%) (0.1%) 0.8% Organic Change in Revenue 34.0% 34.5% 23.2% 8.4% 27.0% 25.7% 34.3% 23.3% 19.1% 43 Reconciliation from Reported to Organic Revenue Change by Segment Morningstar Wealth Q3 24 Q4 24 Q1 25 Q2 25 Q3 25 Q4 25 Q1 26 Q2 26 Q3 26 Reported Change in Revenue 6.6% 6.2% 3.9% 2.7% 0.5% (2.0%) (5.4%) (6.2%) (4.3%) Acquisitions, divestitures, and accounting changes 0.0% 0.5% 2.4% 5.0% 9.6% 9.3% 7.5% 3.7% 0.0% Effect of foreign currency transactions (0.5%) (0.5%) 1.6% (0.5%) (0.3%) (1.0%) (3.7%) (2.1%) (1.7%) Organic Change in Revenue 6.1% 6.2% 7.9% 7.2% 9.8% 6.3% (1.6%) (4.6%) (6.0%) Morningstar Retirement Q3 24 Q4 24 Q1 25 Q2 25 Q3 25 Q4 25 Q1 26 Q2 26 Q3 26 Reported Change in Revenue 14.8% 11.3% 15.8% (2.7%) 7.5% 13.4% 17.9% 17.0% 21.3% Acquisitions, divestitures, and accounting changes 0.0% 0.0% 0.0% 0.0% 0.0% 0.0% 0.0% 0.0% 0.0% Effect of foreign currency transactions 0.0% 0.0% 0.0% 0.0% 0.0% 0.0% 0.0% 0.0% 0.0% Organic Change in Revenue 14.8% 11.3% 15.8% (2.7%) 7.5% 13.4% 17.9% 17.0% 21.3% 44 Reconciliation from Reported to Organic Revenue Change by Product Area Morningstar Data Q3 24 Q4 24 Q1 25 Q2 25 Q3 25 Q4 25 Q1 26 Q2 26 Q3 26 Reported Change in Revenue 4.9% 1.9% 3.1% 12.6% 10.9% 9.6% 9.4% 6.4% 6.0% Acquisitions, divestitures, and accounting changes 0.0% 0.0% 0.0% (0.4%) (1.4%) 0.5% 0.3% (1.5%) 1.4% Effect of foreign currency transactions (0.7%) (0.1%) 1.0% (2.1%) (1.8%) (2.3%) (3.4%) (0.7%) 0.4% Organic Change in Revenue 4.2% 1.8% 4.1% 10.1% 7.7% 7.8% 6.3% 4.2% 7.8% Morningstar Direct Q3 24 Q4 24 Q1 25 Q2 25 Q3 25 Q4 25 Q1 26 Q2 26 Q3 26 Reported Change in Revenue 10.0% 9.2% 5.6% 6.0% 7.3% 8.5% 9.4% 8.2% 5.6% Acquisitions, divestitures, and accounting changes 0.0% 0.0% 0.0% 0.0% 0.0% 0.0% 0.0% 0.0% 0.0% Effect of foreign currency transactions (0.4%) 0.0% 1.2% (1.5%) (1.7%) (2.2%) (3.4%) (1.1%) 0.2% Organic Change in Revenue 9.6% 9.2% 6.8% 4.5% 5.6% 6.3% 6.0% 7.1% 5.8% Morningstar Advisor Workstation* Q3 24 Q4 24 Q1 25 Q2 25 Q3 25 Q4 25 Q1 26 Q2 26 Q3 26 Reported Change in Revenue (2.6%) (0.7%) (1.3%) (0.2%) 5.7% 3.9% 4.3% 4.7% 6.4% Acquisitions, divestitures, and accounting changes 0.0% 0.0% 0.0% 0.0% 0.0% 0.0% 0.0% 0.0% 0.0% Effect of foreign currency transactions 0.2% 0.2% 0.9% 0.1% 0.2% 0.0% (0.5%) 0.1% 0.0% Organic Change in Revenue (2.4%) (0.5%) (0.4%) (0.1%) 5.9% 3.9% 3.8% 4.8% 6.4% *Includes revenue attributable to Morningstar Direct Advisory Suite.
45 Reconciliation from Reported to Organic Revenue Change by Product Area Morningstar Credit Canada Q3 24 Q4 24 Q1 25 Q2 25 Q3 25 Q4 25 Q1 26 Q2 26 Q3 26 Reported Change in Revenue 11.2% 33.0% 0.0% (3.5%) 48.5% 19.4% 46.8% 34.4% 11.2% Acquisitions, divestitures, and accounting changes 0.0% 0.0% 0.0% 0.0% 0.0% 0.0% 0.0% 0.0% 0.0% Effect of foreign currency transactions 1.9% 3.9% 6.4% 0.8% 1.5% (0.5%) (6.5%) 1.1% 1.7% Organic Change in Revenue 13.1% 36.9% 6.4% (2.7%) 50.0% 18.9% 40.3% 35.5% 12.9% Morningstar Credit EMEA Q3 24 Q4 24 Q1 25 Q2 25 Q3 25 Q4 25 Q1 26 Q2 26 Q3 26 Reported Change in Revenue 22.1% 7.9% 36.4% 26.9% 24.2% 43.1% 32.7% 3.5% 22.1% Acquisitions, divestitures, and accounting changes 0.0% 0.0% 0.0% (4.6%) (4.8%) (4.0%) (2.9%) 0.0% 0.0% Effect of foreign currency transactions (2.5%) (1.3%) 0.7% (6.8%) (5.8%) (8.5%) (10.1%) (1.4%) 1.6% Organic Change in Revenue 19.6% 6.6% 37.1% 15.5% 13.6% 30.6% 19.7% 2.1% 23.7% Morningstar Credit USA Q3 24 Q4 24 Q1 25 Q2 25 Q3 25 Q4 25 Q1 26 Q2 26 Q3 26 Reported Change in Revenue 51.7% 46.2% 27.0% 10.8% 21.9% 26.7% 37.1% 25.4% 20.6% Acquisitions, divestitures, and accounting changes 0.0% 0.0% 0.0% 1.1% 0.5% 0.5% 0.0% 0.0% 0.0% Effect of foreign currency transactions 0.0% 0.0% 0.0% 0.0% 0.0% 0.0% 0.0% 0.0% 0.0% Organic Change in Revenue 51.7% 46.2% 27.0% 11.9% 22.4% 27.2% 37.1% 25.4% 20.6% 46 Reconciliation from Reported to Organic Revenue Change by Product Area Investment Management Q3 24 Q4 24 Q1 25 Q2 25 Q3 25 Q4 25 Q1 26 Q2 26 Q3 26 Reported Change in Revenue 14.5% 14.8% 7.4% (1.7%) (1.1%) (3.5%) 1.1% 7.1% 11.4% Acquisitions, divestitures, and accounting changes 0.0% 1.0% 4.6% 9.4% 17.9% 17.5% 13.5% 6.9% 0.0% Effect of foreign currency transactions (1.2%) 0.4% 2.8% (1.5%) (0.7%) (1.7%) (4.0%) (2.1%) (1.8%) Organic Change in Revenue 13.3% 16.2% 14.8% 6.2% 16.1% 12.3% 10.6% 11.9% 9.6% Morningstar Indexes Q3 24 Q4 24 Q1 25 Q2 25 Q3 25 Q4 25 Q1 26 Q2 26 Q3 26 Reported Change in Revenue 24.4% 22.0% 15.0% (1.0%) (0.5%) 1.4% 42.6% 85.3% 78.9% Acquisitions, divestitures, and accounting changes 0.0% 0.0% 0.0% 0.0% 0.0% 0.0% (42.3%) (71.4%) (67.7%) Effect of foreign currency transactions (0.7%) (0.1%) 0.7% (0.3%) (0.3%) (0.5%) (1.0%) (0.9%) 0.6% Organic Change in Revenue 23.7% 21.9% 15.7% (1.3%) (0.8%) 0.9% (0.7%) 13.0% 11.8% Morningstar Sustainalytics Q3 24 Q4 24 Q1 25 Q2 25 Q3 25 Q4 25 Q1 26 Q2 26 Q3 26 Reported Change in Revenue (9.7%) (3.3%) (6.5%) (6.5%) 0.7% (5.4%) (7.6%) (6.6%) (6.4%) Acquisitions, divestitures, and accounting changes 0.0% 0.0% 0.0% 0.0% 0.0% 0.0% 0.0% 0.0% 0.0% Effect of foreign currency transactions (0.6%) 0.0% 1.6% (3.3%) (3.7%) (4.9%) (6.5%) (1.1%) 0.5% Organic Change in Revenue (10.3%) (3.3%) (4.9%) (9.8%) (3.0%) (10.3%) (14.1%) (7.7%) (5.9%) 47 Reconciliation from Consolidated Adjusted Operating Income to Consolidated Operating Income ($mil) *Corporate and All Other includes unallocated corporate expenses as well as adjusted operating income/(loss) from Morningstar Sustainalytics and Morningstar Indexes. Unallocated corporate expenses include certain management-related costs that are not considered when segment performance is evaluated. Q3 25 Q3 26 Adjusted Operating Income (Loss) Morningstar Direct Platform $93.7 $104.2 PitchBook 52.9 52.3 Morningstar Credit 28.1 40.6 Morningstar Wealth 3.1 7.4 Morningstar Retirement 16.9 23.7 Total Reportable Segments $194.7 $228.2 Less: Corporate and All Other* (44.1) (38.3) Total Adjusted Operating Income $150.6 $189.9 Intangible amortization expense (15.1) (19.2) M&A-related expenses (8.2) (3.3) Other non-recurring items 0.5 0.0 Operating Income $127.8 $167.4 48 Reconciliation from Operating Income to Adjusted Operating Income ($mil) Q2 24 Q3 24 Q4 24 Q1 25 Q2 25 Q3 25 Q4 25 Q1 26 Q2 26 Q3 26 Operating Income (Quarterly) $108.5 $115.5 $168.2 $114.1 $125.1 $127.8 $159.6 $155.9 $160.6 $167.4 Excluding (1) intangible amortization expense, (2) M&A-related expenses, and (3) other non-recurring items. (Quarterly) 22.5 14.8 (46.5) 21.3 18.3 22.8 (6.1) 22.7 15.3 22.5 Adjusted Operating Income (Quarterly) $131.0 $130.3 $121.7 $135.4 $143.4 $150.6 $153.5 $178.6 $175.9 $189.9 Q2 24 Q3 24 Q4 24 Q1 25 Q2 25 Q3 25 Q4 25 Q1 26 Q2 26 Q3 26 Operating Income (TTM*) $365.5 $411.0 $484.8 $506.3 $522.9 $535.2 $526.6 $568.4 $603.9 $643.5 Excluding (1) intangible amortization expense, (2) M&A-related expenses, and (3) other non-recurring items. (TTM) 81.3 74.1 9.0 12.1 7.9 15.9 56.3 57.7 54.7 54.4 Adjusted Operating Income (TTM) $446.8 $485.1 $493.8 $518.4 $530.8 $551.1 $582.9 $626.1 $658.6 $697.9 *Trailing 12 months.
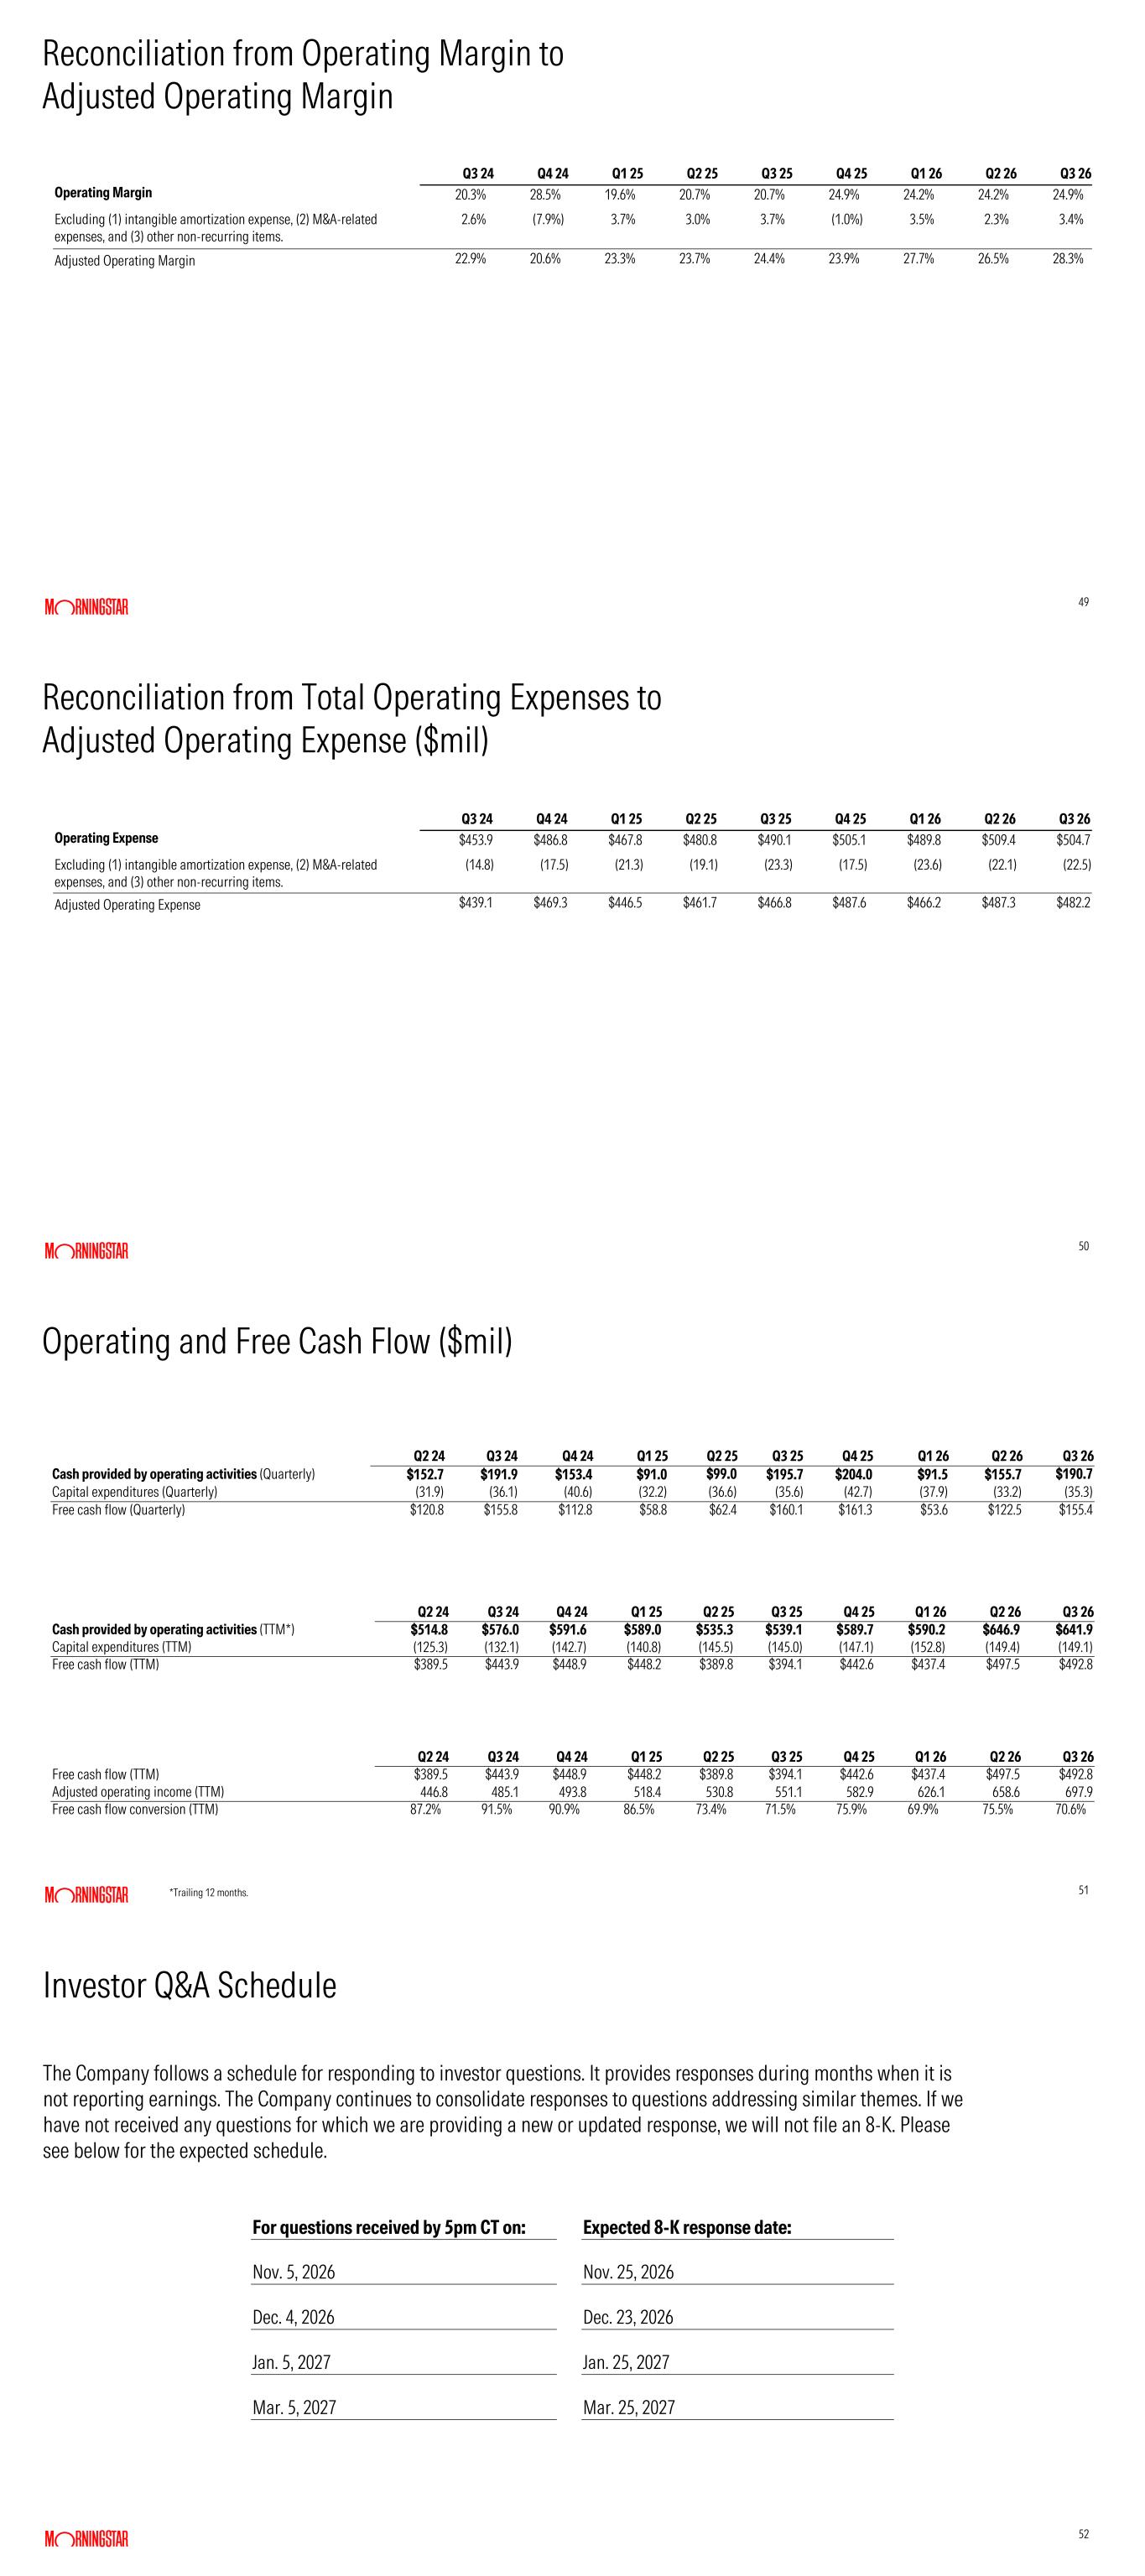
49 Reconciliation from Operating Margin to Adjusted Operating Margin Q3 24 Q4 24 Q1 25 Q2 25 Q3 25 Q4 25 Q1 26 Q2 26 Q3 26 Operating Margin 20.3% 28.5% 19.6% 20.7% 20.7% 24.9% 24.2% 24.2% 24.9% Excluding (1) intangible amortization expense, (2) M&A-related expenses, and (3) other non-recurring items. 2.6% (7.9%) 3.7% 3.0% 3.7% (1.0%) 3.5% 2.3% 3.4% Adjusted Operating Margin 22.9% 20.6% 23.3% 23.7% 24.4% 23.9% 27.7% 26.5% 28.3% 50 Reconciliation from Total Operating Expenses to Adjusted Operating Expense ($mil) Q3 24 Q4 24 Q1 25 Q2 25 Q3 25 Q4 25 Q1 26 Q2 26 Q3 26 Operating Expense $453.9 $486.8 $467.8 $480.8 $490.1 $505.1 $489.8 $509.4 $504.7 Excluding (1) intangible amortization expense, (2) M&A-related expenses, and (3) other non-recurring items. (14.8) (17.5) (21.3) (19.1) (23.3) (17.5) (23.6) (22.1) (22.5) Adjusted Operating Expense $439.1 $469.3 $446.5 $461.7 $466.8 $487.6 $466.2 $487.3 $482.2 51 Operating and Free Cash Flow ($mil) Q2 24 Q3 24 Q4 24 Q1 25 Q2 25 Q3 25 Q4 25 Q1 26 Q2 26 Q3 26 Cash provided by operating activities (Quarterly) $152.7 $191.9 $153.4 $91.0 $99.0 $195.7 $204.0 $91.5 $155.7 $190.7 Capital expenditures (Quarterly) (31.9) (36.1) (40.6) (32.2) (36.6) (35.6) (42.7) (37.9) (33.2) (35.3) Free cash flow (Quarterly) $120.8 $155.8 $112.8 $58.8 $62.4 $160.1 $161.3 $53.6 $122.5 $155.4 Q2 24 Q3 24 Q4 24 Q1 25 Q2 25 Q3 25 Q4 25 Q1 26 Q2 26 Q3 26 Cash provided by operating activities (TTM*) $514.8 $576.0 $591.6 $589.0 $535.3 $539.1 $589.7 $590.2 $646.9 $641.9 Capital expenditures (TTM) (125.3) (132.1) (142.7) (140.8) (145.5) (145.0) (147.1) (152.8) (149.4) (149.1) Free cash flow (TTM) $389.5 $443.9 $448.9 $448.2 $389.8 $394.1 $442.6 $437.4 $497.5 $492.8 *Trailing 12 months. Q2 24 Q3 24 Q4 24 Q1 25 Q2 25 Q3 25 Q4 25 Q1 26 Q2 26 Q3 26 Free cash flow (TTM) $389.5 $443.9 $448.9 $448.2 $389.8 $394.1 $442.6 $437.4 $497.5 $492.8 Adjusted operating income (TTM) 446.8 485.1 493.8 518.4 530.8 551.1 582.9 626.1 658.6 697.9 Free cash flow conversion (TTM) 87.2% 91.5% 90.9% 86.5% 73.4% 71.5% 75.9% 69.9% 75.5% 70.6% 52 Investor Q&A Schedule For questions received by 5pm CT on: Expected 8-K response date: Nov. 5, 2026 Nov. 25, 2026 Dec. 4, 2026 Dec. 23, 2026 Jan. 5, 2027 Jan. 25, 2027 Mar. 5, 2027 Mar. 25, 2027 The Company follows a schedule for responding to investor questions. It provides responses during months when it is not reporting earnings. The Company continues to consolidate responses to questions addressing similar themes. If we have not received any questions for which we are providing a new or updated response, we will not file an 8-K. Please see below for the expected schedule.