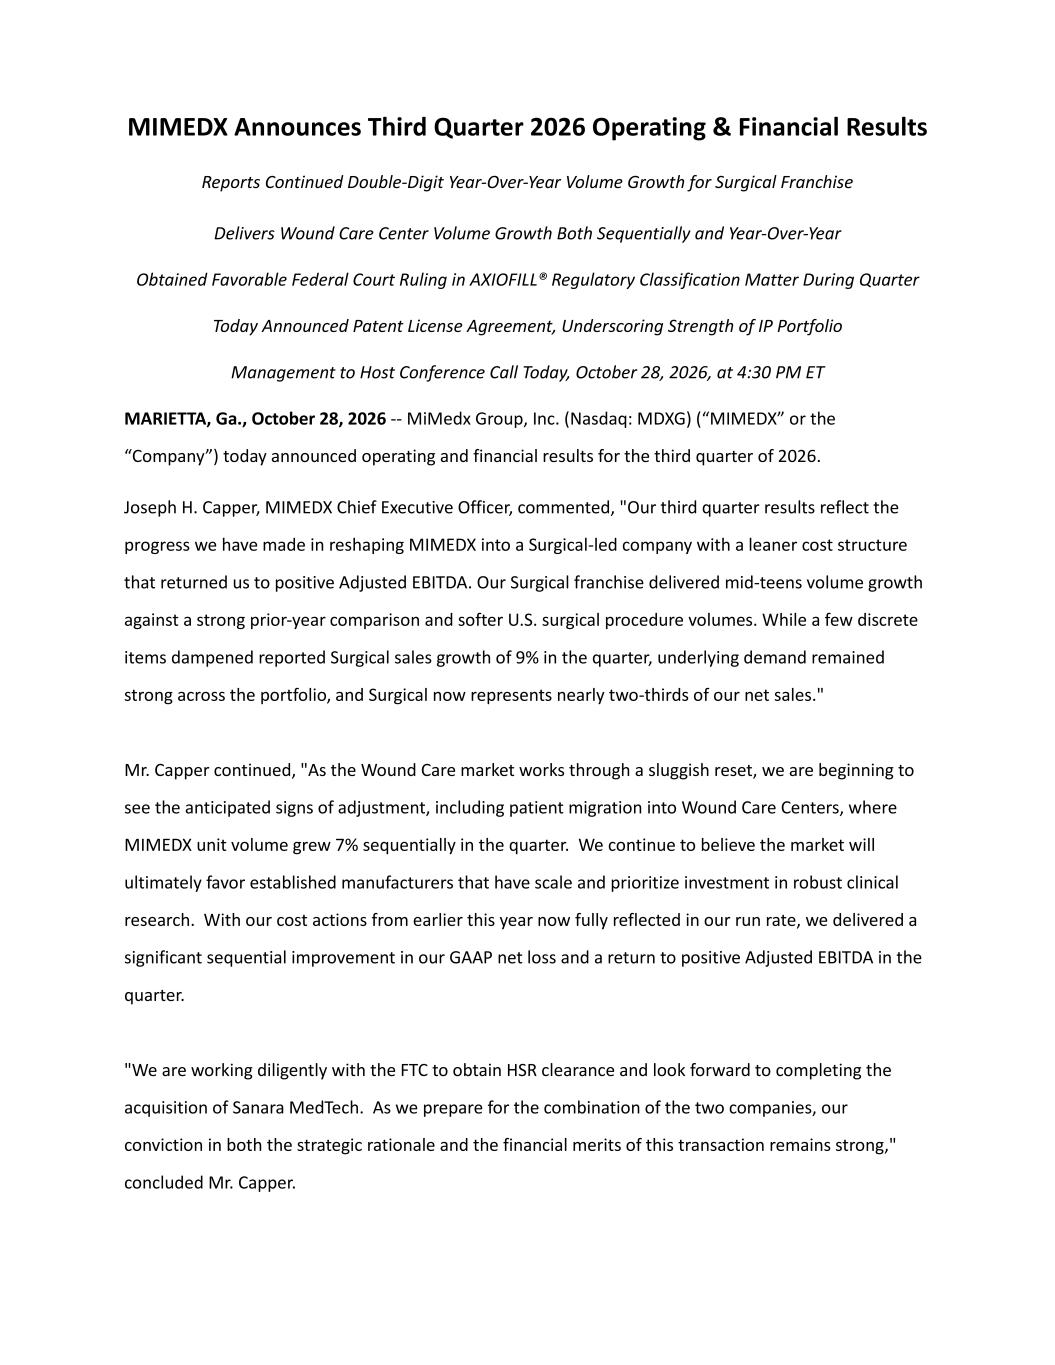
MIMEDX Announces Third Quarter 2026 Operating & Financial Results Reports Continued Double-Digit Year-Over-Year Volume Growth for Surgical Franchise Delivers Wound Care Center Volume Growth Both Sequentially and Year-Over-Year Obtained Favorable Federal Court Ruling in AXIOFILL® Regulatory Classification Matter During Quarter Today Announced Patent License Agreement, Underscoring Strength of IP Portfolio Management to Host Conference Call Today, October 28, 2026, at 4:30 PM ET MARIETTA, Ga., October 28, 2026 -- MiMedx Group, Inc. (Nasdaq: MDXG) (“MIMEDX” or the “Company”) today announced operating and financial results for the third quarter of 2026. Joseph H. Capper, MIMEDX Chief Executive Officer, commented, "Our third quarter results reflect the progress we have made in reshaping MIMEDX into a Surgical-led company with a leaner cost structure that returned us to positive Adjusted EBITDA. Our Surgical franchise delivered mid-teens volume growth against a strong prior-year comparison and softer U.S. surgical procedure volumes. While a few discrete items dampened reported Surgical sales growth of 9% in the quarter, underlying demand remained strong across the portfolio, and Surgical now represents nearly two-thirds of our net sales." Mr. Capper continued, "As the Wound Care market works through a sluggish reset, we are beginning to see the anticipated signs of adjustment, including patient migration into Wound Care Centers, where MIMEDX unit volume grew 7% sequentially in the quarter. We continue to believe the market will ultimately favor established manufacturers that have scale and prioritize investment in robust clinical research. With our cost actions from earlier this year now fully reflected in our run rate, we delivered a significant sequential improvement in our GAAP net loss and a return to positive Adjusted EBITDA in the quarter. "We are working diligently with the FTC to obtain HSR clearance and look forward to completing the acquisition of Sanara MedTech. As we prepare for the combination of the two companies, our conviction in both the strategic rationale and the financial merits of this transaction remains strong," concluded Mr. Capper.
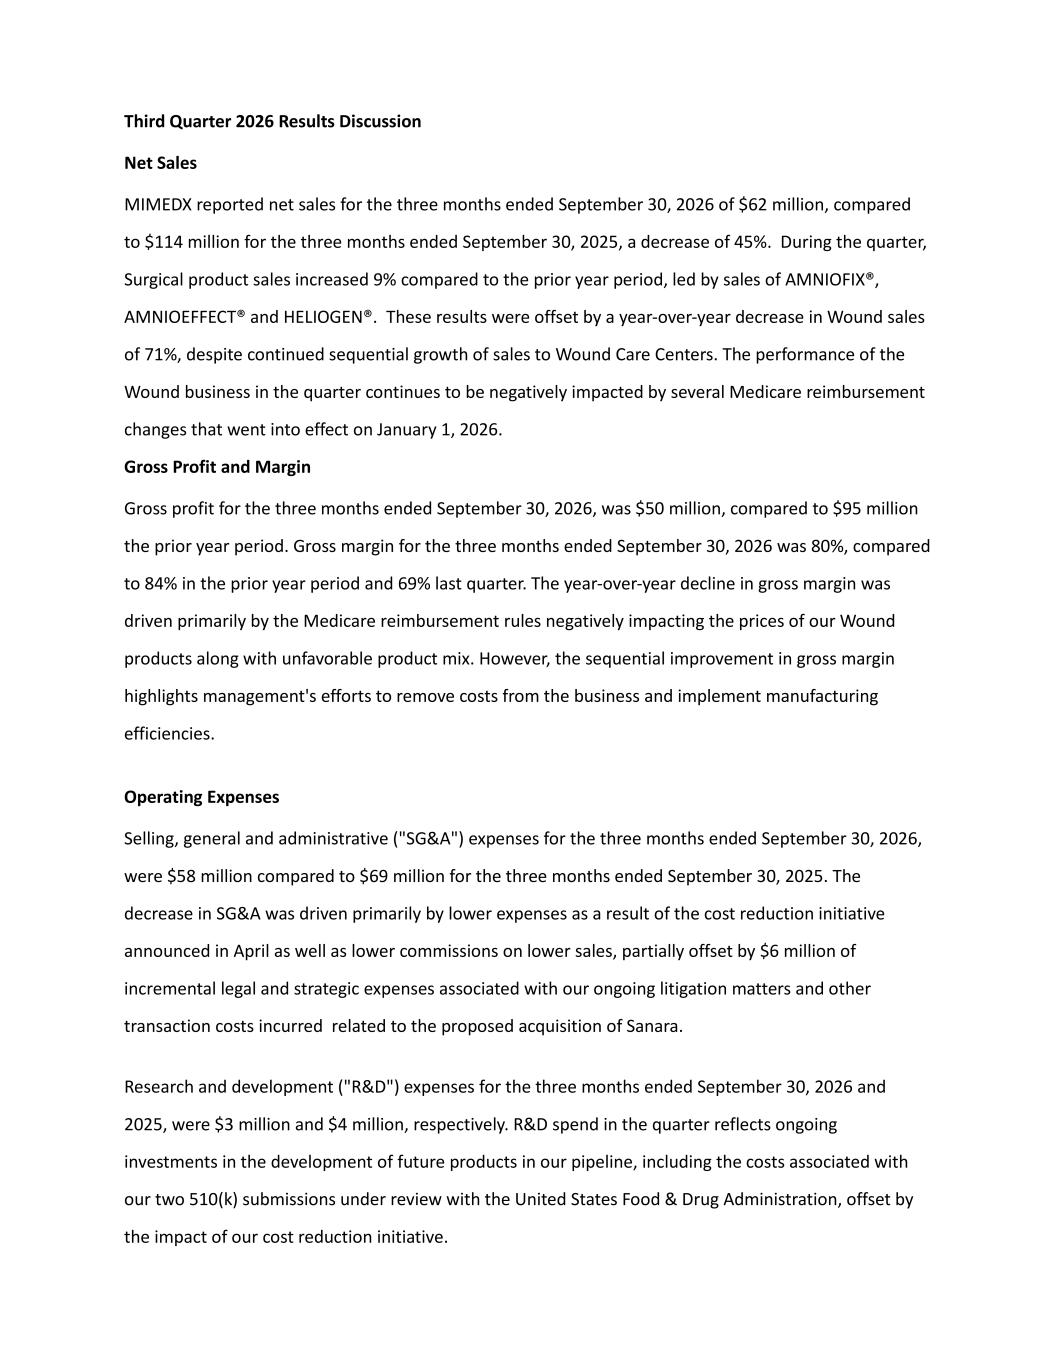
Third Quarter 2026 Results Discussion Net Sales MIMEDX reported net sales for the three months ended September 30, 2026 of $62 million, compared to $114 million for the three months ended September 30, 2025, a decrease of 45%. During the quarter, Surgical product sales increased 9% compared to the prior year period, led by sales of AMNIOFIX®, AMNIOEFFECT® and HELIOGEN®. These results were offset by a year-over-year decrease in Wound sales of 71%, despite continued sequential growth of sales to Wound Care Centers. The performance of the Wound business in the quarter continues to be negatively impacted by several Medicare reimbursement changes that went into effect on January 1, 2026. Gross Profit and Margin Gross profit for the three months ended September 30, 2026, was $50 million, compared to $95 million the prior year period. Gross margin for the three months ended September 30, 2026 was 80%, compared to 84% in the prior year period and 69% last quarter. The year-over-year decline in gross margin was driven primarily by the Medicare reimbursement rules negatively impacting the prices of our Wound products along with unfavorable product mix. However, the sequential improvement in gross margin highlights management's efforts to remove costs from the business and implement manufacturing efficiencies. Operating Expenses Selling, general and administrative ("SG&A") expenses for the three months ended September 30, 2026, were $58 million compared to $69 million for the three months ended September 30, 2025. The decrease in SG&A was driven primarily by lower expenses as a result of the cost reduction initiative announced in April as well as lower commissions on lower sales, partially offset by $6 million of incremental legal and strategic expenses associated with our ongoing litigation matters and other transaction costs incurred related to the proposed acquisition of Sanara. Research and development ("R&D") expenses for the three months ended September 30, 2026 and 2025, were $3 million and $4 million, respectively. R&D spend in the quarter reflects ongoing investments in the development of future products in our pipeline, including the costs associated with our two 510(k) submissions under review with the United States Food & Drug Administration, offset by the impact of our cost reduction initiative.
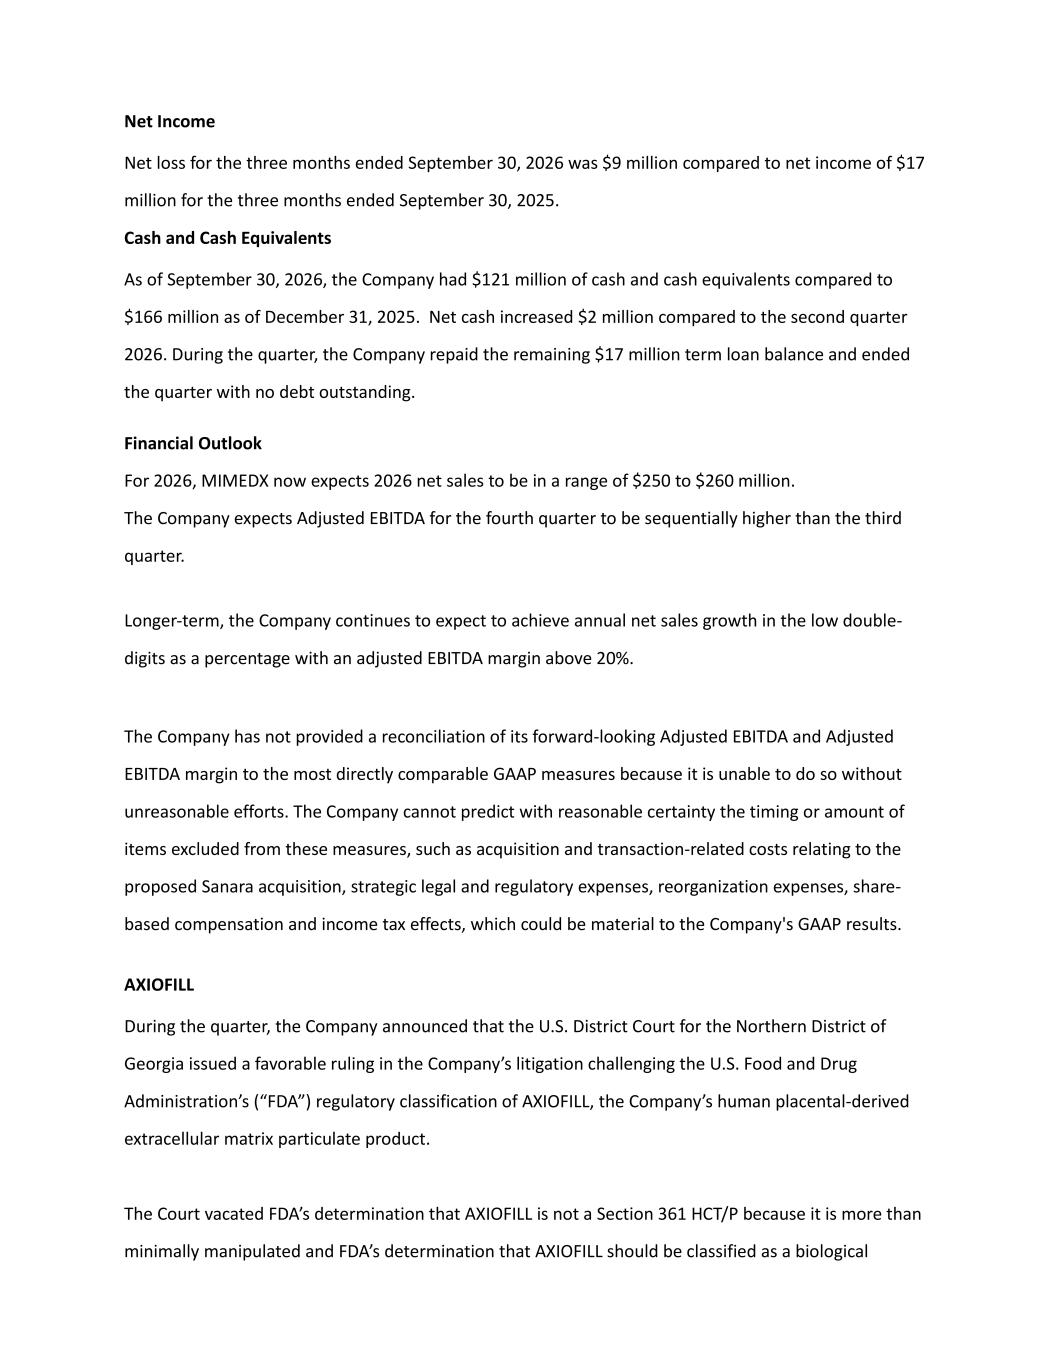
Net Income Net loss for the three months ended September 30, 2026 was $9 million compared to net income of $17 million for the three months ended September 30, 2025. Cash and Cash Equivalents As of September 30, 2026, the Company had $121 million of cash and cash equivalents compared to $166 million as of December 31, 2025. Net cash increased $2 million compared to the second quarter 2026. During the quarter, the Company repaid the remaining $17 million term loan balance and ended the quarter with no debt outstanding. Financial Outlook For 2026, MIMEDX now expects 2026 net sales to be in a range of $250 to $260 million. The Company expects Adjusted EBITDA for the fourth quarter to be sequentially higher than the third quarter. Longer-term, the Company continues to expect to achieve annual net sales growth in the low double- digits as a percentage with an adjusted EBITDA margin above 20%. The Company has not provided a reconciliation of its forward-looking Adjusted EBITDA and Adjusted EBITDA margin to the most directly comparable GAAP measures because it is unable to do so without unreasonable efforts. The Company cannot predict with reasonable certainty the timing or amount of items excluded from these measures, such as acquisition and transaction-related costs relating to the proposed Sanara acquisition, strategic legal and regulatory expenses, reorganization expenses, share- based compensation and income tax effects, which could be material to the Company's GAAP results. AXIOFILL During the quarter, the Company announced that the U.S. District Court for the Northern District of Georgia issued a favorable ruling in the Company’s litigation challenging the U.S. Food and Drug Administration’s (“FDA”) regulatory classification of AXIOFILL, the Company’s human placental-derived extracellular matrix particulate product. The Court vacated FDA’s determination that AXIOFILL is not a Section 361 HCT/P because it is more than minimally manipulated and FDA’s determination that AXIOFILL should be classified as a biological
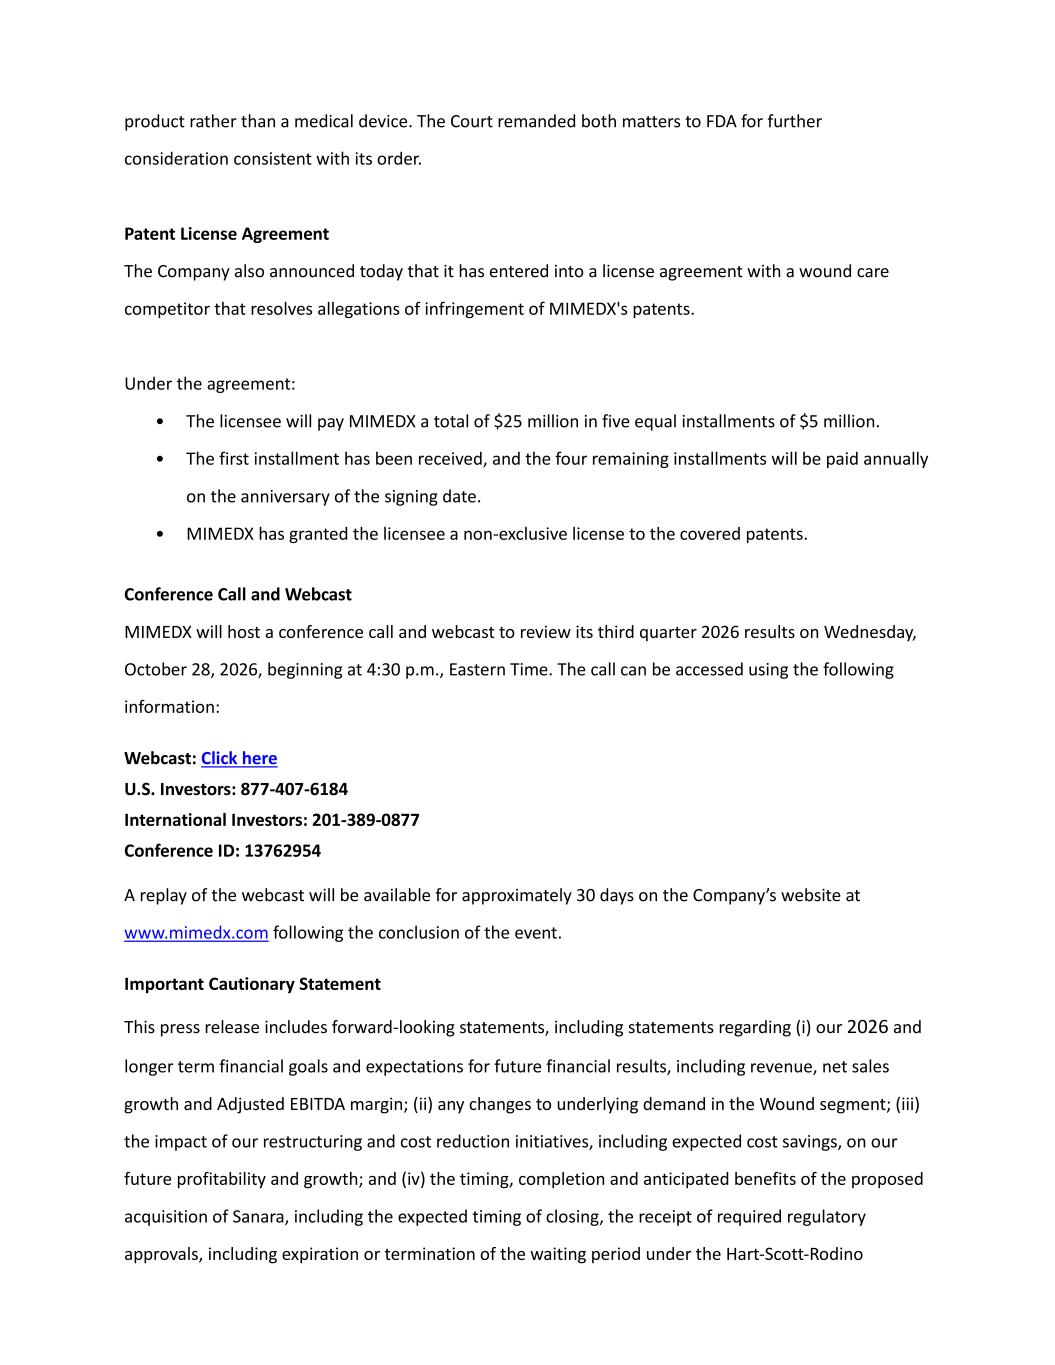
product rather than a medical device. The Court remanded both matters to FDA for further consideration consistent with its order. Patent License Agreement The Company also announced today that it has entered into a license agreement with a wound care competitor that resolves allegations of infringement of MIMEDX's patents. Under the agreement: • The licensee will pay MIMEDX a total of $25 million in five equal installments of $5 million. • The first installment has been received, and the four remaining installments will be paid annually on the anniversary of the signing date. • MIMEDX has granted the licensee a non-exclusive license to the covered patents. Conference Call and Webcast MIMEDX will host a conference call and webcast to review its third quarter 2026 results on Wednesday, October 28, 2026, beginning at 4:30 p.m., Eastern Time. The call can be accessed using the following information: Webcast: Click here U.S. Investors: 877-407-6184 International Investors: 201-389-0877 Conference ID: 13762954 A replay of the webcast will be available for approximately 30 days on the Company’s website at www.mimedx.com following the conclusion of the event. Important Cautionary Statement This press release includes forward-looking statements, including statements regarding (i) our 2026 and longer term financial goals and expectations for future financial results, including revenue, net sales growth and Adjusted EBITDA margin; (ii) any changes to underlying demand in the Wound segment; (iii) the impact of our restructuring and cost reduction initiatives, including expected cost savings, on our future profitability and growth; and (iv) the timing, completion and anticipated benefits of the proposed acquisition of Sanara, including the expected timing of closing, the receipt of required regulatory approvals, including expiration or termination of the waiting period under the Hart-Scott-Rodino
Antitrust Improvements Act following the FTC’s Second Request, financing under the Hayfin commitment, anticipated ticking fees under the Hayfin commitment letter, potential termination fees payable to Sanara, and integration activities and expected synergies. Additional forward-looking statements may be identified by words such as "believe," "expect," "may," "plan," “goal,” “outlook,” "potential," "will," "preliminary," and similar expressions, and are based on management's current beliefs and expectations. Forward-looking statements are subject to risks and uncertainties, and the Company cautions investors against placing undue reliance on such statements. Actual results may differ materially from those set forth in the forward-looking statements. Factors that could cause actual results to differ from expectations include: (i) future sales are uncertain and are affected by competition, access to customers, patient access to healthcare providers, the new reimbursement environment, which introduced tighter coverage parameters, lower reimbursement levels in certain categories, and incremental administrative complexity for providers and many other factors; (ii) the Company may change its plans due to unforeseen or evolving circumstances and market response to the reimbursement rules; (iii) the results of scientific research are uncertain and may have little or no value; (iv) our ability to sell our products in other countries depends on a number of factors including adequate levels of reimbursement, market acceptance of novel therapies, and our ability to build and manage a direct sales force or third party distribution relationship; (v) the effectiveness of amniotic tissue as a therapy for particular indications or conditions is the subject of further scientific and clinical studies; (vi) we may alter the timing and amount of planned expenditures for research and development based on regulatory developments; (vii) Medicare spending rules; and (viii) changes in the size of the addressable market for our products; and (ix) risks relating to the proposed Sanara transaction, including the timing of closing, the outcome and timing of the FTC review and Second Request process, the risk that financing under the Hayfin commitment is not available when needed, the impact of ticking fees or termination fees, integration risks, the possibility that expected synergies are not realized as expected, and the possibility that the transaction is delayed or not completed. The Company describes additional risks and uncertainties in the Risk Factors section of its most recent annual report and quarterly reports filed with the Securities and Exchange Commission. Any forward-looking statements speak only as of the date of this press release and the Company assumes no obligation to update any forward-looking statement. About MIMEDX
MIMEDX is a pioneer and leader focused on helping humans heal. With more than a decade and a half of helping clinicians manage chronic and other hard-to-heal wounds, MIMEDX is dedicated to providing a leading portfolio of products for applications in the wound care, burn, and surgical sectors of healthcare. The Company’s vision is to be the leading global provider of healing solutions through relentless innovation to restore quality of life. For additional information, please visit www.mimedx.com. Contact: Matt Notarianni Investor Relations 470.304.7291 mnotarianni@mimedx.com Selected Unaudited Financial Information
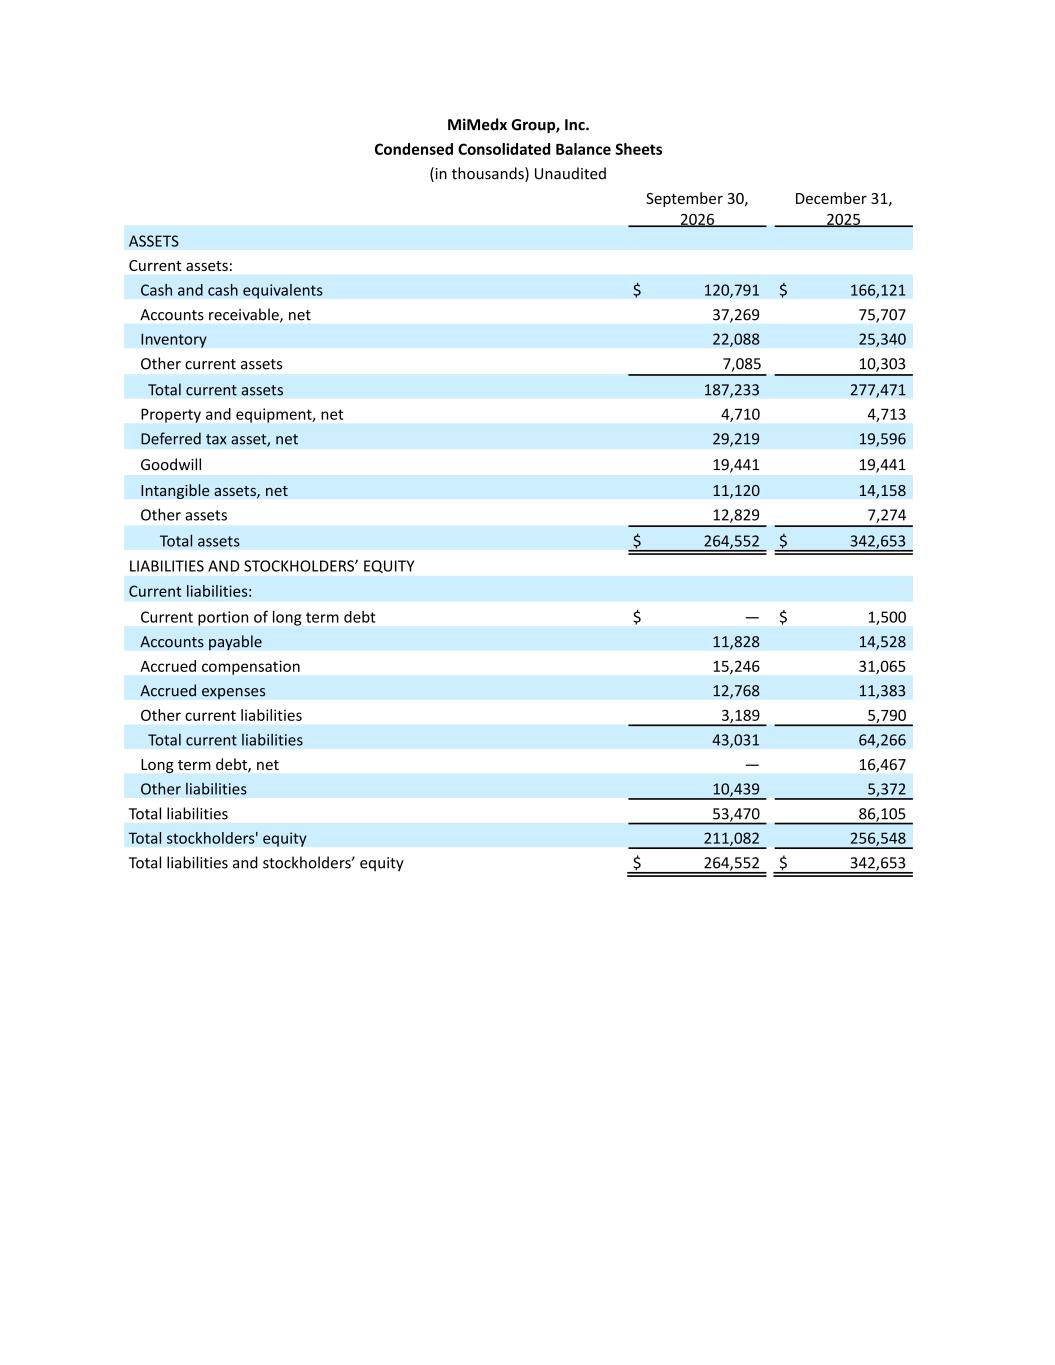
MiMedx Group, Inc. Condensed Consolidated Balance Sheets (in thousands) Unaudited September 30, 2026 December 31, 2025 ASSETS Current assets: Cash and cash equivalents $ 120,791 $ 166,121 Accounts receivable, net 37,269 75,707 Inventory 22,088 25,340 Other current assets 7,085 10,303 Total current assets 187,233 277,471 Property and equipment, net 4,710 4,713 Deferred tax asset, net 29,219 19,596 Goodwill 19,441 19,441 Intangible assets, net 11,120 14,158 Other assets 12,829 7,274 Total assets $ 264,552 $ 342,653 LIABILITIES AND STOCKHOLDERS’ EQUITY Current liabilities: Current portion of long term debt $ — $ 1,500 Accounts payable 11,828 14,528 Accrued compensation 15,246 31,065 Accrued expenses 12,768 11,383 Other current liabilities 3,189 5,790 Total current liabilities 43,031 64,266 Long term debt, net — 16,467 Other liabilities 10,439 5,372 Total liabilities 53,470 86,105 Total stockholders' equity 211,082 256,548 Total liabilities and stockholders’ equity $ 264,552 $ 342,653
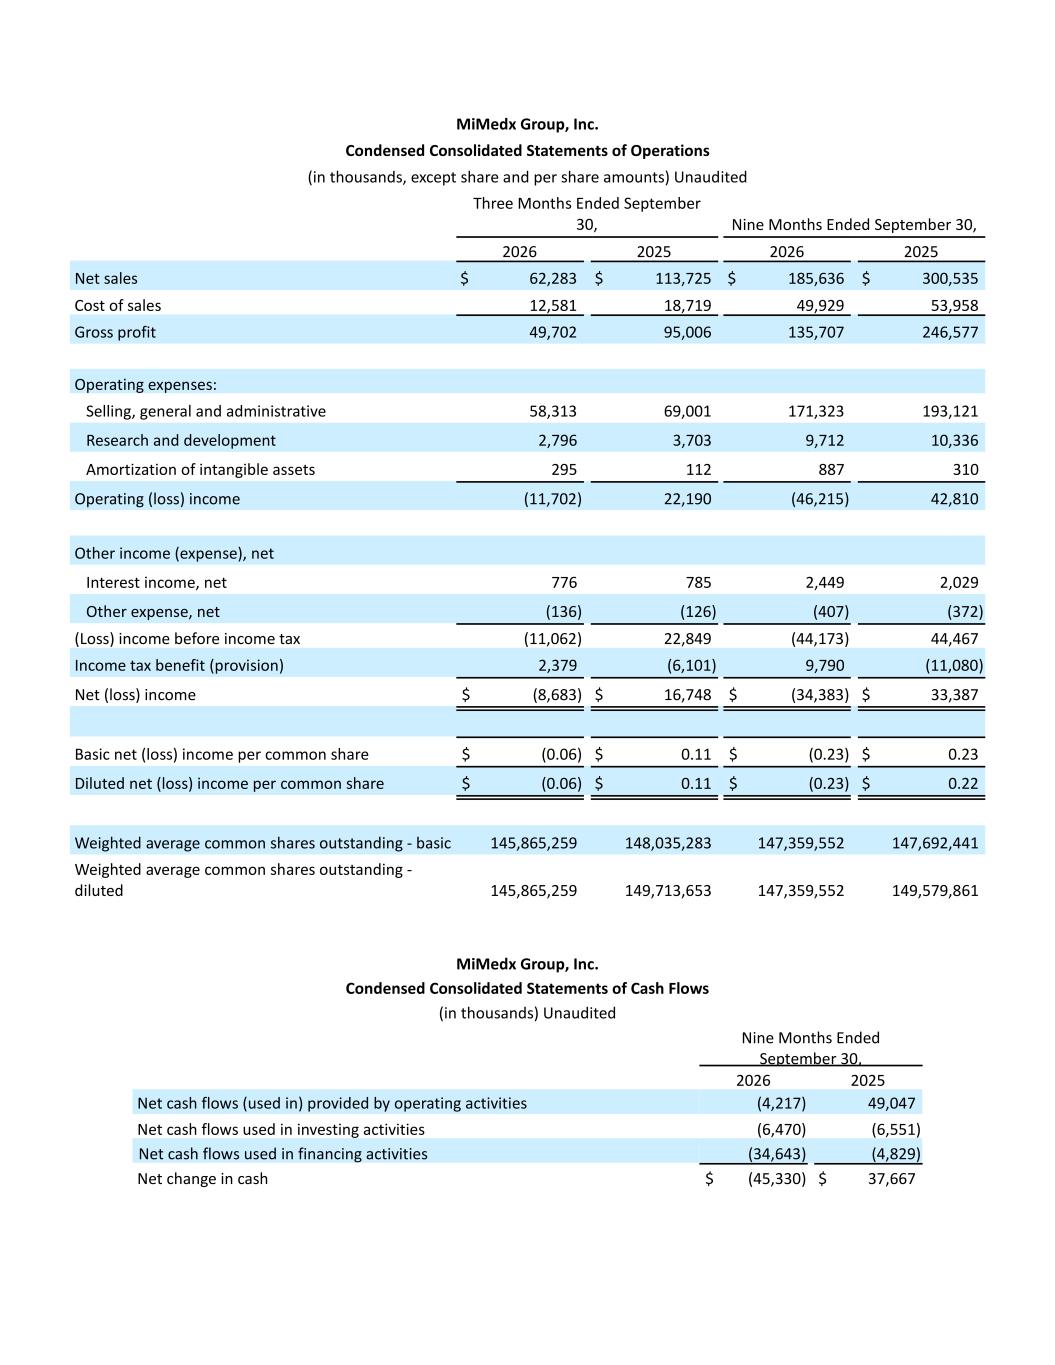
MiMedx Group, Inc. Condensed Consolidated Statements of Operations (in thousands, except share and per share amounts) Unaudited Three Months Ended September 30, Nine Months Ended September 30, 2026 2025 2026 2025 Net sales $ 62,283 $ 113,725 $ 185,636 $ 300,535 Cost of sales 12,581 18,719 49,929 53,958 Gross profit 49,702 95,006 135,707 246,577 Operating expenses: Selling, general and administrative 58,313 69,001 171,323 193,121 Research and development 2,796 3,703 9,712 10,336 Amortization of intangible assets 295 112 887 310 Operating (loss) income (11,702) 22,190 (46,215) 42,810 Other income (expense), net Interest income, net 776 785 2,449 2,029 Other expense, net (136) (126) (407) (372) (Loss) income before income tax (11,062) 22,849 (44,173) 44,467 Income tax benefit (provision) 2,379 (6,101) 9,790 (11,080) Net (loss) income $ (8,683) $ 16,748 $ (34,383) $ 33,387 Basic net (loss) income per common share $ (0.06) $ 0.11 $ (0.23) $ 0.23 Diluted net (loss) income per common share $ (0.06) $ 0.11 $ (0.23) $ 0.22 Weighted average common shares outstanding - basic 145,865,259 148,035,283 147,359,552 147,692,441 Weighted average common shares outstanding - diluted 145,865,259 149,713,653 147,359,552 149,579,861 MiMedx Group, Inc. Condensed Consolidated Statements of Cash Flows (in thousands) Unaudited Nine Months Ended September 30, 2026 2025 Net cash flows (used in) provided by operating activities (4,217) 49,047 Net cash flows used in investing activities (6,470) (6,551) Net cash flows used in financing activities (34,643) (4,829) Net change in cash $ (45,330) $ 37,667
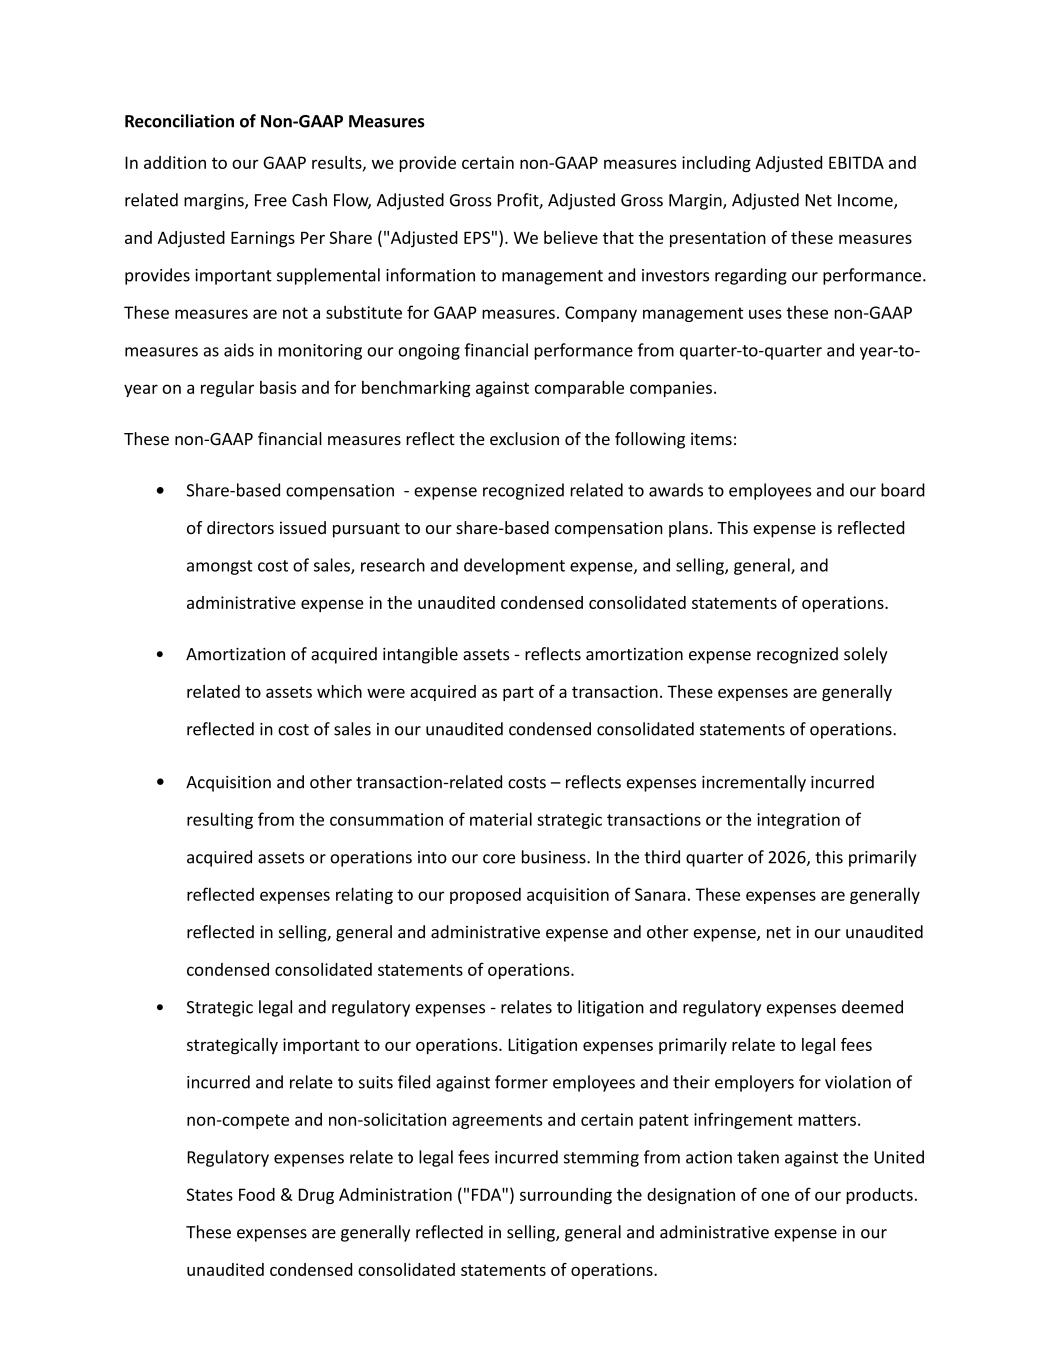
Reconciliation of Non-GAAP Measures In addition to our GAAP results, we provide certain non-GAAP measures including Adjusted EBITDA and related margins, Free Cash Flow, Adjusted Gross Profit, Adjusted Gross Margin, Adjusted Net Income, and Adjusted Earnings Per Share ("Adjusted EPS"). We believe that the presentation of these measures provides important supplemental information to management and investors regarding our performance. These measures are not a substitute for GAAP measures. Company management uses these non-GAAP measures as aids in monitoring our ongoing financial performance from quarter-to-quarter and year-to- year on a regular basis and for benchmarking against comparable companies. These non-GAAP financial measures reflect the exclusion of the following items: • Share-based compensation - expense recognized related to awards to employees and our board of directors issued pursuant to our share-based compensation plans. This expense is reflected amongst cost of sales, research and development expense, and selling, general, and administrative expense in the unaudited condensed consolidated statements of operations. • Amortization of acquired intangible assets - reflects amortization expense recognized solely related to assets which were acquired as part of a transaction. These expenses are generally reflected in cost of sales in our unaudited condensed consolidated statements of operations. • Acquisition and other transaction-related costs – reflects expenses incrementally incurred resulting from the consummation of material strategic transactions or the integration of acquired assets or operations into our core business. In the third quarter of 2026, this primarily reflected expenses relating to our proposed acquisition of Sanara. These expenses are generally reflected in selling, general and administrative expense and other expense, net in our unaudited condensed consolidated statements of operations. • Strategic legal and regulatory expenses - relates to litigation and regulatory expenses deemed strategically important to our operations. Litigation expenses primarily relate to legal fees incurred and relate to suits filed against former employees and their employers for violation of non-compete and non-solicitation agreements and certain patent infringement matters. Regulatory expenses relate to legal fees incurred stemming from action taken against the United States Food & Drug Administration ("FDA") surrounding the designation of one of our products. These expenses are generally reflected in selling, general and administrative expense in our unaudited condensed consolidated statements of operations.
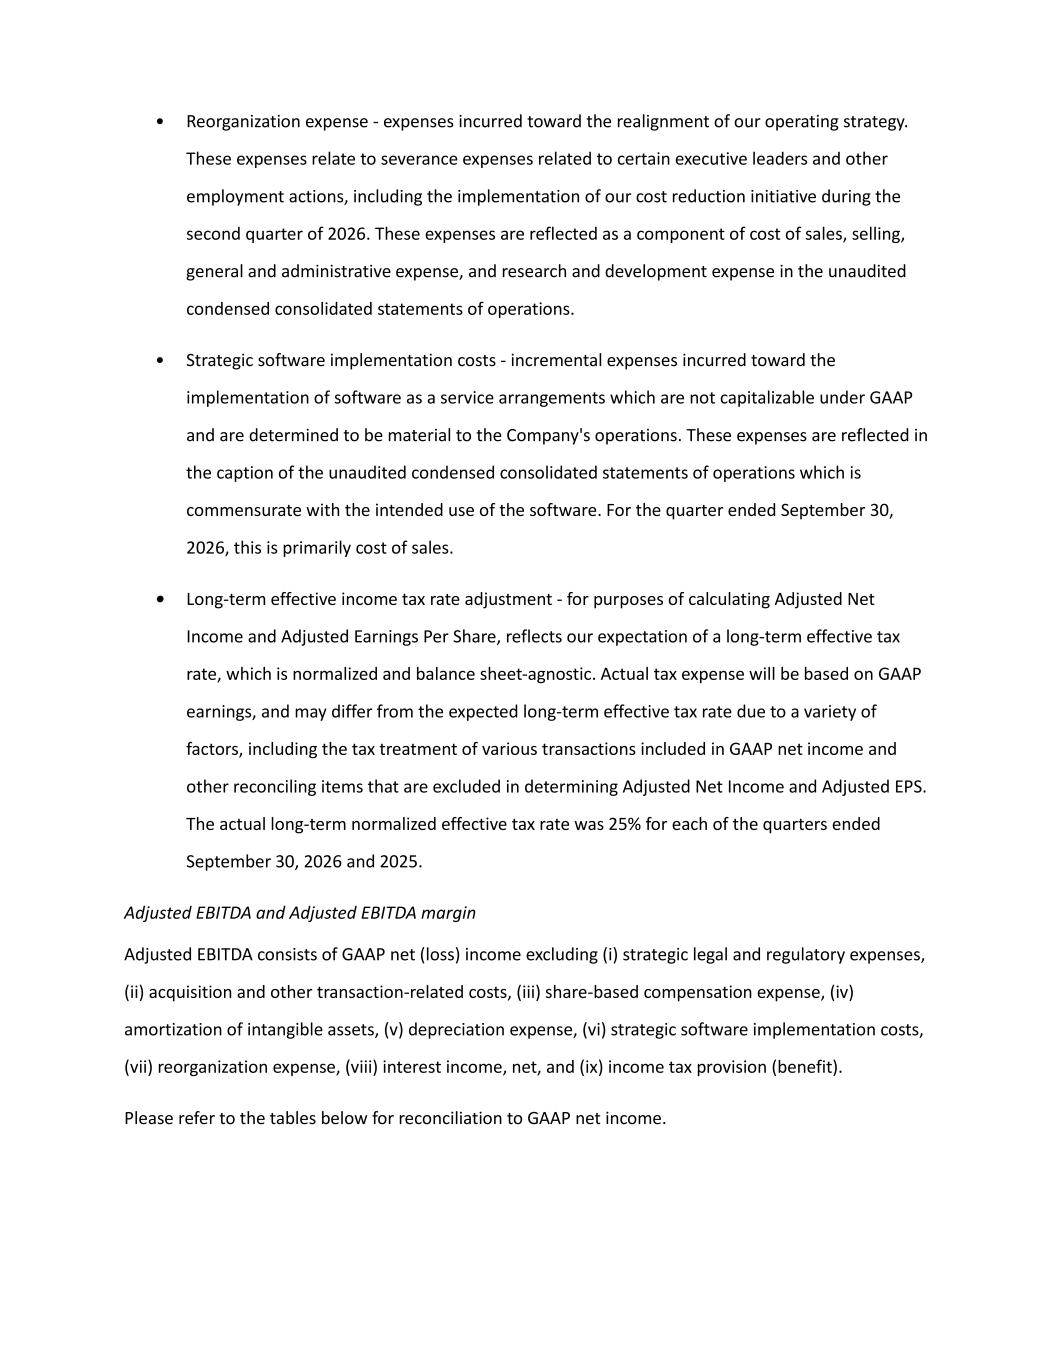
• Reorganization expense - expenses incurred toward the realignment of our operating strategy. These expenses relate to severance expenses related to certain executive leaders and other employment actions, including the implementation of our cost reduction initiative during the second quarter of 2026. These expenses are reflected as a component of cost of sales, selling, general and administrative expense, and research and development expense in the unaudited condensed consolidated statements of operations. • Strategic software implementation costs - incremental expenses incurred toward the implementation of software as a service arrangements which are not capitalizable under GAAP and are determined to be material to the Company's operations. These expenses are reflected in the caption of the unaudited condensed consolidated statements of operations which is commensurate with the intended use of the software. For the quarter ended September 30, 2026, this is primarily cost of sales. • Long-term effective income tax rate adjustment - for purposes of calculating Adjusted Net Income and Adjusted Earnings Per Share, reflects our expectation of a long-term effective tax rate, which is normalized and balance sheet-agnostic. Actual tax expense will be based on GAAP earnings, and may differ from the expected long-term effective tax rate due to a variety of factors, including the tax treatment of various transactions included in GAAP net income and other reconciling items that are excluded in determining Adjusted Net Income and Adjusted EPS. The actual long-term normalized effective tax rate was 25% for each of the quarters ended September 30, 2026 and 2025. Adjusted EBITDA and Adjusted EBITDA margin Adjusted EBITDA consists of GAAP net (loss) income excluding (i) strategic legal and regulatory expenses, (ii) acquisition and other transaction-related costs, (iii) share-based compensation expense, (iv) amortization of intangible assets, (v) depreciation expense, (vi) strategic software implementation costs, (vii) reorganization expense, (viii) interest income, net, and (ix) income tax provision (benefit). Please refer to the tables below for reconciliation to GAAP net income.
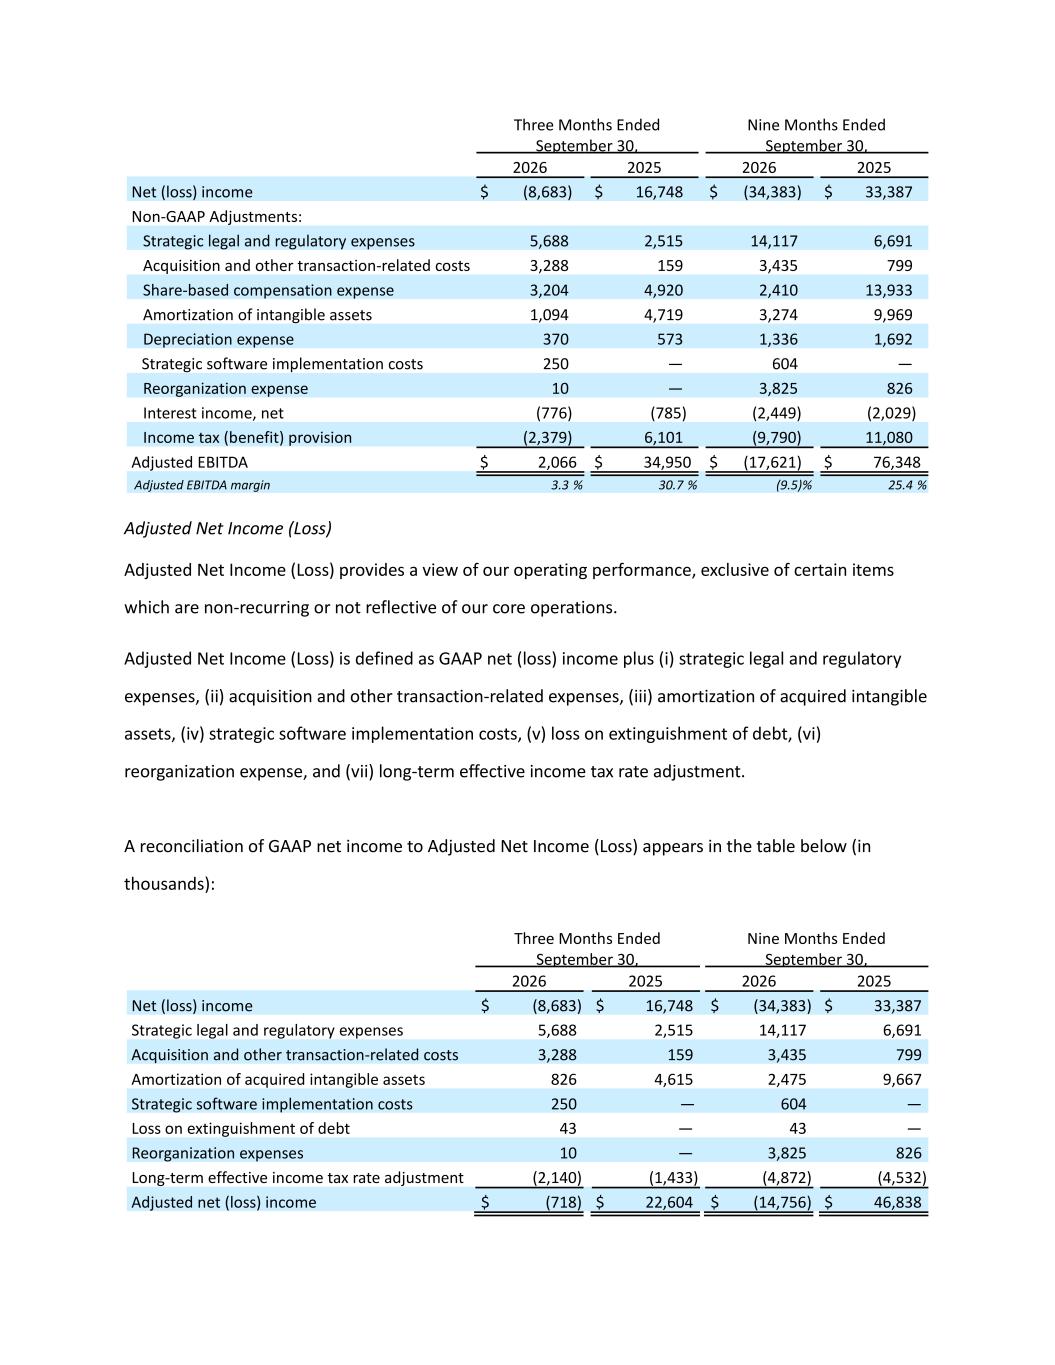
Three Months Ended September 30, Nine Months Ended September 30, 2026 2025 2026 2025 Net (loss) income $ (8,683) $ 16,748 $ (34,383) $ 33,387 Non-GAAP Adjustments: Strategic legal and regulatory expenses 5,688 2,515 14,117 6,691 Acquisition and other transaction-related costs 3,288 159 3,435 799 Share-based compensation expense 3,204 4,920 2,410 13,933 Amortization of intangible assets 1,094 4,719 3,274 9,969 Depreciation expense 370 573 1,336 1,692 Strategic software implementation costs 250 — 604 — Reorganization expense 10 — 3,825 826 Interest income, net (776) (785) (2,449) (2,029) Income tax (benefit) provision (2,379) 6,101 (9,790) 11,080 Adjusted EBITDA $ 2,066 $ 34,950 $ (17,621) $ 76,348 Adjusted EBITDA margin 3.3 % 30.7 % (9.5) % 25.4 % Adjusted Net Income (Loss) Adjusted Net Income (Loss) provides a view of our operating performance, exclusive of certain items which are non-recurring or not reflective of our core operations. Adjusted Net Income (Loss) is defined as GAAP net (loss) income plus (i) strategic legal and regulatory expenses, (ii) acquisition and other transaction-related expenses, (iii) amortization of acquired intangible assets, (iv) strategic software implementation costs, (v) loss on extinguishment of debt, (vi) reorganization expense, and (vii) long-term effective income tax rate adjustment. A reconciliation of GAAP net income to Adjusted Net Income (Loss) appears in the table below (in thousands): Three Months Ended September 30, Nine Months Ended September 30, 2026 2025 2026 2025 Net (loss) income $ (8,683) $ 16,748 $ (34,383) $ 33,387 Strategic legal and regulatory expenses 5,688 2,515 14,117 6,691 Acquisition and other transaction-related costs 3,288 159 3,435 799 Amortization of acquired intangible assets 826 4,615 2,475 9,667 Strategic software implementation costs 250 — 604 — Loss on extinguishment of debt 43 — 43 — Reorganization expenses 10 — 3,825 826 Long-term effective income tax rate adjustment (2,140) (1,433) (4,872) (4,532) Adjusted net (loss) income $ (718) $ 22,604 $ (14,756) $ 46,838
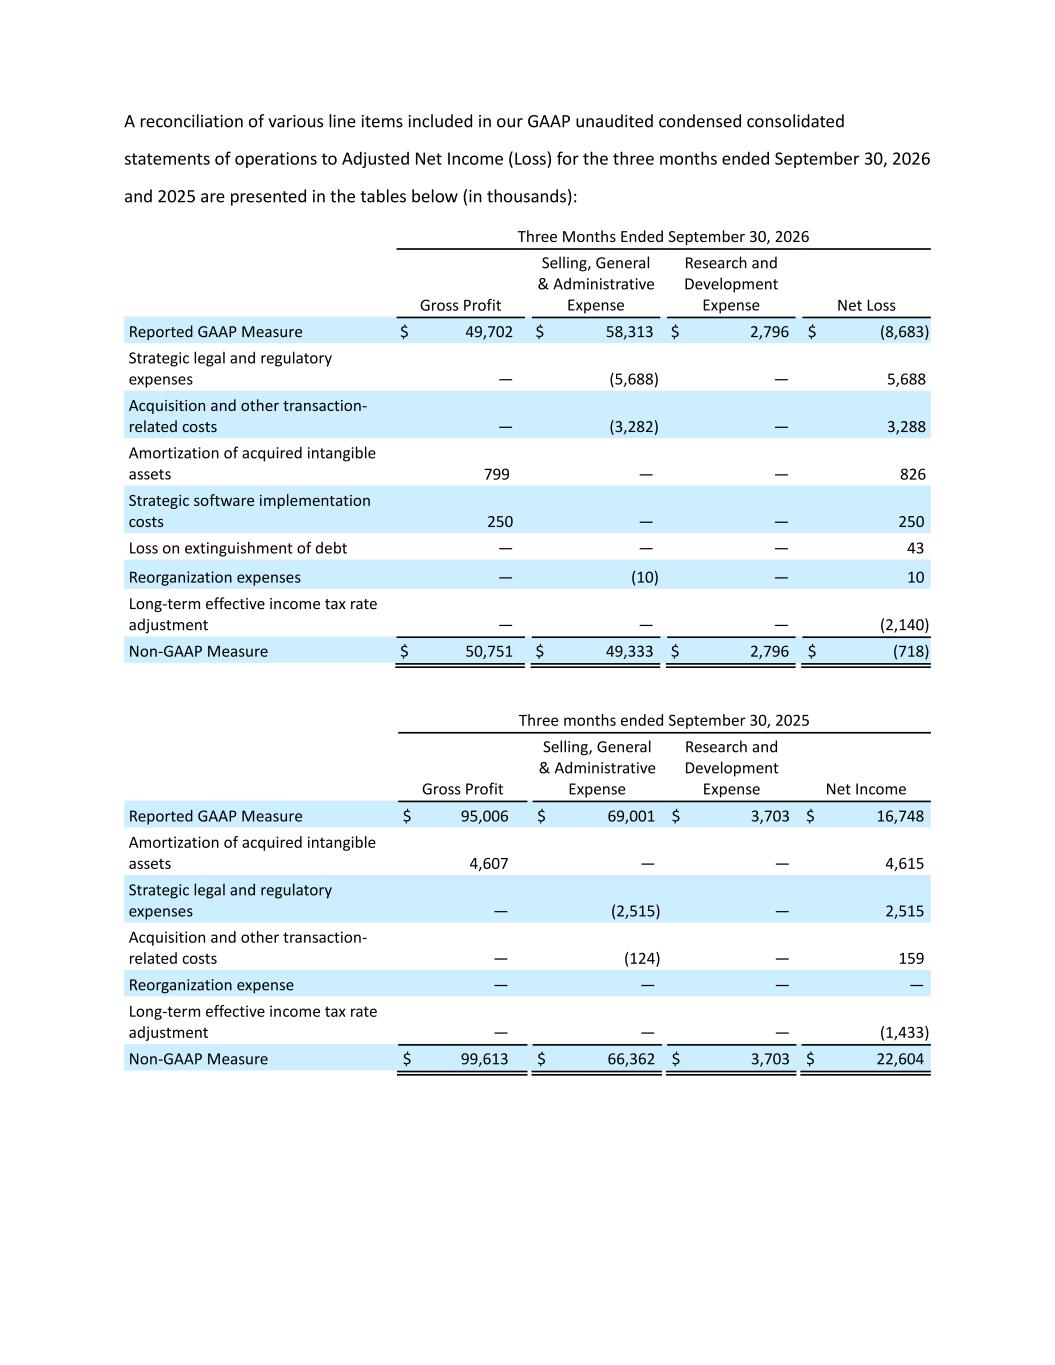
A reconciliation of various line items included in our GAAP unaudited condensed consolidated statements of operations to Adjusted Net Income (Loss) for the three months ended September 30, 2026 and 2025 are presented in the tables below (in thousands): Three Months Ended September 30, 2026 Gross Profit Selling, General & Administrative Expense Research and Development Expense Net Loss Reported GAAP Measure $ 49,702 $ 58,313 $ 2,796 $ (8,683) Strategic legal and regulatory expenses — (5,688) — 5,688 Acquisition and other transaction- related costs — (3,282) — 3,288 Amortization of acquired intangible assets 799 — — 826 Strategic software implementation costs 250 — — 250 Loss on extinguishment of debt — — — 43 Reorganization expenses — (10) — 10 Long-term effective income tax rate adjustment — — — (2,140) Non-GAAP Measure $ 50,751 $ 49,333 $ 2,796 $ (718) Three months ended September 30, 2025 Gross Profit Selling, General & Administrative Expense Research and Development Expense Net Income Reported GAAP Measure $ 95,006 $ 69,001 $ 3,703 $ 16,748 Amortization of acquired intangible assets 4,607 — — 4,615 Strategic legal and regulatory expenses — (2,515) — 2,515 Acquisition and other transaction- related costs — (124) — 159 Reorganization expense — — — — Long-term effective income tax rate adjustment — — — (1,433) Non-GAAP Measure $ 99,613 $ 66,362 $ 3,703 $ 22,604
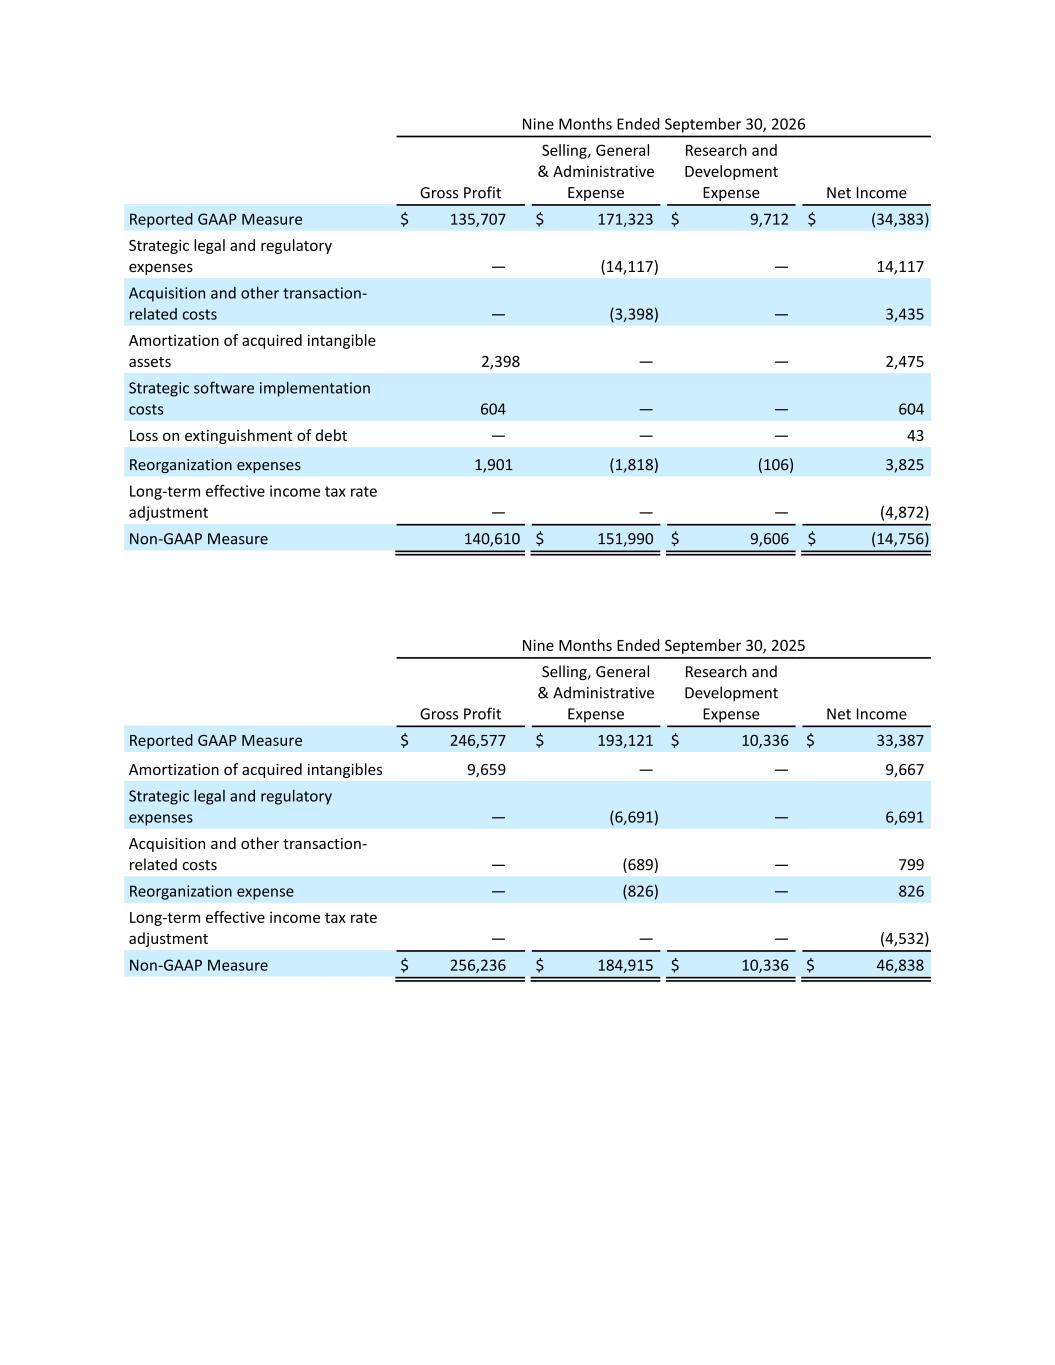
Nine Months Ended September 30, 2026 Gross Profit Selling, General & Administrative Expense Research and Development Expense Net Income Reported GAAP Measure $ 135,707 $ 171,323 $ 9,712 $ (34,383) Strategic legal and regulatory expenses — (14,117) — 14,117 Acquisition and other transaction- related costs — (3,398) — 3,435 Amortization of acquired intangible assets 2,398 — — 2,475 Strategic software implementation costs 604 — — 604 Loss on extinguishment of debt — — — 43 Reorganization expenses 1,901 (1,818) (106) 3,825 Long-term effective income tax rate adjustment — — — (4,872) Non-GAAP Measure 140,610 $ 151,990 $ 9,606 $ (14,756) Nine Months Ended September 30, 2025 Gross Profit Selling, General & Administrative Expense Research and Development Expense Net Income Reported GAAP Measure $ 246,577 $ 193,121 $ 10,336 $ 33,387 Amortization of acquired intangibles 9,659 — — 9,667 Strategic legal and regulatory expenses — (6,691) — 6,691 Acquisition and other transaction- related costs — (689) — 799 Reorganization expense — (826) — 826 Long-term effective income tax rate adjustment — — — (4,532) Non-GAAP Measure $ 256,236 $ 184,915 $ 10,336 $ 46,838
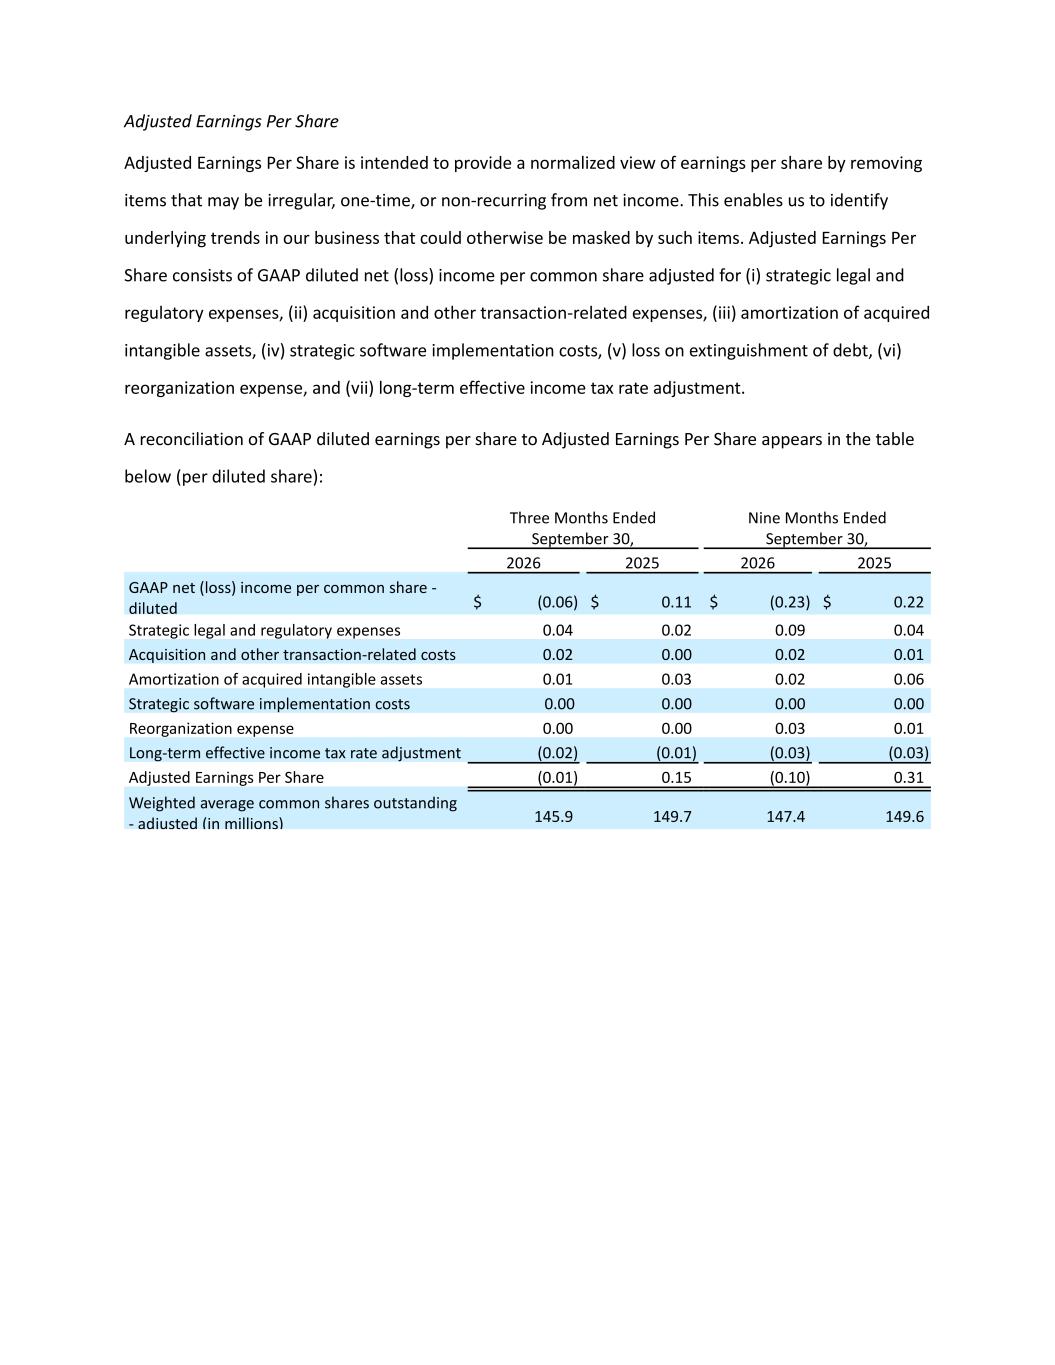
Adjusted Earnings Per Share Adjusted Earnings Per Share is intended to provide a normalized view of earnings per share by removing items that may be irregular, one-time, or non-recurring from net income. This enables us to identify underlying trends in our business that could otherwise be masked by such items. Adjusted Earnings Per Share consists of GAAP diluted net (loss) income per common share adjusted for (i) strategic legal and regulatory expenses, (ii) acquisition and other transaction-related expenses, (iii) amortization of acquired intangible assets, (iv) strategic software implementation costs, (v) loss on extinguishment of debt, (vi) reorganization expense, and (vii) long-term effective income tax rate adjustment. A reconciliation of GAAP diluted earnings per share to Adjusted Earnings Per Share appears in the table below (per diluted share): Three Months Ended September 30, Nine Months Ended September 30, 2026 2025 2026 2025 GAAP net (loss) income per common share - diluted $ (0.06) $ 0.11 $ (0.23) $ 0.22 Strategic legal and regulatory expenses 0.04 0.02 0.09 0.04 Acquisition and other transaction-related costs 0.02 0.00 0.02 0.01 Amortization of acquired intangible assets 0.01 0.03 0.02 0.06 Strategic software implementation costs 0.00 0.00 0.00 0.00 Reorganization expense 0.00 0.00 0.03 0.01 Long-term effective income tax rate adjustment (0.02) (0.01) (0.03) (0.03) Adjusted Earnings Per Share (0.01) 0.15 (0.10) 0.31 Weighted average common shares outstanding - adjusted (in millions) 145.9 149.7 147.4 149.6
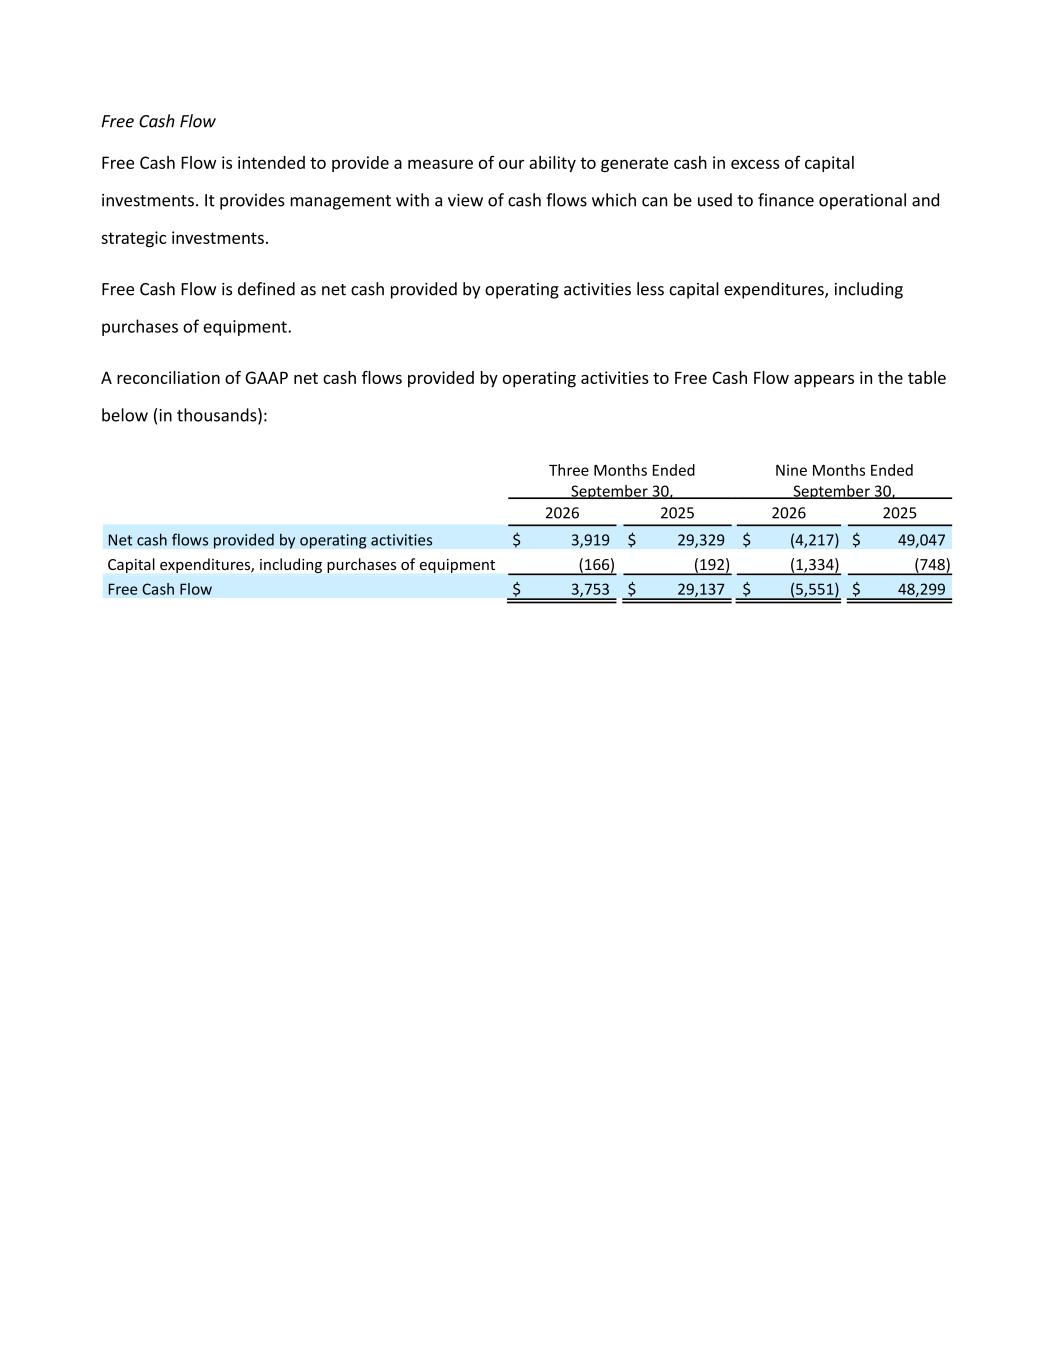
Free Cash Flow Free Cash Flow is intended to provide a measure of our ability to generate cash in excess of capital investments. It provides management with a view of cash flows which can be used to finance operational and strategic investments. Free Cash Flow is defined as net cash provided by operating activities less capital expenditures, including purchases of equipment. A reconciliation of GAAP net cash flows provided by operating activities to Free Cash Flow appears in the table below (in thousands): Three Months Ended September 30, Nine Months Ended September 30, 2026 2025 2026 2025 Net cash flows provided by operating activities $ 3,919 $ 29,329 $ (4,217) $ 49,047 Capital expenditures, including purchases of equipment (166) (192) (1,334) (748) Free Cash Flow $ 3,753 $ 29,137 $ (5,551) $ 48,299
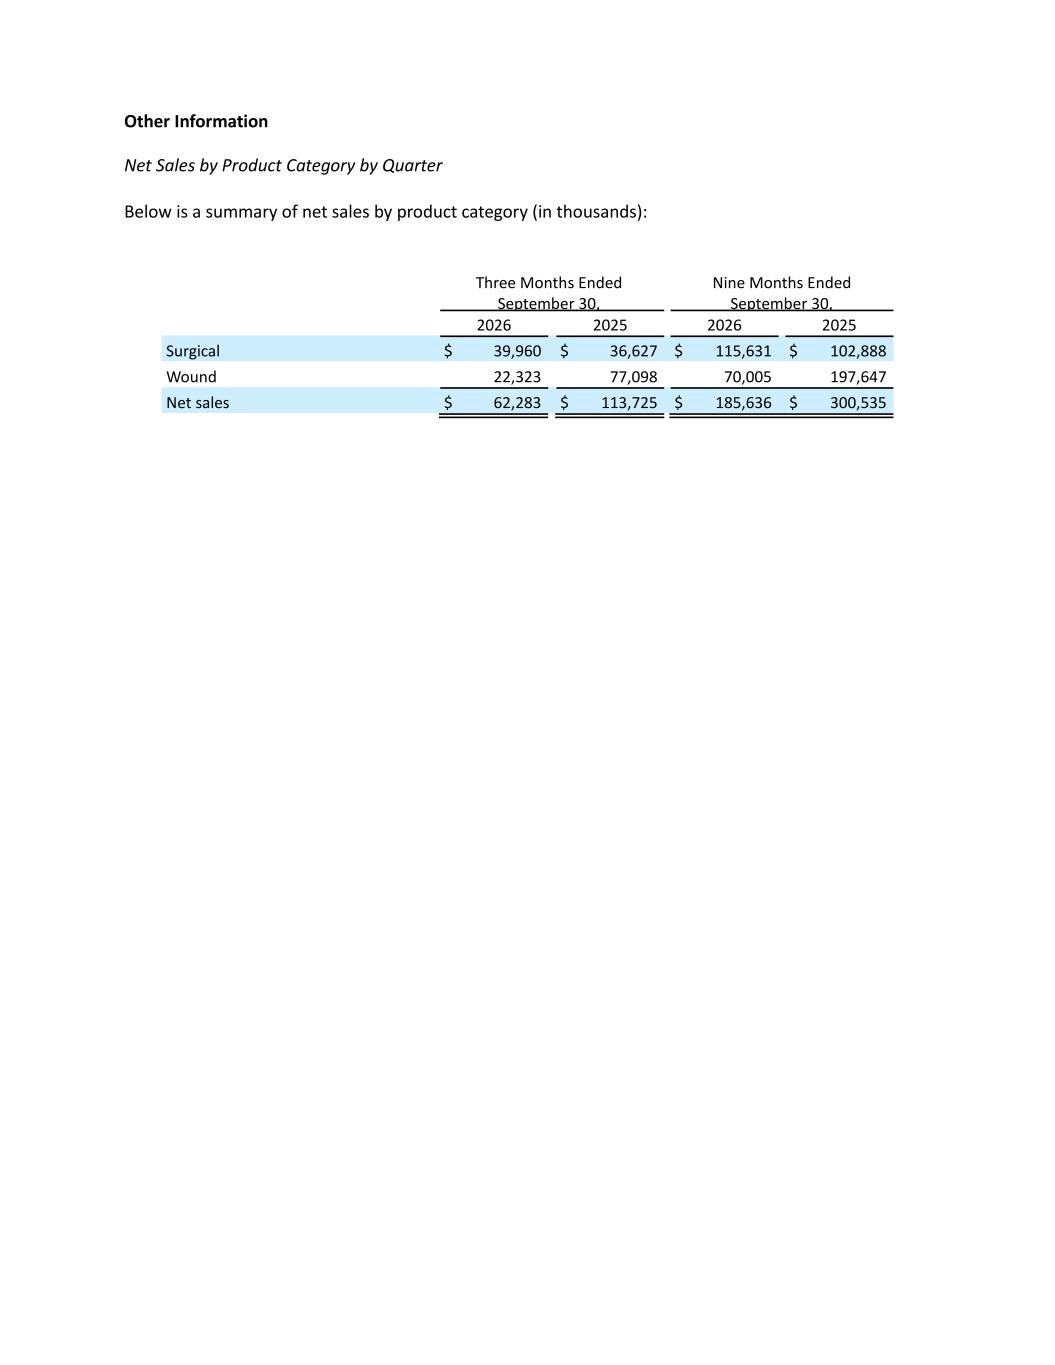
Other Information Net Sales by Product Category by Quarter Below is a summary of net sales by product category (in thousands): Three Months Ended September 30, Nine Months Ended September 30, 2026 2025 2026 2025 Surgical $ 39,960 $ 36,627 $ 115,631 $ 102,888 Wound 22,323 77,098 70,005 197,647 Net sales $ 62,283 $ 113,725 $ 185,636 $ 300,535