INVESTOR PRESENTATION October 2026 EXHIBIT 99.2
© 2026 ProPetro Holding Corp. All Rights Reserved. 2 Forward-Looking Statements Except for historical information contained herein, the statements and information in this presentation, including the oral statements made in connection herewith, are forward- looking statements that are made pursuant to the Safe Harbor Provisions of the Private Securities Litigation Reform Act of 1995. Statements that are predictive in nature, that depend upon or refer to future events or conditions or that include the words “may,” “could,” “confident,” “plan,” “project,” “budget,” “design,” “predict,” “pursue,” “target,” “seek,” “objective,” “believe,” “expect,” “anticipate,” “intend,” “estimate,” “will,” “should,” “continue,” and other expressions that are predictions of, or indicate, future events and trends or that do not relate to historical matters generally identify forward-looking statements. Our forward-looking statements include, among other matters, statements about the supply of and demand for hydrocarbons, supply of and demand for frac fleets, demand for behind the meter power from data centers and other customers, other industry trends and activity levels, our business strategy, projected financial results and future financial performance, the ability to obtain capital on attractive terms, expected fleet utilization, sustainability efforts, the future performance of newly improved technology, expected capital expenditures, the impact of such expenditures on our performance and capital programs, our fleet conversion strategy, our share repurchase program, and the anticipated growth prospects of PROPWR®, including the demand for its services, the types of customers and the ability to secure long-term contracts, the ability to obtain financing on attractive terms, the ability to procure additional equipment, the timely receipt of such equipment and our ability to successfully deploy it in our timeframes and the overall anticipated benefits of the PROPWR business line, including its expected financial contribution to our results of operations. A forward-looking statement may include a statement of the assumptions or bases underlying the forward-looking statement. We believe that we have chosen these assumptions or bases in good faith and that they are reasonable. Although forward-looking statements reflect our good faith beliefs at the time they are made, forward-looking statements are subject to a number of risks and uncertainties that may cause actual events and results to differ materially from the forward-looking statements. Such risks and uncertainties include the volatility of oil prices, changes in the supply of and demand for power generation, the risks associated with the establishment of a new service line, including delays, lack of customer acceptance and cost overruns, the global macroeconomic uncertainty related to conflict in the Middle East region, including the Iran War, the Russia-Ukraine war, and events in Venezuela, general economic conditions, including the impact of continued inflation, central bank policy actions, the risk of a global recession, U.S. and global trade policy, including the imposition of tariffs and retaliatory measures, and other factors described in the Company's Annual Report on Form 10-K and Quarterly Reports on Form 10-Q, particularly the “Risk Factors” sections of such filings, and other filings with the Securities and Exchange Commission (the “SEC”). In addition, the Company may be subject to currently unforeseen risks that may have a materially adverse impact on it. Accordingly, no assurances can be given that the actual events and results will not be materially different than the anticipated results described in the forward-looking statements. Readers are cautioned not to place undue reliance on such forward-looking statements and are urged to carefully review and consider the various disclosures made in the Company’s Annual Report on Form 10-K, Quarterly Reports on Form 10-Q and other filings made with the SEC from time to time that disclose risks and uncertainties that may affect the Company’s business. The forward-looking statements in this presentation are made as of the date of this presentation. ProPetro does not undertake, and expressly disclaims, any duty to publicly update these statements, whether as a result of new information, new developments or otherwise, except to the extent that disclosure is required by law. This presentation contains certain measures that are not determined in accordance with GAAP. For a definition of these measures and a reconciliation to the most directly comparable GAAP measure on a historical basis, please see the reconciliations on slide 3. EXHIBIT 99.2
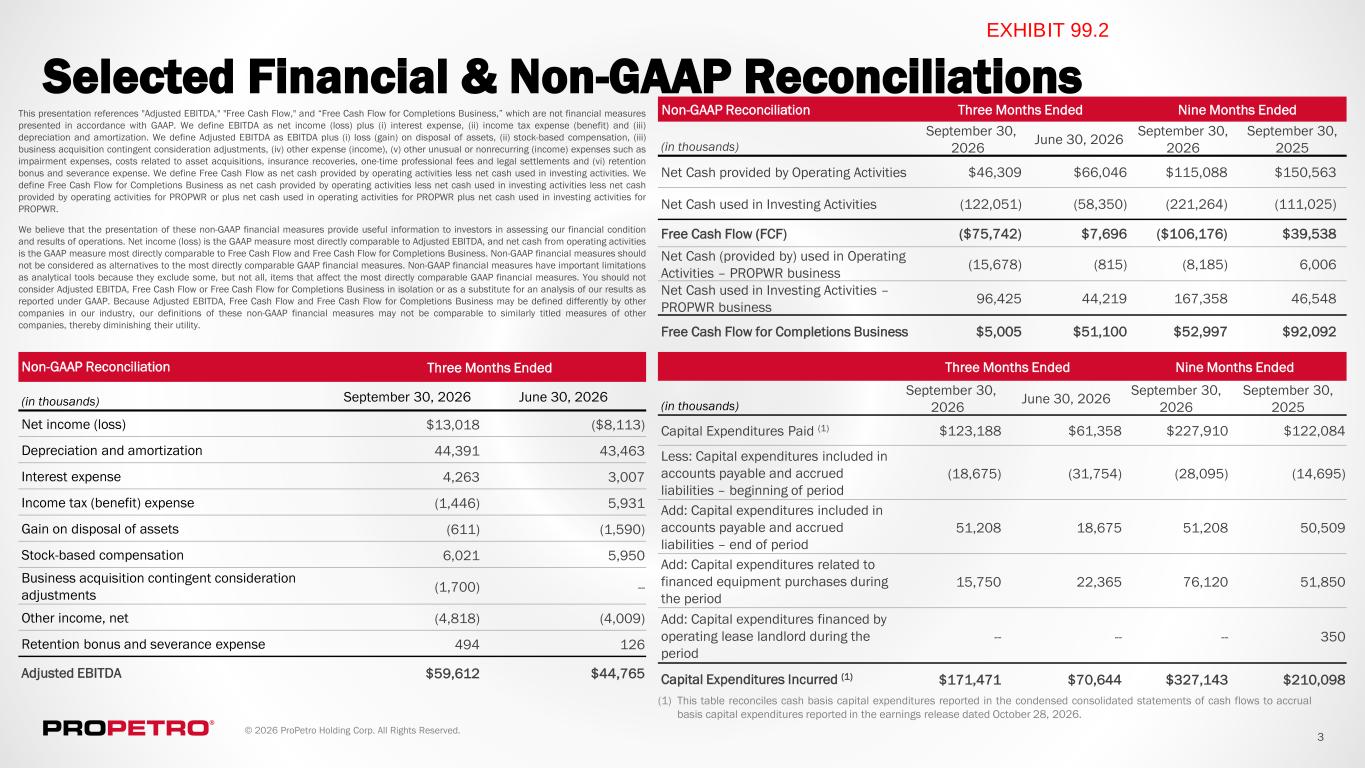
© 2026 ProPetro Holding Corp. All Rights Reserved. 3 This presentation references "Adjusted EBITDA," "Free Cash Flow," and “Free Cash Flow for Completions Business,” which are not financial measures presented in accordance with GAAP. We define EBITDA as net income (loss) plus (i) interest expense, (ii) income tax expense (benefit) and (iii) depreciation and amortization. We define Adjusted EBITDA as EBITDA plus (i) loss (gain) on disposal of assets, (ii) stock-based compensation, (iii) business acquisition contingent consideration adjustments, (iv) other expense (income), (v) other unusual or nonrecurring (income) expenses such as impairment expenses, costs related to asset acquisitions, insurance recoveries, one-time professional fees and legal settlements and (vi) retention bonus and severance expense. We define Free Cash Flow as net cash provided by operating activities less net cash used in investing activities. We define Free Cash Flow for Completions Business as net cash provided by operating activities less net cash used in investing activities less net cash provided by operating activities for PROPWR or plus net cash used in operating activities for PROPWR plus net cash used in investing activities for PROPWR. We believe that the presentation of these non-GAAP financial measures provide useful information to investors in assessing our financial condition and results of operations. Net income (loss) is the GAAP measure most directly comparable to Adjusted EBITDA, and net cash from operating activities is the GAAP measure most directly comparable to Free Cash Flow and Free Cash Flow for Completions Business. Non-GAAP financial measures should not be considered as alternatives to the most directly comparable GAAP financial measures. Non-GAAP financial measures have important limitations as analytical tools because they exclude some, but not all, items that affect the most directly comparable GAAP financial measures. You should not consider Adjusted EBITDA, Free Cash Flow or Free Cash Flow for Completions Business in isolation or as a substitute for an analysis of our results as reported under GAAP. Because Adjusted EBITDA, Free Cash Flow and Free Cash Flow for Completions Business may be defined differently by other companies in our industry, our definitions of these non-GAAP financial measures may not be comparable to similarly titled measures of other companies, thereby diminishing their utility. Selected Financial & Non-GAAP Reconciliations Non-GAAP Reconciliation Three Months Ended (in thousands) September 30, 2026 June 30, 2026 Net income (loss) $13,018 ($8,113) Depreciation and amortization 44,391 43,463 Interest expense 4,263 3,007 Income tax (benefit) expense (1,446) 5,931 Gain on disposal of assets (611) (1,590) Stock-based compensation 6,021 5,950 Business acquisition contingent consideration adjustments (1,700) -- Other income, net (4,818) (4,009) Retention bonus and severance expense 494 126 Adjusted EBITDA $59,612 $44,765 Non-GAAP Reconciliation Three Months Ended Nine Months Ended (in thousands) September 30, 2026 June 30, 2026 September 30, 2026 September 30, 2025 Net Cash provided by Operating Activities $46,309 $66,046 $115,088 $150,563 Net Cash used in Investing Activities (122,051) (58,350) (221,264) (111,025) Free Cash Flow (FCF) ($75,742) $7,696 ($106,176) $39,538 Net Cash (provided by) used in Operating Activities – PROPWR business (15,678) (815) (8,185) 6,006 Net Cash used in Investing Activities – PROPWR business 96,425 44,219 167,358 46,548 Free Cash Flow for Completions Business $5,005 $51,100 $52,997 $92,092 Three Months Ended Nine Months Ended (in thousands) September 30, 2026 June 30, 2026 September 30, 2026 September 30, 2025 Capital Expenditures Paid (1) $123,188 $61,358 $227,910 $122,084 Less: Capital expenditures included in accounts payable and accrued liabilities – beginning of period (18,675) (31,754) (28,095) (14,695) Add: Capital expenditures included in accounts payable and accrued liabilities – end of period 51,208 18,675 51,208 50,509 Add: Capital expenditures related to financed equipment purchases during the period 15,750 22,365 76,120 51,850 Add: Capital expenditures financed by operating lease landlord during the period -- -- -- 350 Capital Expenditures Incurred (1) $171,471 $70,644 $327,143 $210,098 (1) This table reconciles cash basis capital expenditures reported in the condensed consolidated statements of cash flows to accrual basis capital expenditures reported in the earnings release dated October 28, 2026. EXHIBIT 99.2
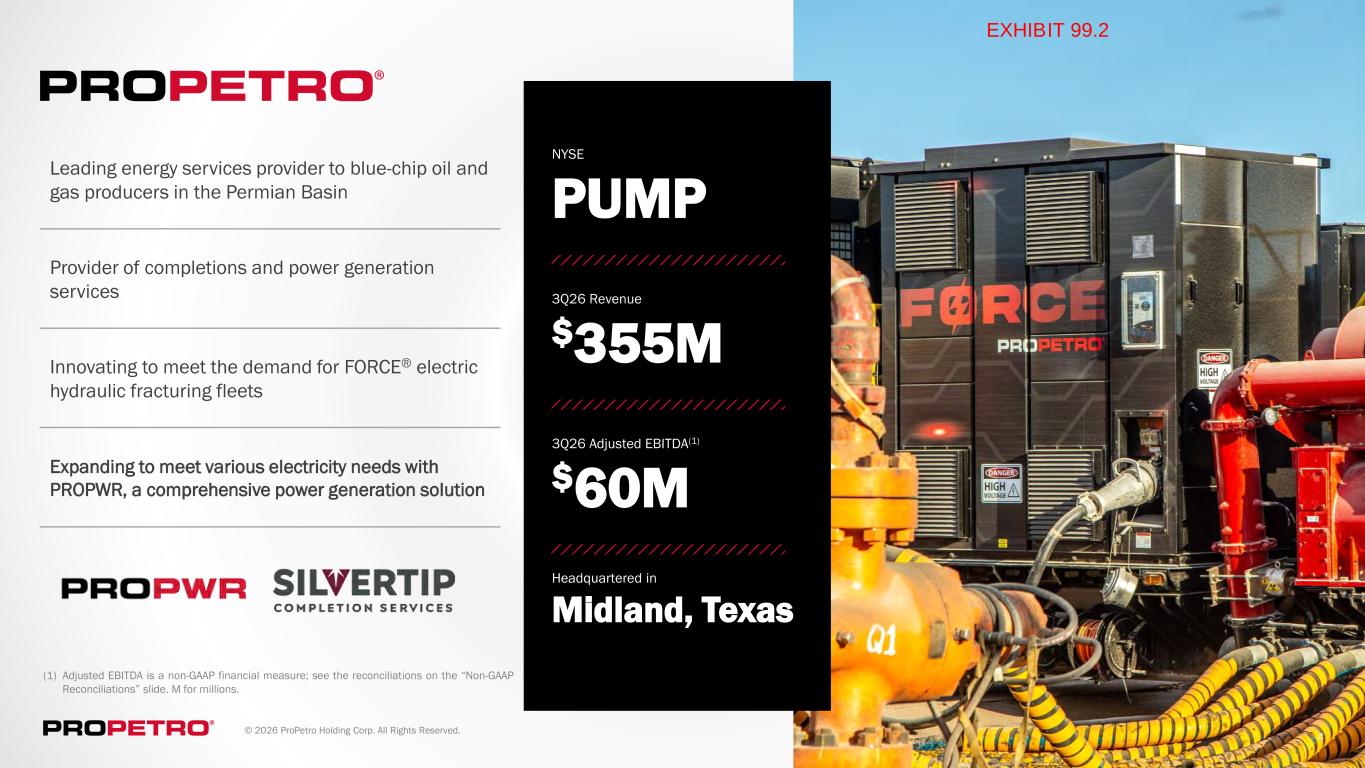
© 2026 ProPetro Holding Corp. All Rights Reserved. 4 NYSE PUMP 3Q26 Revenue $355M 3Q26 Adjusted EBITDA(1) $60M Headquartered in Midland, Texas (1) Adjusted EBITDA is a non-GAAP financial measure; see the reconciliations on the “Non-GAAP Reconciliations” slide. M for millions. Leading energy services provider to blue-chip oil and gas producers in the Permian Basin Provider of completions and power generation services Innovating to meet the demand for FORCE® electric hydraulic fracturing fleets Expanding to meet various electricity needs with PROPWR, a comprehensive power generation solution EXHIBIT 99.2
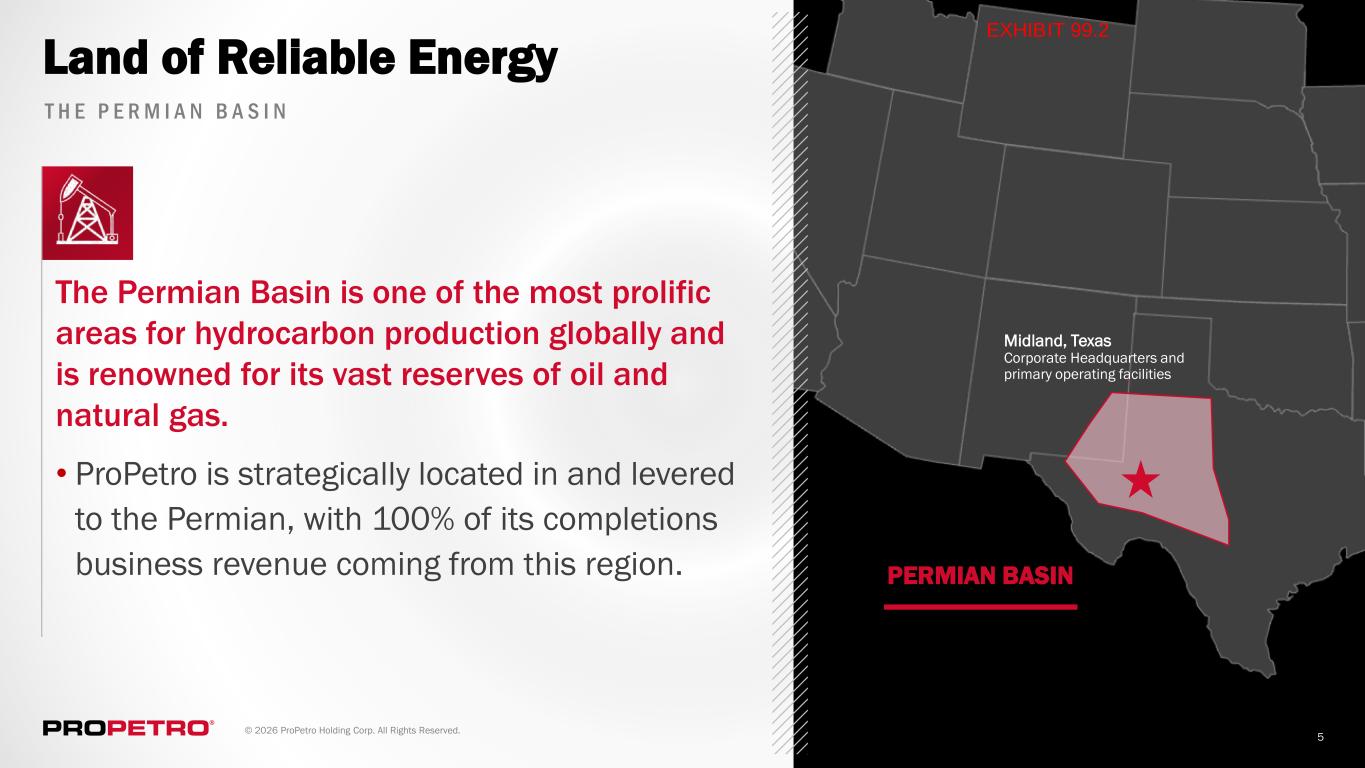
© 2026 ProPetro Holding Corp. All Rights Reserved. 5 Land of Reliable Energy Midland, Texas Corporate Headquarters and primary operating facilities T H E P E R M I A N B A S I N PERMIAN BASIN The Permian Basin is one of the most prolific areas for hydrocarbon production globally and is renowned for its vast reserves of oil and natural gas. • ProPetro is strategically located in and levered to the Permian, with 100% of its completions business revenue coming from this region. EXHIBIT 99.2
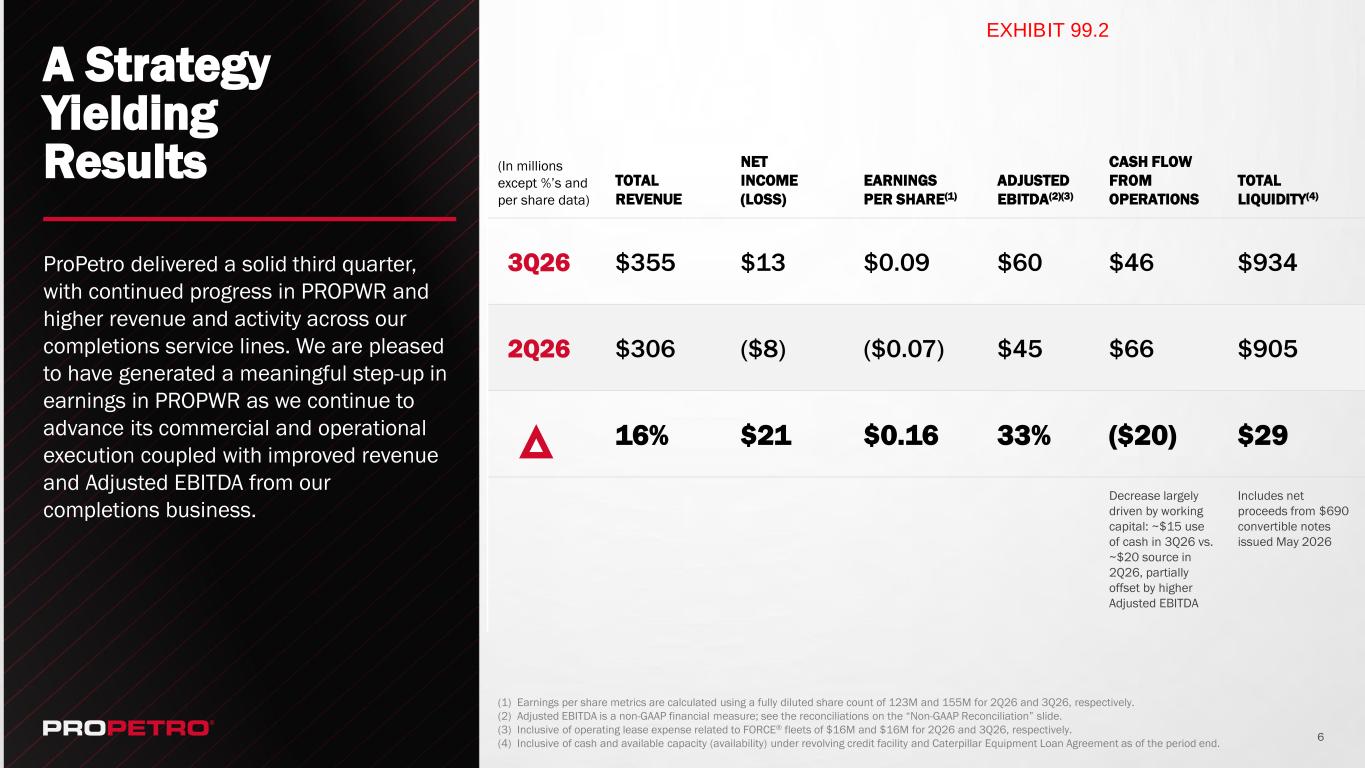
6 (In millions except %’s and per share data) TOTAL REVENUE NET INCOME (LOSS) EARNINGS PER SHARE(1) ADJUSTED EBITDA(2)(3) CASH FLOW FROM OPERATIONS TOTAL LIQUIDITY(4) 3Q26 $355 $13 $0.09 $60 $46 $934 2Q26 $306 ($8) ($0.07) $45 $66 $905 16% $21 $0.16 33% ($20) $29 Decrease largely driven by working capital: ~$15 use of cash in 3Q26 vs. ~$20 source in 2Q26, partially offset by higher Adjusted EBITDA Includes net proceeds from $690 convertible notes issued May 2026 A Strategy Yielding Results (1) Earnings per share metrics are calculated using a fully diluted share count of 123M and 155M for 2Q26 and 3Q26, respectively. (2) Adjusted EBITDA is a non-GAAP financial measure; see the reconciliations on the “Non-GAAP Reconciliation” slide. (3) Inclusive of operating lease expense related to FORCE® fleets of $16M and $16M for 2Q26 and 3Q26, respectively. (4) Inclusive of cash and available capacity (availability) under revolving credit facility and Caterpillar Equipment Loan Agreement as of the period end. ProPetro delivered a solid third quarter, with continued progress in PROPWR and higher revenue and activity across our completions service lines. We are pleased to have generated a meaningful step-up in earnings in PROPWR as we continue to advance its commercial and operational execution coupled with improved revenue and Adjusted EBITDA from our completions business. EXHIBIT 99.2
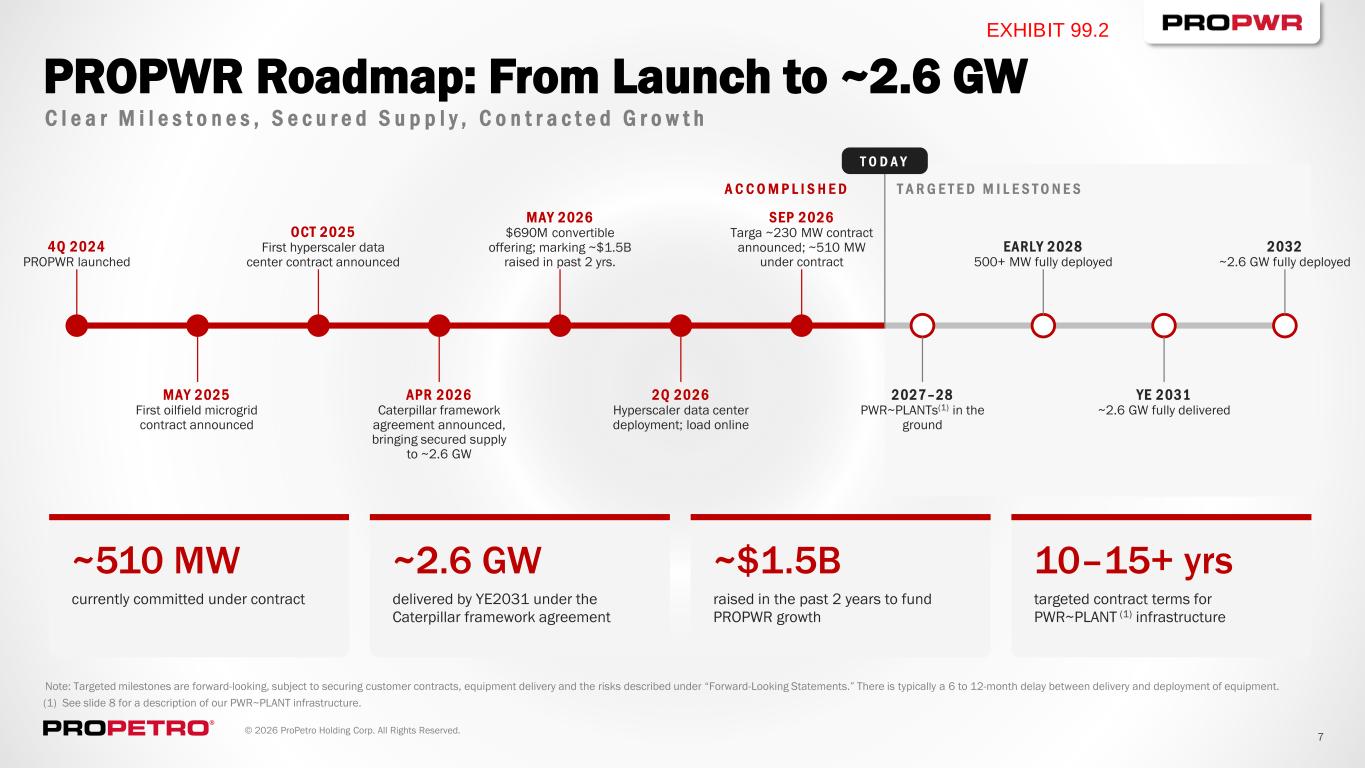
© 2026 ProPetro Holding Corp. All Rights Reserved. 7 SEP 2026 Targa ~230 MW contract announced; ~510 MW under contract PROPWR Roadmap: From Launch to ~2.6 GW C l e a r M i l e s t o n e s , S e c u r e d S u p p l y , C o n t r a c t e d G r o w t h T O D A Y T A R G E T E D M I L E S T O N E SA C C O M P L I S H E D 4Q 2024 PROPWR launched MAY 2025 First oilfield microgrid contract announced O CT 2025 First hyperscaler data center contract announced APR 2026 Caterpillar framework agreement announced, bringing secured supply to ~2.6 GW MAY 2026 $690M convertible offering; marking ~$1.5B raised in past 2 yrs. 2Q 2026 Hyperscaler data center deployment; load online 2027–28 PWR~PLANTs(1) in the ground EARLY 2028 500+ MW fully deployed YE 2031 ~2.6 GW fully delivered 2032 ~2.6 GW fully deployed ~510 MW currently committed under contract ~2.6 GW delivered by YE2031 under the Caterpillar framework agreement ~$1.5B raised in the past 2 years to fund PROPWR growth 10–15+ yrs targeted contract terms for PWR~PLANT (1) infrastructure Note: Targeted milestones are forward-looking, subject to securing customer contracts, equipment delivery and the risks described under “Forward-Looking Statements.” There is typically a 6 to 12-month delay between delivery and deployment of equipment. (1) See slide 8 for a description of our PWR~PLANT infrastructure. EXHIBIT 99.2
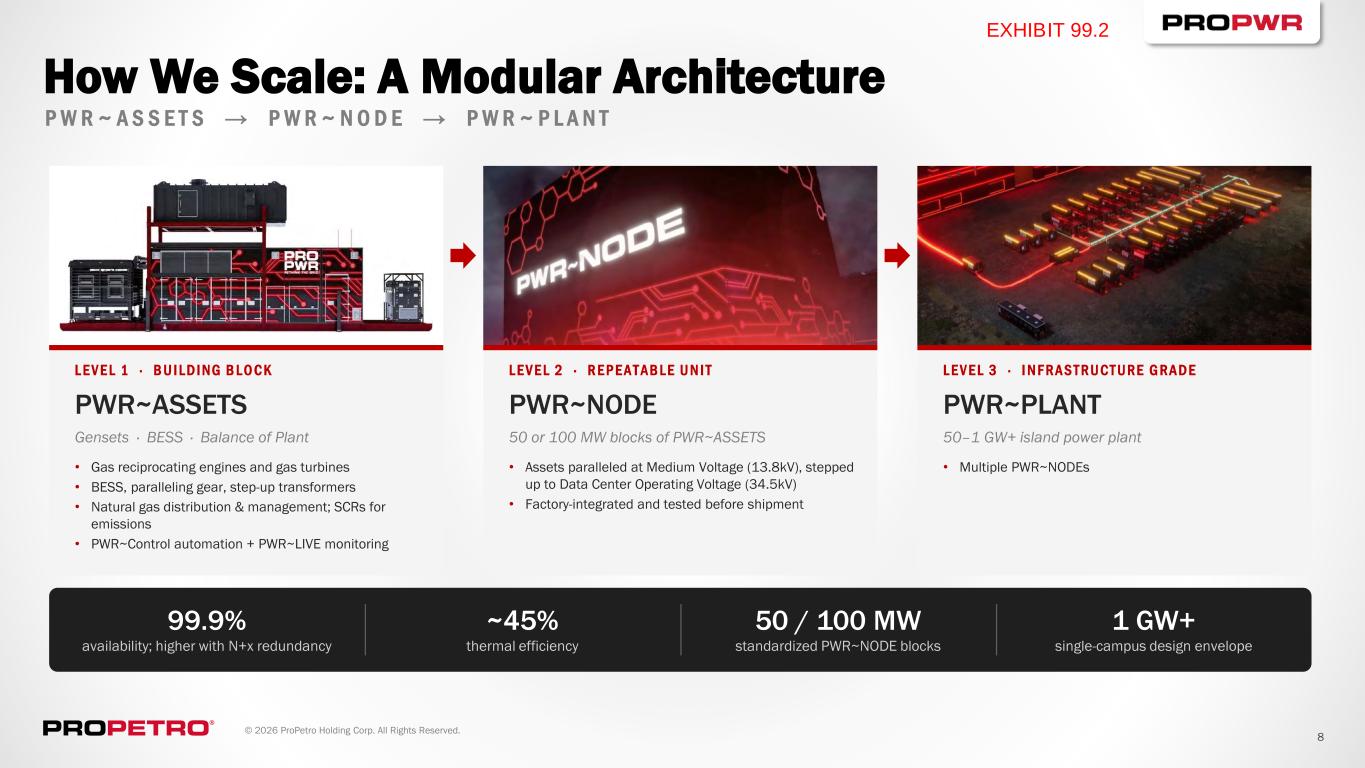
© 2026 ProPetro Holding Corp. All Rights Reserved. 8 How We Scale: A Modular Architecture P W R ~ A S S E T S → P W R ~ N O D E → P W R ~ P L A N T L E V E L 1 · B U I L D I N G B L O C K PWR~ASSETS Gensets · BESS · Balance of Plant • Gas reciprocating engines and gas turbines • BESS, paralleling gear, step-up transformers • Natural gas distribution & management; SCRs for emissions • PWR~Control automation + PWR~LIVE monitoring L E V E L 2 · R E P E A T A B L E U N I T PWR~NODE 50 or 100 MW blocks of PWR~ASSETS • Assets paralleled at Medium Voltage (13.8kV), stepped up to Data Center Operating Voltage (34.5kV) • Factory-integrated and tested before shipment L E V E L 3 · I N F R A S T R U C T U R E G R A D E PWR~PLANT 50–1 GW+ island power plant • Multiple PWR~NODEs 99.9% availability; higher with N+x redundancy ~45% thermal efficiency 50 / 100 MW standardized PWR~NODE blocks 1 GW+ single-campus design envelope EXHIBIT 99.2
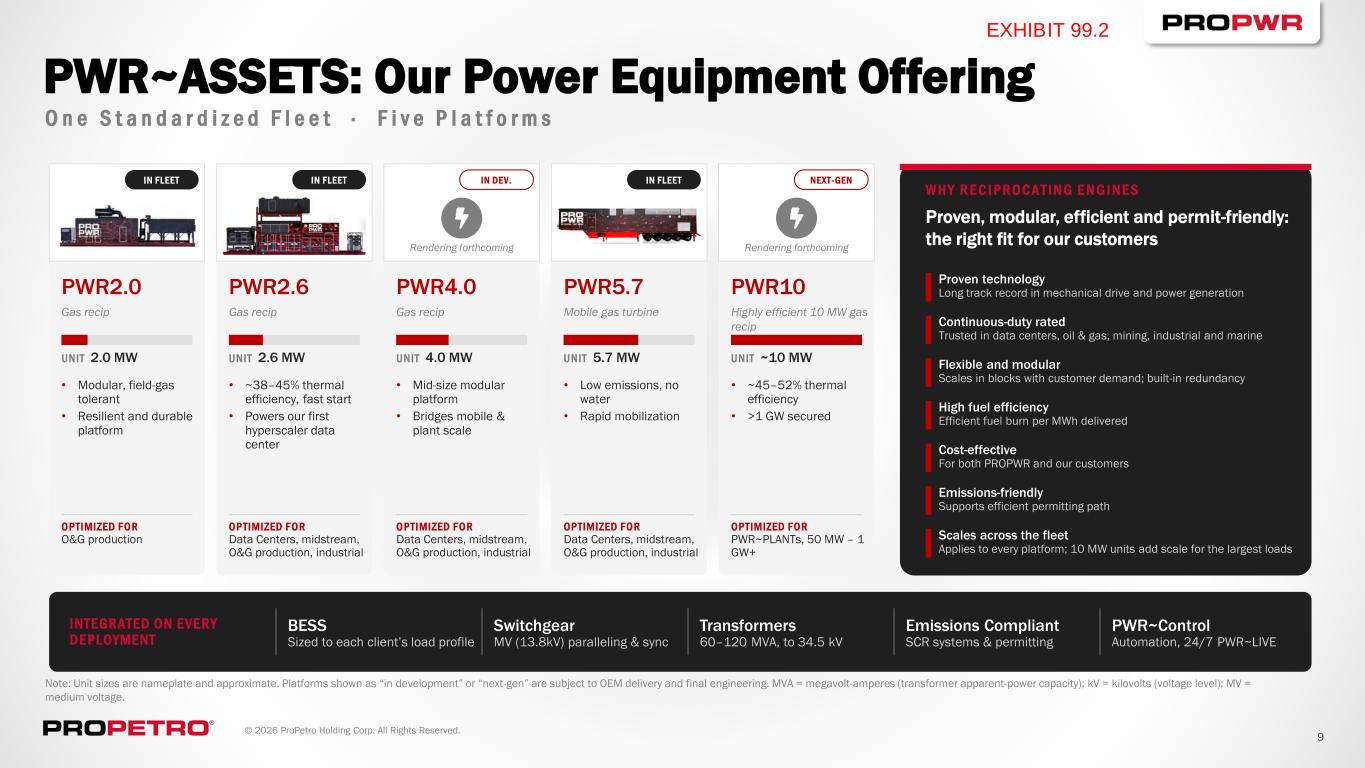
© 2026 ProPetro Holding Corp. All Rights Reserved. 9 PWR~ASSETS: Our Power Equipment Offering O n e S t a n d a r d i z e d F l e e t · F i v e P l a t f o r m s INTEGRATED O N EVERY DEPLOYMENT BESS Sized to each client’s load profile Switchgear MV (13.8kV) paralleling & sync Transformers 60–120 MVA, to 34.5 kV Emissions Compliant SCR systems & permitting PWR~Control Automation, 24/7 PWR~LIVE Note: Unit sizes are nameplate and approximate. Platforms shown as “in development” or “next-gen” are subject to OEM delivery and final engineering. MVA = megavolt-amperes (transformer apparent-power capacity); kV = kilovolts (voltage level); MV = medium voltage. IN FLEET PWR2.0 Gas recip U N IT 2.0 MW • Modular, field-gas tolerant • Resilient and durable platform OPTIMIZED F OR O&G production IN FLEET PWR2.6 Gas recip U N IT 2.6 MW • ~38–45% thermal efficiency, fast start • Powers our first hyperscaler data center OPTIMIZED F OR Data Centers, midstream, O&G production, industrial Rendering forthcoming IN DEV. PWR4.0 Gas recip U N IT 4.0 MW • Mid-size modular platform • Bridges mobile & plant scale OPTIMIZED F OR Data Centers, midstream, O&G production, industrial IN FLEET PWR5.7 Mobile gas turbine U N IT 5.7 MW • Low emissions, no water • Rapid mobilization OPTIMIZED F OR Data Centers, midstream, O&G production, industrial NEXT-GEN PWR10 Highly efficient 10 MW gas recip U N IT ~10 MW • ~45–52% thermal efficiency • >1 GW secured OPTIMIZED F OR PWR~PLANTs, 50 MW – 1 GW+ W H Y R E C I P R O C A T I N G E N G I N E S Proven, modular, efficient and permit-friendly: the right fit for our customers Rendering forthcoming Proven technology Long track record in mechanical drive and power generation Continuous-duty rated Trusted in data centers, oil & gas, mining, industrial and marine Flexible and modular Scales in blocks with customer demand; built-in redundancy High fuel efficiency Efficient fuel burn per MWh delivered Cost-effective For both PROPWR and our customers Emissions-friendly Supports efficient permitting path Scales across the fleet Applies to every platform; 10 MW units add scale for the largest loads EXHIBIT 99.2
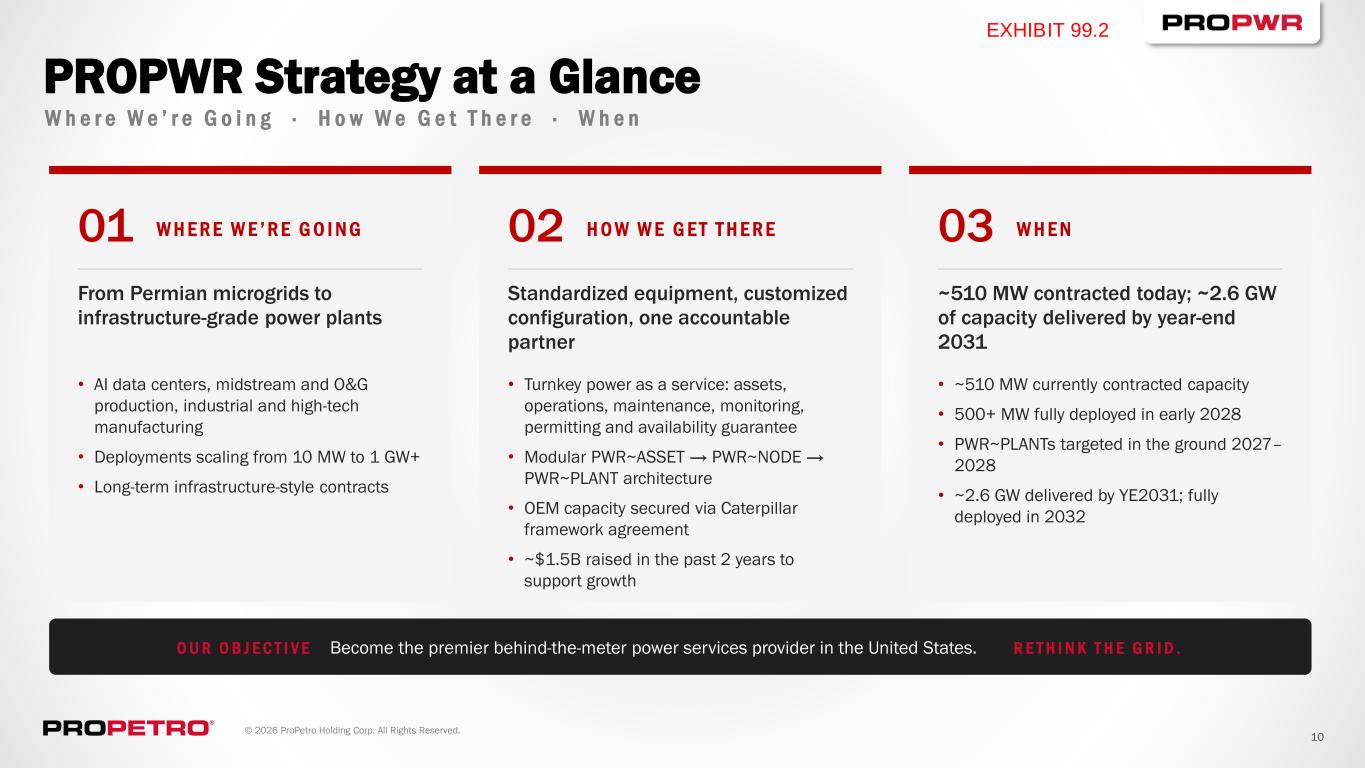
© 2026 ProPetro Holding Corp. All Rights Reserved. 10 PROPWR Strategy at a Glance W h e r e W e ’ r e G o i n g · H o w W e G e t T h e r e · W h e n 01 W H E R E W E ’ R E G O I N G From Permian microgrids to infrastructure-grade power plants • AI data centers, midstream and O&G production, industrial and high-tech manufacturing • Deployments scaling from 10 MW to 1 GW+ • Long-term infrastructure-style contracts 02 H O W W E G E T T H E R E Standardized equipment, customized configuration, one accountable partner • Turnkey power as a service: assets, operations, maintenance, monitoring, permitting and availability guarantee • Modular PWR~ASSET → PWR~NODE → PWR~PLANT architecture • OEM capacity secured via Caterpillar framework agreement • ~$1.5B raised in the past 2 years to support growth 03 W H E N ~510 MW contracted today; ~2.6 GW of capacity delivered by year-end 2031 • ~510 MW currently contracted capacity • 500+ MW fully deployed in early 2028 • PWR~PLANTs targeted in the ground 2027– 2028 • ~2.6 GW delivered by YE2031; fully deployed in 2032 O U R O B J E C T I V E Become the premier behind-the-meter power services provider in the United States. R E T H I N K T H E G R I D . EXHIBIT 99.2
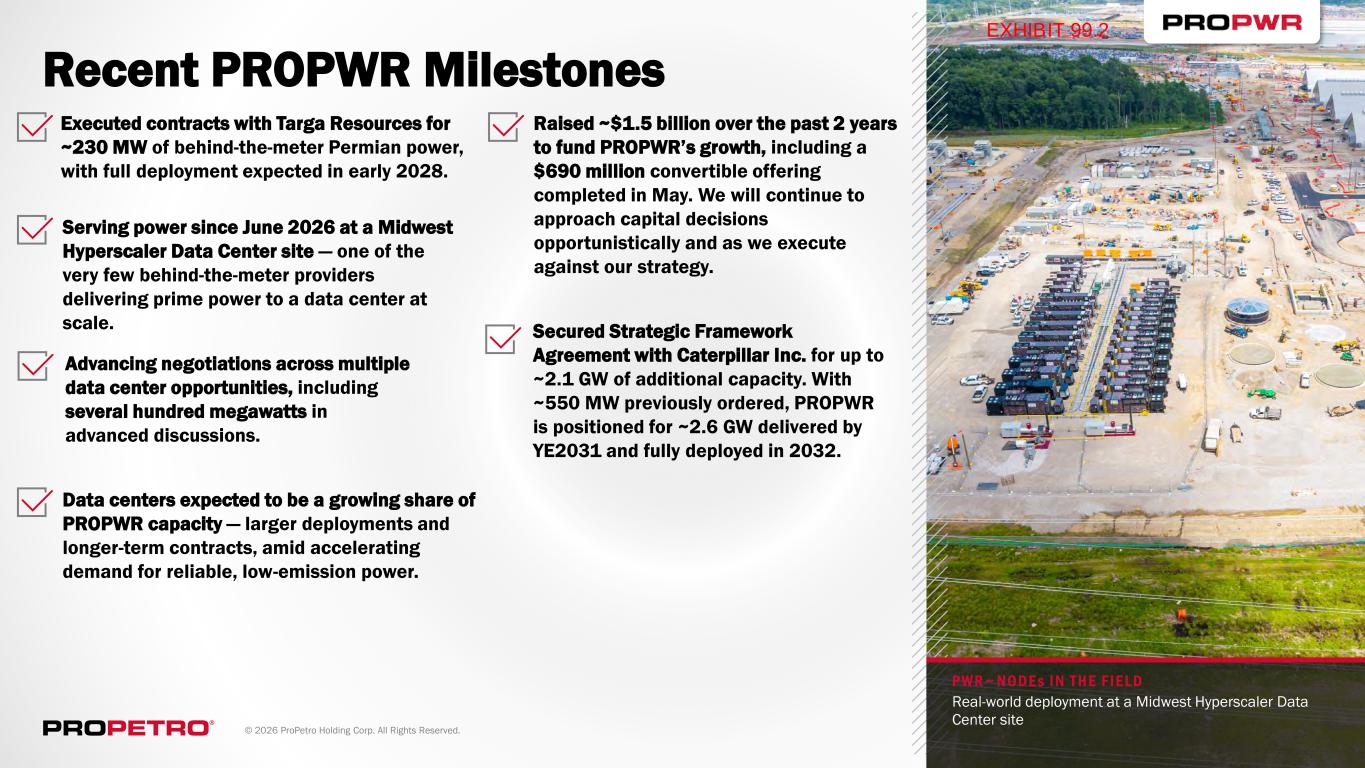
© 2026 ProPetro Holding Corp. All Rights Reserved. 11 Recent PROPWR Milestones Secured Strategic Framework Agreement with Caterpillar Inc. for up to ~2.1 GW of additional capacity. With ~550 MW previously ordered, PROPWR is positioned for ~2.6 GW delivered by YE2031 and fully deployed in 2032. Serving power since June 2026 at a Midwest Hyperscaler Data Center site — one of the very few behind-the-meter providers delivering prime power to a data center at scale. Data centers expected to be a growing share of PROPWR capacity — larger deployments and longer-term contracts, amid accelerating demand for reliable, low-emission power. Executed contracts with Targa Resources for ~230 MW of behind-the-meter Permian power, with full deployment expected in early 2028. Raised ~$1.5 billion over the past 2 years to fund PROPWR’s growth, including a $690 million convertible offering completed in May. We will continue to approach capital decisions opportunistically and as we execute against our strategy. Advancing negotiations across multiple data center opportunities, including several hundred megawatts in advanced discussions. P W R ~ N O D E s I N T H E F I E L D Real-world deployment at a Midwest Hyperscaler Data Center site EXHIBIT 99.2
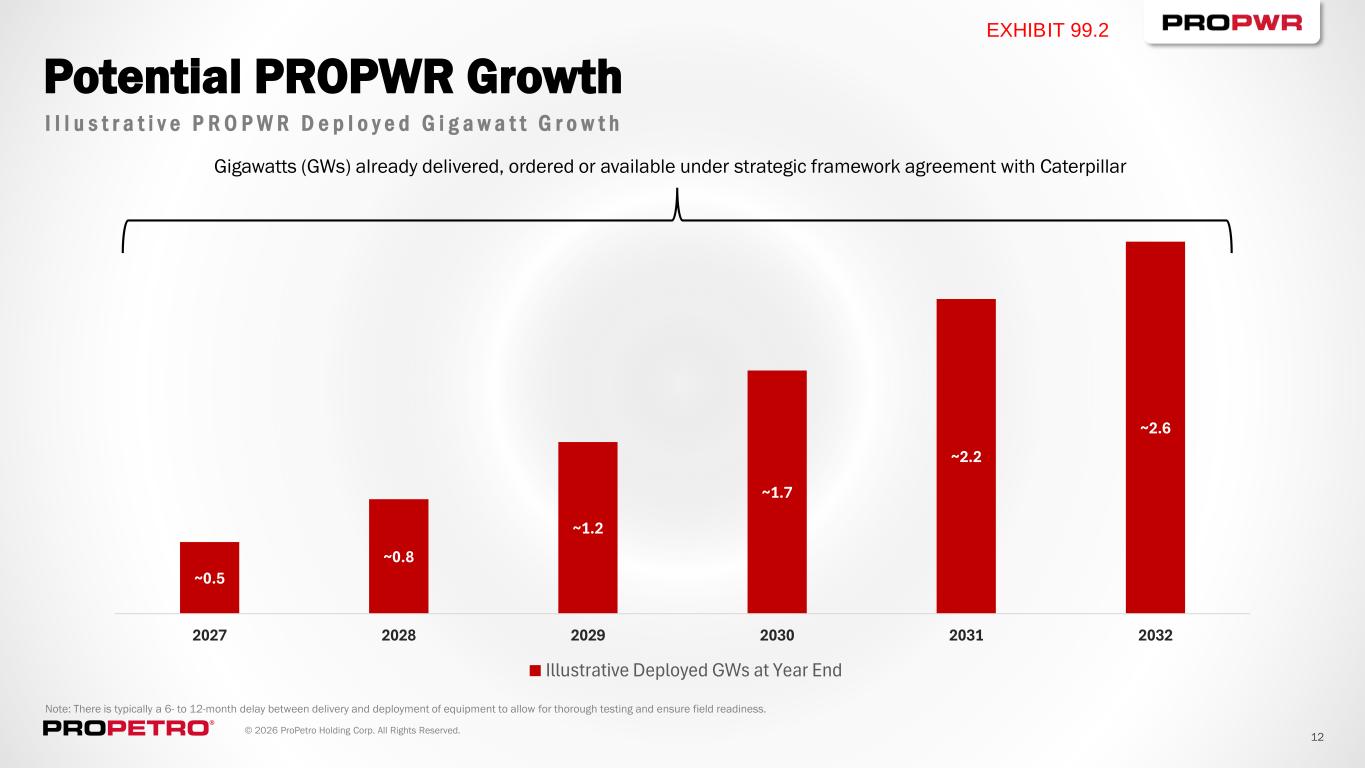
© 2026 ProPetro Holding Corp. All Rights Reserved. 12 ~0.5 ~0.8 ~1.2 ~1.7 ~2.2 ~2.6 2027 2028 2029 2030 2031 2032 Illustrative Deployed GWs at Year End Potential PROPWR Growth I l l u s t r a t i v e P R O P W R D e p l o y e d G i g a w a t t G r o w t h Note: There is typically a 6- to 12-month delay between delivery and deployment of equipment to allow for thorough testing and ensure field readiness. Gigawatts (GWs) already delivered, ordered or available under strategic framework agreement with Caterpillar EXHIBIT 99.2
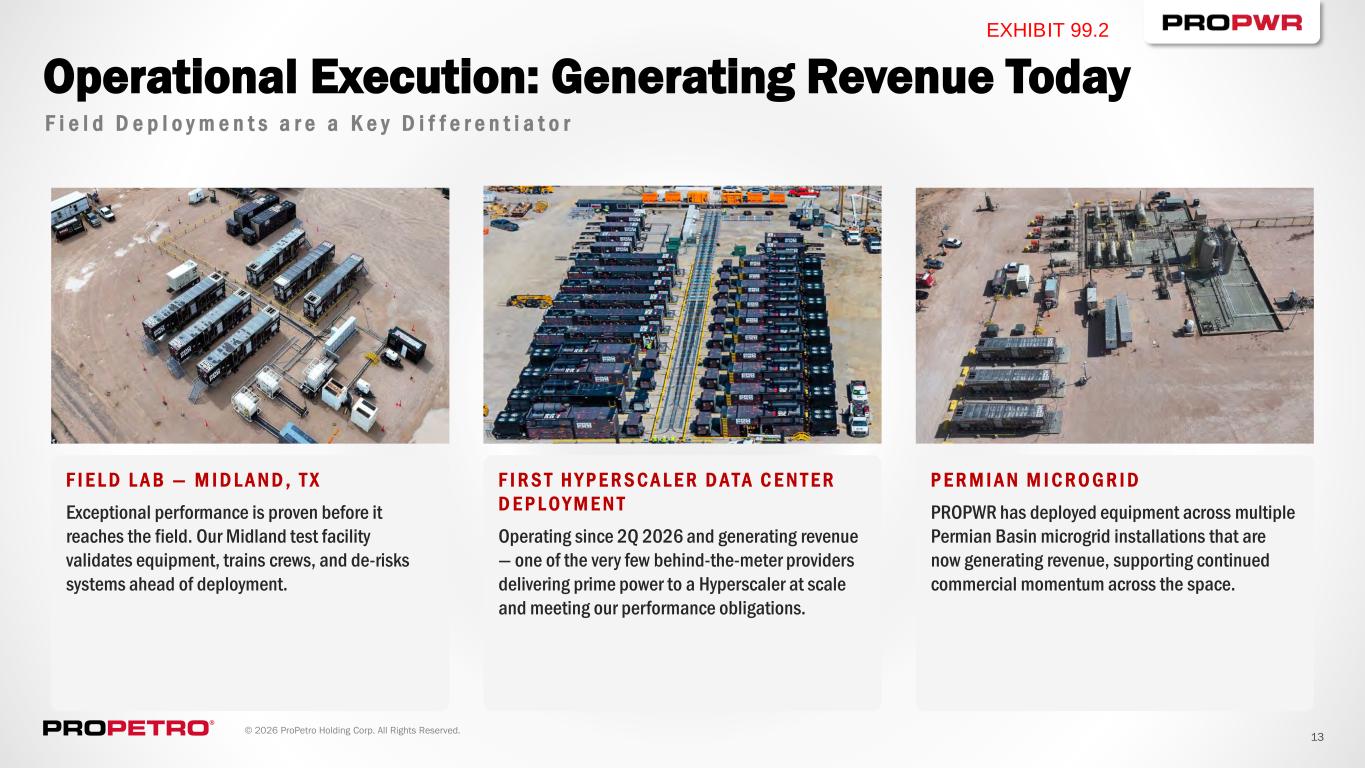
© 2026 ProPetro Holding Corp. All Rights Reserved. 13 Operational Execution: Generating Revenue Today F i e l d D e p l o y m e n t s a r e a K e y D i f f e r e n t i a t o r F I E L D L A B — M I D L A N D , T X Exceptional performance is proven before it reaches the field. Our Midland test facility validates equipment, trains crews, and de-risks systems ahead of deployment. F I R S T H Y P E R S C A L E R D A T A C E N T E R D E P L O Y M E N T Operating since 2Q 2026 and generating revenue — one of the very few behind-the-meter providers delivering prime power to a Hyperscaler at scale and meeting our performance obligations. P E R M I A N M I C R O G R I D PROPWR has deployed equipment across multiple Permian Basin microgrid installations that are now generating revenue, supporting continued commercial momentum across the space. EXHIBIT 99.2
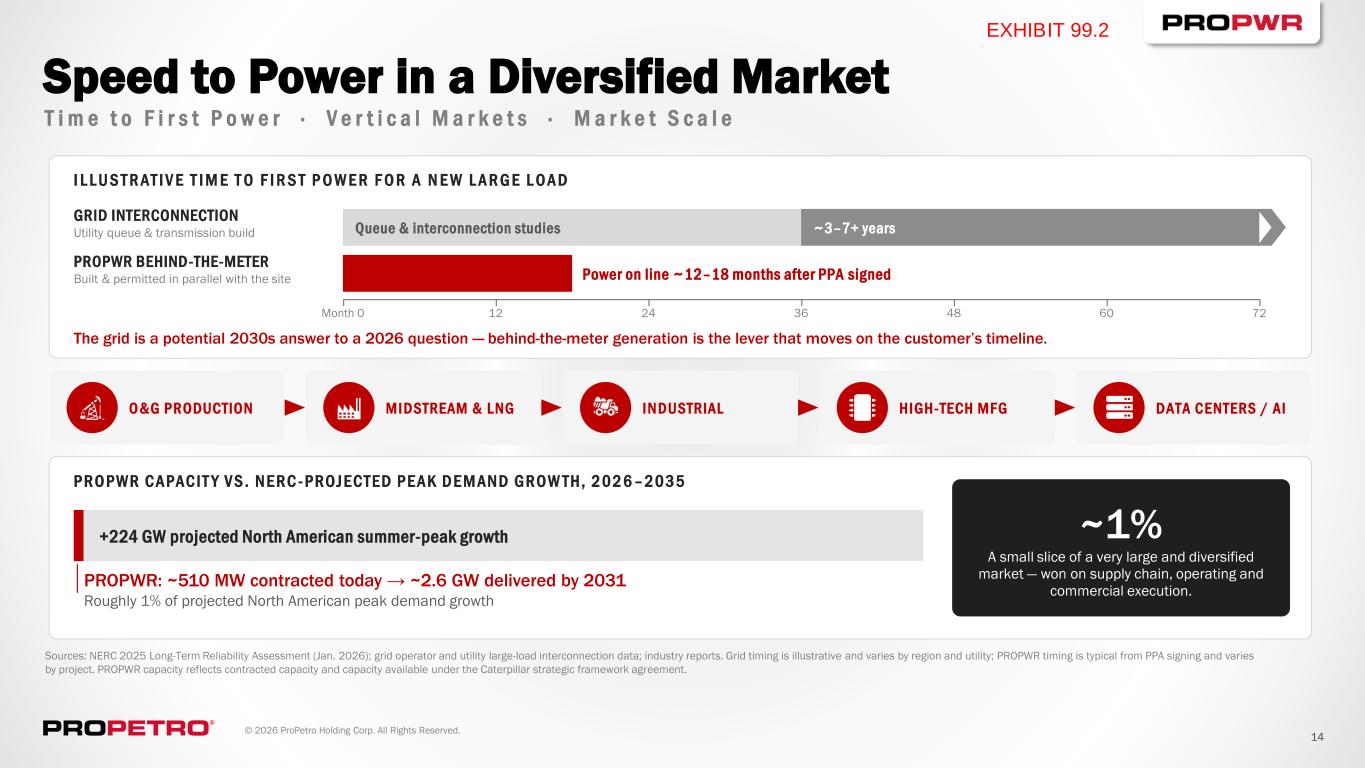
© 2026 ProPetro Holding Corp. All Rights Reserved. 14 Speed to Power in a Diversified Market T i m e t o F i r s t P o w e r · V e r t i c a l M a r k e t s · M a r k e t S c a l e I L L U S T R A T I V E T I M E T O F I R S T P O W E R F O R A N E W L A R G E L O A D GRID INTERCONNECTION Utility queue & transmission build Queue & interconnection studies ~3–7+ years PROPWR BEHIND-THE-METER Built & permitted in parallel with the site Power on line ~12–18 months after PPA signed Month 0 12 24 36 48 60 72 The grid is a potential 2030s answer to a 2026 question — behind-the-meter generation is the lever that moves on the customer’s timeline. O&G PRODUCTION MIDSTREAM & LNG INDUSTRIAL HIGH-TECH MFG DATA CENTERS / AI P R O P W R C A PA C I T Y V S . N E R C - P RO J E C T E D P E A K D E M A N D G R O W T H , 2 0 2 6 – 2 0 3 5 +224 GW projected North American summer-peak growth PROPWR: ~510 MW contracted today → ~2.6 GW delivered by 2031 Roughly 1% of projected North American peak demand growth ~1% A small slice of a very large and diversified market — won on supply chain, operating and commercial execution. Sources: NERC 2025 Long-Term Reliability Assessment (Jan. 2026); grid operator and utility large-load interconnection data; industry reports. Grid timing is illustrative and varies by region and utility; PROPWR timing is typical from PPA signing and varies by project. PROPWR capacity reflects contracted capacity and capacity available under the Caterpillar strategic framework agreement. EXHIBIT 99.2
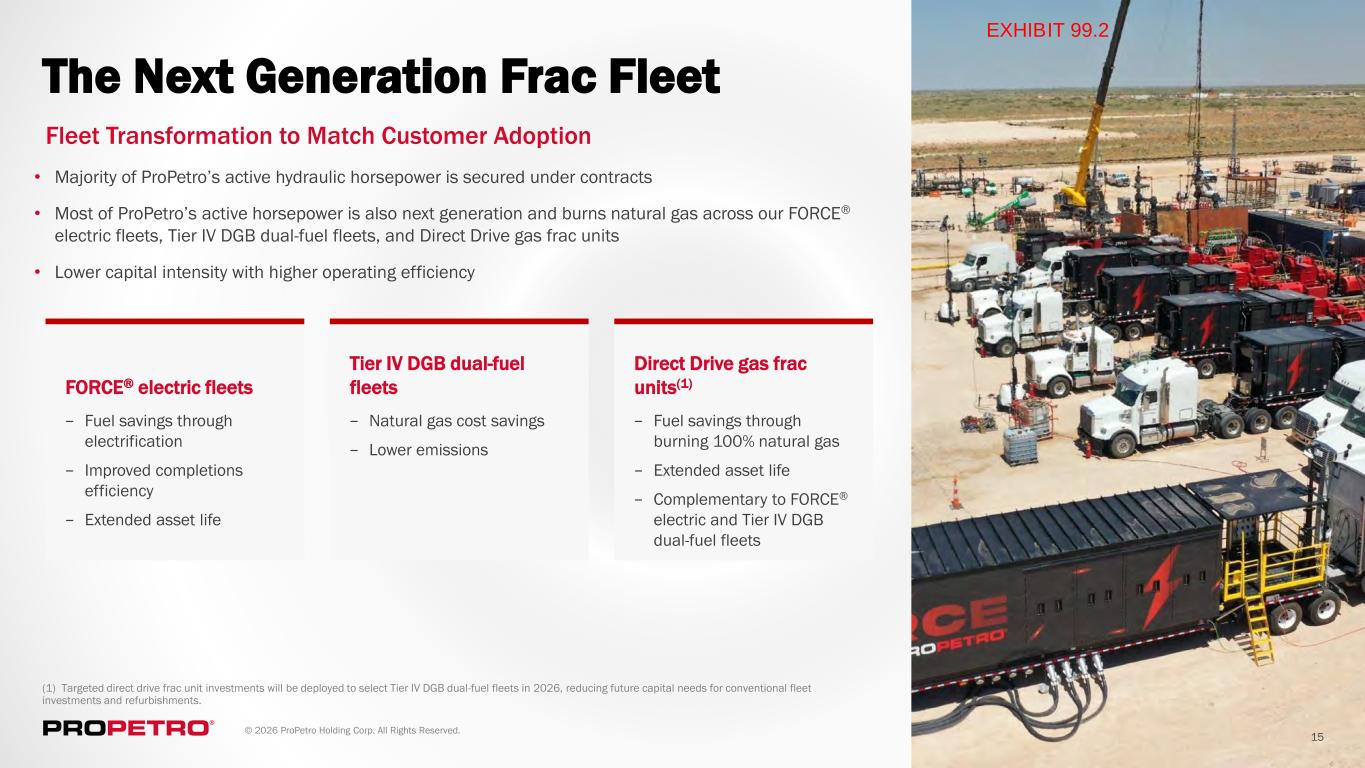
© 2026 ProPetro Holding Corp. All Rights Reserved. 15 The Next Generation Frac Fleet • Majority of ProPetro’s active hydraulic horsepower is secured under contracts • Most of ProPetro’s active horsepower is also next generation and burns natural gas across our FORCE® electric fleets, Tier IV DGB dual-fuel fleets, and Direct Drive gas frac units • Lower capital intensity with higher operating efficiency Fleet Transformation to Match Customer Adoption (1) Targeted direct drive frac unit investments will be deployed to select Tier IV DGB dual-fuel fleets in 2026, reducing future capital needs for conventional fleet investments and refurbishments. FORCE® electric fleets − Fuel savings through electrification − Improved completions efficiency − Extended asset life Tier IV DGB dual-fuel fleets − Natural gas cost savings − Lower emissions Direct Drive gas frac units(1) − Fuel savings through burning 100% natural gas − Extended asset life − Complementary to FORCE® electric and Tier IV DGB dual-fuel fleets EXHIBIT 99.2
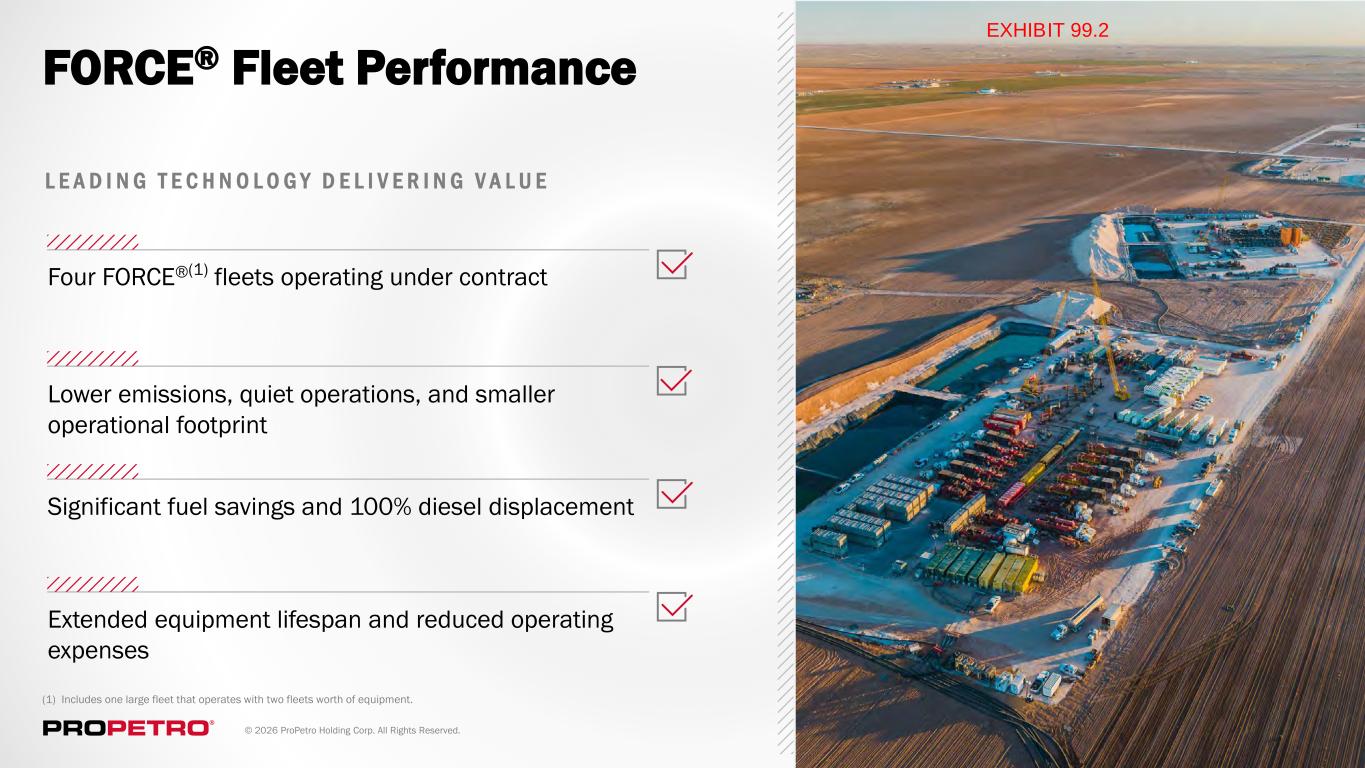
© 2026 ProPetro Holding Corp. All Rights Reserved. 16 FORCE® Fleet Performance Four FORCE®(1) fleets operating under contract Lower emissions, quiet operations, and smaller operational footprint Significant fuel savings and 100% diesel displacement L E A D I N G T E C H N O L O G Y D E L I V E R I N G V A L U E Extended equipment lifespan and reduced operating expenses (1) Includes one large fleet that operates with two fleets worth of equipment. EXHIBIT 99.2

© 2026 ProPetro Holding Corp. All Rights Reserved. 17 Committed to Shareholder Value Creation Board of DirectorsCompany Management Phillip A. Gobe Independent Chairman of the Board Anthony Best Independent Director, Audit Committee Chair Michele Vion Independent Director, Compensation Committee Chair G. Larry Lawrence Independent Director Adam Muñoz President and Chief Operating Officer Jody Mitchell General Counsel Sam Sledge Chief Executive Officer & Director Mary Ricciardello Independent Director Caleb Weatherl Chief Financial Officer Shelby Fietz Chief Commercial Officer O U R L E A D E R S H I P Mark Berg Independent Director, Nominating & Corporate Governance Committee Chair Kyle Crowley Independent Director EXHIBIT 99.2

© 2026 ProPetro Holding Corp. All Rights Reserved. 18 Investor Contacts INVESTOR RELATIONS MATT AUGUSTINE Vice President, Finance and Investor Relations matt.augustine@propetroservices.com 432.219.7620 CORPORATE HEADQUARTERS One Marienfeld Place 110 North Marienfeld, Suite 300 Midland, TX 79701 432.688.0012 www.propetroservices.com EXHIBIT 99.2