Pay vs Performance Disclosure - USD ($)
|
12 Months Ended |
Jun. 30, 2026 |
Jun. 30, 2025 |
Jun. 30, 2024 |
| Pay vs Performance Disclosure |
|
|
|
| Pay vs Performance Disclosure, Table |
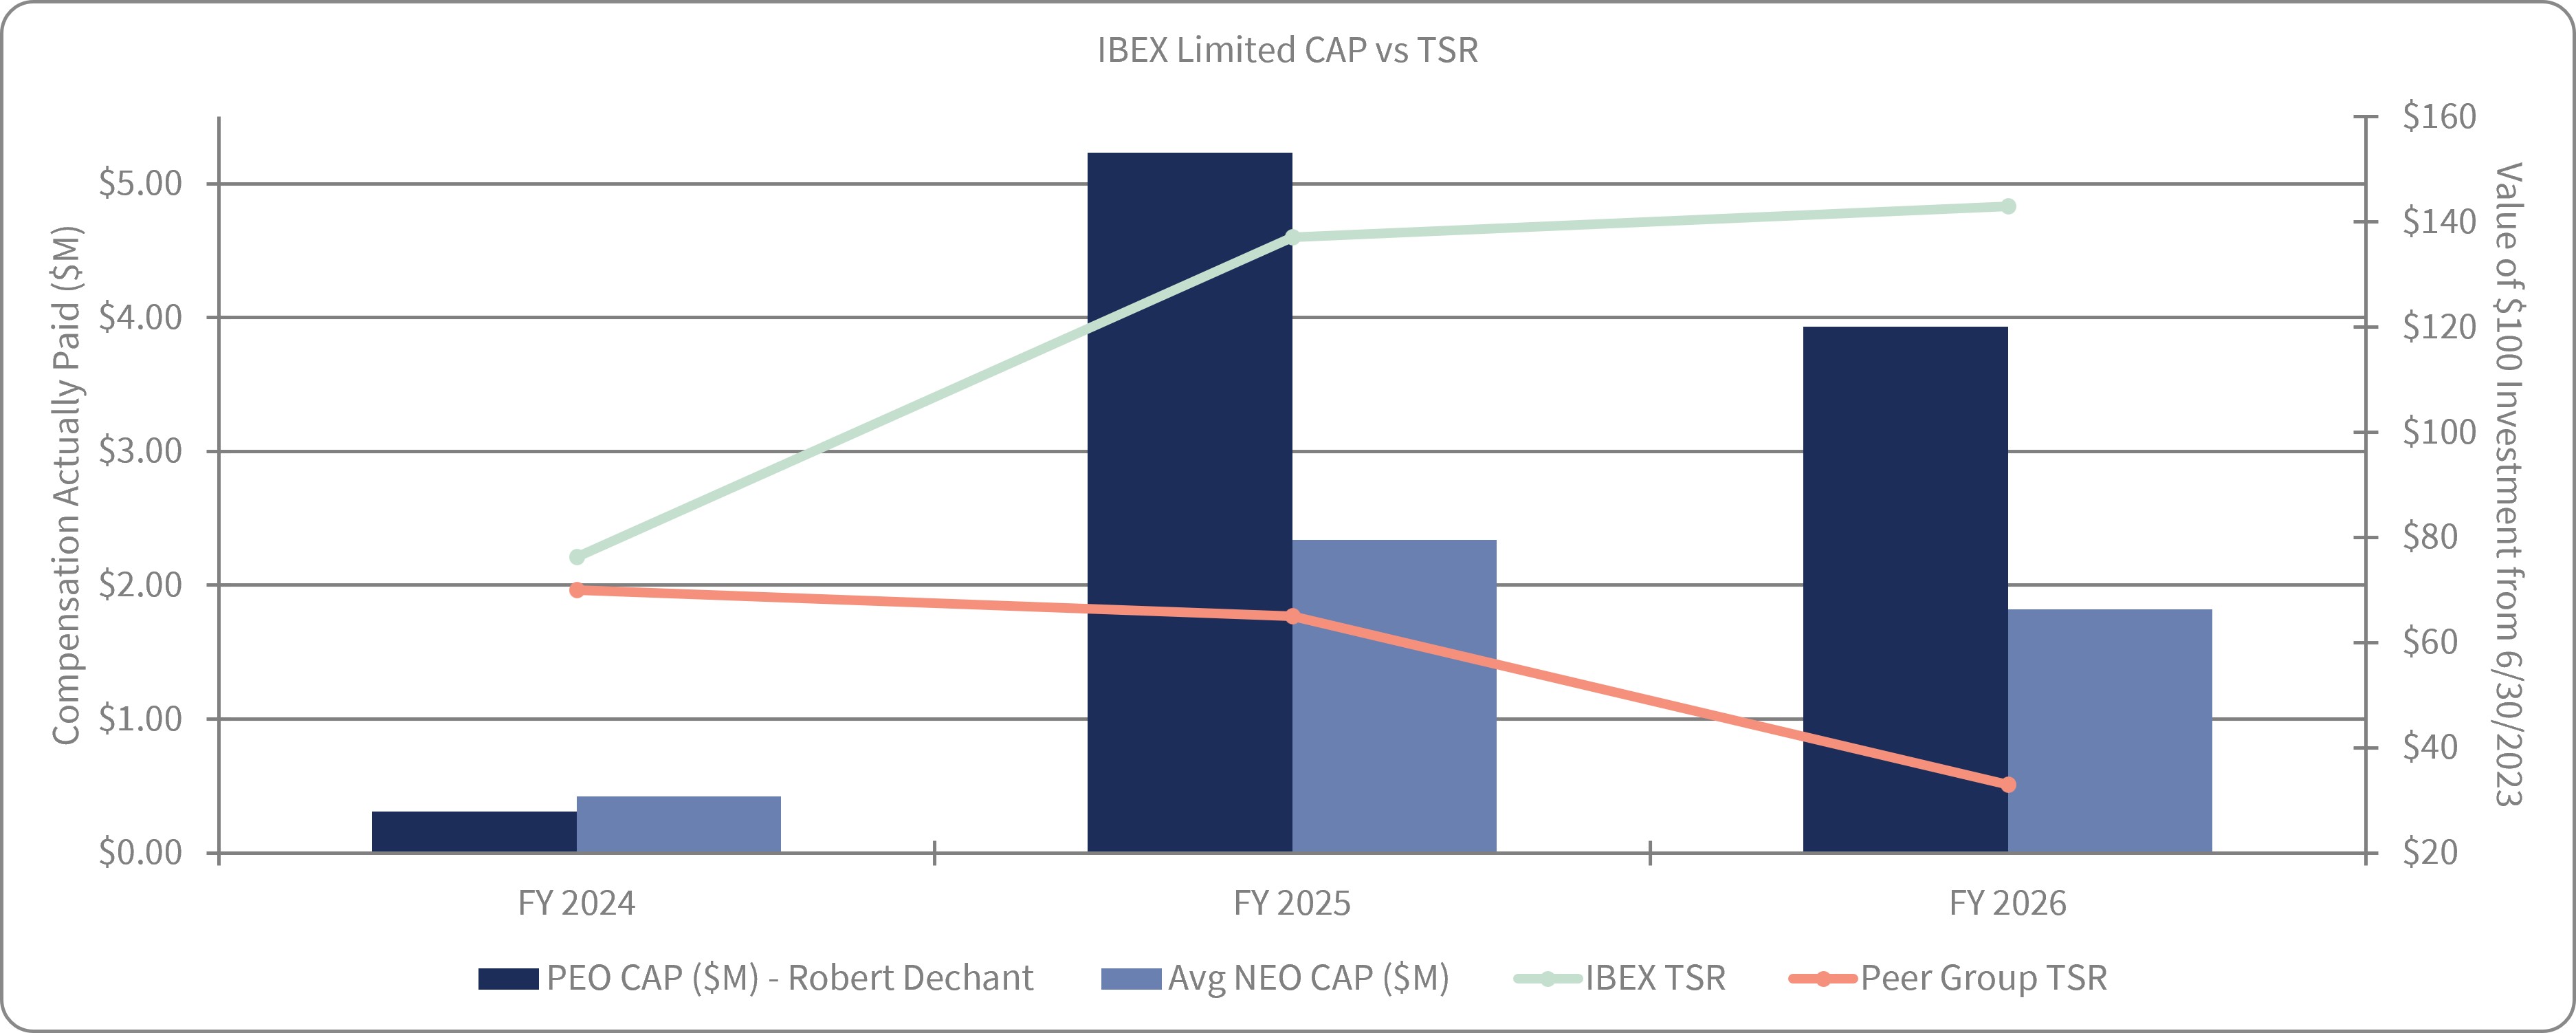
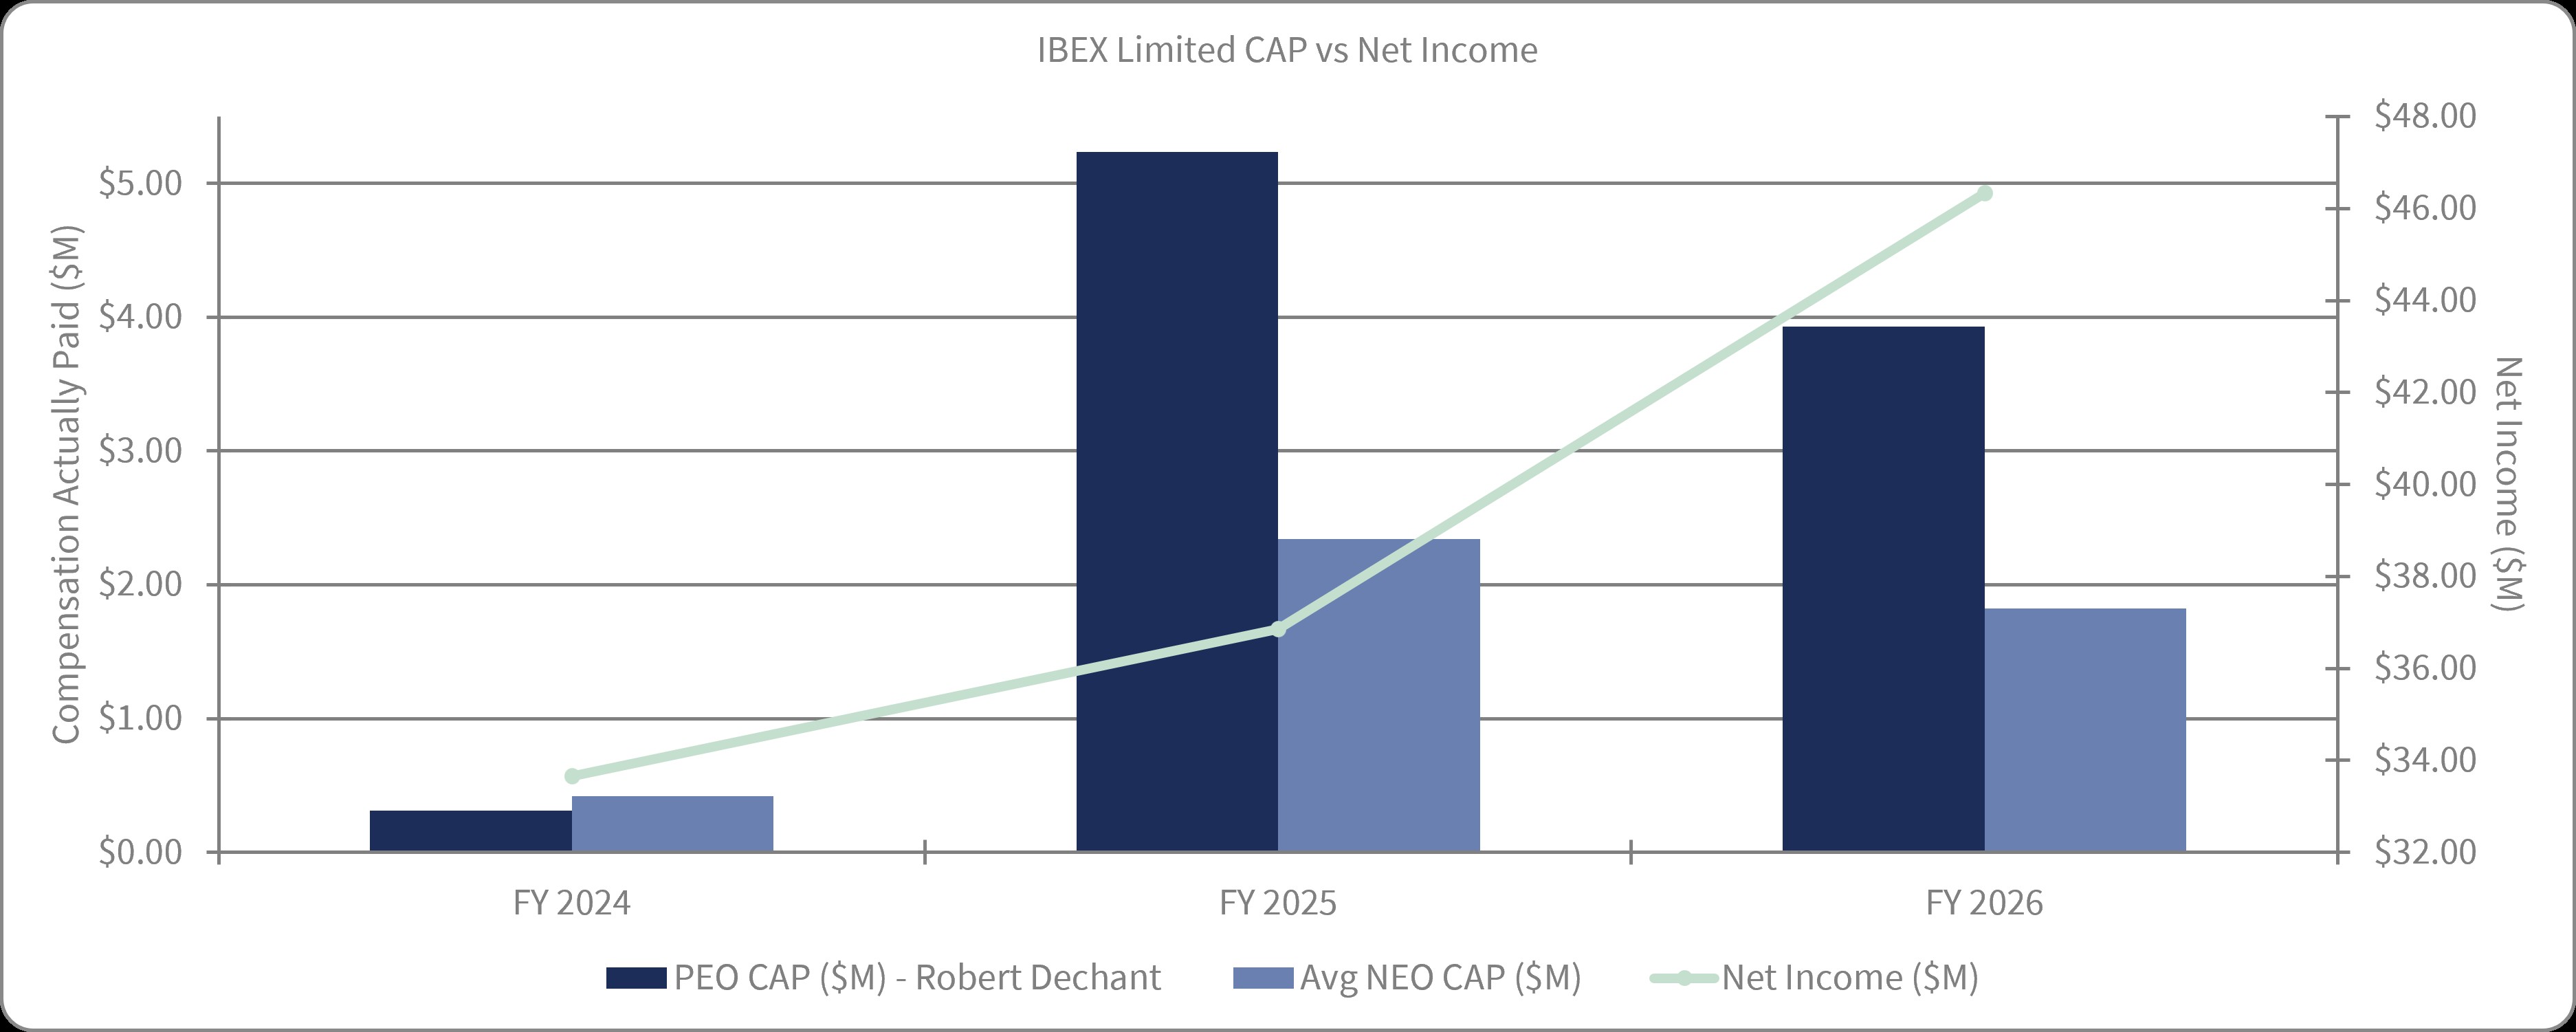
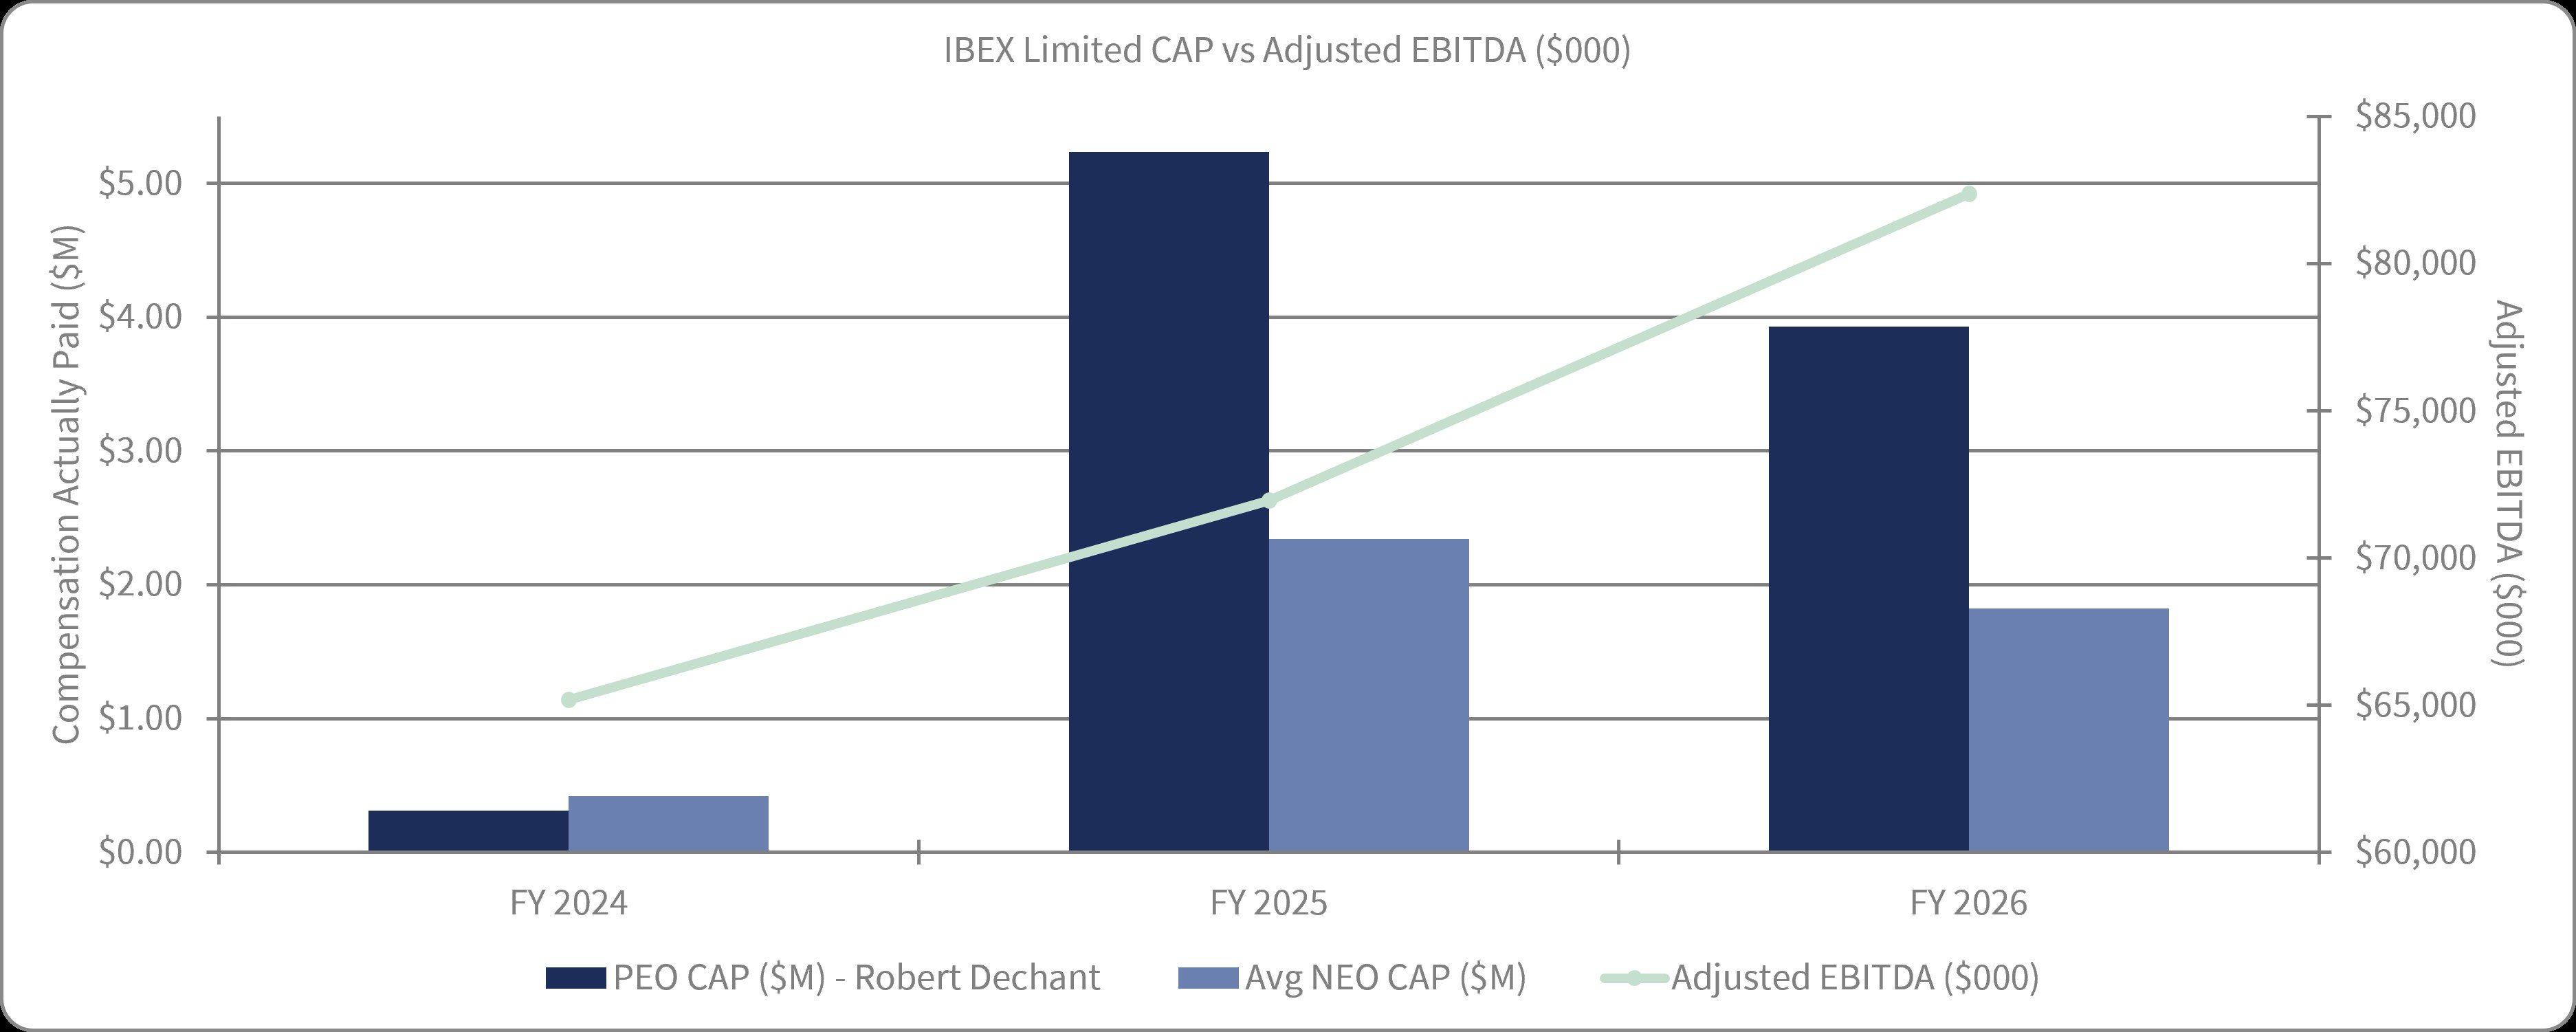
| | | | | | | | | | | | | | | | | | | | | | | | | | | | Fiscal Year | Summary Compensation Table Total for PEO Robert Dechant | Compensation Actually Paid to PEO Robert Dechant (1) | Average Summary Compensation Table Total for non-PEO NEOs | Average Compensation Actually Paid to non-PEO NEOs (1) | Value of Initial Fixed $100 Investment Based On: | Net Income ($M) (4) | Company Selected Measure:Adjusted EBITDA ($000) (5) | IBEX Total Shareholder Return (2) | Peer Group Total Shareholder Return (3) | | | | | | | | | | | 2026 | $2,970,260 | $3,924,513 | $1,671,063 | $1,820,705 | $143 | $33 | $46.33 | $82,372 | | 2025 | $2,663,006 | $5,233,732 | $1,072,522 | $2,340,335 | $137 | $65 | $36.86 | $71,955 | | 2024 | $1,040,179 | $311,019 | $797,944 | $420,810 | $76 | $70 | $33.66 | $65,176 |
|
|
|
| Company Selected Measure Name |
Adjusted EBITDA
|
|
|
| Named Executive Officers, Footnote |
Mr. Dechant served as our principal executive officer ("PEO") for the full fiscal year for each of 2026, 2025 and 2024. For fiscal year 2026, our non-PEO named executive officers included Messrs. Greenwald, Afdahl, Darwal, and Ringman. For fiscal years 2025 and 2024, our non-PEO named executive officers included Messrs. Greenwald, Afdahl, and Bruce Dawson and Julie Casteel.
|
|
|
| Peer Group Issuers, Footnote |
For purposes of this pay versus performance disclosure, our peer group is comprised of Concentrix Corporation (Nasdaq: CNXC), TaskUs, Inc. (Nasdaq: TASK), Teleperformance (Euronext Paris: TEP), TTEC Holdings, Inc. (Nasdaq: TTEC), ExlService Holdings, Inc. (Nasdaq: EXLS) and Conduent Incorporated (Nasdaq: CNDT) (the “Peer Group”). For each of fiscal 2026, 2025 and 2024, our Peer Group TSR was calculated based on a deemed fixed investment of $100 through the Measurement Period, assuming dividend reinvestment for the entities in our Peer Group.
|
|
|
| PEO Total Compensation Amount |
$ 2,970,260
|
$ 2,663,006
|
$ 1,040,179
|
| PEO Actually Paid Compensation Amount |
$ 3,924,513
|
5,233,732
|
311,019
|
| Adjustment To PEO Compensation, Footnote |
For each of fiscal year 2026, 2025 and 2024, the values included in this column for the compensation actually paid to our PEO, Robert Dechant, and the average compensation actually paid to our non-PEO NEOs reflect the following adjustments: | | | | | | | | | | | | | PEO: Robert Dechant | | Prior FYE | 06/30/2023 | 06/30/2024 | 06/30/2025 | | Current FYE | 06/30/2024 | 06/30/2025 | 06/30/2026 | | Fiscal Year | 2024 | 2025 | 2026 | | | | | | Summary Compensation Table Total | $1,040,179 | $2,663,006 | $2,970,260 | | - Grant Date Fair Value of Option Awards and Stock Awards Granted in Fiscal Year | $0 | $(997,845) | $(1,233,360) | | + Fair Value at Fiscal Year-End of Outstanding and Unvested Option Awards and Stock Awards Granted in Fiscal Year | $0 | $1,790,087 | $1,408,846 | | + Change in Fair Value of Outstanding and Unvested Option Awards and Stock Awards Granted in Prior Fiscal Years | $(727,563) | $1,778,484 | $256,596 | | + Fair Value at Vesting of Option Awards and Stock Awards Granted in Fiscal Year That Vested During Fiscal Year | $0 | $0 | $0 | | + Change in Fair Value as of Vesting Date of Option Awards and Stock Awards Granted in Prior Fiscal Years For Which Applicable Vesting Conditions Were Satisfied During Fiscal Year | $(1,597) | $0 | $522,171 | | - Fair Value as of Prior Fiscal Year-End of Option Awards and Stock Awards Granted in Prior Fiscal Years That Failed to Meet Applicable Vesting Conditions During Fiscal Year | $0 | $0 | $0 | | Compensation Actually Paid | $311,019 | $5,233,732 | $3,924,513 |
|
|
|
| Non-PEO NEO Average Total Compensation Amount |
$ 1,671,063
|
1,072,522
|
797,944
|
| Non-PEO NEO Average Compensation Actually Paid Amount |
$ 1,820,705
|
2,340,335
|
420,810
|
| Adjustment to Non-PEO NEO Compensation Footnote |
| | | | | | | | | | | | | Non-PEO NEOs Average | | Prior FYE | 06/30/2023 | 06/30/2024 | 06/30/2025 | | Current FYE | 06/30/2024 | 06/30/2025 | 06/30/2026 | | Fiscal Year | 2024 | 2025 | 2026 | | Summary Compensation Table Total | $797,944 | $1,072,522 | $1,671,063 | | - Grant Date Fair Value of Option Awards and Stock Awards Granted in Fiscal Year | $(214,075) | $(238,389) | $(923,017) | | + Fair Value at Fiscal Year-End of Outstanding and Unvested Option Awards and Stock Awards Granted in Fiscal Year | $202,250 | $427,660 | $889,583 | | + Change in Fair Value of Outstanding and Unvested Option Awards and Stock Awards Granted in Prior Fiscal Years | $(365,308) | $1,071,885 | $59,148 | | + Fair Value at Vesting of Option Awards and Stock Awards Granted in Fiscal Year That Vested During Fiscal Year | $0 | $0 | $0 | | + Change in Fair Value as of Vesting Date of Option Awards and Stock Awards Granted in Prior Fiscal Years For Which Applicable Vesting Conditions Were Satisfied During Fiscal Year | $0 | $6,656 | $123,928 | | - Fair Value as of Prior Fiscal Year-End of Option Awards and Stock Awards Granted in Prior Fiscal Years That Failed to Meet Applicable Vesting Conditions During Fiscal Year | $0 | $0 | $0 | | Compensation Actually Paid | $420,810 | $2,340,335 | $1,820,705 |
|
|
|
| Compensation Actually Paid vs. Total Shareholder Return |
|
|
|
| Compensation Actually Paid vs. Net Income |
|
|
|
| Compensation Actually Paid vs. Company Selected Measure |
|
|
|
| Tabular List, Table |
The following table lists the three financial performance measures that we believe represent the most important financial performance measures we used to link compensation actually paid to our NEOs for fiscal 2026 to our performance:
| | | Adjusted EBITDA | Revenue | Relative Total Shareholder Return |
|
|
|
| Total Shareholder Return Amount |
$ 143
|
137
|
76
|
| Peer Group Total Shareholder Return Amount |
33
|
65
|
70
|
| Net Income (Loss) |
$ 46.33
|
$ 36.86
|
$ 33.66
|
| Company Selected Measure Amount |
82,372
|
71,955
|
65,176
|
| PEO Name |
Mr. Dechant
|
Mr. Dechant
|
Mr. Dechant
|
| Additional 402(v) Disclosure |
For each of 2026, 2025 and 2024, our total shareholder return was calculated as the yearly percentage change in our cumulative total shareholder return on our common stock, measured as the quotient of (a) the sum of (i) the cumulative amount of dividends for a period beginning with our closing price on the Nasdaq Stock Market on June 30, 2023 through and including the last day of the fiscal year covered (the “Measurement Period”), assuming dividend reinvestment, plus (ii) the difference between our stock price at the end and the beginning of the Measurement Period, divided by (b) our stock price at the beginning of the Measurement Period. Each of these yearly percentage changes was then applied to a deemed fixed investment of $100 at the beginning of the Measurement Period to produce the year-end values of such investment as of the end of fiscal 2026, 2025 and 2024, as applicable. Because fiscal years are presented in the table in reverse chronological order (from top to bottom), the table should be read from bottom to top for purposes of understanding cumulative returns over time.Net income is calculated in accordance with GAAP.Adjusted EBITDA is calculated as set forth in Appendix A.
|
|
|
| Measure:: 1 |
|
|
|
| Pay vs Performance Disclosure |
|
|
|
| Name |
Adjusted EBITDA
|
|
|
| Measure:: 2 |
|
|
|
| Pay vs Performance Disclosure |
|
|
|
| Name |
Revenue
|
|
|
| Measure:: 3 |
|
|
|
| Pay vs Performance Disclosure |
|
|
|
| Name |
Relative Total Shareholder Return
|
|
|
| PEO | Aggregate Grant Date Fair Value of Equity Award Amounts Reported in Summary Compensation Table |
|
|
|
| Pay vs Performance Disclosure |
|
|
|
| Adjustment to Compensation, Amount |
$ (1,233,360)
|
$ (997,845)
|
$ 0
|
| PEO | Year-end Fair Value of Equity Awards Granted in Covered Year that are Outstanding and Unvested |
|
|
|
| Pay vs Performance Disclosure |
|
|
|
| Adjustment to Compensation, Amount |
1,408,846
|
1,790,087
|
0
|
| PEO | Year-over-Year Change in Fair Value of Equity Awards Granted in Prior Years That are Outstanding and Unvested |
|
|
|
| Pay vs Performance Disclosure |
|
|
|
| Adjustment to Compensation, Amount |
256,596
|
1,778,484
|
(727,563)
|
| PEO | Vesting Date Fair Value of Equity Awards Granted and Vested in Covered Year |
|
|
|
| Pay vs Performance Disclosure |
|
|
|
| Adjustment to Compensation, Amount |
0
|
0
|
0
|
| PEO | Change in Fair Value as of Vesting Date of Prior Year Equity Awards Vested in Covered Year |
|
|
|
| Pay vs Performance Disclosure |
|
|
|
| Adjustment to Compensation, Amount |
522,171
|
0
|
(1,597)
|
| PEO | Prior Year End Fair Value of Equity Awards Granted in Any Prior Year that Fail to Meet Applicable Vesting Conditions During Covered Year |
|
|
|
| Pay vs Performance Disclosure |
|
|
|
| Adjustment to Compensation, Amount |
0
|
0
|
0
|
| Non-PEO NEO | Aggregate Grant Date Fair Value of Equity Award Amounts Reported in Summary Compensation Table |
|
|
|
| Pay vs Performance Disclosure |
|
|
|
| Adjustment to Compensation, Amount |
(923,017)
|
(238,389)
|
(214,075)
|
| Non-PEO NEO | Year-end Fair Value of Equity Awards Granted in Covered Year that are Outstanding and Unvested |
|
|
|
| Pay vs Performance Disclosure |
|
|
|
| Adjustment to Compensation, Amount |
889,583
|
427,660
|
202,250
|
| Non-PEO NEO | Year-over-Year Change in Fair Value of Equity Awards Granted in Prior Years That are Outstanding and Unvested |
|
|
|
| Pay vs Performance Disclosure |
|
|
|
| Adjustment to Compensation, Amount |
59,148
|
1,071,885
|
(365,308)
|
| Non-PEO NEO | Vesting Date Fair Value of Equity Awards Granted and Vested in Covered Year |
|
|
|
| Pay vs Performance Disclosure |
|
|
|
| Adjustment to Compensation, Amount |
0
|
0
|
0
|
| Non-PEO NEO | Change in Fair Value as of Vesting Date of Prior Year Equity Awards Vested in Covered Year |
|
|
|
| Pay vs Performance Disclosure |
|
|
|
| Adjustment to Compensation, Amount |
123,928
|
6,656
|
0
|
| Non-PEO NEO | Prior Year End Fair Value of Equity Awards Granted in Any Prior Year that Fail to Meet Applicable Vesting Conditions During Covered Year |
|
|
|
| Pay vs Performance Disclosure |
|
|
|
| Adjustment to Compensation, Amount |
$ 0
|
$ 0
|
$ 0
|