Sprouts Farmers Market Q3 2026 Earnings October 28, 2026 Exhibit 99.2
Forward-Looking Statements Certain statements in this presentation are forward-looking as defined in the Private Securities Litigation Reform Act of 1995. Any statements contained herein that are not statements of historical fact (including, but not limited to, statements to the effect that Sprouts Farmers Market or its management "anticipates," "plans," "estimates," "expects," "will," "believes," or "projects," or the negative of these terms and other similar expressions) should be considered forward-looking statements, including, without limitation, statements regarding the company’s outlook, growth, opportunities and long-term strategy. These statements involve certain risks and uncertainties that may cause actual results to differ materially from expectations as of the date of this presentation. These risks and uncertainties include, without limitation, the company’s ability to execute on its long-term strategy; the company’s ability to successfully compete in its competitive industry; the company’s ability to successfully open new stores; the company’s ability to manage its growth; the company’s ability to maintain or improve its operating margins; the company’s ability to identify and react to trends in consumer preferences in a timely manner; product supply disruptions; equipment supply disruptions; general economic conditions that impact consumer spending or result in competitive responses; accounting standard changes; potential inflationary and/or deflationary trends; tariffs; and other factors as set forth from time to time in the company’s Securities and Exchange Commission filings, including, without limitation, the company’s Annual Report on Form 10-K and Quarterly Reports on Form 10-Q. The company intends these forward-looking statements to speak only as of the time of this presentation and does not undertake to update or revise them as more information becomes available, except as required by law. Non-GAAP Financial Measures We refer to adjusted gross profit, adjusted gross margin, EBIT, adjusted EBIT, adjusted EBIT Margin, adjusted diluted earnings per share and Return on Invested Capital ("ROIC"), each of which is a Non-GAAP Financial Measure. These measures are not prepared in accordance with, and are not intended as alternatives to, generally accepted accounting principles in the United States, or GAAP. The Company's management believes that such measures provide useful information to management, analysts and investors regarding certain additional financial and business trends relating to its results of operations and financial condition. In addition, management uses these measures for reviewing the Company’s financial results, and certain of these measures may be used as components of incentive compensation. The Company defines adjusted gross profit as gross profit, excluding the impact of special items. Adjusted gross margin reflects adjusted gross profit divided by net sales for the applicable period. EBIT is defined as net income before interest (income) expense, net and provision for income tax, and adjusted EBIT as EBIT, excluding the impact of special items. Adjusted EBIT Margin reflects adjusted EBIT, divided by net sales for the applicable period. The Company defines adjusted diluted earnings per share as diluted earnings per share excluding the impact of special items. The Company defines ROIC as net operating profit after taxes ("NOPAT"), including the effect of capitalized operating leases, divided by average invested capital. Non-GAAP measures are intended to provide additional information only and do not have any standard meanings prescribed by GAAP. Use of these terms may differ from similar measures reported by other companies. Because of their limitations, non-GAAP measures should not be considered as a measure of discretionary cash available to use to reinvest in the growth of the Company’s business, or as a measure of cash that will be available to meet the Company’s obligations. Each non-GAAP measure has its limitations as an analytical tool, and you should not consider them in isolation or as a substitute for analysis of the Company’s results as reported under GAAP. To the extent forward looking non-GAAP financial measures are provided herein, they are not reconciled to comparable forward-looking GAAP measures due to the inherent difficulty in forecasting and quantifying certain amounts that are necessary for such reconciliation. 2
3
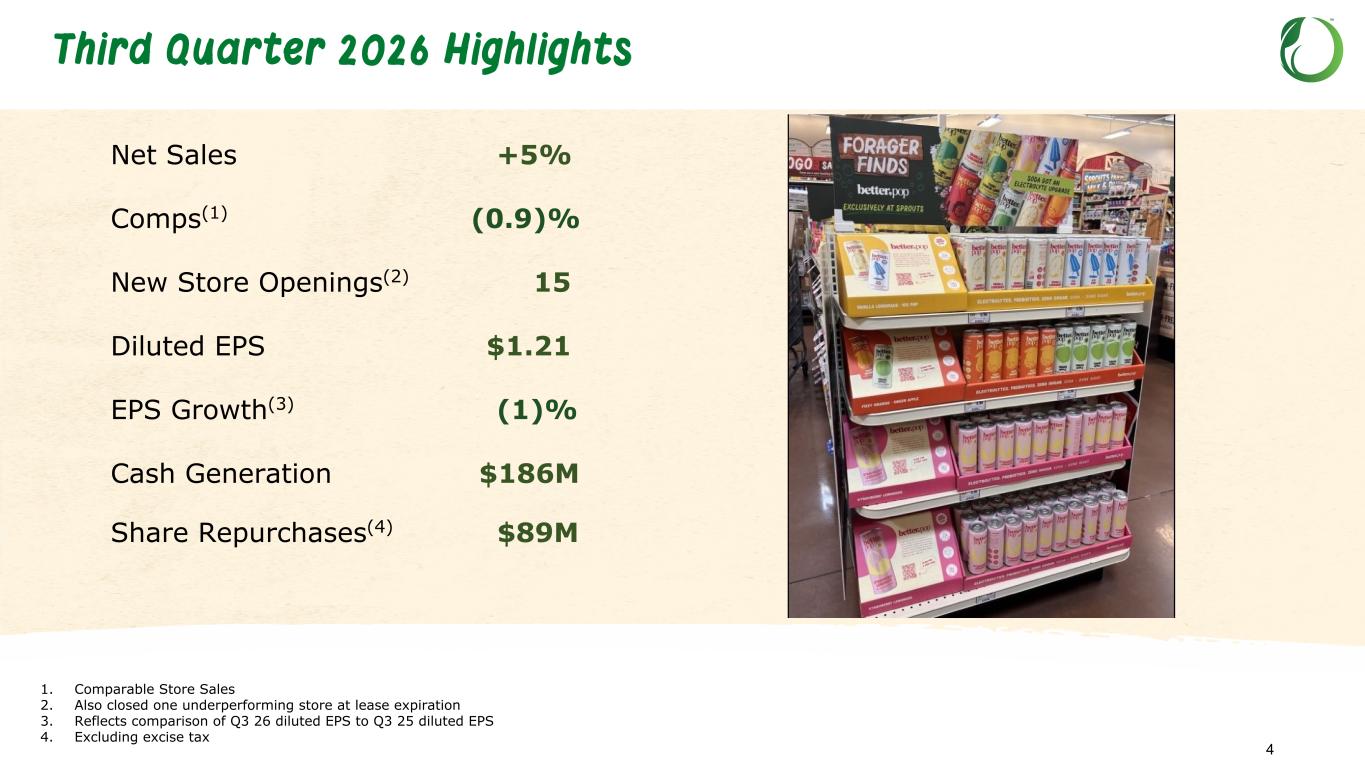
Third Quarter 2026 Highlights Net Sales +5% Comps(1) (0.9)% New Store Openings(2) 15 Diluted EPS $1.21 EPS Growth(3) (1)% Cash Generation $186M Share Repurchases(4) $89M 1. Comparable Store Sales 2. Also closed one underperforming store at lease expiration 3. Reflects comparison of Q3 26 diluted EPS to Q3 25 diluted EPS 4. Excluding excise tax 4
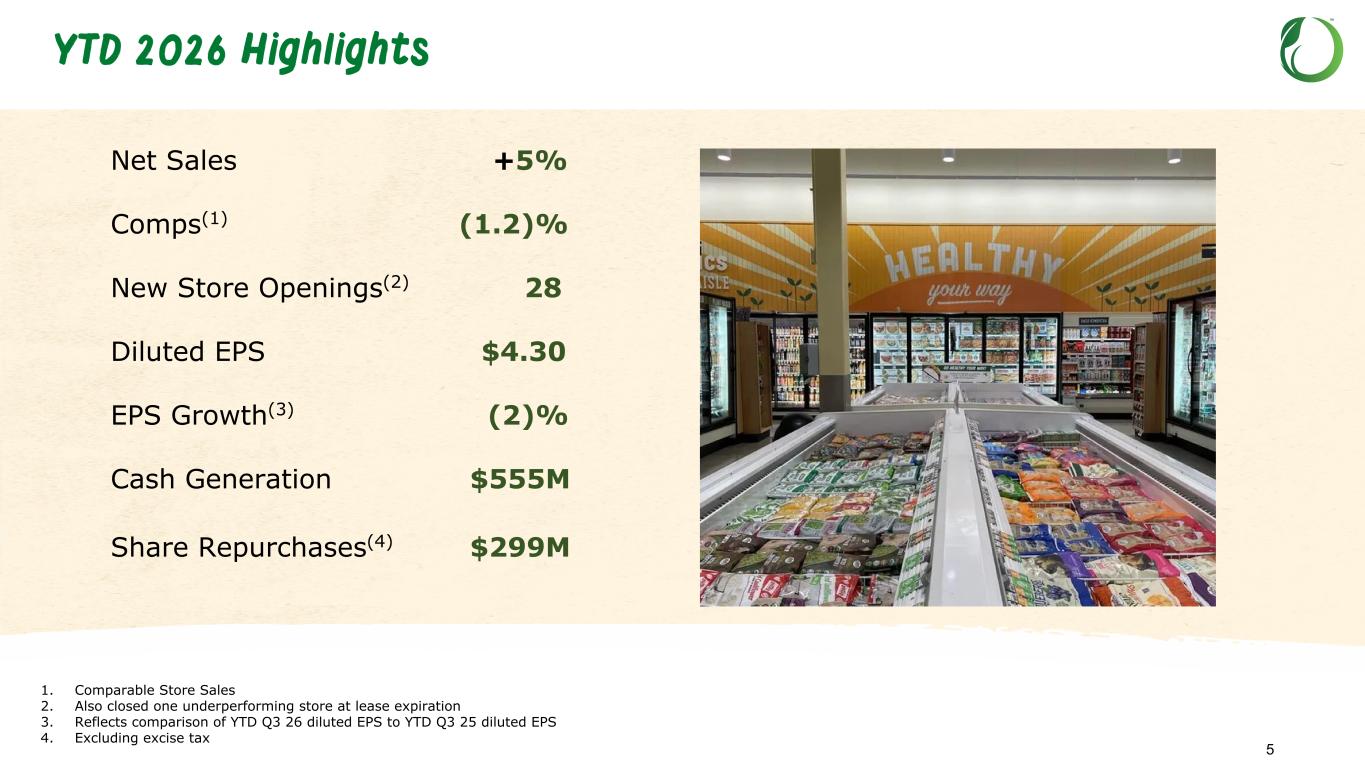
YTD 2026 Highlights Net Sales +5% Comps(1) (1.2)% New Store Openings(2) 28 Diluted EPS $4.30 EPS Growth(3) (2)% Cash Generation $555M Share Repurchases(4) $299M 1. Comparable Store Sales 2. Also closed one underperforming store at lease expiration 3. Reflects comparison of YTD Q3 26 diluted EPS to YTD Q3 25 diluted EPS 4. Excluding excise tax 5
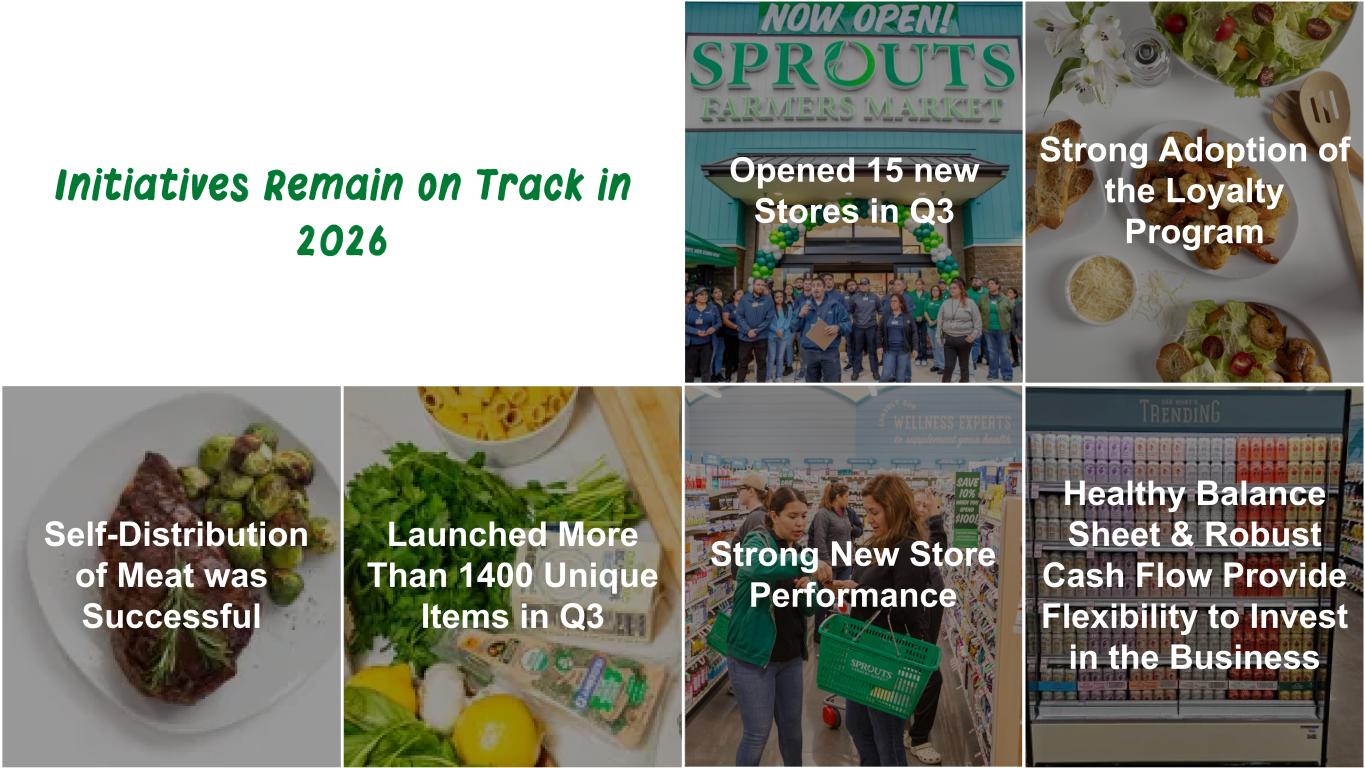
Strong New Store Performance Launched More Than 1400 Unique Items in Q3 Self-Distribution of Meat was Successful Opened 15 new Stores in Q3 Healthy Balance Sheet & Robust Cash Flow Provide Flexibility to Invest in the Business Initiatives Remain on Track in 2026 Strong Adoption of the Loyalty Program
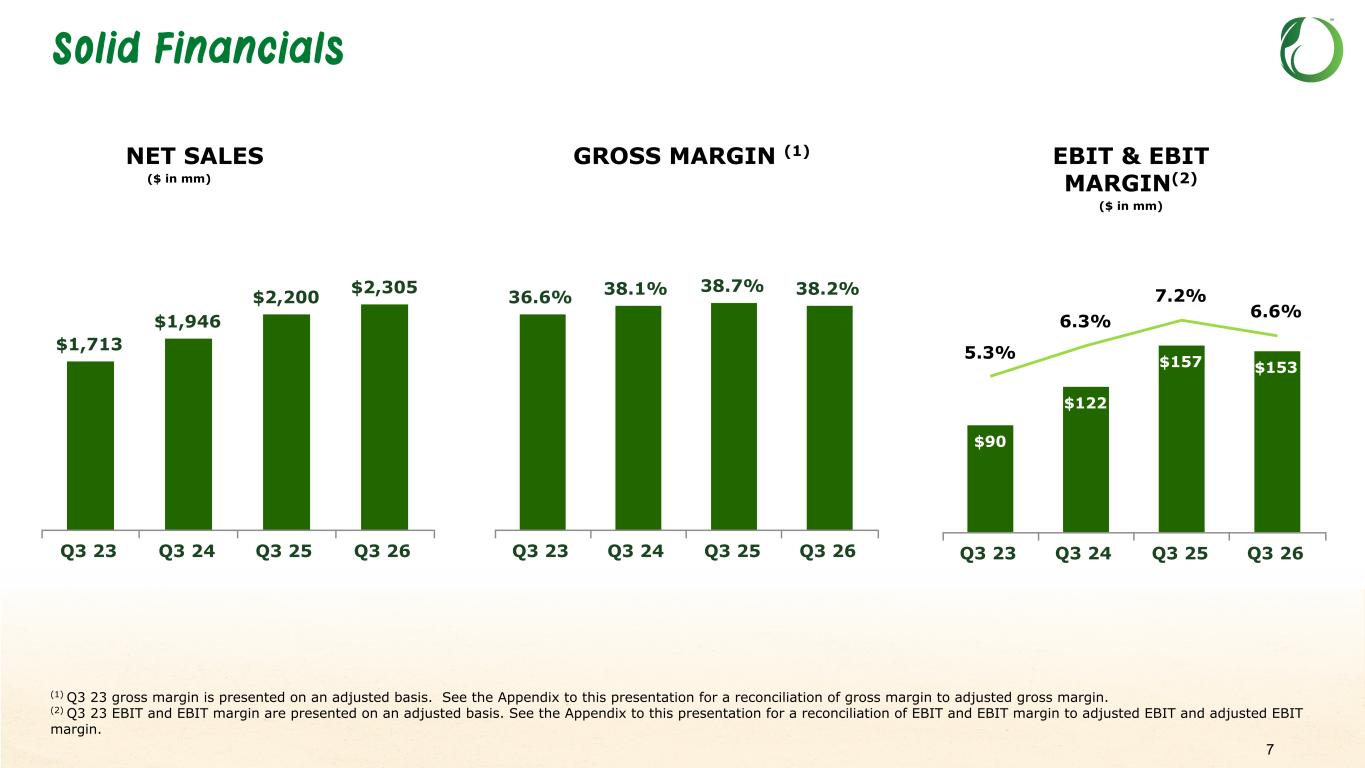
Solid Financials 7 $1,713 $1,946 $2,200 $2,305 Q3 23 Q3 24 Q3 25 Q3 26 36.6% 38.1% 38.7% 38.2% Q3 23 Q3 24 Q3 25 Q3 26 NET SALES ($ in mm) GROSS MARGIN (1) (1) Q3 23 gross margin is presented on an adjusted basis. See the Appendix to this presentation for a reconciliation of gross margin to adjusted gross margin. (2) Q3 23 EBIT and EBIT margin are presented on an adjusted basis. See the Appendix to this presentation for a reconciliation of EBIT and EBIT margin to adjusted EBIT and adjusted EBIT margin. $90 $122 $157 $153 5.3% 6.3% 7.2% 6.6% Q3 23 Q3 24 Q3 25 Q3 26 EBIT & EBIT MARGIN(2) ($ in mm)
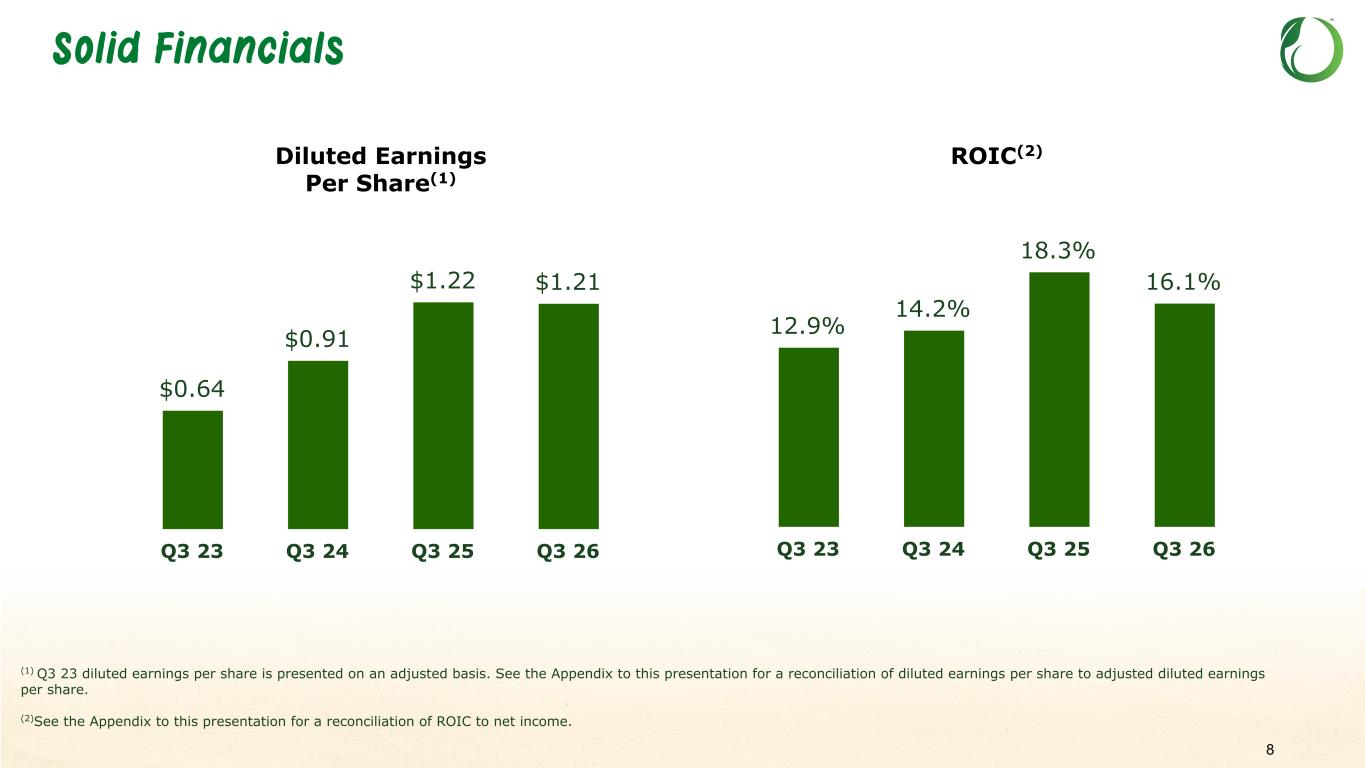
Solid Financials 8 Diluted Earnings Per Share(1) ROIC(2) 12.9% 14.2% 18.3% 16.1% Q3 23 Q3 24 Q3 25 Q3 26 $0.64 $0.91 $1.22 $1.21 Q3 23 Q3 24 Q3 25 Q3 26 (1) Q3 23 diluted earnings per share is presented on an adjusted basis. See the Appendix to this presentation for a reconciliation of diluted earnings per share to adjusted diluted earnings per share. (2)See the Appendix to this presentation for a reconciliation of ROIC to net income.
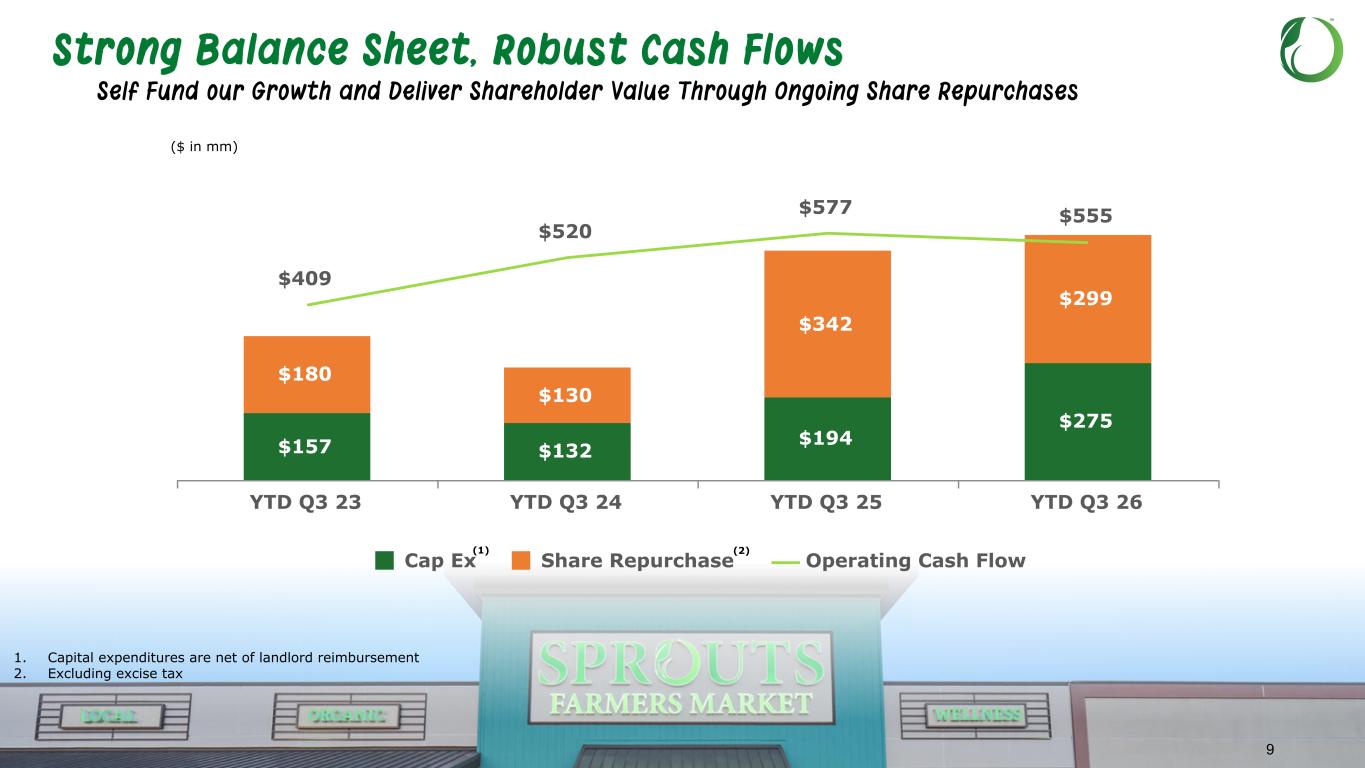
Strong Balance Sheet, Robust Cash Flows ($ in mm) 1. Capital expenditures are net of landlord reimbursement 2. Excluding excise tax Self Fund our Growth and Deliver Shareholder Value Through Ongoing Share Repurchases $157 $132 $194 $275 $180 $130 $342 $299 $409 $520 $577 $555 Cap Ex Share Repurchase Operating Cash Flow YTD Q3 23 YTD Q3 24 YTD Q3 25 YTD Q3 26 9 (1) (2)
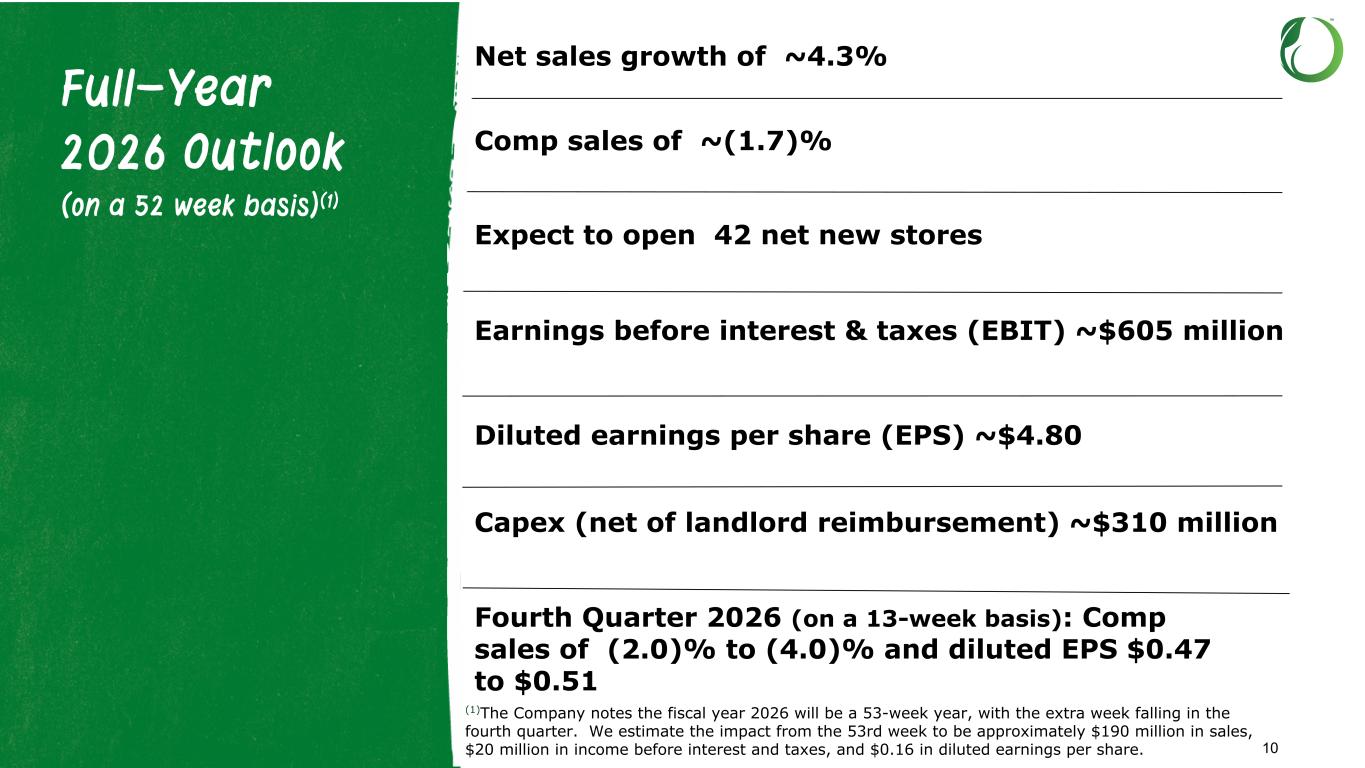
Expect to open 42 net new stores Capex (net of landlord reimbursement) ~$310 million Fourth Quarter 2026 (on a 13-week basis): Comp sales of (2.0)% to (4.0)% and diluted EPS $0.47 to $0.51 Net sales growth of ~4.3% Comp sales of ~(1.7)% Earnings before interest & taxes (EBIT) ~$605 million Diluted earnings per share (EPS) ~$4.80 10 Full-Year 2026 Outlook (on a 52 week basis)(1) (1)The Company notes the fiscal year 2026 will be a 53-week year, with the extra week falling in the fourth quarter. We estimate the impact from the 53rd week to be approximately $190 million in sales, $20 million in income before interest and taxes, and $0.16 in diluted earnings per share.

Appendix
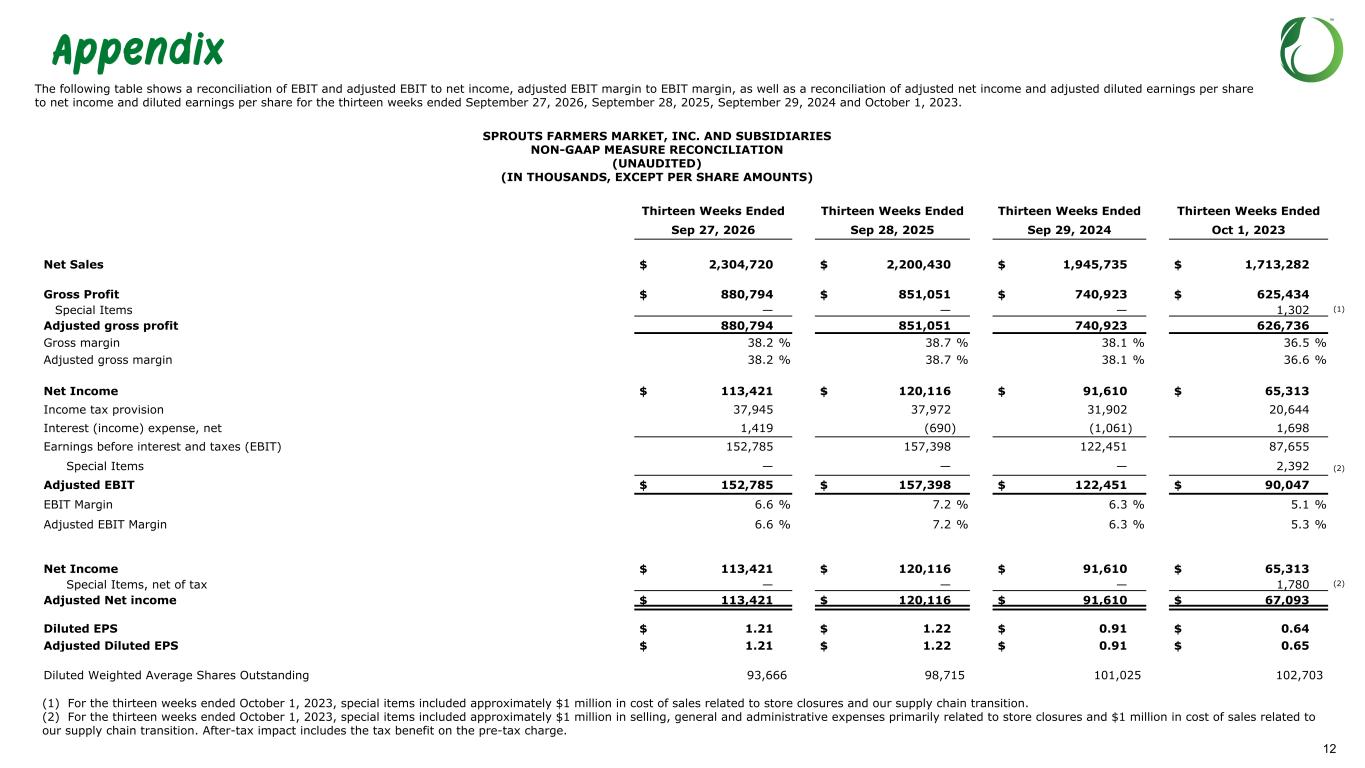
Appendix SPROUTS FARMERS MARKET, INC. AND SUBSIDIARIES NON-GAAP MEASURE RECONCILIATION (UNAUDITED) (IN THOUSANDS, EXCEPT PER SHARE AMOUNTS) The following table shows a reconciliation of EBIT and adjusted EBIT to net income, adjusted EBIT margin to EBIT margin, as well as a reconciliation of adjusted net income and adjusted diluted earnings per share to net income and diluted earnings per share for the thirteen weeks ended September 27, 2026, September 28, 2025, September 29, 2024 and October 1, 2023. 12 Thirteen Weeks Ended Thirteen Weeks Ended Thirteen Weeks Ended Thirteen Weeks Ended Sep 27, 2026 Sep 28, 2025 Sep 29, 2024 Oct 1, 2023 Net Sales $ 2,304,720 $ 2,200,430 $ 1,945,735 $ 1,713,282 Gross Profit $ 880,794 $ 851,051 $ 740,923 $ 625,434 Special Items — — — 1,302 (1) Adjusted gross profit 880,794 851,051 740,923 626,736 Gross margin 38.2 % 38.7 % 38.1 % 36.5 % Adjusted gross margin 38.2 % 38.7 % 38.1 % 36.6 % Net Income $ 113,421 $ 120,116 $ 91,610 $ 65,313 Income tax provision 37,945 37,972 31,902 20,644 Interest (income) expense, net 1,419 (690) (1,061) 1,698 Earnings before interest and taxes (EBIT) 152,785 157,398 122,451 87,655 Special Items — — — 2,392 (2) Adjusted EBIT $ 152,785 $ 157,398 $ 122,451 $ 90,047 EBIT Margin 6.6 % 7.2 % 6.3 % 5.1 % Adjusted EBIT Margin 6.6 % 7.2 % 6.3 % 5.3 % Net Income $ 113,421 $ 120,116 $ 91,610 $ 65,313 Special Items, net of tax — — — 1,780 (2) Adjusted Net income $ 113,421 $ 120,116 $ 91,610 $ 67,093 Diluted EPS $ 1.21 $ 1.22 $ 0.91 $ 0.64 Adjusted Diluted EPS $ 1.21 $ 1.22 $ 0.91 $ 0.65 Diluted Weighted Average Shares Outstanding 93,666 98,715 101,025 102,703 (1) For the thirteen weeks ended October 1, 2023, special items included approximately $1 million in cost of sales related to store closures and our supply chain transition. (2) For the thirteen weeks ended October 1, 2023, special items included approximately $1 million in selling, general and administrative expenses primarily related to store closures and $1 million in cost of sales related to our supply chain transition. After-tax impact includes the tax benefit on the pre-tax charge.
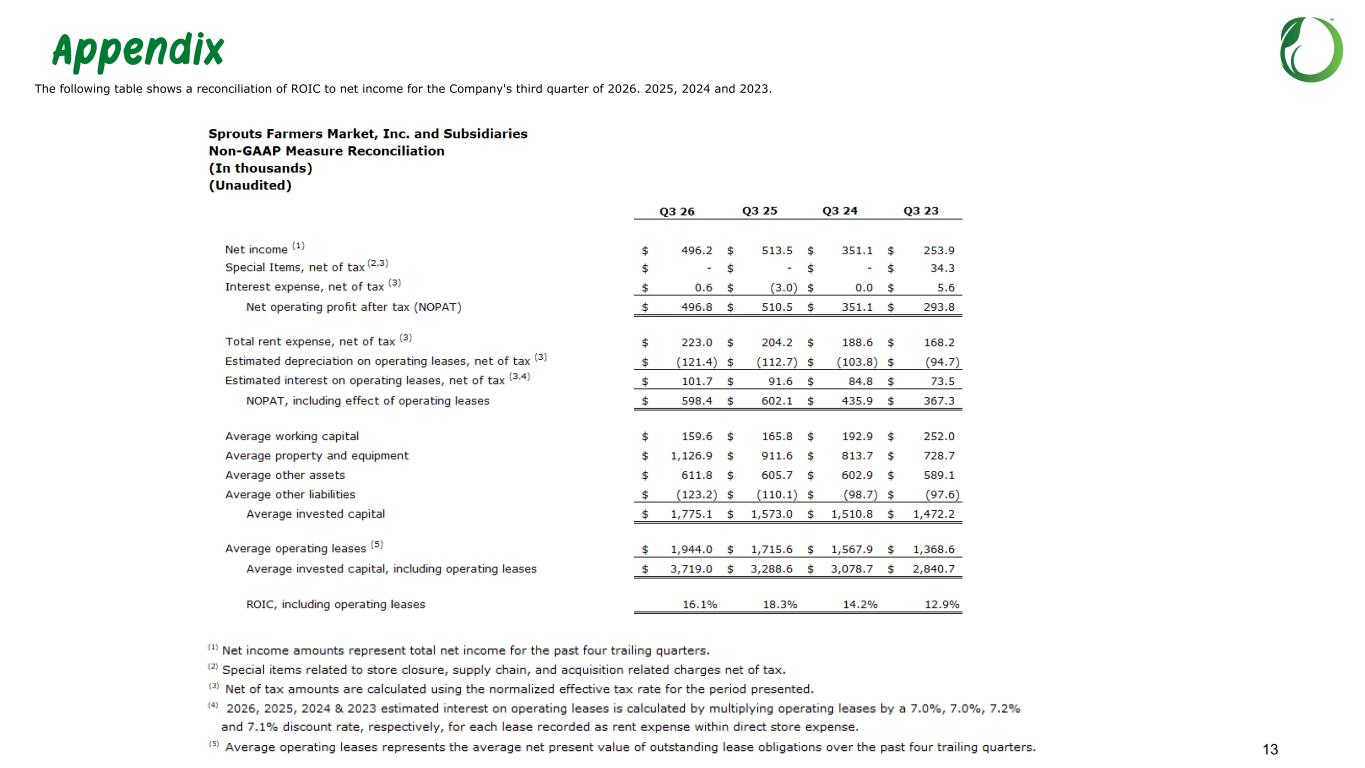
Appendix The following table shows a reconciliation of ROIC to net income for the Company's third quarter of 2026. 2025, 2024 and 2023. 13