
Fourth Quarter and Fiscal 2026 Results October 28, 2026
Forward-looking statements Certain statements made in this presentation and the associated conference call may constitute “forward-looking statements” under the Private Securities Litigation Reform Act of 1995. Forward-looking statements include information concerning future strategic objectives, business prospects, anticipated savings, financial results (including expenses, earnings, liquidity, cash flow and capital expenditures), industry or market conditions (including changes in interest rates and inflation), demand for and pricing of our products (including cash sweep and deposit offerings), anticipated timing and benefits of our acquisitions, and our level of success integrating acquired businesses, anticipated results of litigation, regulatory developments, and general economic conditions. In addition, words such as "believes," "expects," "anticipates," "intends," "plans," "estimates," "projects," "forecasts," and future or conditional verbs such as “will,” “may,” “could,” “should,” and “would,” as well as any other statement that necessarily depends on future events, are intended to identify forward-looking statements. Forward-looking statements are not guarantees, and they involve risks, uncertainties and assumptions. Although we make such statements based on assumptions that we believe to be reasonable, there can be no assurance that actual results will not differ materially from those expressed in the forward- looking statements. We caution investors not to rely unduly on any forward-looking statements and urge you to carefully consider the risks described in our filings with the Securities and Exchange Commission (the “SEC”) from time to time, including our most recent Annual Report on Form 10-K, and subsequent Quarterly Reports on Form 10-Q and Current Reports on Form 8-K, which are available at www.raymondjames.com and the SEC’s website at www.sec.gov. We expressly disclaim any obligation to update any forward-looking statement in the event it later turns out to be inaccurate, whether as a result of new information, future events, or otherwise. 2
Strategic Overview Paul Shoukry Chief Executive Officer, Raymond James Financial 3
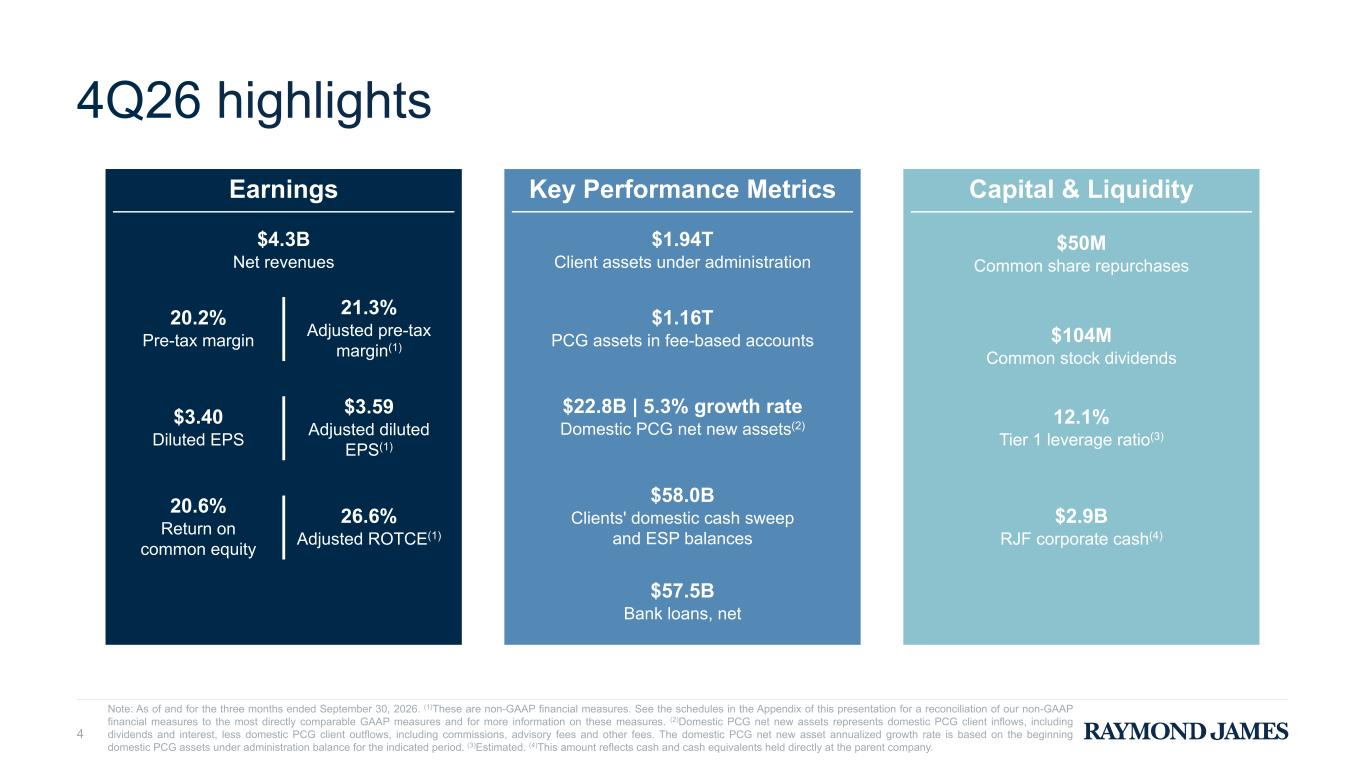
4 4Q26 highlights Earnings Key Performance Metrics Capital & Liquidity $4.3B Net revenues $1.94T Client assets under administration $50M Common share repurchases 20.2% Pre-tax margin 21.3% Adjusted pre-tax margin(1) $1.16T PCG assets in fee-based accounts $104M Common stock dividends $22.8B | 5.3% growth rate Domestic PCG net new assets(2)$3.40 Diluted EPS $3.59 Adjusted diluted EPS(1) 12.1% Tier 1 leverage ratio(3) $58.0B Clients' domestic cash sweep and ESP balances 20.6% Return on common equity 26.6% Adjusted ROTCE(1) $2.9B RJF corporate cash(4) $57.5B Bank loans, net Note: As of and for the three months ended September 30, 2026. (1)These are non-GAAP financial measures. See the schedules in the Appendix of this presentation for a reconciliation of our non-GAAP financial measures to the most directly comparable GAAP measures and for more information on these measures. (2)Domestic PCG net new assets represents domestic PCG client inflows, including dividends and interest, less domestic PCG client outflows, including commissions, advisory fees and other fees. The domestic PCG net new asset annualized growth rate is based on the beginning domestic PCG assets under administration balance for the indicated period. (3)Estimated. (4)This amount reflects cash and cash equivalents held directly at the parent company.
Financial Review Butch Oorlog Chief Financial Officer, Raymond James Financial 5
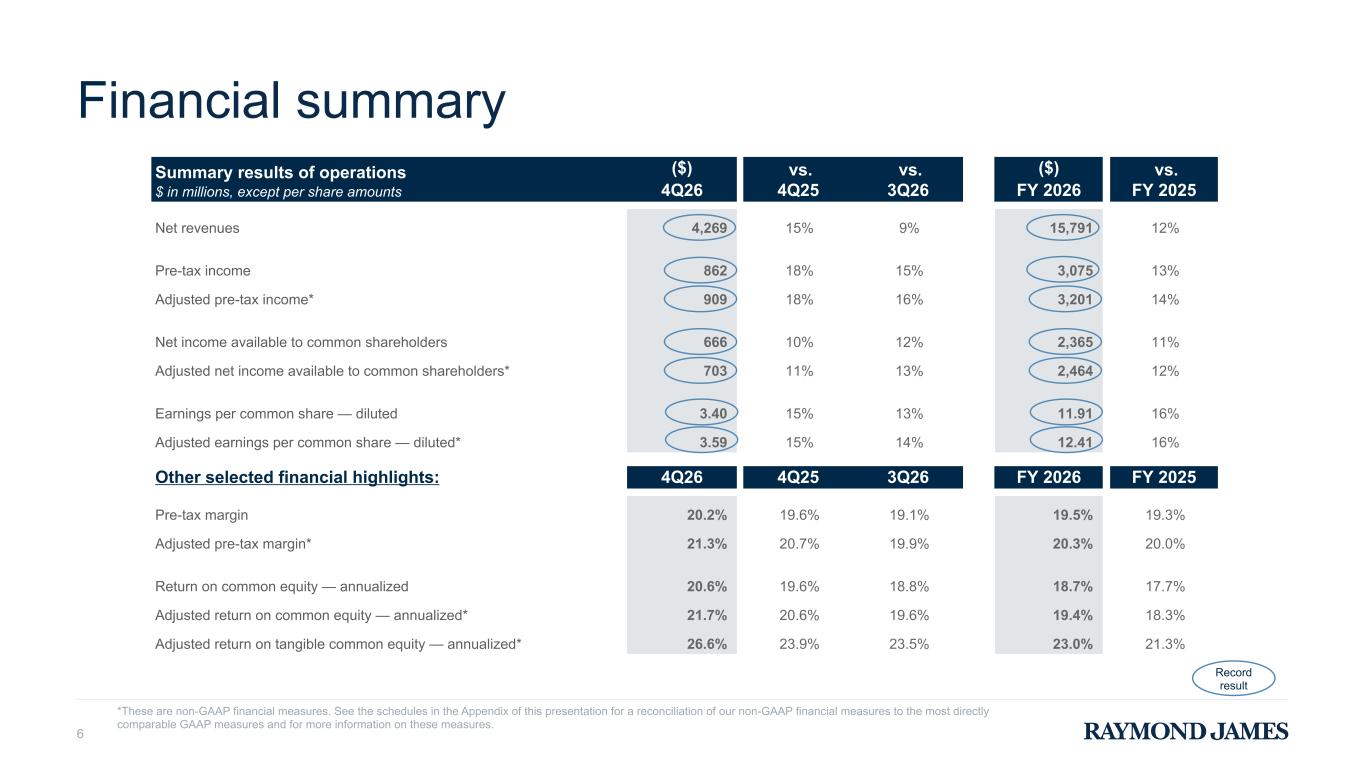
Summary results of operations $ in millions, except per share amounts ($) vs. 4Q25 vs. 3Q26 ($) vs. FY 20254Q26 FY 2026 Net revenues 4,269 15% 9% 15,791 12% Pre-tax income 862 18% 15% 3,075 13% Adjusted pre-tax income* 909 18% 16% 3,201 14% Net income available to common shareholders 666 10% 12% 2,365 11% Adjusted net income available to common shareholders* 703 11% 13% 2,464 12% Earnings per common share — diluted 3.40 15% 13% 11.91 16% Adjusted earnings per common share — diluted* 3.59 15% 14% 12.41 16% Other selected financial highlights: 4Q26 4Q25 3Q26 FY 2026 FY 2025 Pre-tax margin 20.2 % 19.6% 19.1% 19.5 % 19.3% Adjusted pre-tax margin* 21.3 % 20.7% 19.9% 20.3 % 20.0% Return on common equity — annualized 20.6 % 19.6% 18.8% 18.7 % 17.7% Adjusted return on common equity — annualized* 21.7 % 20.6% 19.6% 19.4 % 18.3% Adjusted return on tangible common equity — annualized* 26.6 % 23.9% 23.5% 23.0 % 21.3% 6 *These are non-GAAP financial measures. See the schedules in the Appendix of this presentation for a reconciliation of our non-GAAP financial measures to the most directly comparable GAAP measures and for more information on these measures. Financial summary Record result
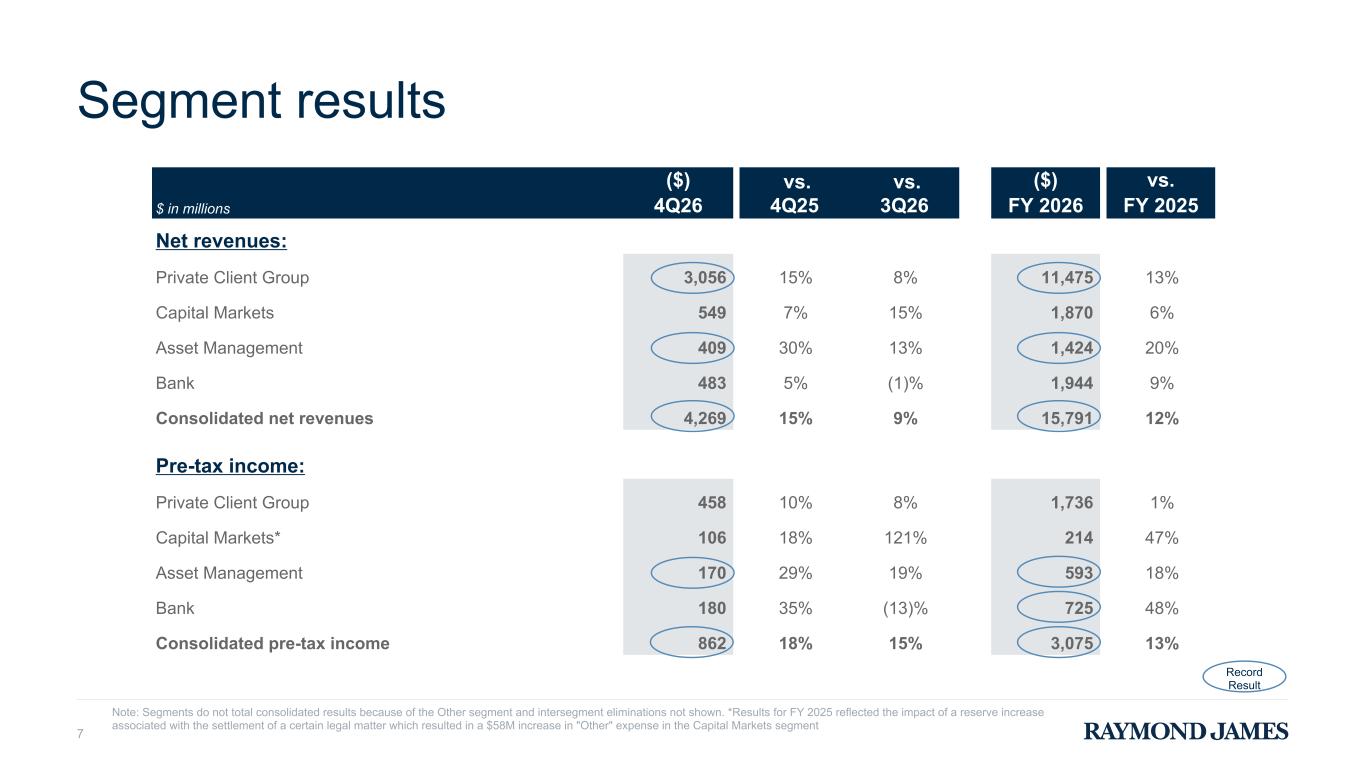
$ in millions ($) vs. 4Q25 vs. 3Q26 ($) vs. 4Q26 FY 2026 FY 2025 Net revenues: Private Client Group 3,056 15% 8% 11,475 13% Capital Markets 549 7% 15% 1,870 6% Asset Management 409 30% 13% 1,424 20% Bank 483 5% (1)% 1,944 9% Consolidated net revenues 4,269 15% 9% 15,791 12% Pre-tax income: Private Client Group 458 10% 8% 1,736 1% Capital Markets* 106 18% 121% 214 47% Asset Management 170 29% 19% 593 18% Bank 180 35% (13)% 725 48% Consolidated pre-tax income 862 18% 15% 3,075 13% Note: Segments do not total consolidated results because of the Other segment and intersegment eliminations not shown. *Results for FY 2025 reflected the impact of a reserve increase associated with the settlement of a certain legal matter which resulted in a $58M increase in "Other" expense in the Capital Markets segment Segment results 7 Record Result
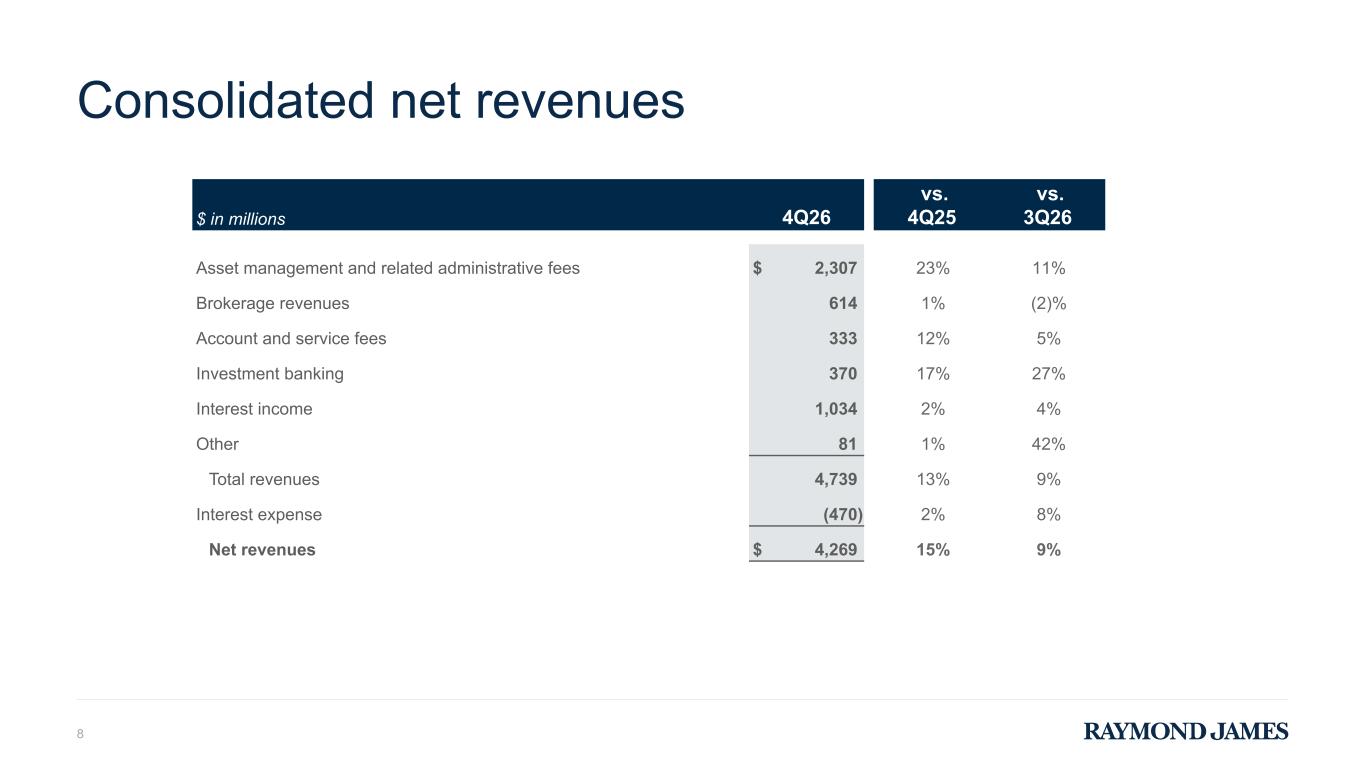
Consolidated net revenues 8 $ in millions 4Q26 vs. 4Q25 vs. 3Q26 Asset management and related administrative fees $ 2,307 23% 11% Brokerage revenues 614 1% (2)% Account and service fees 333 12% 5% Investment banking 370 17% 27% Interest income 1,034 2% 4% Other 81 1% 42% Total revenues 4,739 13% 9% Interest expense (470) 2% 8% Net revenues $ 4,269 15% 9%
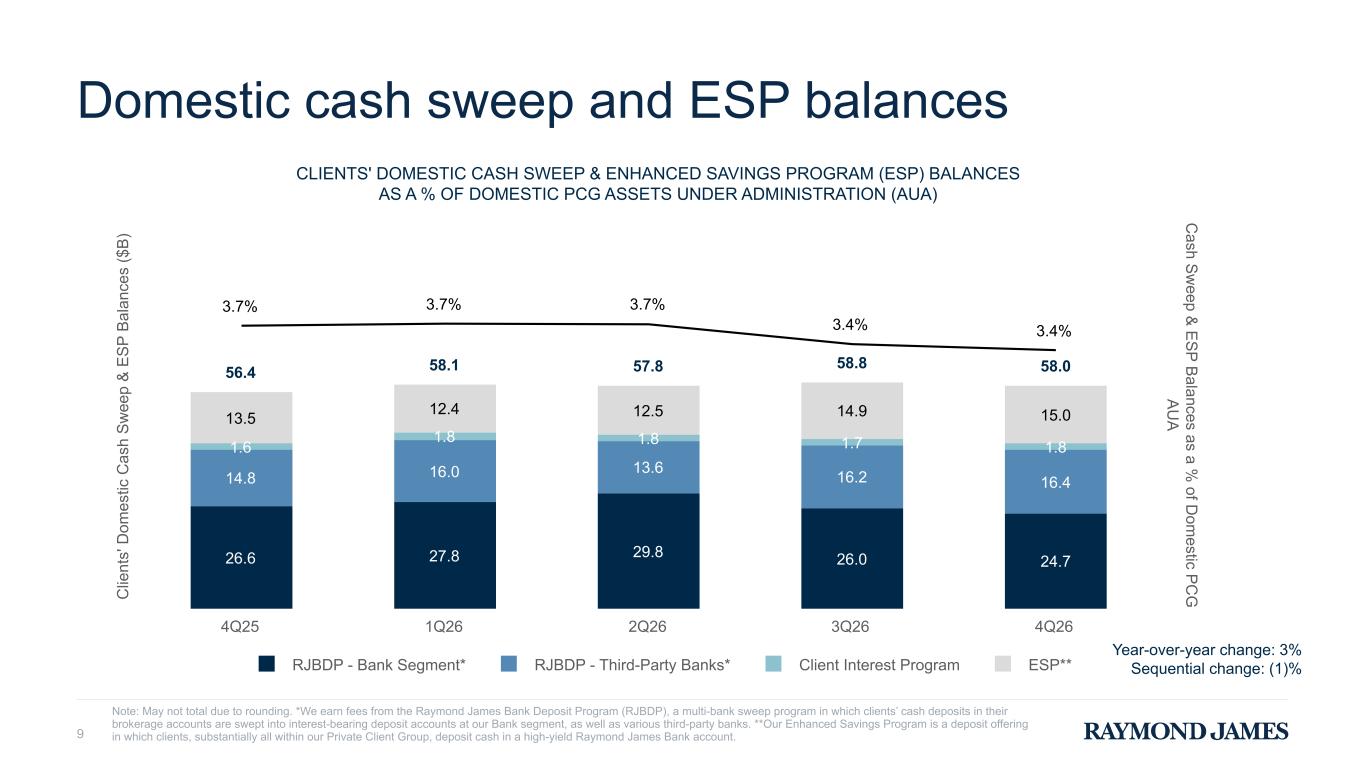
Domestic cash sweep and ESP balances 9 C lie nt s' D om es tic C as h S w ee p & E S P B al an ce s ($ B ) C ash S w eep & E S P B alances as a % of D om estic P C G A U A CLIENTS' DOMESTIC CASH SWEEP & ENHANCED SAVINGS PROGRAM (ESP) BALANCES AS A % OF DOMESTIC PCG ASSETS UNDER ADMINISTRATION (AUA) 26.6 27.8 29.8 26.0 24.7 14.8 16.0 13.6 16.2 16.4 1.6 1.8 1.8 1.7 1.8 13.5 12.4 12.5 14.9 15.0 56.4 58.1 57.8 58.8 58.0 3.7% 3.7% 3.7% 3.4% 3.4% RJBDP - Bank Segment* RJBDP - Third-Party Banks* Client Interest Program ESP** 4Q25 1Q26 2Q26 3Q26 4Q26 Note: May not total due to rounding. *We earn fees from the Raymond James Bank Deposit Program (RJBDP), a multi-bank sweep program in which clients’ cash deposits in their brokerage accounts are swept into interest-bearing deposit accounts at our Bank segment, as well as various third-party banks. **Our Enhanced Savings Program is a deposit offering in which clients, substantially all within our Private Client Group, deposit cash in a high-yield Raymond James Bank account. Year-over-year change: 3% Sequential change: (1)%
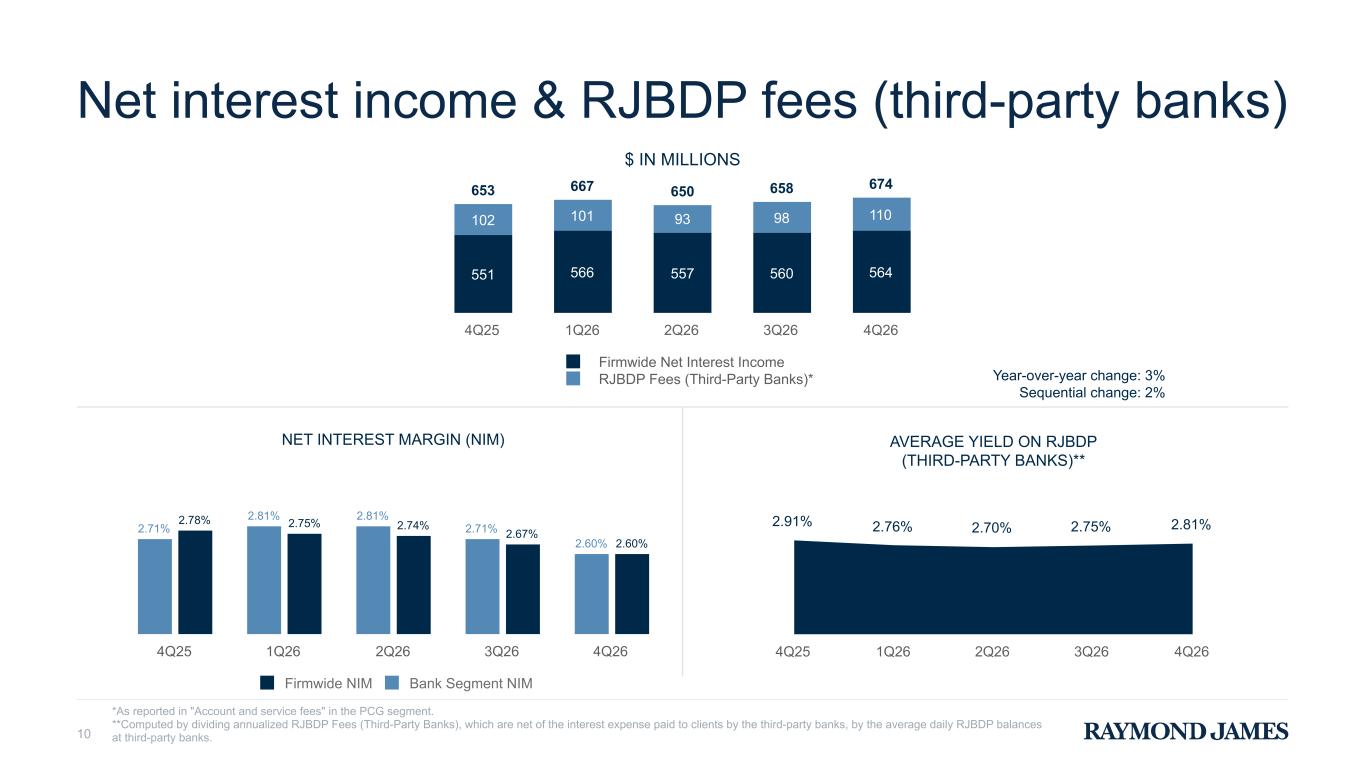
Net interest income & RJBDP fees (third-party banks) 10 *As reported in "Account and service fees" in the PCG segment. **Computed by dividing annualized RJBDP Fees (Third-Party Banks), which are net of the interest expense paid to clients by the third-party banks, by the average daily RJBDP balances at third-party banks. $ IN MILLIONS 653 667 650 658 674 551 566 557 560 564 102 101 93 98 110 Firmwide Net Interest Income RJBDP Fees (Third-Party Banks)* 4Q25 1Q26 2Q26 3Q26 4Q26 NET INTEREST MARGIN (NIM) 2.71% 2.81% 2.81% 2.71% 2.60% 2.78% 2.75% 2.74% 2.67% 2.60% Firmwide NIM Bank Segment NIM 4Q25 1Q26 2Q26 3Q26 4Q26 AVERAGE YIELD ON RJBDP (THIRD-PARTY BANKS)** 2.91% 2.76% 2.70% 2.75% 2.81% 4Q25 1Q26 2Q26 3Q26 4Q26 Year-over-year change: 3% Sequential change: 2%
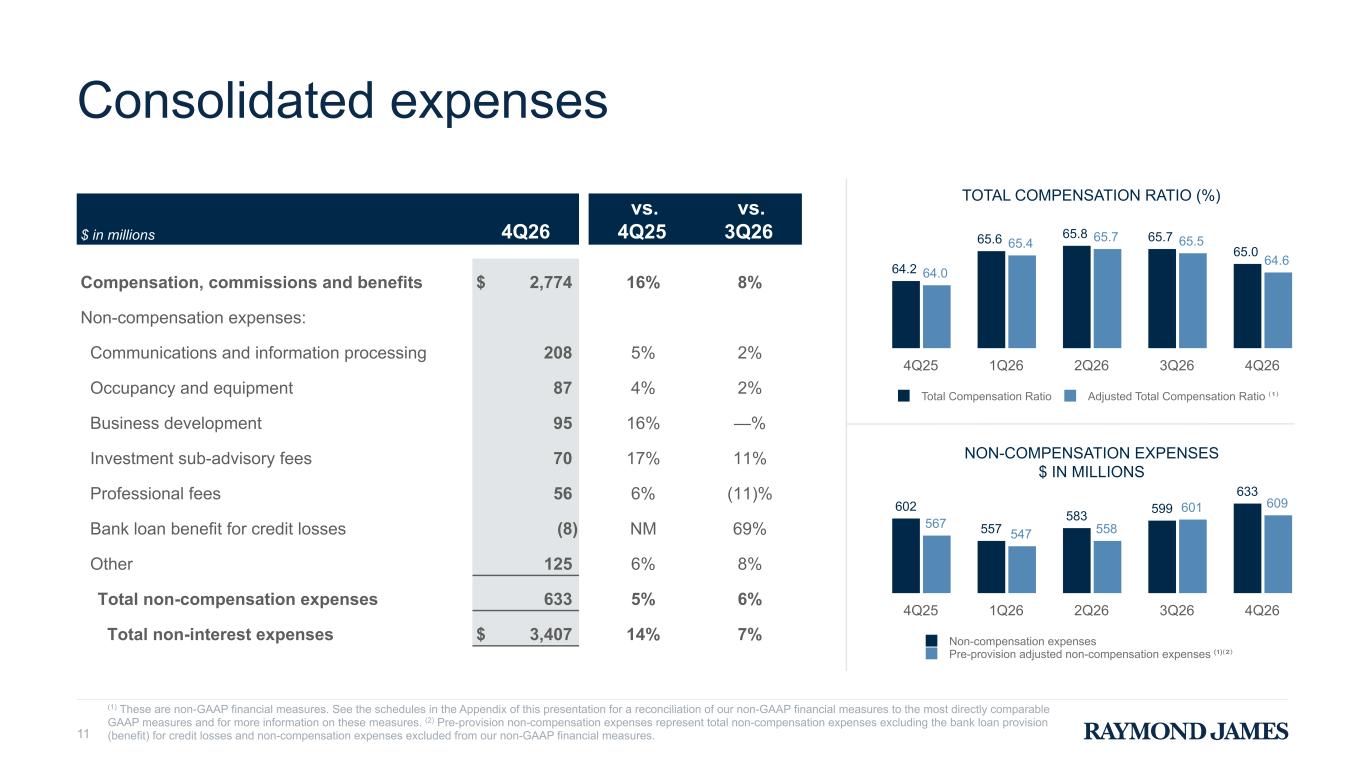
Consolidated expenses 11 $ in millions 4Q26 vs. 4Q25 vs. 3Q26 Compensation, commissions and benefits $ 2,774 16% 8% Non-compensation expenses: Communications and information processing 208 5% 2% Occupancy and equipment 87 4% 2% Business development 95 16% —% Investment sub-advisory fees 70 17% 11% Professional fees 56 6% (11)% Bank loan benefit for credit losses (8) NM 69% Other 125 6% 8% Total non-compensation expenses 633 5% 6% Total non-interest expenses $ 3,407 14% 7% (1) These are non-GAAP financial measures. See the schedules in the Appendix of this presentation for a reconciliation of our non-GAAP financial measures to the most directly comparable GAAP measures and for more information on these measures. (2) Pre-provision non-compensation expenses represent total non-compensation expenses excluding the bank loan provision (benefit) for credit losses and non-compensation expenses excluded from our non-GAAP financial measures. NON-COMPENSATION EXPENSES $ IN MILLIONS 602 557 583 599 633 567 547 558 601 609 Non-compensation expenses Pre-provision adjusted non-compensation expenses ⁽¹⁾⁽²⁾ 4Q25 1Q26 2Q26 3Q26 4Q26 TOTAL COMPENSATION RATIO (%) 64.2 65.6 65.8 65.7 65.0 64.0 65.4 65.7 65.5 64.6 Total Compensation Ratio Adjusted Total Compensation Ratio ⁽¹⁾ 4Q25 1Q26 2Q26 3Q26 4Q26
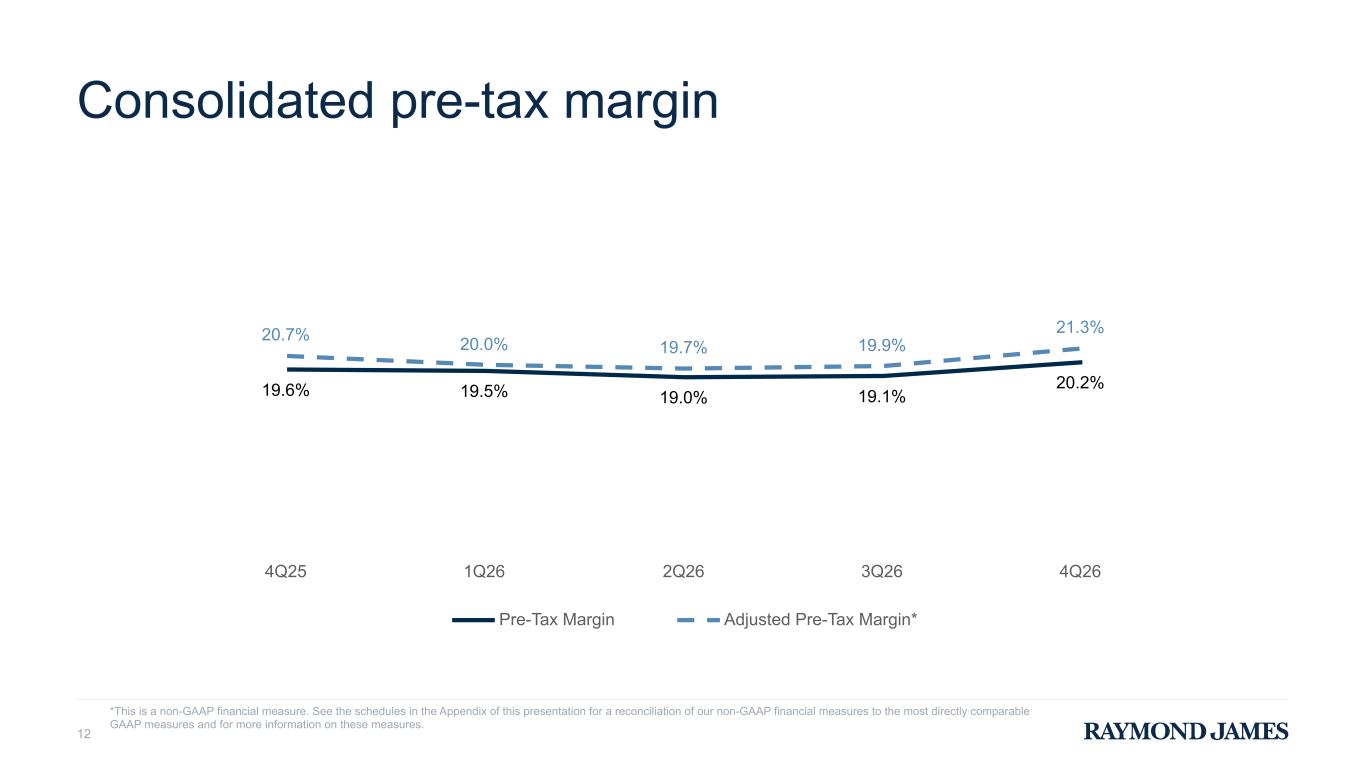
*This is a non-GAAP financial measure. See the schedules in the Appendix of this presentation for a reconciliation of our non-GAAP financial measures to the most directly comparable GAAP measures and for more information on these measures. Consolidated pre-tax margin 12 19.6% 19.5% 19.0% 19.1% 20.2% 20.7% 20.0% 19.7% 19.9% 21.3% Pre-Tax Margin Adjusted Pre-Tax Margin* 4Q25 1Q26 2Q26 3Q26 4Q26
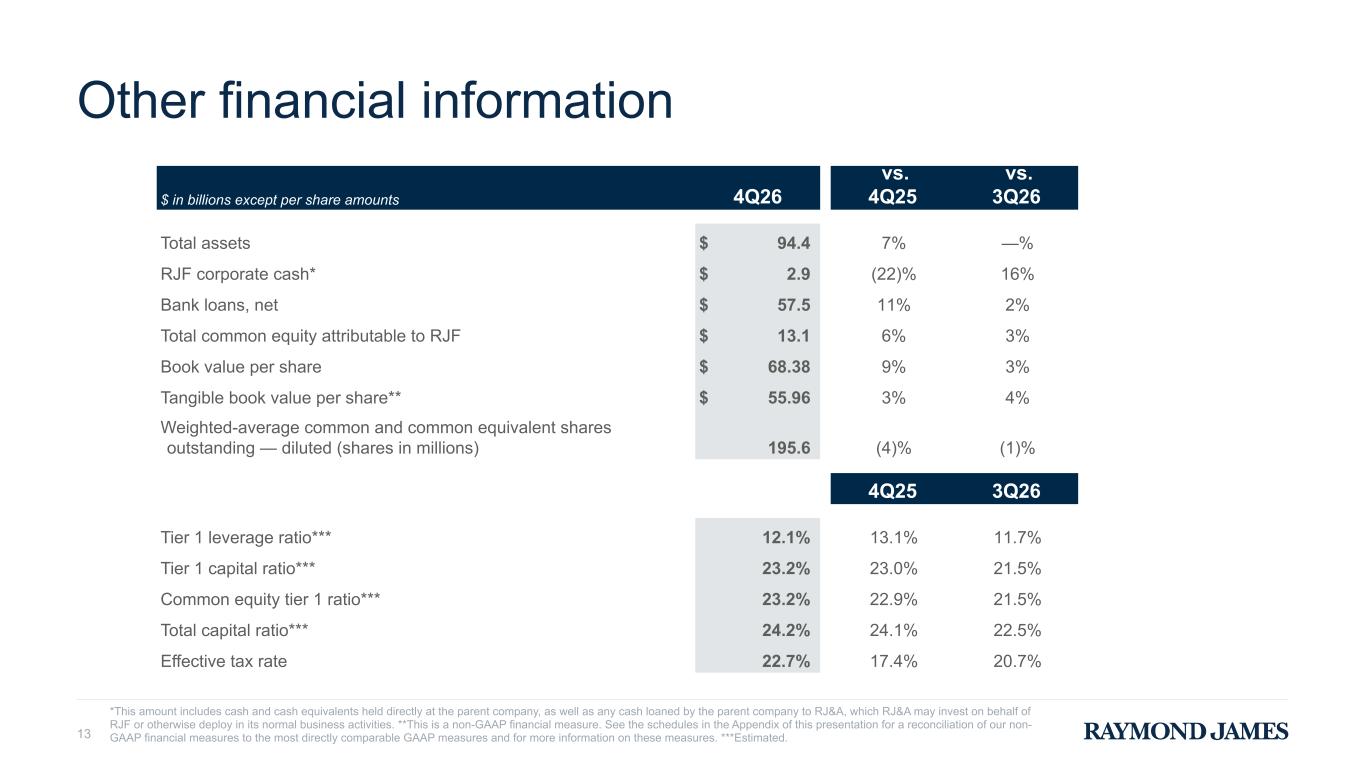
Other financial information 13 *This amount includes cash and cash equivalents held directly at the parent company, as well as any cash loaned by the parent company to RJ&A, which RJ&A may invest on behalf of RJF or otherwise deploy in its normal business activities. **This is a non-GAAP financial measure. See the schedules in the Appendix of this presentation for a reconciliation of our non- GAAP financial measures to the most directly comparable GAAP measures and for more information on these measures. ***Estimated. $ in billions except per share amounts 4Q26 vs. 4Q25 vs. 3Q26 Total assets $ 94.4 7% —% RJF corporate cash* $ 2.9 (22)% 16% Bank loans, net $ 57.5 11% 2% Total common equity attributable to RJF $ 13.1 6% 3% Book value per share $ 68.38 9% 3% Tangible book value per share** $ 55.96 3% 4% Weighted-average common and common equivalent shares outstanding — diluted (shares in millions) 195.6 (4)% (1)% 4Q25 3Q26 Tier 1 leverage ratio*** 12.1 % 13.1% 11.7% Tier 1 capital ratio*** 23.2 % 23.0% 21.5% Common equity tier 1 ratio*** 23.2 % 22.9% 21.5% Total capital ratio*** 24.2 % 24.1% 22.5% Effective tax rate 22.7 % 17.4% 20.7%
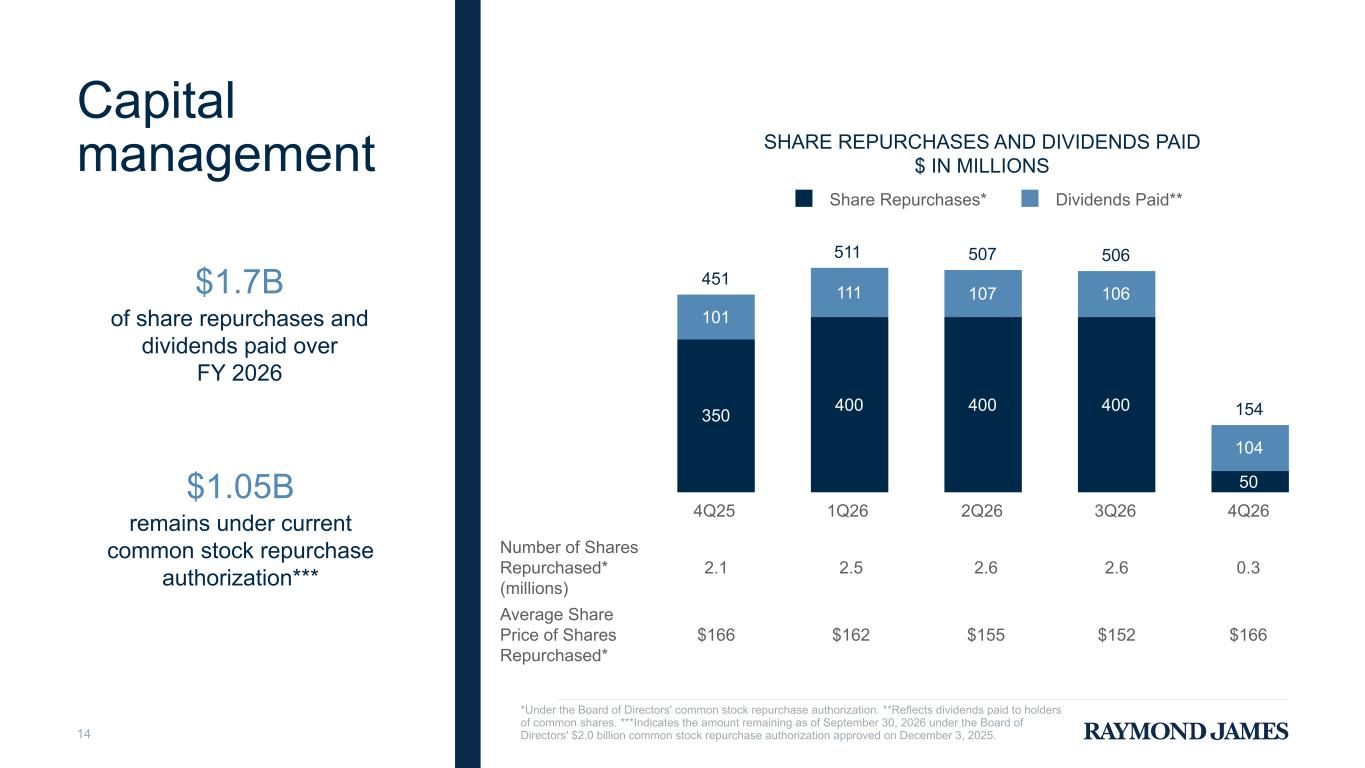
$1.7B of share repurchases and dividends paid over FY 2026 Capital management 14 SHARE REPURCHASES AND DIVIDENDS PAID $ IN MILLIONS 451 511 507 506 154350 400 400 400 50 101 111 107 106 104 Share Repurchases* Dividends Paid** 4Q25 1Q26 2Q26 3Q26 4Q26 Number of Shares Repurchased* (millions) 2.1 2.5 2.6 2.6 0.3 Average Share Price of Shares Repurchased* $166 $162 $155 $152 $166 *Under the Board of Directors' common stock repurchase authorization. **Reflects dividends paid to holders of common shares. ***Indicates the amount remaining as of September 30, 2026 under the Board of Directors' $2.0 billion common stock repurchase authorization approved on December 3, 2025. $1.05B remains under current common stock repurchase authorization***
Appendix 15
Reconciliation of non-GAAP financial measures to GAAP financial measures (unaudited) 16 We utilize certain non-GAAP financial measures as additional measures to aid in, and enhance, the understanding of our financial results and related measures. These non- GAAP financial measures have been separately identified in this document. We believe certain of these non-GAAP financial measures provide useful information to management and investors by excluding certain material items that may not be indicative of our core operating results. We utilize these non-GAAP financial measures in assessing the financial performance of the business, as they facilitate a comparison of current- and prior-period results. We believe that return on tangible common equity and tangible book value per share are meaningful to investors as they facilitate comparisons of our results to the results of other companies. In the following tables, the tax effect of non-GAAP adjustments reflects the statutory rate associated with each non-GAAP item. These non-GAAP financial measures should be considered in addition to, and not as a substitute for, measures of financial performance prepared in accordance with GAAP. In addition, our non-GAAP financial measures may not be comparable to similarly titled non-GAAP financial measures of other companies. The following tables provide a reconciliation of non-GAAP financial measures to the most directly comparable GAAP measures. Note: Please refer to the footnotes on slide 24 for additional information. continued on next slide
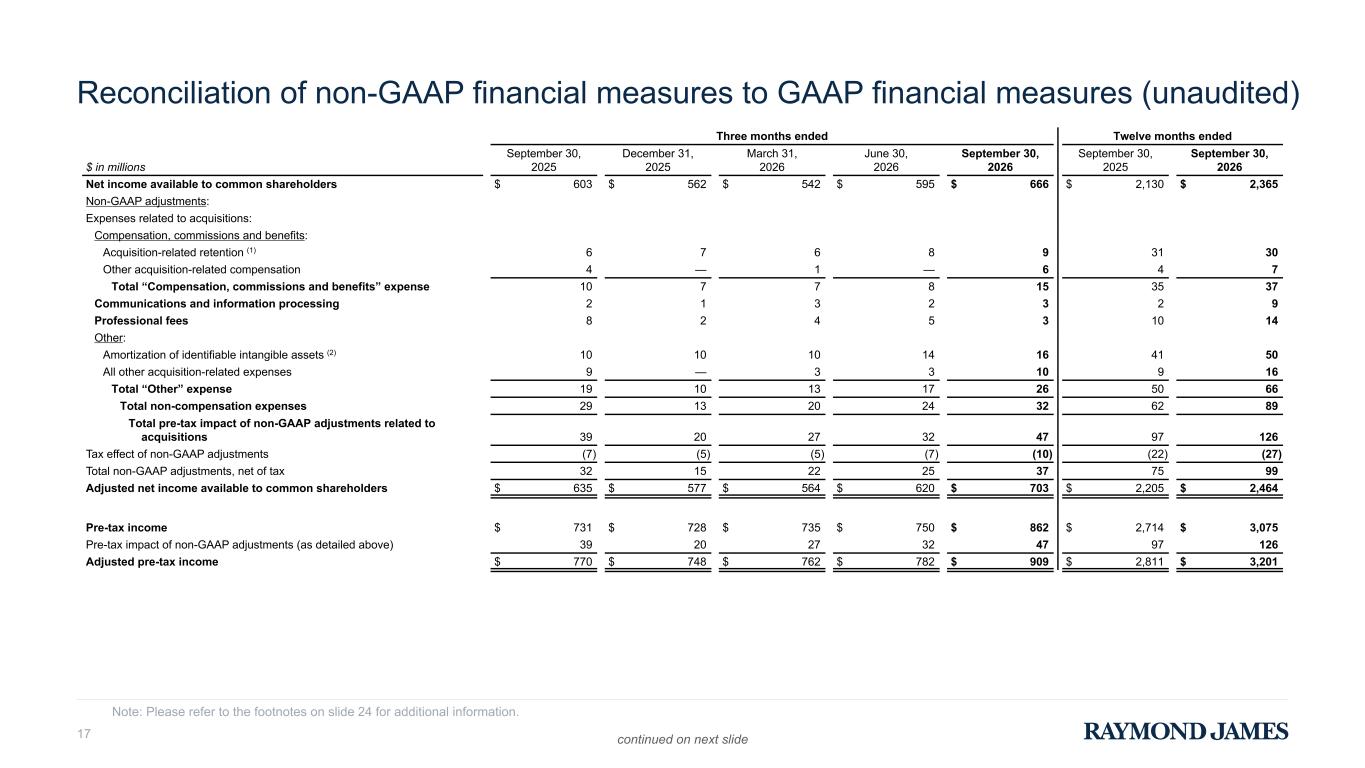
Reconciliation of non-GAAP financial measures to GAAP financial measures (unaudited) Note: Please refer to the footnotes on slide 24 for additional information. continued on next slide Three months ended Twelve months ended $ in millions September 30, 2025 December 31, 2025 March 31, 2026 June 30, 2026 September 30, 2026 September 30, 2025 September 30, 2026 Net income available to common shareholders $ 603 $ 562 $ 542 $ 595 $ 666 $ 2,130 $ 2,365 Non-GAAP adjustments: Expenses related to acquisitions: Compensation, commissions and benefits: Acquisition-related retention (1) 6 7 6 8 9 31 30 Other acquisition-related compensation 4 — 1 — 6 4 7 Total “Compensation, commissions and benefits” expense 10 7 7 8 15 35 37 Communications and information processing 2 1 3 2 3 2 9 Professional fees 8 2 4 5 3 10 14 Other: Amortization of identifiable intangible assets (2) 10 10 10 14 16 41 50 All other acquisition-related expenses 9 — 3 3 10 9 16 Total “Other” expense 19 10 13 17 26 50 66 Total non-compensation expenses 29 13 20 24 32 62 89 Total pre-tax impact of non-GAAP adjustments related to acquisitions 39 20 27 32 47 97 126 Tax effect of non-GAAP adjustments (7) (5) (5) (7) (10) (22) (27) Total non-GAAP adjustments, net of tax 32 15 22 25 37 75 99 Adjusted net income available to common shareholders $ 635 $ 577 $ 564 $ 620 $ 703 $ 2,205 $ 2,464 Pre-tax income $ 731 $ 728 $ 735 $ 750 $ 862 $ 2,714 $ 3,075 Pre-tax impact of non-GAAP adjustments (as detailed above) 39 20 27 32 47 97 126 Adjusted pre-tax income $ 770 $ 748 $ 762 $ 782 $ 909 $ 2,811 $ 3,201 17
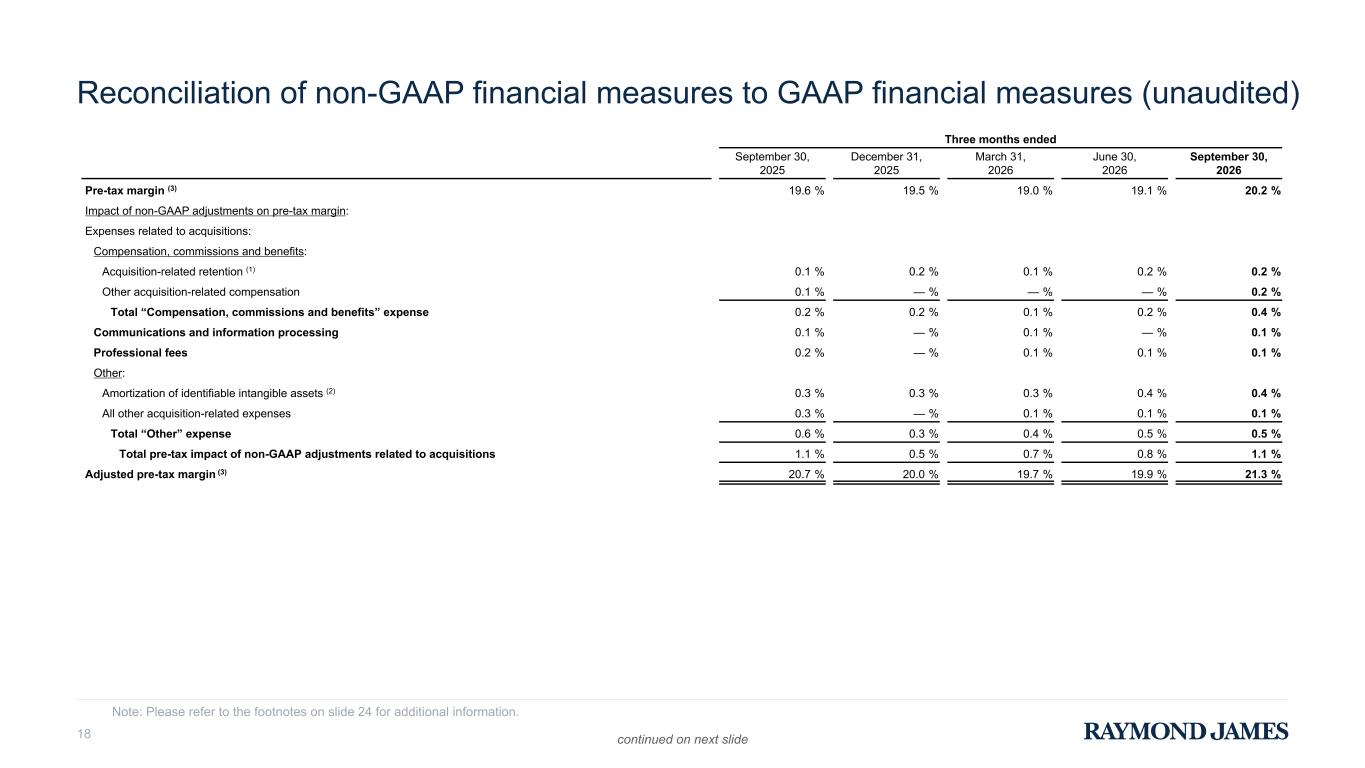
Reconciliation of non-GAAP financial measures to GAAP financial measures (unaudited) Three months ended September 30, 2025 December 31, 2025 March 31, 2026 June 30, 2026 September 30, 2026 Pre-tax margin (3) 19.6 % 19.5 % 19.0 % 19.1 % 20.2 % Impact of non-GAAP adjustments on pre-tax margin: Expenses related to acquisitions: Compensation, commissions and benefits: Acquisition-related retention (1) 0.1 % 0.2 % 0.1 % 0.2 % 0.2 % Other acquisition-related compensation 0.1 % — % — % — % 0.2 % Total “Compensation, commissions and benefits” expense 0.2 % 0.2 % 0.1 % 0.2 % 0.4 % Communications and information processing 0.1 % — % 0.1 % — % 0.1 % Professional fees 0.2 % — % 0.1 % 0.1 % 0.1 % Other: Amortization of identifiable intangible assets (2) 0.3 % 0.3 % 0.3 % 0.4 % 0.4 % All other acquisition-related expenses 0.3 % — % 0.1 % 0.1 % 0.1 % Total “Other” expense 0.6 % 0.3 % 0.4 % 0.5 % 0.5 % Total pre-tax impact of non-GAAP adjustments related to acquisitions 1.1 % 0.5 % 0.7 % 0.8 % 1.1 % Adjusted pre-tax margin (3) 20.7 % 20.0 % 19.7 % 19.9 % 21.3 % Note: Please refer to the footnotes on slide 24 for additional information. continued on next slide18
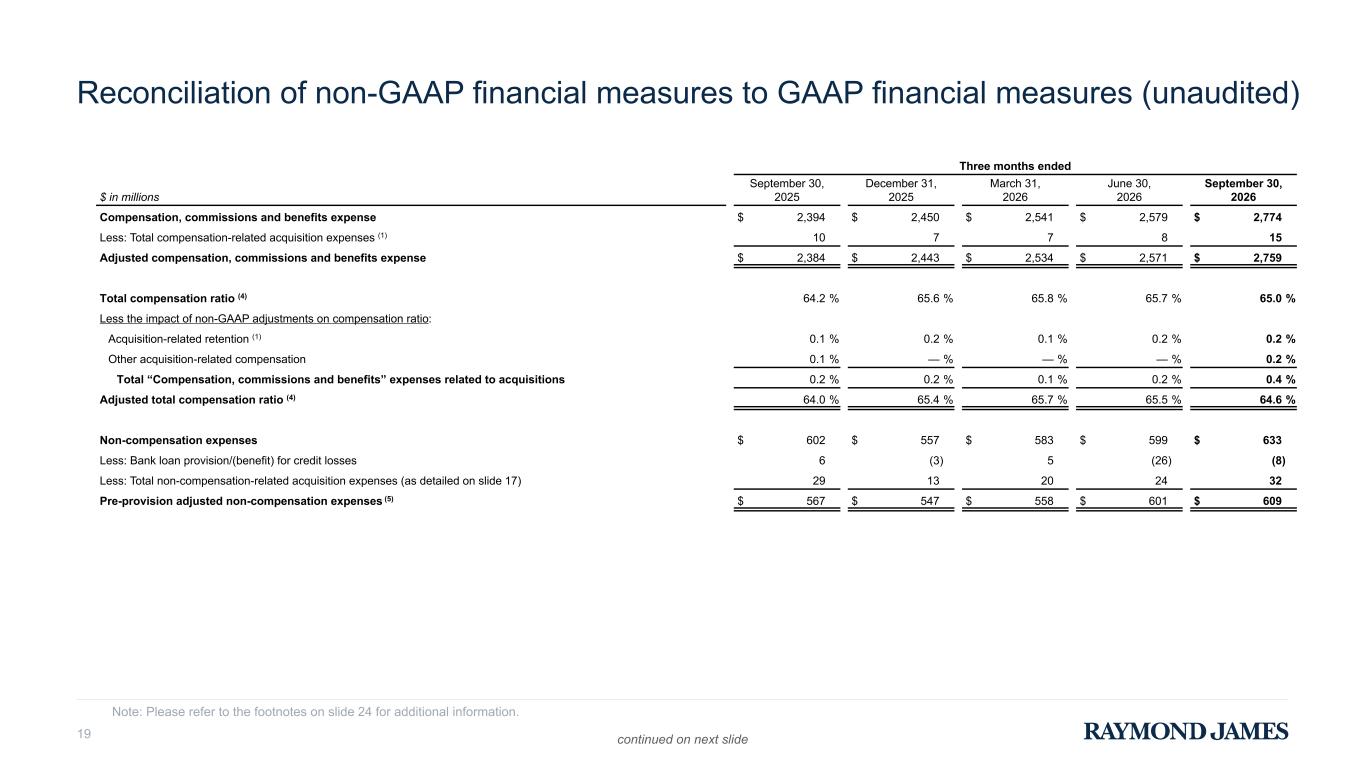
Reconciliation of non-GAAP financial measures to GAAP financial measures (unaudited) 19 Note: Please refer to the footnotes on slide 24 for additional information. continued on next slide Three months ended $ in millions September 30, 2025 December 31, 2025 March 31, 2026 June 30, 2026 September 30, 2026 Compensation, commissions and benefits expense $ 2,394 $ 2,450 $ 2,541 $ 2,579 $ 2,774 Less: Total compensation-related acquisition expenses (1) 10 7 7 8 15 Adjusted compensation, commissions and benefits expense $ 2,384 $ 2,443 $ 2,534 $ 2,571 $ 2,759 Total compensation ratio (4) 64.2 % 65.6 % 65.8 % 65.7 % 65.0 % Less the impact of non-GAAP adjustments on compensation ratio: Acquisition-related retention (1) 0.1 % 0.2 % 0.1 % 0.2 % 0.2 % Other acquisition-related compensation 0.1 % — % — % — % 0.2 % Total “Compensation, commissions and benefits” expenses related to acquisitions 0.2 % 0.2 % 0.1 % 0.2 % 0.4 % Adjusted total compensation ratio (4) 64.0 % 65.4 % 65.7 % 65.5 % 64.6 % Non-compensation expenses $ 602 $ 557 $ 583 $ 599 $ 633 Less: Bank loan provision/(benefit) for credit losses 6 (3) 5 (26) (8) Less: Total non-compensation-related acquisition expenses (as detailed on slide 17) 29 13 20 24 32 Pre-provision adjusted non-compensation expenses (5) $ 567 $ 547 $ 558 $ 601 $ 609
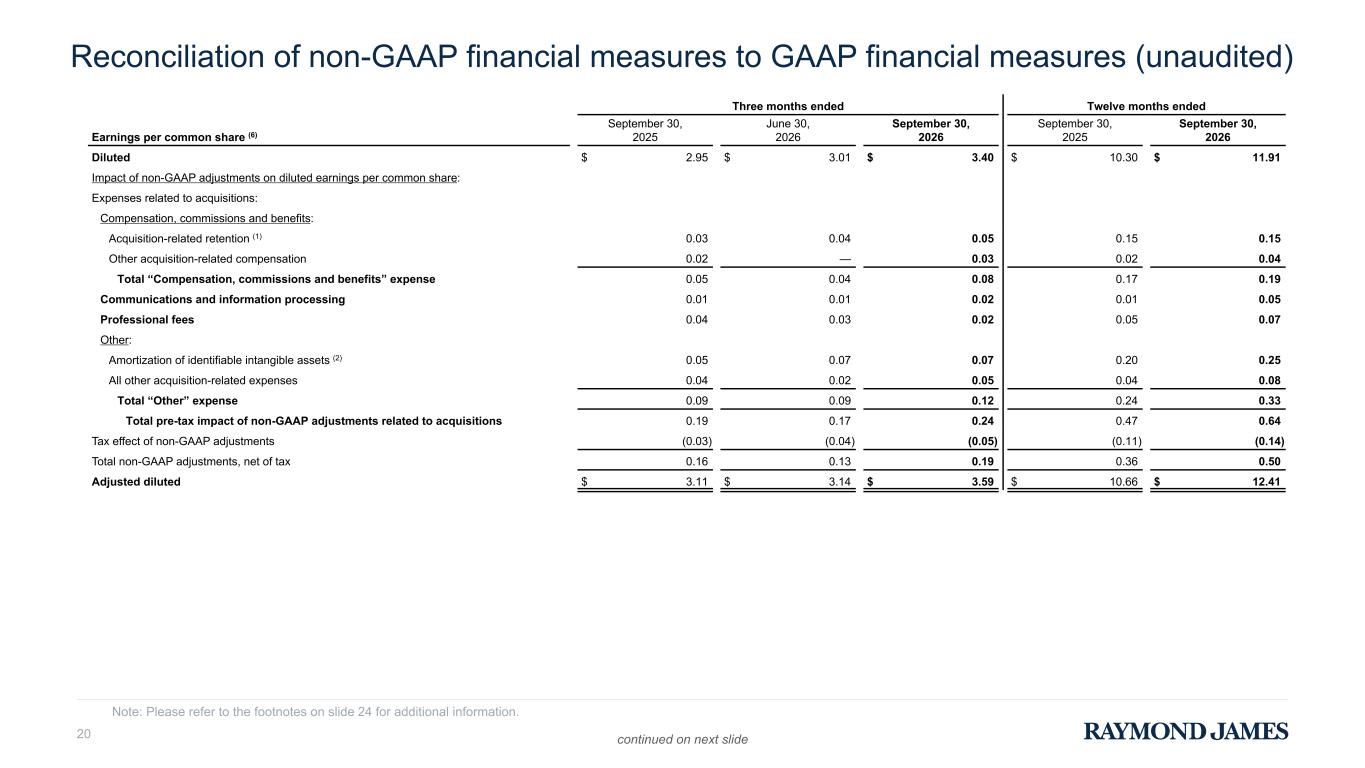
Reconciliation of non-GAAP financial measures to GAAP financial measures (unaudited) 20 Note: Please refer to the footnotes on slide 24 for additional information. Three months ended Twelve months ended Earnings per common share (6) September 30, 2025 June 30, 2026 September 30, 2026 September 30, 2025 September 30, 2026 Diluted $ 2.95 $ 3.01 $ 3.40 $ 10.30 $ 11.91 Impact of non-GAAP adjustments on diluted earnings per common share: Expenses related to acquisitions: Compensation, commissions and benefits: Acquisition-related retention (1) 0.03 0.04 0.05 0.15 0.15 Other acquisition-related compensation 0.02 — 0.03 0.02 0.04 Total “Compensation, commissions and benefits” expense 0.05 0.04 0.08 0.17 0.19 Communications and information processing 0.01 0.01 0.02 0.01 0.05 Professional fees 0.04 0.03 0.02 0.05 0.07 Other: Amortization of identifiable intangible assets (2) 0.05 0.07 0.07 0.20 0.25 All other acquisition-related expenses 0.04 0.02 0.05 0.04 0.08 Total “Other” expense 0.09 0.09 0.12 0.24 0.33 Total pre-tax impact of non-GAAP adjustments related to acquisitions 0.19 0.17 0.24 0.47 0.64 Tax effect of non-GAAP adjustments (0.03) (0.04) (0.05) (0.11) (0.14) Total non-GAAP adjustments, net of tax 0.16 0.13 0.19 0.36 0.50 Adjusted diluted $ 3.11 $ 3.14 $ 3.59 $ 10.66 $ 12.41 continued on next slide
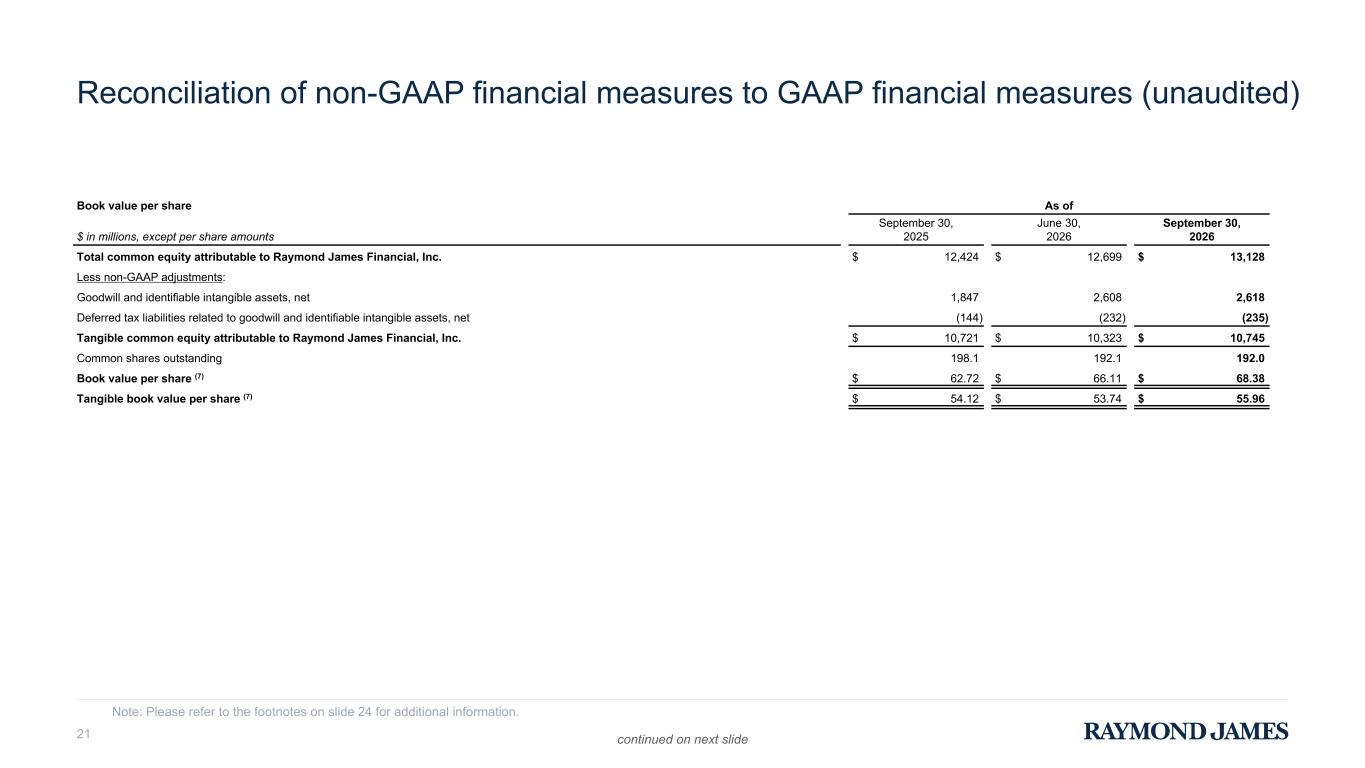
Reconciliation of non-GAAP financial measures to GAAP financial measures (unaudited) 21 Note: Please refer to the footnotes on slide 24 for additional information. Book value per share As of $ in millions, except per share amounts September 30, 2025 June 30, 2026 September 30, 2026 Total common equity attributable to Raymond James Financial, Inc. $ 12,424 $ 12,699 $ 13,128 Less non-GAAP adjustments: Goodwill and identifiable intangible assets, net 1,847 2,608 2,618 Deferred tax liabilities related to goodwill and identifiable intangible assets, net (144) (232) (235) Tangible common equity attributable to Raymond James Financial, Inc. $ 10,721 $ 10,323 $ 10,745 Common shares outstanding 198.1 192.1 192.0 Book value per share (7) $ 62.72 $ 66.11 $ 68.38 Tangible book value per share (7) $ 54.12 $ 53.74 $ 55.96 continued on next slide
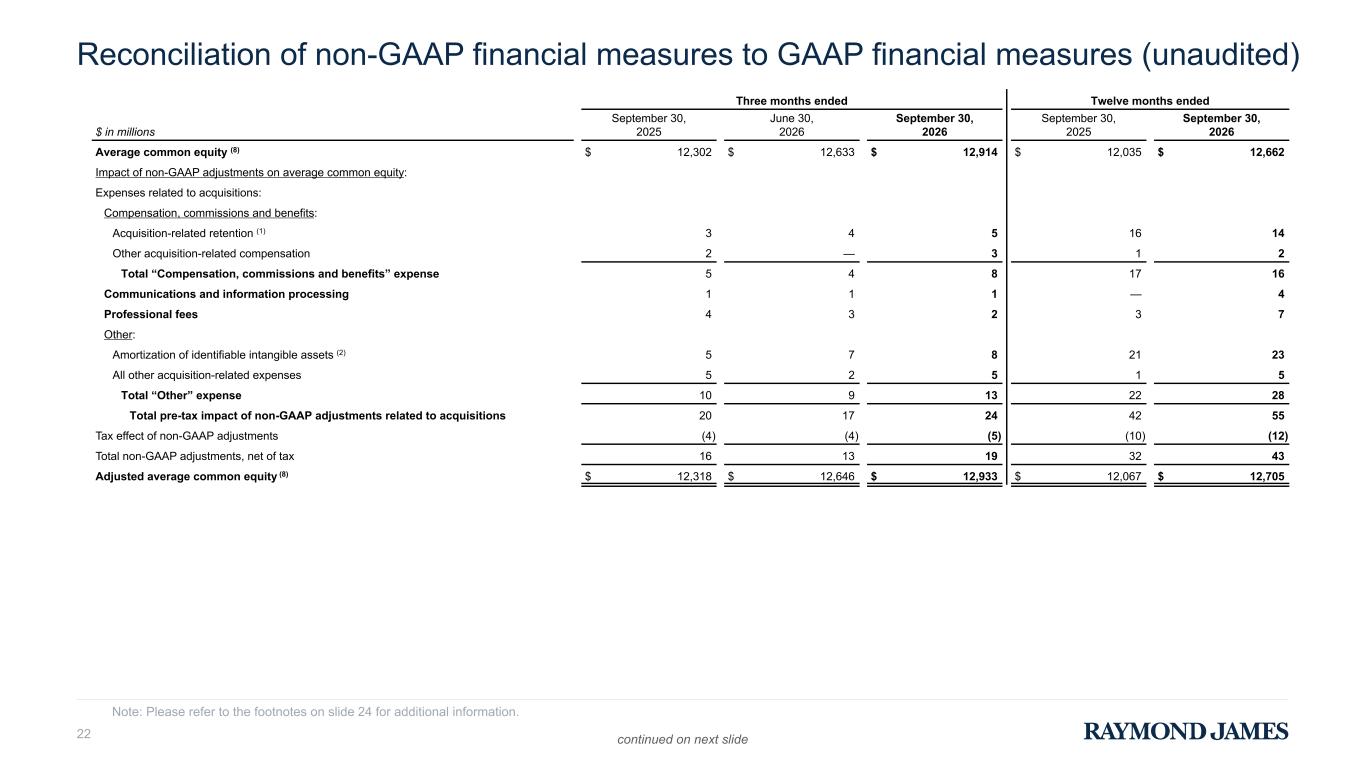
Reconciliation of non-GAAP financial measures to GAAP financial measures (unaudited) 22 Note: Please refer to the footnotes on slide 24 for additional information. Three months ended Twelve months ended $ in millions September 30, 2025 June 30, 2026 September 30, 2026 September 30, 2025 September 30, 2026 Average common equity (8) $ 12,302 $ 12,633 $ 12,914 $ 12,035 $ 12,662 Impact of non-GAAP adjustments on average common equity: Expenses related to acquisitions: Compensation, commissions and benefits: Acquisition-related retention (1) 3 4 5 16 14 Other acquisition-related compensation 2 — 3 1 2 Total “Compensation, commissions and benefits” expense 5 4 8 17 16 Communications and information processing 1 1 1 — 4 Professional fees 4 3 2 3 7 Other: Amortization of identifiable intangible assets (2) 5 7 8 21 23 All other acquisition-related expenses 5 2 5 1 5 Total “Other” expense 10 9 13 22 28 Total pre-tax impact of non-GAAP adjustments related to acquisitions 20 17 24 42 55 Tax effect of non-GAAP adjustments (4) (4) (5) (10) (12) Total non-GAAP adjustments, net of tax 16 13 19 32 43 Adjusted average common equity (8) $ 12,318 $ 12,646 $ 12,933 $ 12,067 $ 12,705 continued on next slide
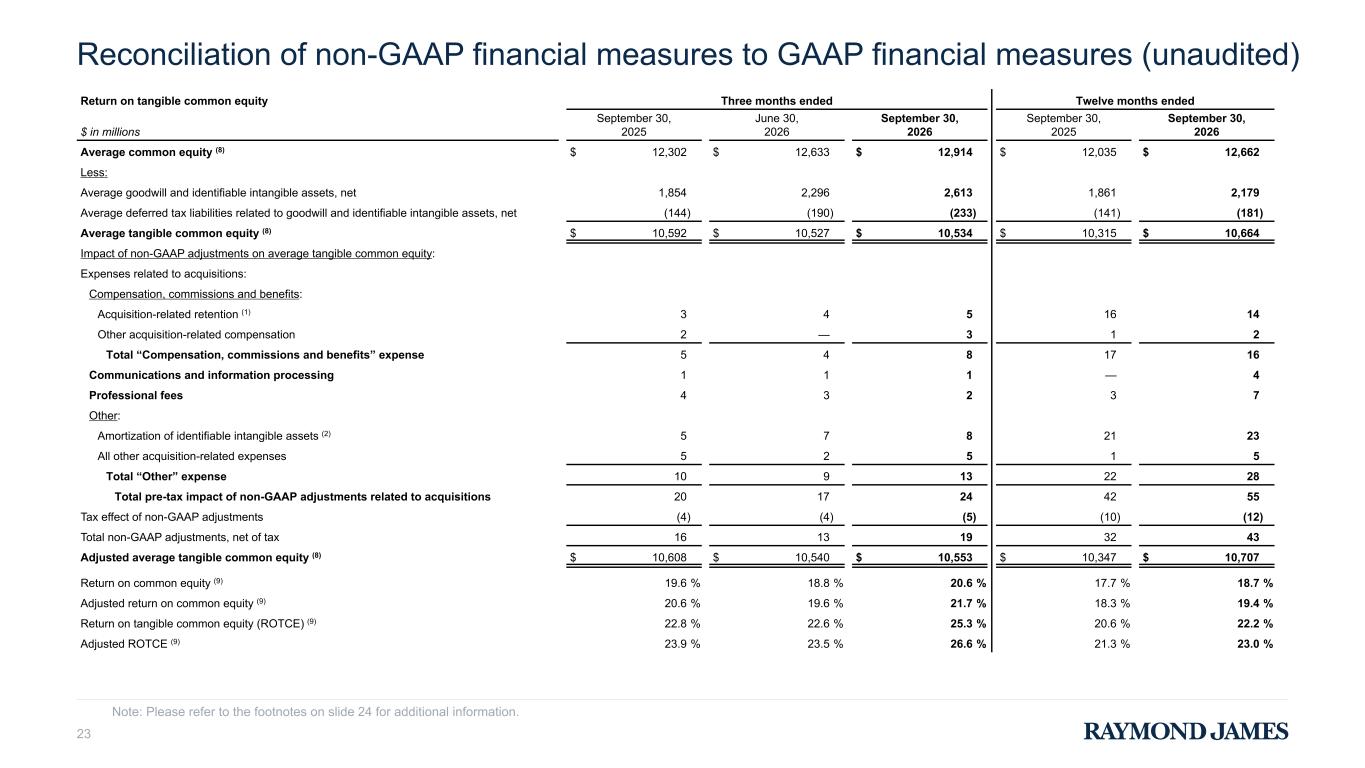
Reconciliation of non-GAAP financial measures to GAAP financial measures (unaudited) 23 Return on tangible common equity Three months ended Twelve months ended $ in millions September 30, 2025 June 30, 2026 September 30, 2026 September 30, 2025 September 30, 2026 Average common equity (8) $ 12,302 $ 12,633 $ 12,914 $ 12,035 $ 12,662 Less: Average goodwill and identifiable intangible assets, net 1,854 2,296 2,613 1,861 2,179 Average deferred tax liabilities related to goodwill and identifiable intangible assets, net (144) (190) (233) (141) (181) Average tangible common equity (8) $ 10,592 $ 10,527 $ 10,534 $ 10,315 $ 10,664 Impact of non-GAAP adjustments on average tangible common equity: Expenses related to acquisitions: Compensation, commissions and benefits: Acquisition-related retention (1) 3 4 5 16 14 Other acquisition-related compensation 2 — 3 1 2 Total “Compensation, commissions and benefits” expense 5 4 8 17 16 Communications and information processing 1 1 1 — 4 Professional fees 4 3 2 3 7 Other: Amortization of identifiable intangible assets (2) 5 7 8 21 23 All other acquisition-related expenses 5 2 5 1 5 Total “Other” expense 10 9 13 22 28 Total pre-tax impact of non-GAAP adjustments related to acquisitions 20 17 24 42 55 Tax effect of non-GAAP adjustments (4) (4) (5) (10) (12) Total non-GAAP adjustments, net of tax 16 13 19 32 43 Adjusted average tangible common equity (8) $ 10,608 $ 10,540 $ 10,553 $ 10,347 $ 10,707 Return on common equity (9) 19.6 % 18.8 % 20.6 % 17.7 % 18.7 % Adjusted return on common equity (9) 20.6 % 19.6 % 21.7 % 18.3 % 19.4 % Return on tangible common equity (ROTCE) (9) 22.8 % 22.6 % 25.3 % 20.6 % 22.2 % Adjusted ROTCE (9) 23.9 % 23.5 % 26.6 % 21.3 % 23.0 % Note: Please refer to the footnotes on slide 24 for additional information.
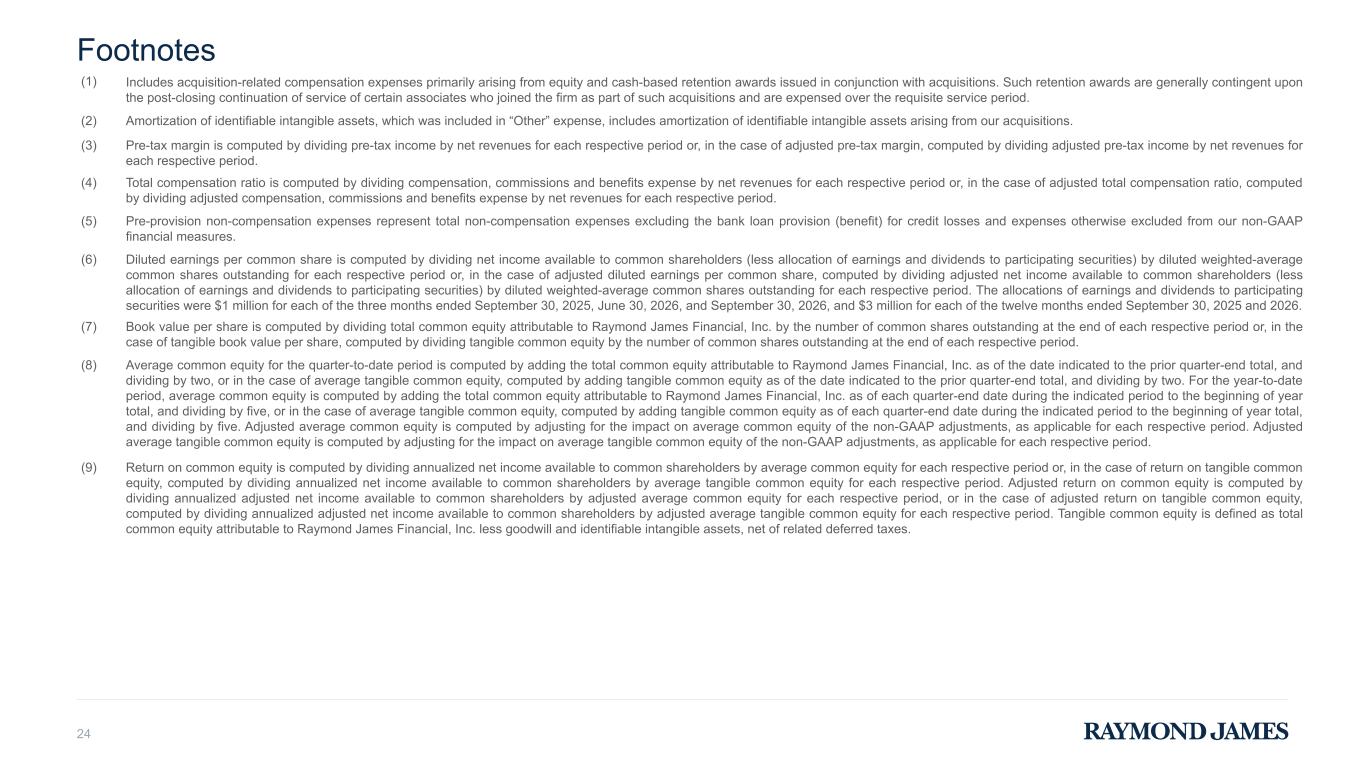
Footnotes 24 (1) Includes acquisition-related compensation expenses primarily arising from equity and cash-based retention awards issued in conjunction with acquisitions. Such retention awards are generally contingent upon the post-closing continuation of service of certain associates who joined the firm as part of such acquisitions and are expensed over the requisite service period. (2) Amortization of identifiable intangible assets, which was included in “Other” expense, includes amortization of identifiable intangible assets arising from our acquisitions. (3) Pre-tax margin is computed by dividing pre-tax income by net revenues for each respective period or, in the case of adjusted pre-tax margin, computed by dividing adjusted pre-tax income by net revenues for each respective period. (4) Total compensation ratio is computed by dividing compensation, commissions and benefits expense by net revenues for each respective period or, in the case of adjusted total compensation ratio, computed by dividing adjusted compensation, commissions and benefits expense by net revenues for each respective period. (5) Pre-provision non-compensation expenses represent total non-compensation expenses excluding the bank loan provision (benefit) for credit losses and expenses otherwise excluded from our non-GAAP financial measures. (6) Diluted earnings per common share is computed by dividing net income available to common shareholders (less allocation of earnings and dividends to participating securities) by diluted weighted-average common shares outstanding for each respective period or, in the case of adjusted diluted earnings per common share, computed by dividing adjusted net income available to common shareholders (less allocation of earnings and dividends to participating securities) by diluted weighted-average common shares outstanding for each respective period. The allocations of earnings and dividends to participating securities were $1 million for each of the three months ended September 30, 2025, June 30, 2026, and September 30, 2026, and $3 million for each of the twelve months ended September 30, 2025 and 2026. (7) Book value per share is computed by dividing total common equity attributable to Raymond James Financial, Inc. by the number of common shares outstanding at the end of each respective period or, in the case of tangible book value per share, computed by dividing tangible common equity by the number of common shares outstanding at the end of each respective period. (8) Average common equity for the quarter-to-date period is computed by adding the total common equity attributable to Raymond James Financial, Inc. as of the date indicated to the prior quarter-end total, and dividing by two, or in the case of average tangible common equity, computed by adding tangible common equity as of the date indicated to the prior quarter-end total, and dividing by two. For the year-to-date period, average common equity is computed by adding the total common equity attributable to Raymond James Financial, Inc. as of each quarter-end date during the indicated period to the beginning of year total, and dividing by five, or in the case of average tangible common equity, computed by adding tangible common equity as of each quarter-end date during the indicated period to the beginning of year total, and dividing by five. Adjusted average common equity is computed by adjusting for the impact on average common equity of the non-GAAP adjustments, as applicable for each respective period. Adjusted average tangible common equity is computed by adjusting for the impact on average tangible common equity of the non-GAAP adjustments, as applicable for each respective period. (9) Return on common equity is computed by dividing annualized net income available to common shareholders by average common equity for each respective period or, in the case of return on tangible common equity, computed by dividing annualized net income available to common shareholders by average tangible common equity for each respective period. Adjusted return on common equity is computed by dividing annualized adjusted net income available to common shareholders by adjusted average common equity for each respective period, or in the case of adjusted return on tangible common equity, computed by dividing annualized adjusted net income available to common shareholders by adjusted average tangible common equity for each respective period. Tangible common equity is defined as total common equity attributable to Raymond James Financial, Inc. less goodwill and identifiable intangible assets, net of related deferred taxes.