Performance Management |
Oct. 28, 2026 |
|||||||||||||||||||||||||||||||||||||||||
|---|---|---|---|---|---|---|---|---|---|---|---|---|---|---|---|---|---|---|---|---|---|---|---|---|---|---|---|---|---|---|---|---|---|---|---|---|---|---|---|---|---|---|
| DGI Balanced Fund | ||||||||||||||||||||||||||||||||||||||||||
| Prospectus [Line Items] | ||||||||||||||||||||||||||||||||||||||||||
| Bar Chart and Performance Table [Heading] | Performance | |||||||||||||||||||||||||||||||||||||||||
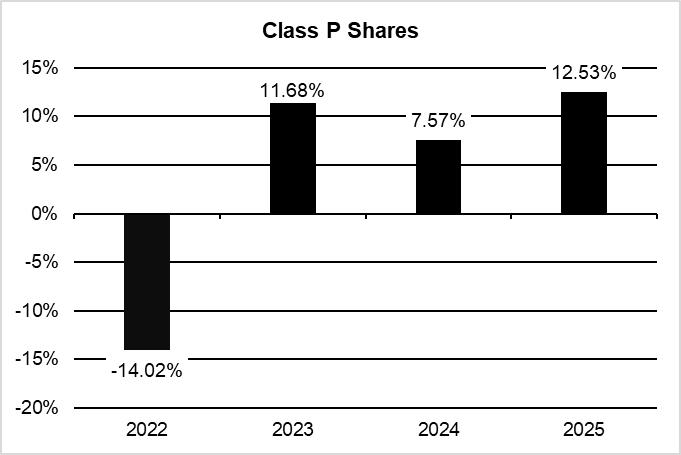
| Performance Narrative [Text Block] | The bar chart and table that follow show how the Fund performed on a calendar year basis and provide an indication of the risks of investing in the Fund by showing changes in the Fund’s performance from year to year (or since inception) and by showing the Fund’s average annual total returns for the indicated periods compared with the Fund’s blended benchmark, which is intended to provide a measure of the Fund’s performance given its investment strategy. The table below the chart also shows two additional broad-based securities market indices for markets in which the Fund may invest. You may obtain the Fund’s updated performance information by visiting the website at https://dgiinvest.com/bf or by calling 787-474-1993. As with all mutual funds, the Fund’s past performance (before and after taxes) does not predict how the Fund will perform in the future. |
|||||||||||||||||||||||||||||||||||||||||
| Performance Past Does Not Indicate Future [Text] | As with all mutual funds, the Fund’s past performance (before and after taxes) does not predict how the Fund will perform in the future. | |||||||||||||||||||||||||||||||||||||||||
| Performance Information Illustrates Variability of Returns [Text] | The bar chart and table that follow show how the Fund performed on a calendar year basis and provide an indication of the risks of investing in the Fund by showing changes in the Fund’s performance from year to year (or since inception) and by showing the Fund’s average annual total returns for the indicated periods compared with the Fund’s blended benchmark, which is intended to provide a measure of the Fund’s performance given its investment strategy. | |||||||||||||||||||||||||||||||||||||||||
| Bar Chart [Heading] | Annual Total Returns (Year Ended December 31) – Class P Shares | |||||||||||||||||||||||||||||||||||||||||
| Bar Chart [Table] |
|
|||||||||||||||||||||||||||||||||||||||||
| Bar Chart Closing [Text Block] |
|
|||||||||||||||||||||||||||||||||||||||||
| Year to Date Return, Label [Optional Text] | Year-to-Date Return as of: | |||||||||||||||||||||||||||||||||||||||||
| Bar Chart, Year to Date Return | 4.66% | |||||||||||||||||||||||||||||||||||||||||
| Bar Chart, Year to Date Return, Date | Sep. 30, 2026 | |||||||||||||||||||||||||||||||||||||||||
| Highest Quarterly Return, Label [Optional Text] | Best Quarter: | |||||||||||||||||||||||||||||||||||||||||
| Highest Quarterly Return | 10.01% | |||||||||||||||||||||||||||||||||||||||||
| Highest Quarterly Return, Date | Dec. 31, 2023 | |||||||||||||||||||||||||||||||||||||||||
| Lowest Quarterly Return, Label [Optional Text] | Worst Quarter: | |||||||||||||||||||||||||||||||||||||||||
| Lowest Quarterly Return | (7.35%) | |||||||||||||||||||||||||||||||||||||||||
| Lowest Quarterly Return, Date | Jun. 30, 2022 | |||||||||||||||||||||||||||||||||||||||||
| Performance Table Heading | Average Annual Total Returns (for the Periods Ended December 31, 2025) | |||||||||||||||||||||||||||||||||||||||||
| Performance Table Narrative | After-tax returns are shown in the table for Class P shares only and will vary for other classes. After-tax returns are calculated using the historical highest individual federal marginal income tax rates and do not reflect state and local taxes. Your actual after-tax return depends on your personal tax situation and may differ from what is shown here. After-tax returns are not relevant to investors in tax-advantaged arrangements, such as individual retirement accounts, 401(k) plans or certain other employer-sponsored retirement plans.
|
|||||||||||||||||||||||||||||||||||||||||
| Performance Table Uses Highest Federal Rate | After-tax returns are calculated using the historical highest individual federal marginal income tax rates and do not reflect state and local taxes. | |||||||||||||||||||||||||||||||||||||||||
| Performance Table Not Relevant to Tax Deferred | Your actual after-tax return depends on your personal tax situation and may differ from what is shown here. After-tax returns are not relevant to investors in tax-advantaged arrangements, such as individual retirement accounts, 401(k) plans or certain other employer-sponsored retirement plans. | |||||||||||||||||||||||||||||||||||||||||
| Performance [Table] |
|
|||||||||||||||||||||||||||||||||||||||||
| Performance Table One Class of after Tax Shown [Text] | After-tax returns are shown in the table for Class P shares only and will vary for other classes. | |||||||||||||||||||||||||||||||||||||||||
| Index No Deduction for Fees, Expenses, or Taxes [Text] | Index returns do not reflect deduction for fees, expenses, or taxes | |||||||||||||||||||||||||||||||||||||||||
| Performance Availability Website Address [Text] | https://dgiinvest.com/bf | |||||||||||||||||||||||||||||||||||||||||
| Performance Availability Phone [Text] | 787-474-1993 | |||||||||||||||||||||||||||||||||||||||||
| DGI U.S. Government Money Market Fund | ||||||||||||||||||||||||||||||||||||||||||
| Prospectus [Line Items] | ||||||||||||||||||||||||||||||||||||||||||
| Bar Chart and Performance Table [Heading] | Performance | |||||||||||||||||||||||||||||||||||||||||
| Performance Narrative [Text Block] | The Fund recently commenced operations and does not have a full calendar year performance record. Therefore, performance information is not available and has not been presented for the Fund. |