Performance Management
|
Oct. 28, 2026 |
| The U.S. Equity Portfolio | The U.S. Equity Portfolio |
|
| Prospectus [Line Items] |
|
| Bar Chart and Performance Table [Heading] |
Performance Bar Chart and Table
|
| Performance Narrative [Text Block] |
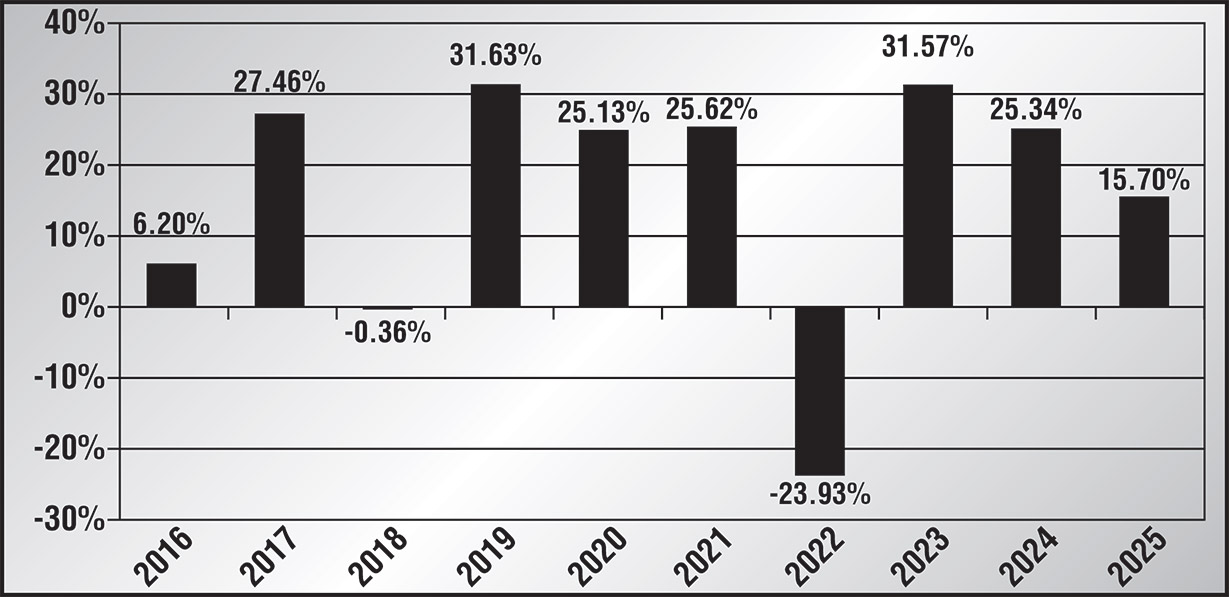
Performance. The chart and table below show how The U.S. Equity Portfolio has performed, and how its performance has varied, from year to year. The bar chart shows returns on a before-tax basis and gives some indication of risk by showing changes in the Portfolio’s yearly performance for each of the last ten full calendar years. The table accompanying the bar chart compares the Portfolio’s performance over time on a before and after-tax basis to that of a broad based market index. As of April 17, 2024, the Portfolio changed its investment strategies and certain investment policies. In view of these changes, the Portfolio’s performance record prior to this period might be less pertinent for investors considering whether to purchase shares of the Portfolio. Of course, past performance, before and after taxes, does not indicate how the Portfolio will perform in the future.
|
| Performance Past Does Not Indicate Future [Text] |
Of course, past performance, before and after taxes, does not indicate how the Portfolio will perform in the future.
|
| Performance Information Illustrates Variability of Returns [Text] |
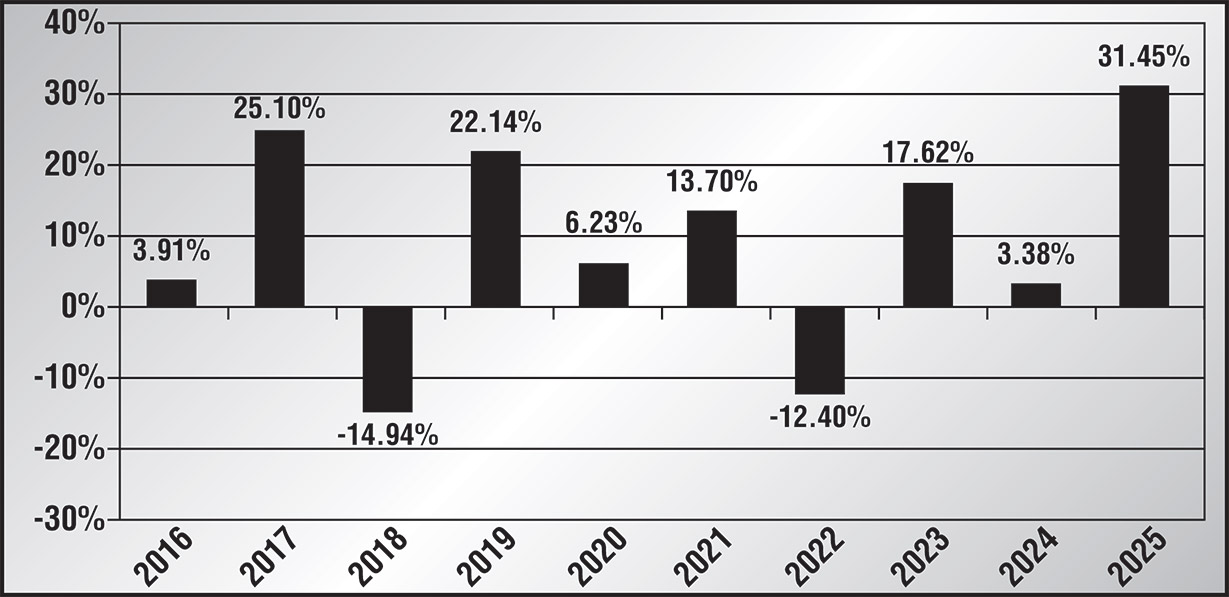
The chart and table below show how The U.S. Equity Portfolio has performed, and how its performance has varied, from year to year. The bar chart shows returns on a before-tax basis and gives some indication of risk by showing changes in the Portfolio’s yearly performance for each of the last ten full calendar years.
|
| Bar Chart [Heading] |
Year-by-Year Total Returns as of 12/31*
|
| Bar Chart [Table] |
|
| Bar Chart Footnotes [Text Block] |
* Results shown on a calendar year basis; the Portfolio’s fiscal year, however, is June 30. |
|
| Bar Chart Closing [Text Block] |
The Portfolio’s before-tax return for the period from January 1, 2026 through September 30, 2026 (non-annualized) was 12.48%.
| Best quarter:
| | 2nd Qtr. 2020
| 24.33%
| |
| Worst quarter:
| | 2nd Qtr. 2022
| -18.57%
| |
|
| Year to Date Return, Label [Optional Text] |
before-tax return
|
| Bar Chart, Year to Date Return |
12.48%
|
| Bar Chart, Year to Date Return, Date |
Sep. 30, 2026
|
| Highest Quarterly Return, Label [Optional Text] |
Best quarter:
|
| Highest Quarterly Return |
24.33%
|
| Highest Quarterly Return, Date |
Jun. 30, 2020
|
| Lowest Quarterly Return, Label [Optional Text] |
Worst quarter:
|
| Lowest Quarterly Return |
(18.57%)
|
| Lowest Quarterly Return, Date |
Jun. 30, 2022
|
| Performance Table Heading |
Average Annual Total Returns (for the periods ended 12/31/25)
|
| Performance Table Uses Highest Federal Rate |
After-tax returns are calculated using the historical highest individual Federal marginal income tax rates and do not reflect the impact of state and local taxes.
|
| Performance Table Not Relevant to Tax Deferred |
Actual after-tax returns depend on an investor’s tax situation and may differ from those shown, and after-tax returns shown are not relevant to investors who hold Portfolio shares through tax-advantaged arrangements, such as qualified retirement plans.
|
| Performance [Table] |
| | One Year
| | | Five Year
| | | Ten Year
| |
The U.S. Equity Portfolio
| | | | | | | | | |
|
| | 15.70
| %
| | 12.76
| %
| | 15.01
| %
|
After Taxes on Distributions | | 15.46
| %
| | 11.66
| %
| | 13.60
| %
|
After Taxes on Distributions and Sale of Portfolio Shares | | 9.44
| %
| | 9.89
| %
| | 12.09
| %
|
MSCI USA Index (reflects no deduction for fees, expenses or taxes)
| | 17.75
| %
| | 13.87
| %
| | 14.79
| %
|
|
| Index No Deduction for Fees, Expenses, or Taxes [Text] |
(reflects no deduction for fees, expenses or taxes)
|
| Performance Table Closing [Text Block] |
After-tax returns are calculated using the historical highest individual Federal marginal income tax rates and do not reflect the impact of state and local taxes. Actual after-tax returns depend on an investor’s tax situation and may differ from those shown, and after-tax returns shown are not relevant to investors who hold Portfolio shares through tax-advantaged arrangements, such as qualified retirement plans.
|
| The Institutional U.S. Equity Portfolio | The Institutional U.S. Equity Portfolio |
|
| Prospectus [Line Items] |
|
| Bar Chart and Performance Table [Heading] |
Performance Bar Chart and Table
|
| Performance Narrative [Text Block] |
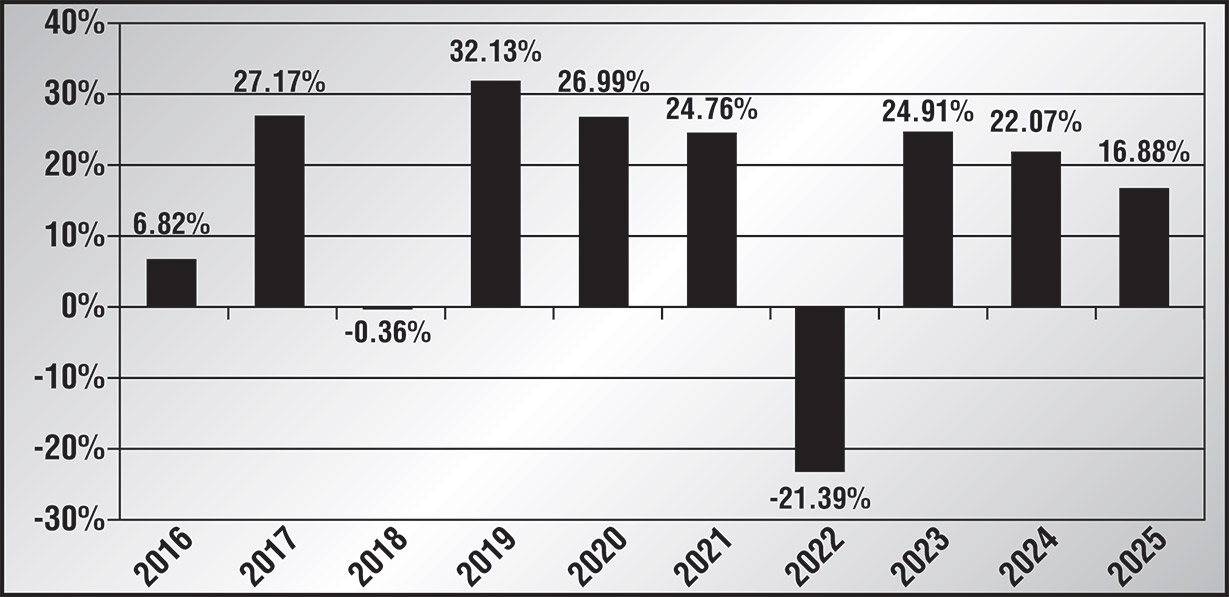
Performance. The chart and table below show how The Institutional U.S. Equity Portfolio has performed, and how its performance has varied, from year to year. The bar chart shows returns on a before-tax basis and gives some indication of risk by showing changes in the Portfolio’s yearly performance for each of the last ten full calendar years. The table accompanying the bar chart compares the Portfolio’s performance over time on a before and after-tax basis to that of a broad based market index. Of course, past performance, before and after taxes, does not indicate how the Portfolio will perform in the future.
|
| Performance Past Does Not Indicate Future [Text] |
Of course, past performance, before and after taxes, does not indicate how the Portfolio will perform in the future.
|
| Performance Information Illustrates Variability of Returns [Text] |
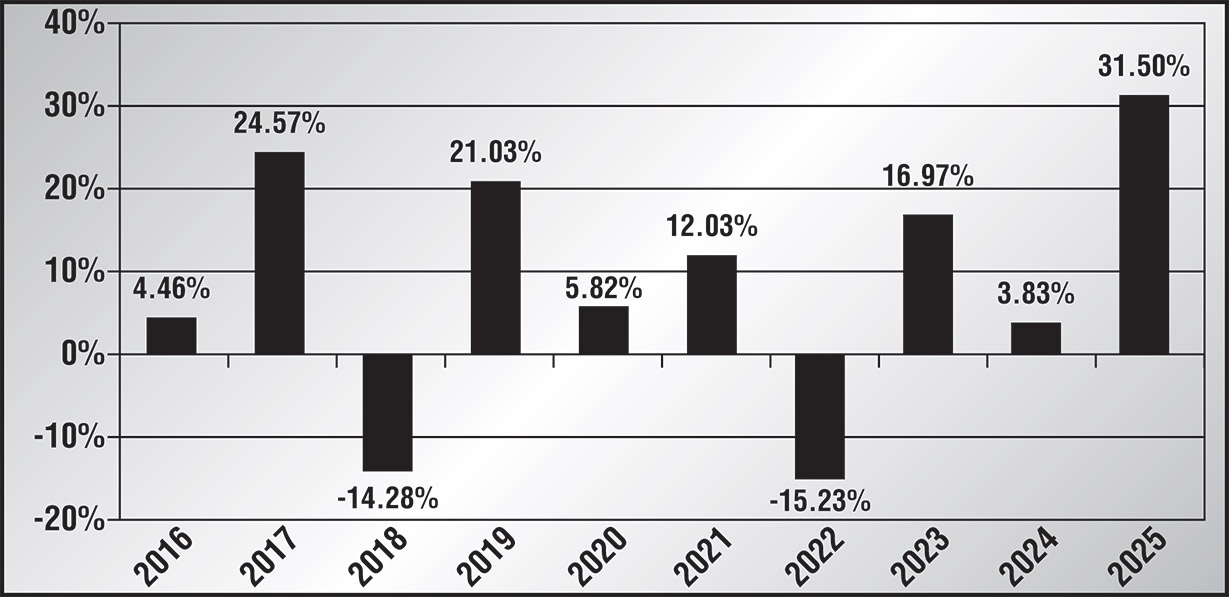
The chart and table below show how The Institutional U.S. Equity Portfolio has performed, and how its performance has varied, from year to year. The bar chart shows returns on a before-tax basis and gives some indication of risk by showing changes in the Portfolio’s yearly performance for each of the last ten full calendar years.
|
| Bar Chart [Heading] |
Year-by-Year Total Returns as of 12/31*
|
| Bar Chart [Table] |
|
| Bar Chart Footnotes [Text Block] |
* Results shown on a calendar year basis; the Portfolio’s fiscal year, however, is June 30. |
|
| Bar Chart Closing [Text Block] |
The Portfolio’s before-tax return for the period from January 1, 2026 through September 30, 2026 (non-annualized) was 8.95%.
| Best quarter:
| | 2nd Qtr. 2020
| 24.10%
| |
| Worst quarter:
| | 1st Qtr. 2020
| -17.84%
| |
|
| Year to Date Return, Label [Optional Text] |
before-tax return
|
| Bar Chart, Year to Date Return |
8.95%
|
| Bar Chart, Year to Date Return, Date |
Sep. 30, 2026
|
| Highest Quarterly Return, Label [Optional Text] |
Best quarter:
|
| Highest Quarterly Return |
24.10%
|
| Highest Quarterly Return, Date |
Jun. 30, 2020
|
| Lowest Quarterly Return, Label [Optional Text] |
Worst quarter:
|
| Lowest Quarterly Return |
(17.84%)
|
| Lowest Quarterly Return, Date |
Mar. 31, 2020
|
| Performance Table Heading |
Average Annual Total Returns (for the periods ended 12/31/25)
|
| Performance Table Uses Highest Federal Rate |
After-tax returns are calculated using the historical highest individual Federal marginal income tax rates and do not reflect the impact of state and local taxes.
|
| Performance Table Not Relevant to Tax Deferred |
Actual after-tax returns depend on an investor’s tax situation and may differ from those shown, and after-tax returns shown are not relevant to investors who hold Portfolio shares through tax-advantaged arrangements, such as qualified retirement plans.
|
| Performance [Table] |
| | One Year
| | | Five Year
| | | Ten Year
| |
The Institutional U.S. Equity Portfolio
| | | | | | | | | |
|
| | 16.88
| %
| | 11.81
| %
| | 14.78
| %
|
After Taxes on Distributions | | 11.78
| %
| | 7.15
| %
| | 11.02
| %
|
After Taxes on Distributions and Sale of Portfolio Shares | | 12.08
| %
| | 8.07
| %
| | 11.04
| %
|
MSCI USA Index (reflects no deduction for fees, expenses or taxes)
| | 17.75
| %
| | 13.87
| %
| | 14.79
| %
|
|
| Index No Deduction for Fees, Expenses, or Taxes [Text] |
(reflects no deduction for fees, expenses or taxes)
|
| Performance Table Closing [Text Block] |
After-tax returns are calculated using the historical highest individual Federal marginal income tax rates and do not reflect the impact of state and local taxes. Actual after-tax returns depend on an investor’s tax situation and may differ from those shown, and after-tax returns shown are not relevant to investors who hold Portfolio shares through tax-advantaged arrangements, such as qualified retirement plans.
|
| The ESG Capital Growth Portfolio | The ESG Capital Growth Portfolio |
|
| Prospectus [Line Items] |
|
| Bar Chart and Performance Table [Heading] |
Performance Bar Chart and Table
|
| Performance Narrative [Text Block] |
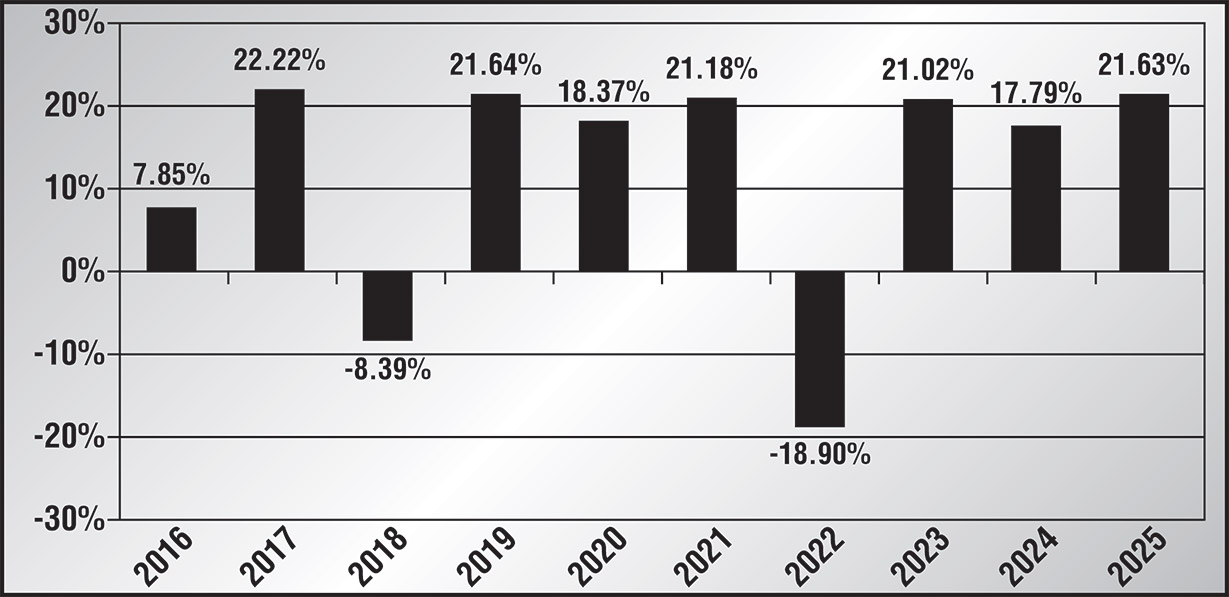
Performance. The chart and table below show how The ESG Capital Growth Portfolio (formerly, The ESG Growth Portfolio) has performed, and how its performance has varied, from year to year. The bar chart shows returns on a before-tax basis and gives some indication of risk by showing changes in the Portfolio’s yearly performance for each of the last ten full calendar years. The table accompanying the bar chart compares the Portfolio’s performance over time on a before and after-tax basis to that of a broad based market index. Of course, past performance, before and after taxes, does not indicate how the Portfolio will perform in the future.
|
| Performance Past Does Not Indicate Future [Text] |
Of course, past performance, before and after taxes, does not indicate how the Portfolio will perform in the future.
|
| Performance Information Illustrates Variability of Returns [Text] |
The chart and table below show how The ESG Capital Growth Portfolio (formerly, The ESG Growth Portfolio) has performed, and how its performance has varied, from year to year. The bar chart shows returns on a before-tax basis and gives some indication of risk by showing changes in the Portfolio’s yearly performance for each of the last ten full calendar years.
|
| Bar Chart [Heading] |
Year-by-Year Total Returns as of 12/31*
|
| Bar Chart [Table] |
|
| Bar Chart Footnotes [Text Block] |
* Results shown on a calendar year basis; the Portfolio’s fiscal year, however, is June 30. |
|
| Bar Chart Closing [Text Block] |
The Portfolio’s before-tax return for the period from January 1, 2026 through September 30, 2026 (non-annualized) was 11.61%.
| Best quarter:
| | 2nd Qtr. 2020
| 20.32%
| |
| Worst quarter:
| | 1st Qtr. 2020
| -20.53%
| |
|
| Year to Date Return, Label [Optional Text] |
before-tax return
|
| Bar Chart, Year to Date Return |
11.61%
|
| Bar Chart, Year to Date Return, Date |
Sep. 30, 2026
|
| Highest Quarterly Return, Label [Optional Text] |
Best quarter:
|
| Highest Quarterly Return |
20.32%
|
| Highest Quarterly Return, Date |
Jun. 30, 2020
|
| Lowest Quarterly Return, Label [Optional Text] |
Worst quarter:
|
| Lowest Quarterly Return |
(20.53%)
|
| Lowest Quarterly Return, Date |
Mar. 31, 2020
|
| Performance Table Heading |
Average Annual Total Returns (for the periods ended 12/31/25)
|
| Performance Table Uses Highest Federal Rate |
After-tax returns are calculated using the historical highest individual Federal marginal income tax rates and do not reflect the impact of state and local taxes.
|
| Performance Table Not Relevant to Tax Deferred |
Actual after-tax returns depend on an investor’s tax situation and may differ from those shown, and after-tax returns shown are not relevant to investors who hold Portfolio shares through tax-advantaged arrangements, such as qualified retirement plans.
|
| Performance [Table] |
| | One Year
| | | Five Year
| | | Ten Year
| |
The ESG Capital Growth Portfolio
| | | | | | | | | |
|
| | 21.63
| %
| | 11.25
| %
| | 11.47
| %
|
After Taxes on Distributions | | 15.92
| %
| | 9.63
| %
| | 10.13
| %
|
After Taxes on Distributions and Sale of Portfolio Shares | | 16.57
| %
| | 8.77
| %
| | 9.23
| %
|
MSCI World Index (reflects no deduction for fees, expenses or taxes)
| | 21.60
| %
| | 12.66
| %
| | 12.74
| %
|
|
| Index No Deduction for Fees, Expenses, or Taxes [Text] |
(reflects no deduction for fees, expenses or taxes)
|
| Performance Table Closing [Text Block] |
After-tax returns are calculated using the historical highest individual Federal marginal income tax rates and do not reflect the impact of state and local taxes. Actual after-tax returns depend on an investor’s tax situation and may differ from those shown, and after-tax returns shown are not relevant to investors who hold Portfolio shares through tax-advantaged arrangements, such as qualified retirement plans.
|
| The Catholic SRI Capital Growth Portfolio | The Catholic SRI Capital Growth Portfolio |
|
| Prospectus [Line Items] |
|
| Bar Chart and Performance Table [Heading] |
Performance Bar Chart and Table
|
| Performance Narrative [Text Block] |
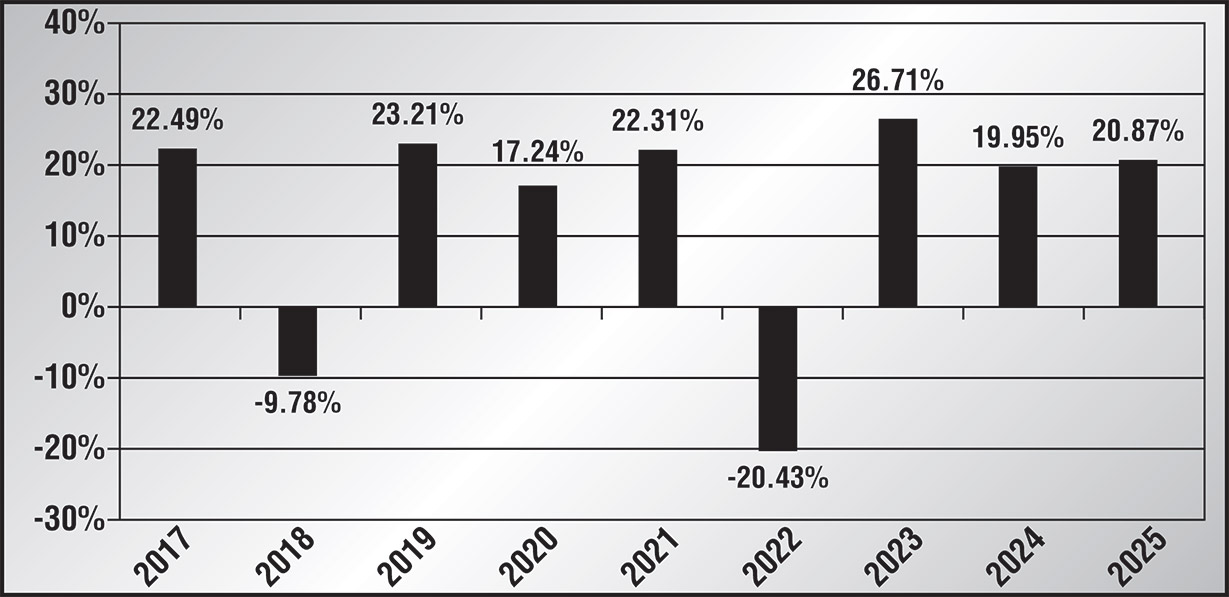
Performance. The chart and table below show how The Catholic SRI Capital Growth Portfolio (formerly, The Catholic SRI Growth Portfolio) has performed, and how its performance has varied, from year to year. The bar chart shows returns on a before-tax basis and gives some indication of risk by showing changes in the Portfolio’s yearly performance for each full calendar year since the Portfolio’s inception on January 12, 2016. The table accompanying the bar chart compares the Portfolio’s performance over time on a before and after-tax basis to that of a broad based market index. Of course, past performance, before and after taxes, does not indicate how the Portfolio will perform in the future.
|
| Performance Past Does Not Indicate Future [Text] |
Of course, past performance, before and after taxes, does not indicate how the Portfolio will perform in the future.
|
| Performance Information Illustrates Variability of Returns [Text] |
The chart and table below show how The Catholic SRI Capital Growth Portfolio (formerly, The Catholic SRI Growth Portfolio) has performed, and how its performance has varied, from year to year. The bar chart shows returns on a before-tax basis and gives some indication of risk by showing changes in the Portfolio’s yearly performance for each full calendar year since the Portfolio’s inception on January 12, 2016.
|
| Bar Chart [Heading] |
Year-by-Year Total Returns as of 12/31*
|
| Bar Chart [Table] |
|
| Bar Chart Footnotes [Text Block] |
* Results shown on a calendar year basis; the Portfolio’s fiscal year, however, is June 30. |
|
| Bar Chart Closing [Text Block] |
The Portfolio’s before-tax return for the period from January 1, 2026 through September 30, 2026 (non-annualized) was 12.10%.
| Best quarter:
| | 2nd Qtr. 2020
| 20.82%
| |
| Worst quarter:
| | 1st Qtr. 2020
| ‑21.96%
| |
|
| Year to Date Return, Label [Optional Text] |
before-tax return
|
| Bar Chart, Year to Date Return |
12.10%
|
| Bar Chart, Year to Date Return, Date |
Sep. 30, 2026
|
| Highest Quarterly Return, Label [Optional Text] |
Best quarter:
|
| Highest Quarterly Return |
20.82%
|
| Highest Quarterly Return, Date |
Jun. 30, 2020
|
| Lowest Quarterly Return, Label [Optional Text] |
Worst quarter:
|
| Lowest Quarterly Return |
(21.96%)
|
| Lowest Quarterly Return, Date |
Mar. 31, 2020
|
| Performance Table Heading |
Average Annual Total Returns (for the periods ended 12/31/25)
|
| Performance Table Uses Highest Federal Rate |
After-tax returns are calculated using the historical highest individual Federal marginal income tax rates and do not reflect the impact of state and local taxes.
|
| Performance Table Not Relevant to Tax Deferred |
Actual after-tax returns depend on an investor’s tax situation and may differ from those shown, and after-tax returns shown are not relevant to investors who hold Portfolio shares through tax-advantaged arrangements, such as qualified retirement plans.
|
| Performance [Table] |
| | One Year
| | | Five Year
| | | Since
January 12,
2016
|
The Catholic SRI Capital Growth Portfolio
| | | | | | | | | |
|
| | 20.87
| %
| | 12.32
| %
| | 12.83
| %
|
After Taxes on Distributions | | 20.45
| %
| | 10.11
| %
| | 10.91
| %
|
After Taxes on Distributions and Sale of Portfolio Shares | | 12.58
| %
| | 9.26
| %
| | 9.99
| %
|
MSCI World Index (reflects no deduction for fees, expenses or taxes)
| | 21.60
| %
| | 12.66
| %
| | 13.49
| %
|
|
| Index No Deduction for Fees, Expenses, or Taxes [Text] |
(reflects no deduction for fees, expenses or taxes)
|
| Performance Table Closing [Text Block] |
After-tax returns are calculated using the historical highest individual Federal marginal income tax rates and do not reflect the impact of state and local taxes. Actual after-tax returns depend on an investor’s tax situation and may differ from those shown, and after-tax returns shown are not relevant to investors who hold Portfolio shares through tax-advantaged arrangements, such as qualified retirement plans.
|
| The International Equity Portfolio | The International Equity Portfolio |
|
| Prospectus [Line Items] |
|
| Bar Chart and Performance Table [Heading] |
Performance Bar Chart and Table
|
| Performance Narrative [Text Block] |
Performance. The chart and table below show how The International Equity Portfolio has performed, and how its performance has varied, from year to year. The bar chart shows returns on a before-tax basis and gives some indication of risk by showing changes in the Portfolio’s yearly performance for each of the last ten full calendar years. The table accompanying the bar chart compares the Portfolio’s performance over time on a before and after-tax basis to that of a broad based market index. Of course, past performance, before and after taxes, does not indicate how the Portfolio will perform in the future.
|
| Performance Past Does Not Indicate Future [Text] |
Of course, past performance, before and after taxes, does not indicate how the Portfolio will perform in the future.
|
| Performance Information Illustrates Variability of Returns [Text] |
The chart and table below show how The International Equity Portfolio has performed, and how its performance has varied, from year to year. The bar chart shows returns on a before-tax basis and gives some indication of risk by showing changes in the Portfolio’s yearly performance for each of the last ten full calendar years.
|
| Bar Chart [Heading] |
Year-by-Year Total Returns as of 12/31*
|
| Bar Chart [Table] |
|
| Bar Chart Footnotes [Text Block] |
* Results shown on a calendar year basis; the Portfolio’s fiscal year, however, is June 30. |
|
| Bar Chart Closing [Text Block] |
The Portfolio’s before-tax return for the period from January 1, 2026 through September 30, 2026 (non-annualized) was 10.84%.
| Best quarter:
| | 4th Qtr. 2022
| 18.33%
| |
| Worst quarter:
| | 1st Qtr. 2020
| ‑23.30%
| |
|
| Year to Date Return, Label [Optional Text] |
before-tax return
|
| Bar Chart, Year to Date Return |
10.84%
|
| Bar Chart, Year to Date Return, Date |
Sep. 30, 2026
|
| Highest Quarterly Return, Label [Optional Text] |
Best quarter:
|
| Highest Quarterly Return |
18.33%
|
| Highest Quarterly Return, Date |
Dec. 31, 2022
|
| Lowest Quarterly Return, Label [Optional Text] |
Worst quarter:
|
| Lowest Quarterly Return |
(23.30%)
|
| Lowest Quarterly Return, Date |
Mar. 31, 2020
|
| Performance Table Heading |
Average Annual Total Returns (for the periods ended 12/31/25)
|
| Performance Table Uses Highest Federal Rate |
After-tax returns are calculated using the historical highest individual Federal marginal income tax rates and do not reflect the impact of state and local taxes.
|
| Performance Table Not Relevant to Tax Deferred |
Actual after-tax returns depend on an investor’s tax situation and may differ from those shown, and after-tax returns shown are not relevant to investors who hold Portfolio shares through tax-advantaged arrangements, such as qualified retirement plans.
|
| Performance [Table] |
| | One Year
| | | Five Year
| | Ten Year
|
The International
Equity Portfolio
| | | | | | | | | |
|
| | 31.45
| %
| | 9.75
| %
| | 8.61
| %
|
After Taxes on Distributions | | 31.06
| %
| | 9.15
| %
| | 8.04
| %
|
After Taxes on Distributions and Sale of Portfolio Shares | | 19.27
| %
| | 7.73
| %
| | 6.99
| %
|
MSCI EAFE Index (reflects no deduction for fees, expenses or taxes)
| | 31.89
| %
| | 9.47
| %
| | 8.72
| %
|
|
| Index No Deduction for Fees, Expenses, or Taxes [Text] |
(reflects no deduction for fees, expenses or taxes)
|
| Performance Table Closing [Text Block] |
After-tax returns are calculated using the historical highest individual Federal marginal income tax rates and do not reflect the impact of state and local taxes. Actual after-tax returns depend on an investor’s tax situation and may differ from those shown, and after-tax returns shown are not relevant to investors who hold Portfolio shares through tax-advantaged arrangements, such as qualified retirement plans.
|
| The Institutional International Equity Portfolio | The Institutional International Equity Portfolio |
|
| Prospectus [Line Items] |
|
| Bar Chart and Performance Table [Heading] |
Performance Bar Chart and Table
|
| Performance Narrative [Text Block] |
Performance. The chart and table below show how The Institutional International Equity Portfolio has performed, and how its performance has varied, from year to year. The bar chart shows returns on a before-tax basis and gives some indication of risk by showing changes in the Portfolio’s yearly performance for each of the last ten full calendar years. The table accompanying the bar chart compares the Portfolio’s performance over time on a before and after-tax basis to that of a broad based market index. Of course, past performance, before and after taxes, does not indicate how the Portfolio will perform in the future.
|
| Performance Past Does Not Indicate Future [Text] |
Of course, past performance, before and after taxes, does not indicate how the Portfolio will perform in the future.
|
| Performance Information Illustrates Variability of Returns [Text] |
The chart and table below show how The Institutional International Equity Portfolio has performed, and how its performance has varied, from year to year. The bar chart shows returns on a before-tax basis and gives some indication of risk by showing changes in the Portfolio’s yearly performance for each of the last ten full calendar years.
|
| Bar Chart [Heading] |
Year-by-Year Total Returns as of 12/31*
|
| Bar Chart [Table] |
|
| Bar Chart Footnotes [Text Block] |
* Results shown on a calendar year basis; the Portfolio’s fiscal year, however, is June 30. |
|
| Bar Chart Closing [Text Block] |
The Portfolio’s before-tax return for the period from January 1, 2026 through September 30, 2026 (non-annualized) was 6.72%.
| Best quarter:
| | 4th Qtr. 2022
| 18.31%
| |
| Worst quarter:
| | 1st Qtr. 2020
| ‑25.17%
| |
|
| Year to Date Return, Label [Optional Text] |
before-tax return
|
| Bar Chart, Year to Date Return |
6.72%
|
| Bar Chart, Year to Date Return, Date |
Sep. 30, 2026
|
| Highest Quarterly Return, Label [Optional Text] |
Best quarter:
|
| Highest Quarterly Return |
18.31%
|
| Highest Quarterly Return, Date |
Dec. 31, 2022
|
| Lowest Quarterly Return, Label [Optional Text] |
Worst quarter:
|
| Lowest Quarterly Return |
(25.17%)
|
| Lowest Quarterly Return, Date |
Mar. 31, 2020
|
| Performance Table Heading |
Average Annual Total Returns (for the periods ended 12/31/25)
|
| Performance Table Uses Highest Federal Rate |
After-tax returns are calculated using the historical highest individual Federal marginal income tax rates and do not reflect the impact of state and local taxes.
|
| Performance Table Not Relevant to Tax Deferred |
Actual after-tax returns depend on an investor’s tax situation and may differ from those shown, and after-tax returns shown are not relevant to investors who hold Portfolio shares through tax-advantaged arrangements, such as qualified retirement plans.
|
| Performance [Table] |
| | One Year
| | | Five Year
| | Ten Year
|
The Institutional International Equity Portfolio
| | | | | | | | | |
|
| | 31.50
| %
| | 8.69
| %
| | 8.04
| %
|
After Taxes on Distributions | | 26.19
| %
| | 6.70
| %
| | 6.54
| %
|
After Taxes on Distributions and Sale of Portfolio Shares | | 19.89
| %
| | 6.25
| %
| | 6.06
| %
|
MSCI EAFE Index (reflects no deduction for fees, expenses or taxes)
| | 31.89
| %
| | 9.47
| %
| | 8.72
| %
|
|
| Index No Deduction for Fees, Expenses, or Taxes [Text] |
(reflects no deduction for fees, expenses or taxes)
|
| Performance Table Closing [Text Block] |
After-tax returns are calculated using the historical highest individual Federal marginal income tax rates and do not reflect the impact of state and local taxes. Actual after-tax returns depend on an investor’s tax situation and may differ from those shown, and after-tax returns shown are not relevant to investors who hold Portfolio shares through tax-advantaged arrangements, such as qualified retirement plans.
|
| The Emerging Markets Portfolio | The Emerging Markets Portfolio |
|
| Prospectus [Line Items] |
|
| Bar Chart and Performance Table [Heading] |
Performance Bar Chart and Table
|
| Performance Narrative [Text Block] |
Performance. The chart and table below show how The Emerging Markets Portfolio has performed, and how its performance has varied, from year to year. The bar chart shows returns on a before-tax basis and gives some indication of risk by showing changes in the Portfolio’s yearly performance for each of the last ten full calendar years. The table accompanying the bar chart compares the Portfolio’s performance over time on a before and after-tax basis to that of a broad based market index. Of course, past performance, before and after taxes, does not indicate how the Portfolio will perform in the future.
|
| Performance Past Does Not Indicate Future [Text] |
Of course, past performance, before and after taxes, does not indicate how the Portfolio will perform in the future.
|
| Performance Information Illustrates Variability of Returns [Text] |
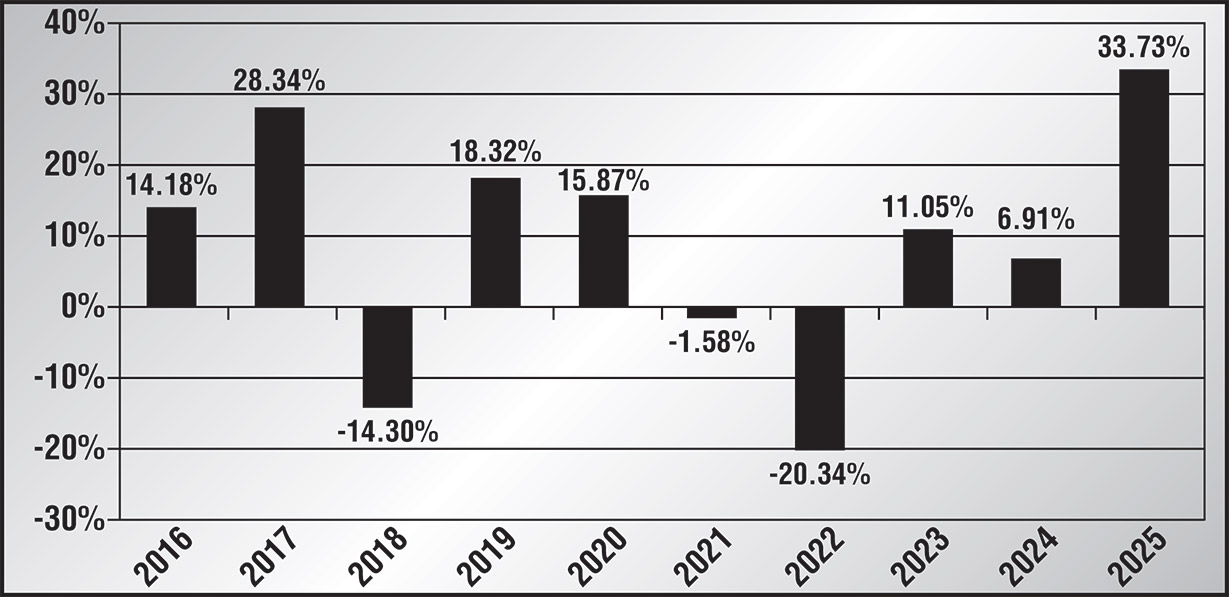
The chart and table below show how The Emerging Markets Portfolio has performed, and how its performance has varied, from year to year. The bar chart shows returns on a before-tax basis and gives some indication of risk by showing changes in the Portfolio’s yearly performance for each of the last ten full calendar years.
|
| Bar Chart [Heading] |
Year-by-Year Total Returns as of 12/31*
|
| Bar Chart [Table] |
|
| Bar Chart Footnotes [Text Block] |
* Results shown on a calendar year basis; the Portfolio’s fiscal year, however, is June 30. |
|
| Bar Chart Closing [Text Block] |
The Portfolio’s before-tax return for the period from January 1, 2026 through September 30, 2026 (non-annualized) was 20.76%.
| Best quarter:
| | 2nd Qtr. 2020
| 18.11%
| |
| Worst quarter:
| | 1st Qtr. 2020
| ‑23.62%
| |
|
| Year to Date Return, Label [Optional Text] |
before-tax return
|
| Bar Chart, Year to Date Return |
20.76%
|
| Bar Chart, Year to Date Return, Date |
Sep. 30, 2026
|
| Highest Quarterly Return, Label [Optional Text] |
Best quarter:
|
| Highest Quarterly Return |
18.11%
|
| Highest Quarterly Return, Date |
Jun. 30, 2020
|
| Lowest Quarterly Return, Label [Optional Text] |
Worst quarter:
|
| Lowest Quarterly Return |
(23.62%)
|
| Lowest Quarterly Return, Date |
Mar. 31, 2020
|
| Performance Table Heading |
Average Annual Total Returns (for the periods ended 12/31/25)
|
| Performance Table Uses Highest Federal Rate |
After-tax returns are calculated using the historical highest individual Federal marginal income tax rates and do not reflect the impact of state and local taxes.
|
| Performance Table Not Relevant to Tax Deferred |
Actual after-tax returns depend on an investor’s tax situation and may differ from those shown, and after-tax returns shown are not relevant to investors who hold Portfolio shares through tax-advantaged arrangements, such as qualified retirement plans.
|
| Performance [Table] |
| | One Year
| | | Five Year
| | Ten Year
|
The Emerging Markets Portfolio
| | | | | | | | | |
|
| | 33.73
| %
| | 4.48
| %
| | 7.92
| %
|
After Taxes on Distributions | | 31.67
| %
| | 3.65
| %
| | 7.29
| %
|
After Taxes on Distributions and Sale of Portfolio Shares | | 20.64
| %
| | 3.33
| %
| | 6.38
| %
|
MSCI Emerging Markets Index (reflects no deduction for fees, expenses or taxes)
| | 34.36
| %
| | 4.67
| %
| | 8.86
| %
|
|
| Index No Deduction for Fees, Expenses, or Taxes [Text] |
(reflects no deduction for fees, expenses or taxes)
|
| Performance Table Closing [Text Block] |
After-tax returns are calculated using the historical highest individual Federal marginal income tax rates and do not reflect the impact of state and local taxes. Actual after-tax returns depend on an investor’s tax situation and may differ from those shown, and after-tax returns shown are not relevant to investors who hold Portfolio shares through tax-advantaged arrangements, such as qualified retirement plans.
|
| The Core Fixed Income Portfolio | The Core Fixed Income Portfolio |
|
| Prospectus [Line Items] |
|
| Bar Chart and Performance Table [Heading] |
Performance Bar Chart and Table
|
| Performance Narrative [Text Block] |
Performance. The chart and table below show how The Core Fixed Income Portfolio has performed, and how its performance has varied, from year to year. The bar chart shows returns on a before-tax basis and gives some indication of risk by showing changes in the Portfolio’s yearly performance for each of the last ten full calendar years. The table accompanying the bar chart compares the Portfolio’s performance over time on a before and after-tax basis to that of a broad based market index. Of course, past performance, before and after taxes, does not indicate how the Portfolio will perform in the future.
|
| Performance Past Does Not Indicate Future [Text] |
Of course, past performance, before and after taxes, does not indicate how the Portfolio will perform in the future.
|
| Performance Information Illustrates Variability of Returns [Text] |
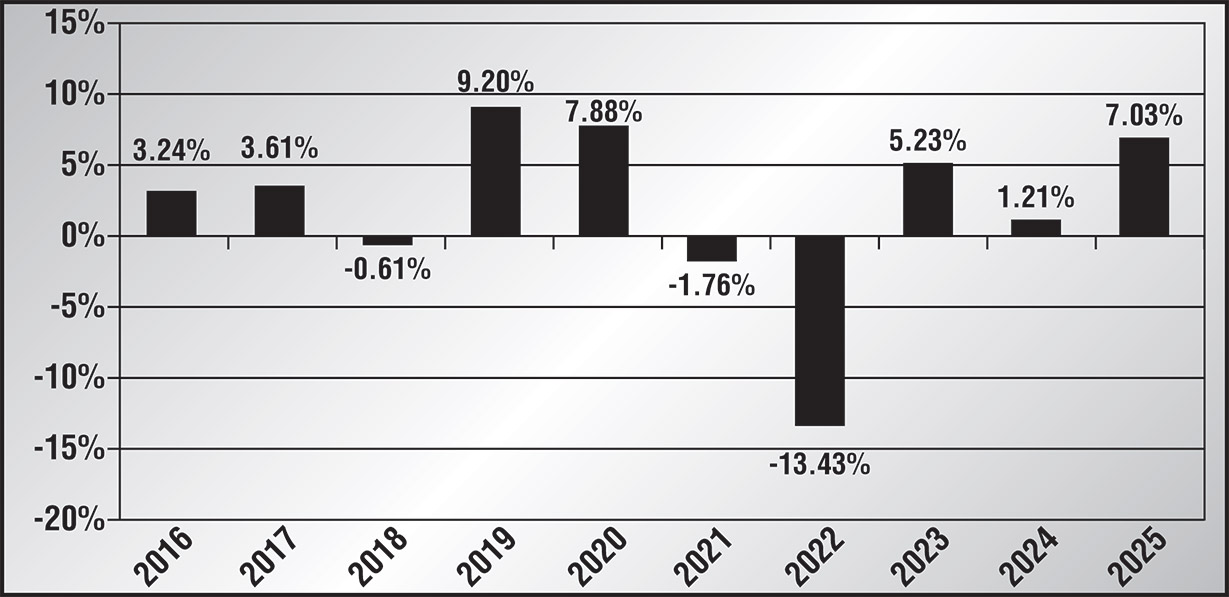
The chart and table below show how The Core Fixed Income Portfolio has performed, and how its performance has varied, from year to year. The bar chart shows returns on a before-tax basis and gives some indication of risk by showing changes in the Portfolio’s yearly performance for each of the last ten full calendar years.
|
| Bar Chart [Heading] |
Year-by-Year Total Returns as of 12/31*
|
| Bar Chart [Table] |
|
| Bar Chart Footnotes [Text Block] |
* Results shown on a calendar year basis; the Portfolio’s fiscal year, however, is June 30. |
|
| Bar Chart Closing [Text Block] |
The Portfolio’s before-tax return for the period from January 1, 2026 through September 30, 2026 (non-annualized) was ‑3.70%.
| Best quarter:
| | 4th Qtr. 2023
| 5.61%
| |
| Worst quarter:
| | 1st Qtr. 2022
| ‑6.31%
| |
|
| Year to Date Return, Label [Optional Text] |
before-tax return
|
| Bar Chart, Year to Date Return |
(3.70%)
|
| Bar Chart, Year to Date Return, Date |
Sep. 30, 2026
|
| Highest Quarterly Return, Label [Optional Text] |
Best quarter:
|
| Highest Quarterly Return |
5.61%
|
| Highest Quarterly Return, Date |
Dec. 31, 2023
|
| Lowest Quarterly Return, Label [Optional Text] |
Worst quarter:
|
| Lowest Quarterly Return |
(6.31%)
|
| Lowest Quarterly Return, Date |
Mar. 31, 2022
|
| Performance Table Heading |
Average Annual Total Returns (for the periods ended 12/31/25)
|
| Performance Table Uses Highest Federal Rate |
After-tax returns are calculated using the historical highest individual Federal marginal income tax rates and do not reflect the impact of state and local taxes.
|
| Performance Table Not Relevant to Tax Deferred |
Actual after-tax returns depend on an investor’s tax situation and may differ from those shown, and after-tax returns shown are not relevant to investors who hold Portfolio shares through tax-advantaged arrangements, such as qualified retirement plans.
|
| Performance [Table] |
| | One Year
| | Five Year
| | Ten Year
|
The Core Fixed Income Portfolio
| | | | | | | | | |
|
| | 7.03
| %
| | ‑0.62
| %
| | 1.96
| %
|
After Taxes on Distributions | | 5.49
| %
| | ‑1.88
| %
| | 0.77
| %
|
After Taxes on Distributions and Sale of Portfolio Shares | | 4.14
| %
| | -0.99
| %
| | 1.01
| %
|
Bloomberg U.S. Aggregate Bond Index (reflects no deduction for fees, expenses or taxes)
| | 7.30
| %
| | ‑0.36
| %
| | 2.01
| %
|
|
| Index No Deduction for Fees, Expenses, or Taxes [Text] |
(reflects no deduction for fees, expenses or taxes)
|
| Performance Table Closing [Text Block] |
After-tax returns are calculated using the historical highest individual Federal marginal income tax rates and do not reflect the impact of state and local taxes. Actual after-tax returns depend on an investor’s tax situation and may differ from those shown, and after-tax returns shown are not relevant to investors who hold Portfolio shares through tax-advantaged arrangements, such as qualified retirement plans.
|
| The Corporate Opportunities Portfolio | The Corporate Opportunities Portfolio |
|
| Prospectus [Line Items] |
|
| Bar Chart and Performance Table [Heading] |
Performance Bar Chart and Table
|
| Performance Narrative [Text Block] |
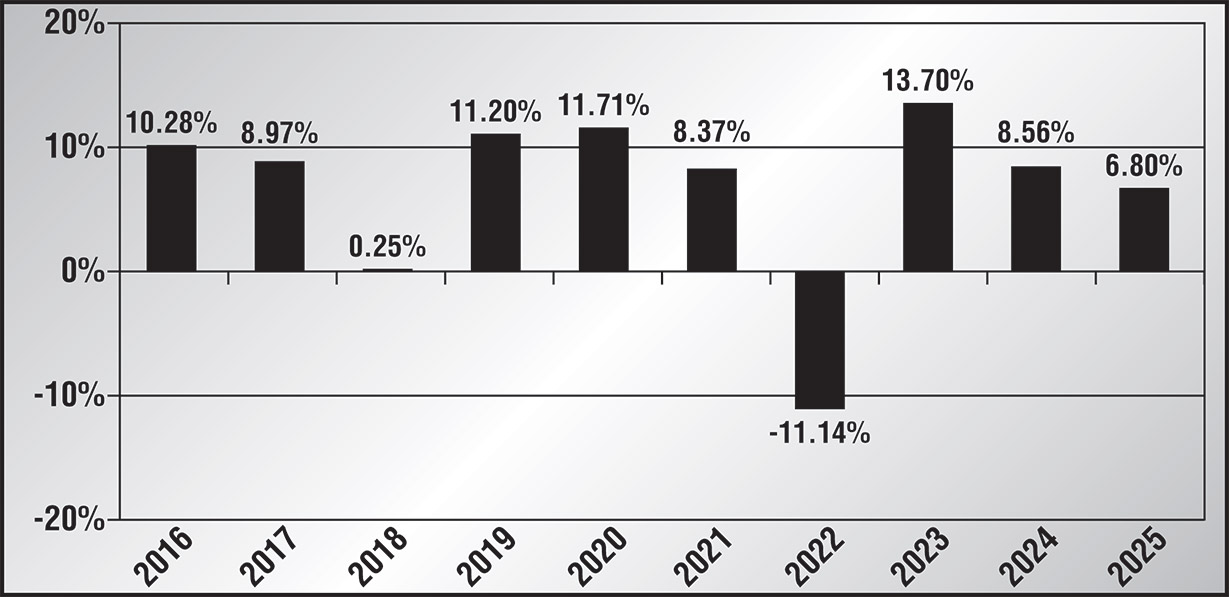
Performance. The chart and table below show how The Corporate Opportunities Portfolio has performed, and how its performance has varied, from year to year. The bar chart shows returns on a before-tax basis and gives some indication of risk by showing changes in the Portfolio’s yearly performance for each of the last ten full calendar years. The table accompanying the bar chart compares the Portfolio’s performance over time on a before and after-tax basis to that of a broad based market index and an index that more closely reflects the investments of the Portfolio. Of course, past performance, before and after taxes, does not indicate how the Portfolio will perform in the future. In addition, the Portfolio, prior to August 17, 2020 when it changed its name and primary investment strategy, invested primarily in fixed income securities including at least 50% in high yield securities. The Portfolio’s performance information prior to August 17, 2020 relates only to the Portfolio’s former principal investment strategies.
|
| Performance Past Does Not Indicate Future [Text] |
Of course, past performance, before and after taxes, does not indicate how the Portfolio will perform in the future.
|
| Performance Information Illustrates Variability of Returns [Text] |
The chart and table below show how The Corporate Opportunities Portfolio has performed, and how its performance has varied, from year to year. The bar chart shows returns on a before-tax basis and gives some indication of risk by showing changes in the Portfolio’s yearly performance for each of the last ten full calendar years.
|
| Bar Chart [Heading] |
Year-by-Year Total Returns as of 12/31*
|
| Bar Chart [Table] |
|
| Bar Chart Footnotes [Text Block] |
* Results shown on a calendar year basis; the Portfolio’s fiscal year, however, is June 30. |
|
| Bar Chart Closing [Text Block] |
The Portfolio’s before-tax return for the period from January 1, 2026 through September 30, 2026 (non-annualized) was ‑1.08%.
| Best quarter:
| | 2nd Qtr. 2020
| 7.05%
| |
| Worst quarter:
| | 2nd Qtr. 2022
| ‑7.26%
| |
|
| Year to Date Return, Label [Optional Text] |
before-tax return
|
| Bar Chart, Year to Date Return |
(1.08%)
|
| Bar Chart, Year to Date Return, Date |
Sep. 30, 2026
|
| Highest Quarterly Return, Label [Optional Text] |
Best quarter:
|
| Highest Quarterly Return |
7.05%
|
| Highest Quarterly Return, Date |
Jun. 30, 2020
|
| Lowest Quarterly Return, Label [Optional Text] |
Worst quarter:
|
| Lowest Quarterly Return |
(7.26%)
|
| Lowest Quarterly Return, Date |
Jun. 30, 2022
|
| Performance Table Heading |
Average Annual Total Returns (for the periods ended 12/31/25)
|
| Performance Table Uses Highest Federal Rate |
After-tax returns are calculated using the historical highest individual Federal marginal income tax rates and do not reflect the impact of state and local taxes.
|
| Performance Table Not Relevant to Tax Deferred |
Actual after-tax returns depend on an investor’s tax situation and may differ from those shown, and after-tax returns shown are not relevant to investors who hold Portfolio shares through tax-advantaged arrangements, such as qualified retirement plans.
|
| Performance [Table] |
| | One Year
| | Five Year
| | Ten Year
|
The Corporate Opportunities Portfolio*
| | | | | | | | | |
|
| | 6.80
| %
| | 4.89
| %
| | 6.63
| %
|
After Taxes on Distributions | | 5.40
| %
| | 2.81
| %
| | 4.56
| %
|
After Taxes on Distributions and Sale of Portfolio Shares | | 4.02
| %
| | 2.88
| %
| | 4.26
| %
|
Bloomberg U.S. High Yield Ba/B 2% Issuer Capped Index (reflects no deduction for fees, expenses or taxes)
| | 8.78
| %
| | 4.11
| %
| | 6.15
| %
|
Bloomberg U.S. Aggregate Bond Index (reflects no deduction for fees, expenses or taxes)
| | 7.30
| %
| | ‑0.36
| %
| | 2.01
| %
|
* | Effective at the close of business August 17, 2020, the Portfolio changed its principal investment strategy to invest in a mix of equity and fixed income securities issued by corporations. See “About Benchmarks and Index Investing” for a description of the indexes. |
|
| Index No Deduction for Fees, Expenses, or Taxes [Text] |
(reflects no deduction for fees, expenses or taxes)
|
| Performance Table Closing [Text Block] |
After-tax returns are calculated using the historical highest individual Federal marginal income tax rates and do not reflect the impact of state and local taxes. Actual after-tax returns depend on an investor’s tax situation and may differ from those shown, and after-tax returns shown are not relevant to investors who hold Portfolio shares through tax-advantaged arrangements, such as qualified retirement plans.
|
| The Short-Term Municipal Bond Portfolio | The Short-Term Municipal Bond Portfolio |
|
| Prospectus [Line Items] |
|
| Bar Chart and Performance Table [Heading] |
Performance Bar Chart and Table
|
| Performance Narrative [Text Block] |
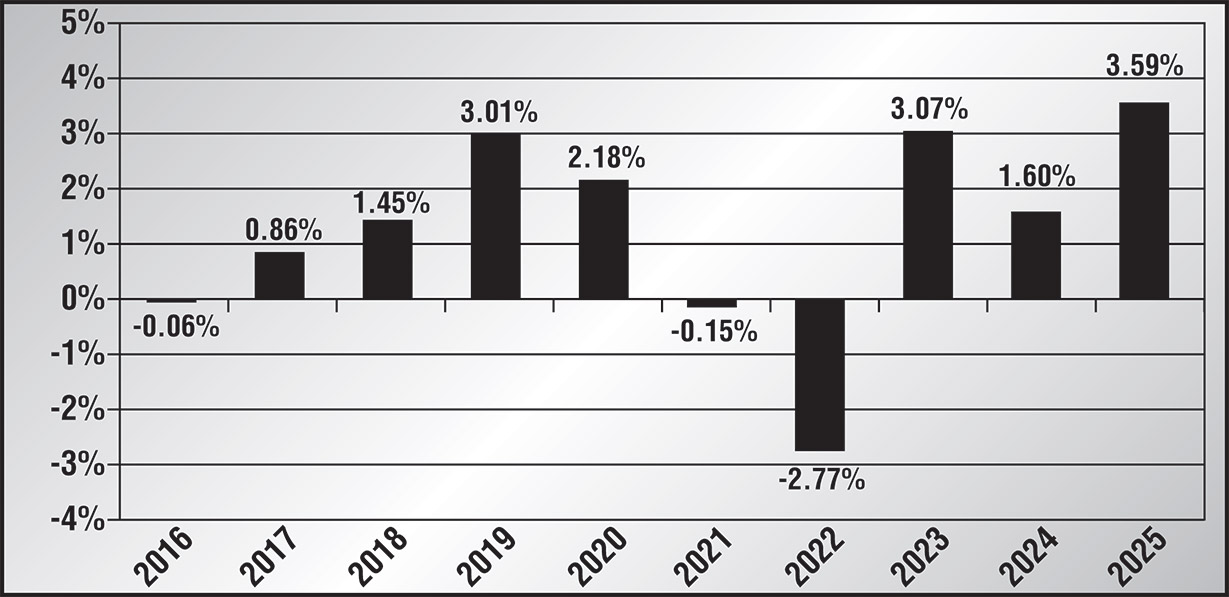
Performance. The chart and table below show how The Short-Term Municipal Bond Portfolio has performed, and how its performance has varied from year to year. The bar chart shows returns on a before-tax basis and gives some indication of risk by showing changes in the Portfolio’s yearly performance for each of the last ten full calendar years. The table accompanying the bar chart compares the Portfolio’s performance over time on a before and after-tax basis to that of a broad based market index and an index that more closely reflects the investments of the Portfolio. Of course, past performance, before and after taxes, does not indicate how the Portfolio will perform in the future.
|
| Performance Past Does Not Indicate Future [Text] |
Of course, past performance, before and after taxes, does not indicate how the Portfolio will perform in the future.
|
| Performance Information Illustrates Variability of Returns [Text] |
The chart and table below show how The Short-Term Municipal Bond Portfolio has performed, and how its performance has varied from year to year. The bar chart shows returns on a before-tax basis and gives some indication of risk by showing changes in the Portfolio’s yearly performance for each of the last ten full calendar years.
|
| Bar Chart [Heading] |
Year-by-Year Total Returns as of 12/31*
|
| Bar Chart [Table] |
|
| Bar Chart Footnotes [Text Block] |
* Results shown on a calendar year basis; the Portfolio’s fiscal year, however, is June 30. |
|
| Bar Chart Closing [Text Block] |
The Portfolio’s before-tax return for the period from January 1, 2026 through September 30, 2026 (non-annualized) was ‑1.06%.
| Best quarter:
| | 4th Qtr. 2023
| 3.22%
| |
| Worst quarter:
| | 1st Qtr. 2022
| ‑2.95%
| |
|
| Year to Date Return, Label [Optional Text] |
before-tax return
|
| Bar Chart, Year to Date Return |
(1.06%)
|
| Bar Chart, Year to Date Return, Date |
Sep. 30, 2026
|
| Highest Quarterly Return, Label [Optional Text] |
Best quarter:
|
| Highest Quarterly Return |
3.22%
|
| Highest Quarterly Return, Date |
Dec. 31, 2023
|
| Lowest Quarterly Return, Label [Optional Text] |
Worst quarter:
|
| Lowest Quarterly Return |
(2.95%)
|
| Lowest Quarterly Return, Date |
Mar. 31, 2022
|
| Performance Table Heading |
Average Annual Total Returns (for the periods ended 12/31/25)
|
| Performance Table Uses Highest Federal Rate |
After-tax returns are calculated using the historical highest individual Federal marginal income tax rates and do not reflect the impact of state and local taxes.
|
| Performance Table Not Relevant to Tax Deferred |
Actual after-tax returns depend on an investor’s tax situation and may differ from those shown, and after-tax returns shown are not relevant to investors who hold Portfolio shares through tax-advantaged arrangements, such as qualified retirement plans.
|
| Performance [Table] |
| | One Year
| | Five Year
| | Ten Year
|
The Short-Term Municipal Bond Portfolio
| | | | | | | | | |
|
| | 3.59
| %
| | 1.04
| %
| | 1.26
| %
|
After Taxes on Distributions | | 3.56
| %
| | 1.00
| %
| | 1.23
| %
|
After Taxes on Distributions and Sale of Portfolio Shares | | 3.17
| %
| | 1.18
| %
| | 1.29
| %
|
Bloomberg 1‑3 Year Municipal Bond Index (reflects no deduction for fees, expenses or taxes)
| | 3.66
| %
| | 3.17
| %
| | 1.58
| %
|
Bloomberg Municipal Bond Index (reflects no deduction for fees, expenses or taxes)
| | 4.25
| %
| | 3.88
| %
| | 2.34
| %
|
|
| Index No Deduction for Fees, Expenses, or Taxes [Text] |
(reflects no deduction for fees, expenses or taxes)
|
| Performance Table Closing [Text Block] |
After-tax returns are calculated using the historical highest individual Federal marginal income tax rates and do not reflect the impact of state and local taxes. Actual after-tax returns depend on an investor’s tax situation and may differ from those shown, and after-tax returns shown are not relevant to investors who hold Portfolio shares through tax-advantaged arrangements, such as qualified retirement plans.
|
| The Intermediate Term Municipal Bond Portfolio | The Intermediate Term Municipal Bond Portfolio |
|
| Prospectus [Line Items] |
|
| Bar Chart and Performance Table [Heading] |
Performance Bar Chart and Table
|
| Performance Narrative [Text Block] |
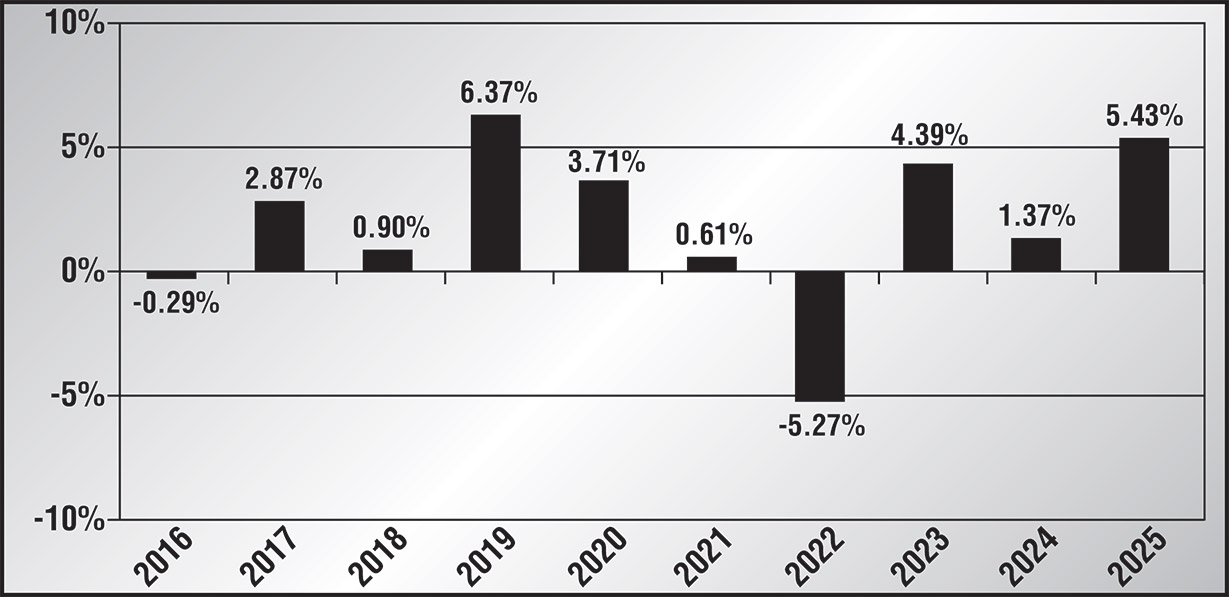
Performance. The chart and table below show how The Intermediate Term Municipal Bond Portfolio has performed, and how its performance has varied from year to year. The bar chart shows returns on a before-tax basis and gives some indication of risk by showing changes in the Portfolio’s yearly performance for each of the last ten full calendar years. The table accompanying the bar chart compares the Portfolio’s performance over time on a before and after-tax basis to that of a broad based market index and an index that more closely reflects the investments of the Portfolio. Of course, past performance, before and after taxes, does not indicate how the Portfolio will perform in the future.
|
| Performance Past Does Not Indicate Future [Text] |
Of course, past performance, before and after taxes, does not indicate how the Portfolio will perform in the future.
|
| Performance Information Illustrates Variability of Returns [Text] |
The chart and table below show how The Intermediate Term Municipal Bond Portfolio has performed, and how its performance has varied from year to year. The bar chart shows returns on a before-tax basis and gives some indication of risk by showing changes in the Portfolio’s yearly performance for each of the last ten full calendar years.
|
| Bar Chart [Heading] |
Year-by-Year Total Returns as of 12/31*
|
| Bar Chart [Table] |
|
| Bar Chart Footnotes [Text Block] |
* Results shown on a calendar year basis; the Portfolio’s fiscal year, however, is June 30. |
|
| Bar Chart Closing [Text Block] |
The Portfolio’s before-tax return for the period from January 1, 2026 through September 30, 2026 (non-annualized) was ‑3.63%.
| Best quarter:
| | 4th Qtr. 2023
| 5.80%
| |
| Worst quarter:
| | 1st Qtr. 2022
| ‑5.26%
| |
|
| Year to Date Return, Label [Optional Text] |
before-tax return
|
| Bar Chart, Year to Date Return |
(3.63%)
|
| Bar Chart, Year to Date Return, Date |
Sep. 30, 2026
|
| Highest Quarterly Return, Label [Optional Text] |
Best quarter:
|
| Highest Quarterly Return |
5.80%
|
| Highest Quarterly Return, Date |
Dec. 31, 2023
|
| Lowest Quarterly Return, Label [Optional Text] |
Worst quarter:
|
| Lowest Quarterly Return |
(5.26%)
|
| Lowest Quarterly Return, Date |
Mar. 31, 2022
|
| Performance Table Heading |
Average Annual Total Returns (for the periods ended 12/31/25)
|
| Performance Table Uses Highest Federal Rate |
After-tax returns are calculated using the historical highest individual Federal marginal income tax rates and do not reflect the impact of state and local taxes.
|
| Performance Table Not Relevant to Tax Deferred |
Actual after-tax returns depend on an investor’s tax situation and may differ from those shown, and after-tax returns shown are not relevant to investors who hold Portfolio shares through tax-advantaged arrangements, such as qualified retirement plans.
|
| Performance [Table] |
| | One Year
| | Five Year
| | Ten Year
|
The Intermediate Term Municipal Bond Portfolio
| | | | | | | | | |
|
| | 5.43
| %
| | 1.23
| %
| | 1.96
| %
|
After Taxes on Distributions | | 5.43
| %
| | 1.22
| %
| | 1.94
| %
|
After Taxes on Distributions and Sale of Portfolio Shares | | 4.44
| %
| | 1.44
| %
| | 1.98
| %
|
Bloomberg 3‑10 Year Blend (2‑12) Total Return Index Unhedged (reflects no deduction for fees, expenses or taxes)*
| | 5.31
| %
| | 1.13
| %
| | 2.14
| %
|
Bloomberg Municipal Bond Index (reflects no deduction for fees, expenses or taxes)
| | 4.25
| %
| | 3.88
| %
| | 2.34
| %
|
* | See “About Benchmarks and Index Investing” for a description of the indexes. |
|
| Index No Deduction for Fees, Expenses, or Taxes [Text] |
(reflects no deduction for fees, expenses or taxes)
|
| Performance Table Closing [Text Block] |
After-tax returns are calculated using the historical highest individual Federal marginal income tax rates and do not reflect the impact of state and local taxes. Actual after-tax returns depend on an investor’s tax situation and may differ from those shown, and after-tax returns shown are not relevant to investors who hold Portfolio shares through tax-advantaged arrangements, such as qualified retirement plans.
|