The investment objective of The Intermediate Term Municipal Bond Portfolio is to provide a high level of current income exempt from Federal income tax, consistent with the preservation of capital.
The fee and expense tables below describe the fees and expenses that you may pay if you buy and hold shares of the Portfolio.
Maximum Sales Charges | None |
Maximum Redemption Fee | None |
Management Fees (based on asset allocations | 0.19% |
Other Expenses | 0.08% |
Acquired Fund Fees and Expenses | 0.29% |
Total Annual Portfolio Operating Expenses* | 0.56% |
* | Total Annual Fund Operating Expenses have been restated to reflect current expenses as of June 30, 2026. |
This Example is intended to help you compare the cost of investing in the Portfolio with the cost of investing in other mutual funds. The Example assumes that you invest $10,000 in the Portfolio for the time periods indicated and then redeem all of your shares at the end of those periods. The Example also assumes the reinvestment of all dividends and distributions in shares of the Portfolio, that your investment has a 5% return each year and that the Portfolio’s Total Annual Operating Expenses remain the same. Although your actual cost may be higher or lower, based on these assumptions, your cost would be:
1 Year | $57 |
3 Years | $179 |
5 Years | $313 |
10 Years | $701 |
The Portfolio pays transaction costs, such as commissions, when it buys and sells securities (or “turns over” its portfolio). A higher portfolio turnover rate may indicate higher transaction costs and may result in higher taxes when Portfolio shares are held in a taxable account. These costs, which are not reflected in the Total Annual Operating Expenses or in the Example, affect the Portfolio’s performance. During the most recent fiscal year, the Portfolio’s turnover was 19% of the average value of its portfolio.
Under normal circumstances, the Portfolio seeks to achieve its objective by investing primarily (i.e., at least 80% of net assets) in municipal bonds. The policy stated in the foregoing sentence is a fundamental policy of the Portfolio and may not be changed without shareholder approval. The Portfolio invests primarily in securities that are rated in one of the top four rating categories of a nationally recognized statistical rating organization (“Baa” or higher by Moody’s Investors Service, Inc., “BBB” or higher by S&P Global Ratings) or, if unrated, that are determined by the Specialist Manager to be of comparable quality. Municipal bonds are debt securities issued by municipalities and related entities, the interest on which is exempt from Federal income tax so that they will qualify to pay “exempt-interest dividends” (“Municipal Securities”). Municipal Securities purchased for the Portfolio will have varying maturities, but under normal circumstances the Portfolio will have an effective dollar weighted average portfolio maturity that is within the range of the average portfolio maturity in the Bloomberg 3‑10 Year Blend (2‑12) Total Return Index, currently 1 to 12 years. The Portfolio’s actual average maturity was 6.92 years as of June 30, 2026. Fixed income securities rated in the fourth highest rating category by a rating agency may have speculative characteristics. The Portfolio is also authorized to invest in securities issued by other investment companies, such as ETFs and closed-end funds, that invest in Municipal Securities. Also, the Portfolio is authorized to invest up to 20% of its net assets in taxable instruments. The Portfolio may engage in transactions involving instruments such as option or futures contracts in order to hedge against investment risks, seek to efficiently obtain or adjust exposure to certain securities or groups of securities, or otherwise to increase returns. The Portfolio may also write (sell) call options and put options, in order to receive
premiums, on individual securities, market indexes, and/or on substitutes for such indexes, which may include futures contracts or ETFs. The Portfolio normally writes covered call and put options which have an initial maturity of up to nine months and that are “out of the money” at the time of initiation such that the call options sold generally will be above the current price level of the index when written and the exercise price of put options sold generally will be below the current price level of the index when written. In accordance with applicable interpretations of the SEC, certain derivative instruments may be counted as fixed income securities for purposes of the Portfolio’s policies regarding investments in fixed income securities, to the extent that such derivative instruments have economic characteristics similar to those of fixed income securities.
The Portfolio is authorized to operate on a multi-manager basis. This means that a single Portfolio may be managed by more than one Specialist Manager. The multi-manager structure is generally designed to provide investors access to broadly diversified investment styles. The Trust seeks to engage skilled Specialist Managers to provide a broad exposure to the relevant asset class and returns in excess of the Portfolio’s benchmark over time.
Performance. The chart and table below show how The Intermediate Term Municipal Bond Portfolio has performed, and how its performance has varied from year to year. The bar chart shows returns on a before-tax basis and gives some indication of risk by showing changes in the Portfolio’s yearly performance for each of the last ten full calendar years. The table accompanying the bar chart compares the Portfolio’s performance over time on a before and after-tax basis to that of a broad based market index and an index that more closely reflects the investments of the Portfolio. Of course, past performance, before and after taxes, does not indicate how the Portfolio will perform in the future.
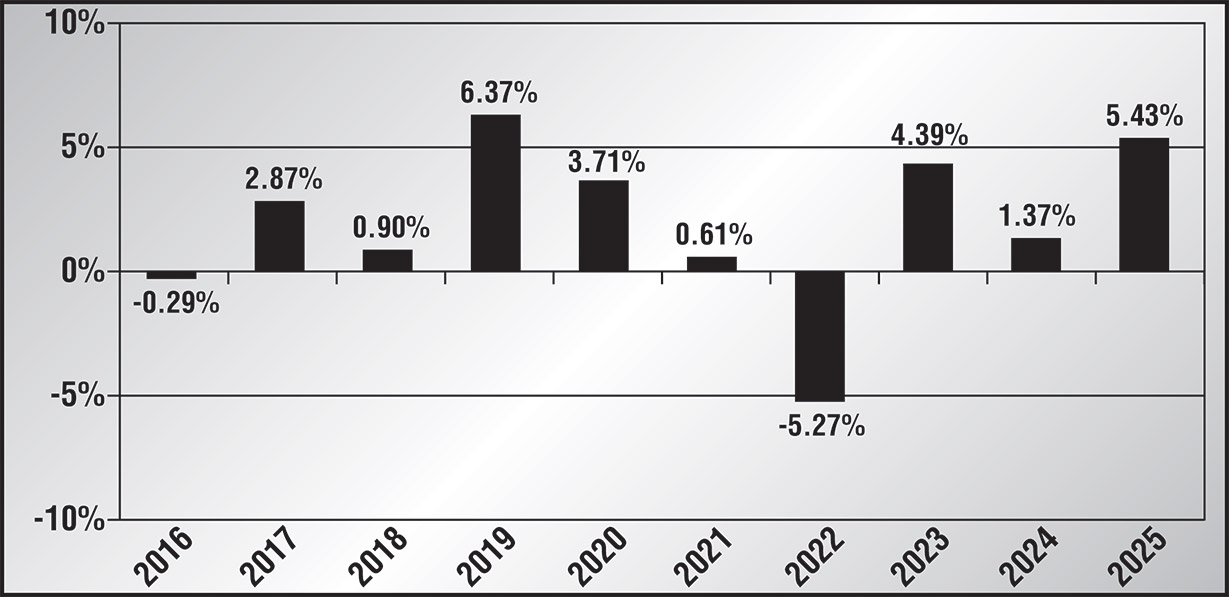
* Results shown on a calendar year basis; the Portfolio’s fiscal year, however, is June 30. |
The Portfolio’s before-tax return for the period from January 1, 2026 through September 30, 2026 (non-annualized) was ‑3.63%.
| Best quarter: |
| 4th Qtr. 2023 | 5.80% |
|
| Worst quarter: |
| 1st Qtr. 2022 | ‑5.26% |
|
|
| One Year |
| Five Year |
| Ten Year | |||
The Intermediate Term Municipal Bond Portfolio |
|
|
|
|
|
|
|
|
|
– Before Taxes |
| 5.43 | % |
| 1.23 | % |
| 1.96 | % |
– After Taxes on Distributions |
| 5.43 | % |
| 1.22 | % |
| 1.94 | % |
– After Taxes on Distributions and Sale of Portfolio Shares |
| 4.44 | % |
| 1.44 | % |
| 1.98 | % |
Bloomberg 3‑10 Year Blend (2‑12) Total Return Index Unhedged (reflects no deduction for fees, expenses or taxes)* |
| 5.31 | % |
| 1.13 | % |
| 2.14 | % |
Bloomberg Municipal Bond Index (reflects no deduction for fees, expenses or taxes) |
| 4.25 | % |
| 3.88 | % |
| 2.34 | % |
* | See “About Benchmarks and Index Investing” for a description of the indexes. |
After-tax returns are calculated using the historical highest individual Federal marginal income tax rates and do not reflect the impact of state and local taxes. Actual after-tax returns depend on an investor’s tax situation and may differ from those shown, and after-tax returns shown are not relevant to investors who hold Portfolio shares through tax-advantaged arrangements, such as qualified retirement plans.