The Catholic SRI Capital Growth Portfolio seeks to maximize total return subject to emphasizing socially responsible investments.
The fee and expense tables below describe the fees and expenses that you may pay if you buy and hold shares of the Portfolio.
Maximum Sales Charges | None |
Maximum Redemption Fee | None |
Management Fees (based on asset allocations | 0.10% |
Other Expenses | 0.20% |
Total Annual Portfolio Operating Expenses* | 0.30% |
* | Total Annual Fund Operating Expenses have been restated to reflect current expenses as of June 30, 2026. |
This Example is intended to help you compare the cost of investing in the Portfolio with the cost of investing in other mutual funds. The Example assumes that you invest $10,000 in the Portfolio for the time periods indicated and then redeem all of your shares at the end of those periods. The Example also assumes that your investment has a 5% return each year and that the Portfolio’s Total Annual Operating Expenses remain the same. Although your actual cost may be higher or lower, based on these assumptions, your costs would be:
1 Year | $31 |
3 Years | $97 |
5 Years | $169 |
10 Years | $381 |
The Portfolio pays transaction costs, such as commissions, when it buys and sells securities (or “turns over” investments in its portfolio). A higher portfolio turnover rate may indicate higher transaction costs and may result in higher taxes when Portfolio shares are held in a taxable account. These costs, which are not reflected in Total Annual Portfolio Operating Expenses or in the Example, affect the Portfolio’s performance. During the most recent fiscal year, the Portfolio’s turnover was 40% of the average value of its portfolio.
Under normal circumstances, the Portfolio seeks to achieve its objective by investing primarily (i.e., at least 80% of its net assets) in the securities of companies that fall within the principles contained in the United States Conference of Catholic Bishops’ (“USCCB”) Socially Responsible Investing Guidelines (“Social Guidelines”). In the unlikely event that a change in this investment policy is adopted by the Board of Trustees, shareholders will receive at least 60 days prior written notice before such change is implemented. In addition to equity and fixed income securities, the Portfolio may invest in other instruments, including, but not limited to, derivatives. The Portfolio is permitted to invest in any equity security, which includes securities issued by other investment companies, including exchange traded funds (“ETFs”) and securities issued by one or more of the other portfolios of HC Capital Trust. The Portfolio may invest in companies of any market capitalization.
Further, under the supervision of the Adviser, the Portfolio screens out securities with exposure to a range of social and moral concerns during its security selection process. These concerns include protecting human life; promoting human dignity; reducing arms production; pursuing economic justice; protecting the environment; and encouraging corporate responsibility. This screening will be accomplished with reference to the principles contained in the Social Guidelines. Potential investments for the Portfolio are selected for financial soundness and all such investments are evaluated according to the Portfolio’s social criteria.
The Portfolio may also invest without limitation in fixed income securities of all types and without regard to duration or investment ratings. Fixed income investments may include corporate debt, including high yield or “junk bonds,” structured
notes, asset backed securities and similar synthetic securities, U.S. treasuries and short-term money market instruments or other cash equivalents.
The Portfolio is permitted to invest in securities issued by companies domiciled anywhere in the world and denominated in any currency, without limitation. The Portfolio may also invest in securities, including privately placed and structured securities, for which there may be limited markets/thinly traded issues. Additionally, in seeking to achieve its objective, the Portfolio is permitted to invest in derivative instruments, including options, futures and options on futures, swaps, structured notes and currency forwards. The Portfolio may also write (sell) call options and put options, in order to receive premiums, on individual securities, U.S. stock market indexes, and/or on substitutes for such indexes, which may include futures contracts or ETFs. The Portfolio normally writes covered call and put options which have an initial maturity of up to nine months and that are “out of the money” at the time of initiation such that the call options sold generally will be above the current price level of the index when written and the exercise price of put options sold generally will be below the current price level of the index when written. In accordance with applicable interpretations of the SEC, certain derivative instruments may be counted as equity securities for purposes of the Portfolio’s policies regarding investments in equity securities, to the extent that such derivative instruments have economic characteristics similar to those of equity securities.
The Portfolio may be managed using an “active” investment approach and/or a “passive” investment approach designed to approximate as closely as practicable, before expenses, the performance of either the Portfolio’s benchmark index or, from time to time, one or more identifiable subsets or other portions of that index. The relative weighting of these two approaches may vary anywhere from 0% to 100% of the Portfolio’s assets at any given time.
The Portfolio is not authorized or sponsored by the Roman Catholic Church or the USCCB. Consistent with its investment policies, the Portfolio may purchase and sell securities without regard to the effect on portfolio turnover.
The Portfolio is authorized to operate on a multi-manager basis. This means that a single Portfolio may be managed by more than one Specialist Manager. The multi-manager structure is generally designed to provide investors access to broadly diversified investment styles. The Trust seeks to engage skilled Specialist Managers to provide a broad exposure to the relevant asset class and returns in line with the Portfolio’s benchmark over time.
Performance. The chart and table below show how The Catholic SRI Capital Growth Portfolio (formerly, The Catholic SRI Growth Portfolio) has performed, and how its performance has varied, from year to year. The bar chart shows returns on a before-tax basis and gives some indication of risk by showing changes in the Portfolio’s yearly performance for each full calendar year since the Portfolio’s inception on January 12, 2016. The table accompanying the bar chart compares the Portfolio’s performance over time on a before and after-tax basis to that of a broad based market index. Of course, past performance, before and after taxes, does not indicate how the Portfolio will perform in the future.
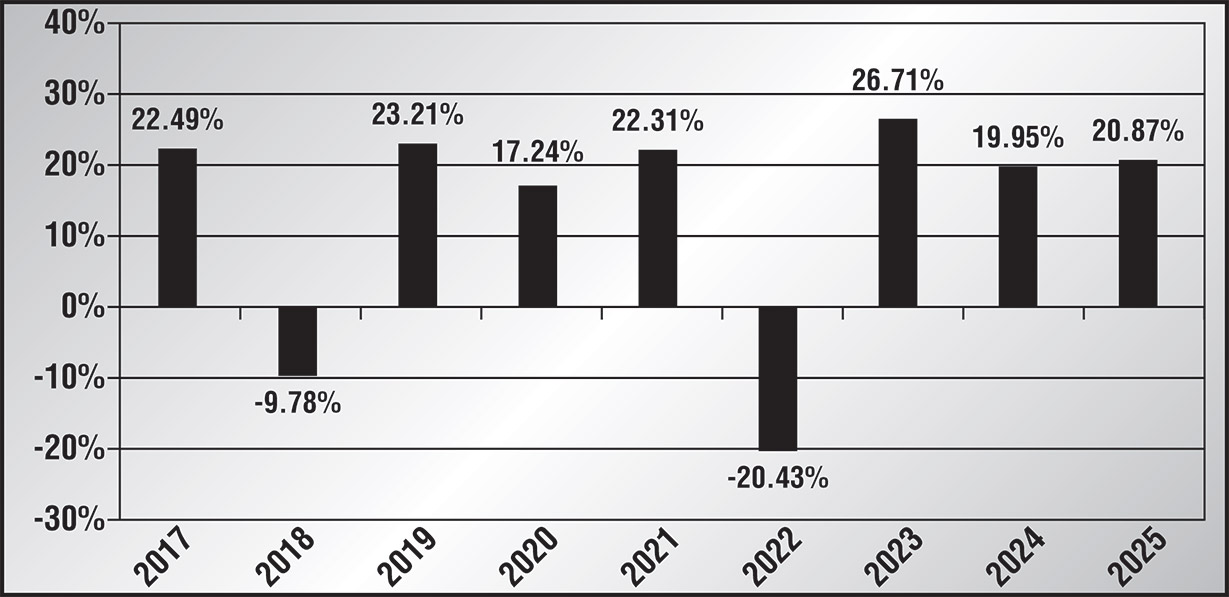
* Results shown on a calendar year basis; the Portfolio’s fiscal year, however, is June 30. |
The Portfolio’s before-tax return for the period from January 1, 2026 through September 30, 2026 (non-annualized) was 12.10%.
| Best quarter: |
| 2nd Qtr. 2020 | 20.82% |
|
| Worst quarter: |
| 1st Qtr. 2020 | ‑21.96% |
|
|
| One Year |
|
| Five Year |
|
| Since | |
The Catholic SRI Capital Growth Portfolio |
|
|
|
|
|
|
|
|
|
– Before Taxes |
| 20.87 | % |
| 12.32 | % |
| 12.83 | % |
– After Taxes on Distributions |
| 20.45 | % |
| 10.11 | % |
| 10.91 | % |
– After Taxes on Distributions and Sale of Portfolio Shares |
| 12.58 | % |
| 9.26 | % |
| 9.99 | % |
MSCI World Index (reflects no deduction for fees, expenses or taxes) |
| 21.60 | % |
| 12.66 | % |
| 13.49 | % |
After-tax returns are calculated using the historical highest individual Federal marginal income tax rates and do not reflect the impact of state and local taxes. Actual after-tax returns depend on an investor’s tax situation and may differ from those shown, and after-tax returns shown are not relevant to investors who hold Portfolio shares through tax-advantaged arrangements, such as qualified retirement plans.