Shareholder Report
Aug. 31, 2026
USD ($)
Holding
This report describes changes to the Fund that occurred during the reporting period.
What were the Fund’s costs for the last year ?
(based on a hypothetical $10,000 investment)
| Fund | Costs of a $10,000 investment | Costs paid as a percentage of a $10,000 investment |
| BNY Mellon Enhanced Dividend and Income ETF* | $79 | 0.71% |
| * |
During the period, fees were waived and/or expenses reimbursed pursuant to an agreement with the Predecessor Fund’s investment adviser, BNY Mellon Investment Adviser, Inc.
|
How did the Fund perform last year ?
-
For the 12-month period ended August 31, 2026, the Fund’s shares returned 23.15% on a net asset value basis and 23.40% on a market price basis.
-
In comparison, the Russell 1000® Value Index (the “Index”) returned 29.72% for the same period.
What affected the Fund’s performance?
-
U.S. markets moved higher over the period as stronger corporate earnings and Artificial Intelligence (AI) spending overcame concerns about renewed conflict in the Middle East, rising inflation and global interest rates.
-
The strongest contributors to the Fund’s performance relative to the Index included stock selection in communication services and energy, and sector positioning in consumer discretionary.
-
The most significant detractors included stock selection and sector positioning in information technology, materials and financials, including not owning the high-growth AI names in the Index.
How did the Fund perform over the past 10 years?
The Fund’s past performance is not a good predictor of the Fund’s future performance. The graph and table do not reflect the deduction of taxes that a shareholder would pay on fund distributions or redemption of fund shares.
Cumulative Performance from September 1 , 2016 through August 31, 2026
Initial Investment of $10,000
Initial Investment of $10,000
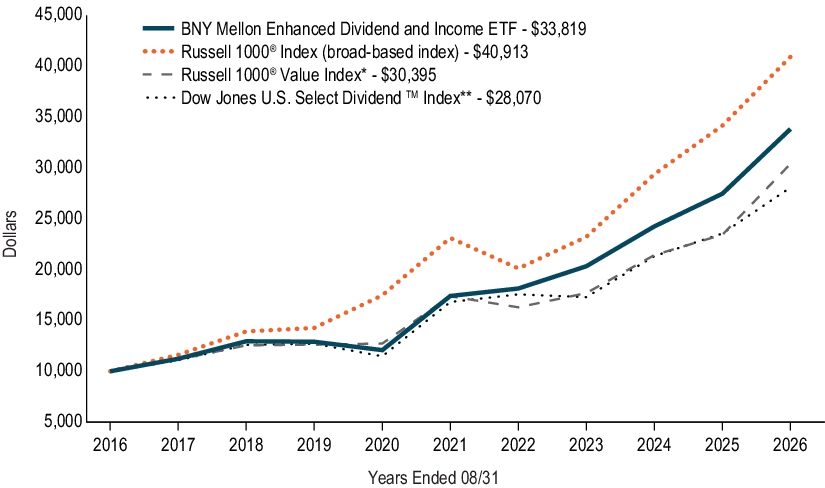
The above graph compares a hypothetical $10,000 investment in the Fund’s shares to a hypothetical investment of $10,000 made in each of the Russell 1000® Index (a broad-based index), Russell 1000® Value Index and Dow Jones U.S. Select Dividend™ Index on 8/31/2016. The performance shown takes into account applicable fees and expenses of the Fund, including management fees, 12b-1 fees and other expenses. The Fund’s performance also assumes the reinvestment of dividends and capital gains. Unlike the Fund, the indexes are not subject to fees and other expenses. Investors cannot invest directly in any index.
|
*
|
Effective December 8, 2025, the Russell 1000® Value Index was added as the Fund’s performance benchmark.
|
|
**
|
The Dow Jones US Select Dividend Index was the performance benchmark of BNY Mellon Income Stock Fund, the Predecessor Fund. Performance of the index will not be shown in the future.
|
AVERAGE ANNUAL TOTAL RETURNS (AS OF 8/31/26 )
| 1YR | 5YR | 10YR | ||||
| BNY Mellon Enhanced Dividend and Income ETF - NAV Return | 23.15% | 14.21% | 12.96% | |||
| Russell 1000® Index (broad-based index) | 19.77% | 12.10% | 15.13% | |||
| Russell 1000® Value Index* | 29.72% | 11.84% | 11.76% | |||
| Dow Jones U.S. Select Dividend™ Index** | 19.19% | 10.80% | 10.87% |
|
*
|
Effective December 8, 2025, the Russell 1000® Value Index was added as the Fund’s performance benchmark.
|
|
**
|
The Dow Jones US Select Dividend Index was the performance benchmark of BNY Mellon Income Stock Fund, the Predecessor Fund. Performance of the index will not be shown in the future.
|
KEY FUND STATISTICS (AS OF 8/31/26 )
Fund Size (Millions) |
Number of Holdings |
Total Advisory Fee Paid During Period |
Annual Portfolio Turnover |
| $243 | 59 | $818,671 | 134.24% |
Portfolio Holdings (as of 8/31/26 )
Top Ten Holdings (Based on Net Assets) *
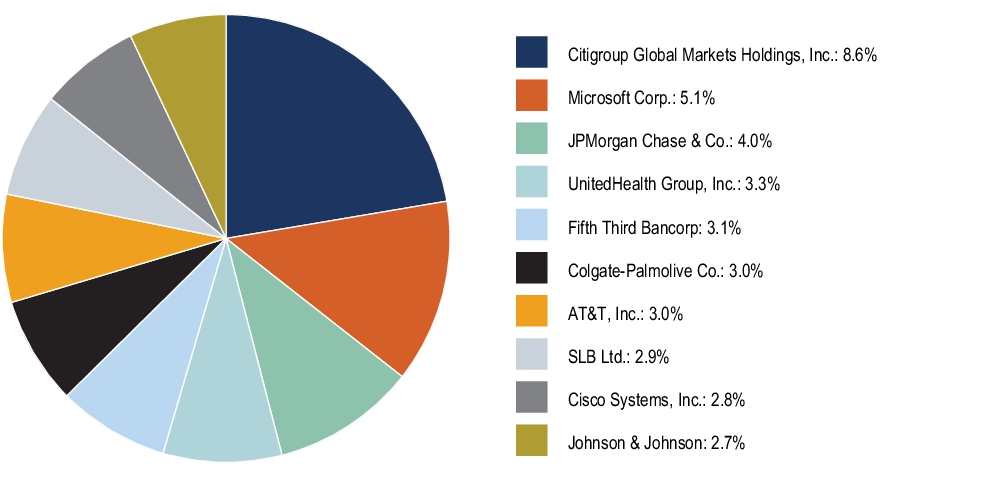
* Excludes money market funds or other short-term securities held for the investment of cash and cash collateral for securities loaned, if any.
Sector Allocation (Based on Net Assets)
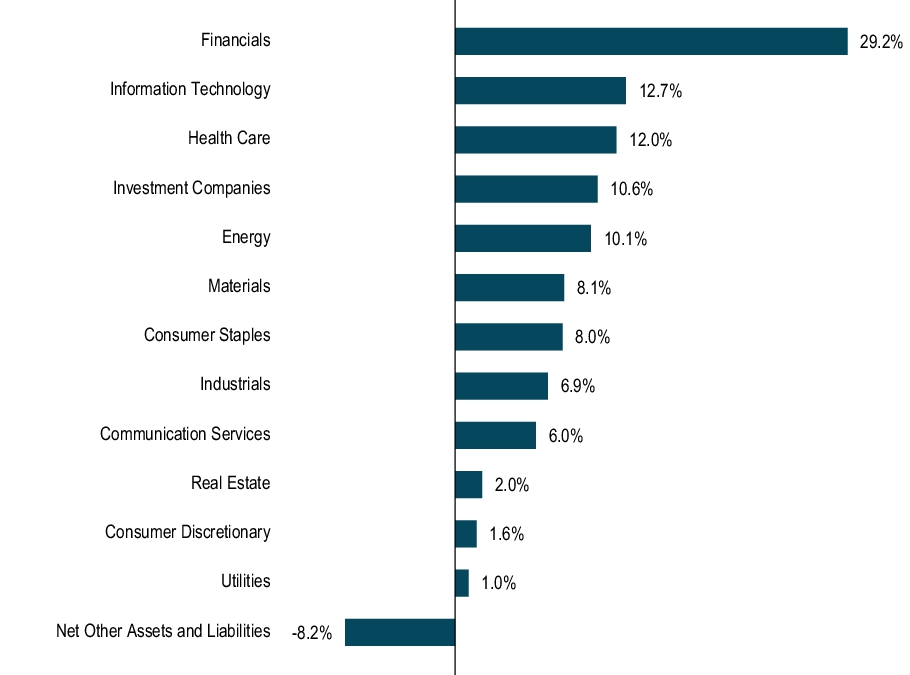
Top Ten Holdings (Based on Net Assets) *
* Excludes money market funds or other short-term securities held for the investment of cash and cash collateral for securities loaned, if any.
How has the Fund changed?
-
On December 5, 2025, BNY Mellon Income Stock Fund (“Predecessor Fund”), a series of BNY Mellon Funds Trust, was reorganized into the Fund (“Reorganization”). The Fund commenced operations upon completion of the Reorganization and continues the operations of the Predecessor Fund. Prior to the Reorganization, the Predecessor Fund’s Class A, Class C, Class I, Class Y, and Investor shares redesignated into Class M shares. In addition, the Predecessor Fund’s Class M shares effected a reverse share split to approximate the net asset value per share of the Fund prior to the Reorganization. Prior to the Reorganization, the Predecessor Fund discontinued the imposition of distribution fees, which had previously been paid to BNY Mellon Securities Corporation, the Predecessor Fund’s distributor (“Distributor”), at an annual rate of .75% of the value of Class C shares based on average daily net assets. The Predecessor Fund also discontinued the imposition of shareholder services fees, which had previously been paid to the Distributor at an annual rate of .25% of the value of each of the Predecessor Fund’s Investor, Class A and Class C shares based on average daily net assets. At the time of the Reorganization, the expense limitation agreement with the Predecessor Fund’s investment adviser was discontinued.
This is a summary of certain changes to the Fund since September 1, 2025 . For more complete information, you may review the Fund’s current prospectus dated December 5, 2025 at bny.com/investments/etfliterature or upon request at 1-833-383-2696 or by calling your financial adviser.
This is a summary of certain changes to the Fund since September 1, 2025 . For more complete information, you may review the Fund’s current prospectus dated December 5, 2025 at bny.com/investments/etfliterature or upon request at 1-833-383-2696 or by calling your financial adviser.
Changes in or Disagreements with Accountants
-
Starting December 5, 2025, in connection with the Reorganization noted above, Ernst & Young LLP (“EY”) became the independent registered public accounting firm of the Fund and KPMG LLP was discharged as the Predecessor Fund’s accounting firm. EY serves as the independent registered public accounting firm for all funds in the BNY Mellon ETF Trust II. There were no disagreements with the former accounting firm during the Predecessor Fund’s fiscal years ended August 31, 2025 and August 31, 2024 and the subsequent interim period through December 5, 2025.
This report describes changes to the Fund that occurred during the reporting period.
What were the Fund’s costs for the last year ?
(based on a hypothetical $10,000 investment)
| Fund | Costs of a $10,000 investment | Costs paid as a percentage of a $10,000 investment |
| BNY Mellon Active Core Bond ETF | $53 | 0.53% |
How did the Fund perform last year ?
-
For the 12-month period ended August 31, 2026, the Fund’s shares returned 0.99% on a net asset value basis and 0.78% on a market price basis.
-
In comparison, the Bloomberg U.S. Aggregate Bond Index (the “Index”) returned 1.89% for the same period.
What affected the Fund’s performance?
-
Despite higher interest rates, bond markets delivered positive total returns. Risk assets also performed well, supported by a strong labor market and a favorable domestic economic outlook.
-
The strongest contributors to the Fund’s performance relative to the Index included overweight allocations to corporate bonds, emerging markets, asset-backed securities and non-agency mortgage-backed securities.
-
Within the corporate bond sector, overweight positions in high yield, banks, utilities and finance companies were beneficial, as was security selection favoring non-traditional asset-backed securities sectors and collateralized loan obligations.
-
Interest rate positioning detracted from relative performance throughout the period, as inflation failed to moderate meaningfully and front-end interest rates remained stubbornly high.
-
Overweight exposure to agency mortgage-backed securities and underweight exposure to commercial mortgage-backed securities also detracted, as did security selection within taxable municipals.
How did the Fund perform over the past 10 years?
The Fund’s past performance is not a good predictor of the Fund’s future performance. The graph and table do not reflect the deduction of taxes that a shareholder would pay on fund distributions or redemption of fund shares.
Cumulative Performance from September 1 , 2016 through August 31, 2026
Initial Investment of $10,000
Initial Investment of $10,000
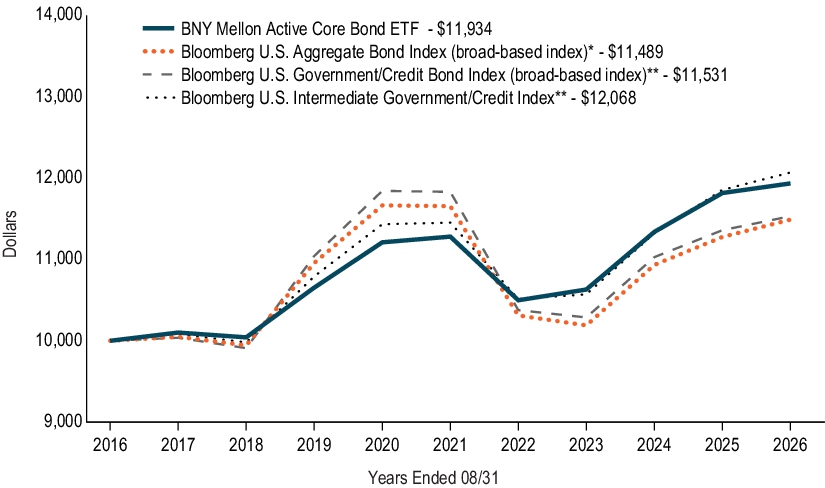
The above graph compares a hypothetical $10,000 investment in the Fund’s shares to a hypothetical investment of $10,000 made in each of the Bloomberg U.S. Aggregate Bond Index (a broad-based index), Bloomberg U.S. Government/Credit Bond Index (a broad-based index) and Bloomberg U.S. Intermediate Government/Credit Index on 8/31/2016. The performance shown takes into account applicable fees and expenses of the Fund, including management fees and other expenses. The Fund’s performance also assumes the reinvestment of dividends and capital gains. Unlike the Fund, the indexes are not subject to fees and other expenses. Investors cannot invest directly in any index.
|
*
|
Effective January 12, 2026, the date shares of the Fund began trading on NYSE Arca, Inc., the Fund’s broad-based benchmark will be the Bloomberg U.S. Aggregate Bond Index. Additionally, effective January 12, 2026, the Fund will no longer use the Bloomberg U.S. Intermediate Government/Credit Index as a performance-based benchmark. Insight North America LLC, the Fund’s sub-adviser, believes the Bloomberg U.S. Aggregate Bond Index is a more appropriate performance comparison given the Fund’s investment strategy and Insight North America LLC’s investment process.
|
|
**
|
Performance of the indices will not be shown in the future.
|
AVERAGE ANNUAL TOTAL RETURNS (AS OF 8/31/26 )
| 1YR | 5YR | 10YR | ||||
| BNY Mellon Active Core Bond ETF - NAV Return | 0.99% | 1.13% | 1.78% | |||
| Bloomberg U.S. Aggregate Bond Index (broad-based index)* | 1.89% | -0.29% | 1.40% | |||
| Bloomberg U.S. Government/Credit Bond Index (broad‑based index)** | 1.51% | -0.51% | 1.44% | |||
| Bloomberg U.S. Intermediate Government/Credit Index** | 1.80% | 1.05% | 1.90% |
|
*
|
Effective January 12, 2026, the date shares of the Fund began trading on NYSE Arca, Inc., the Fund’s broad-based benchmark will be the Bloomberg U.S. Aggregate Bond Index. Additionally, effective January 12, 2026, the Fund will no longer use the Bloomberg U.S. Intermediate Government/Credit Index as a performance-based benchmark. Insight North America LLC, the Fund’s sub-adviser, believes the Bloomberg U.S. Aggregate Bond Index is a more appropriate performance comparison given the Fund’s investment strategy and Insight North America LLC’s investment process.
|
|
**
|
Performance of the indices will not be shown in the future.
|
KEY FUND STATISTICS (AS OF 8/31/26 )
Fund Size (Millions) |
Number of Holdings |
Total Advisory Fee Paid During Period |
Annual Portfolio Turnover |
| $249 | 292 | $1,380,148 | 124.41% |
Portfolio Holdings (as of 8/31/26 )
Sector Allocation (Based on Net Assets)
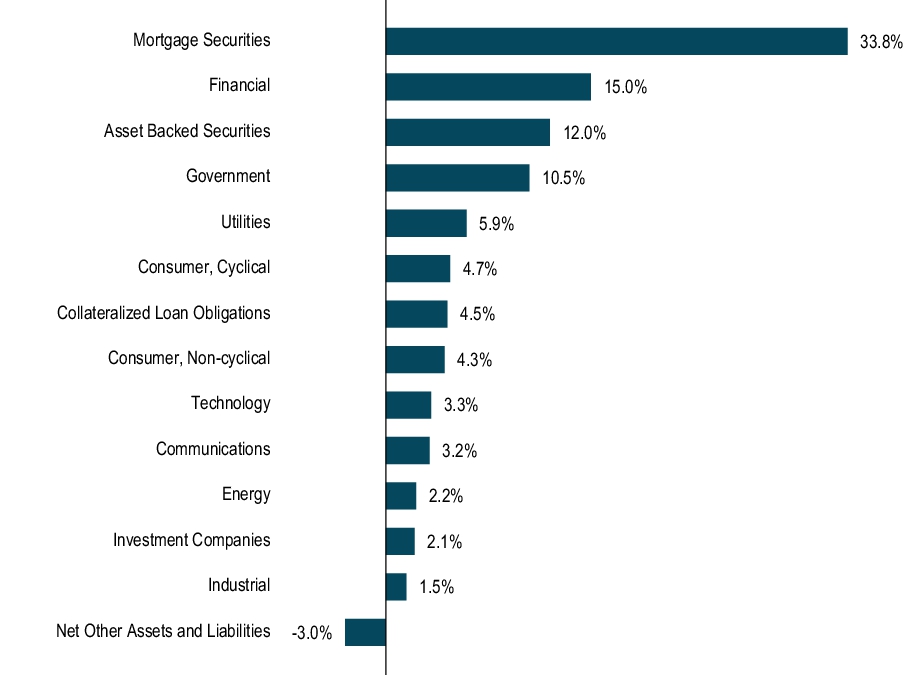
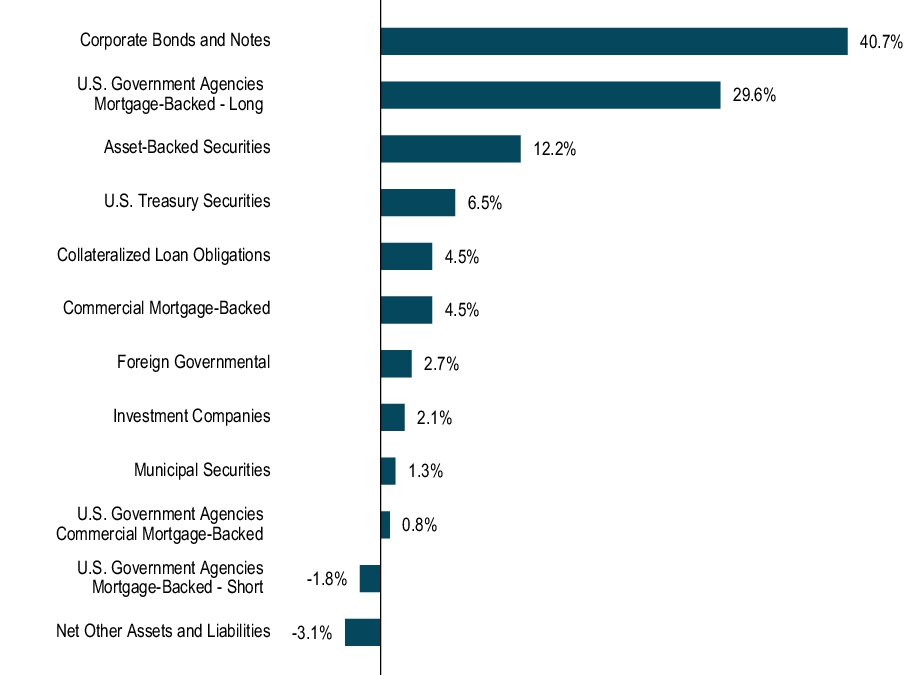
Allocation of Holdings (Based on Net Assets)
How has the Fund changed?
-
On January 9, 2026, BNY Mellon Intermediate Bond Fund (“Predecessor Fund”), a series of BNY Mellon Funds Trust, was reorganized into the Fund (“Reorganization”). The Fund commenced operations upon completion of the Reorganization and continues the operations of the Predecessor Fund. Prior to the Reorganization, the Predecessor Fund’s Investor Shares redesignated into Class M shares. In addition, the Predecessor Fund’s Class M shares effected a reverse share split to approximate the net asset value per share of the Fund prior to the Reorganization. Prior to the Reorganization, the Predecessor Fund discontinued the imposition of shareholder services fees, which had previously been paid to BNY Mellon Securities Corporation, the Predecessor Fund’s distributor (“Distributor”), at an annual rate of .25% of the value of Investor class shares based on average daily net assets.
-
In addition, effective October 1, 2025, BNY Mellon Investment Adviser, Inc., the Predecessor Fund’s investment adviser, engaged its affiliate, Insight North America LLC (“INA”), to serve as the sub-adviser to the Predecessor Fund.
This is a summary of certain changes to the Fund since September 1, 2025 . For more complete information, you may review the Fund’s current prospectus dated December 31, 2025 at bny.com/investments/etfliterature or upon request at 1-833-383-2696 or by calling your financial adviser.
This is a summary of certain changes to the Fund since September 1, 2025 . For more complete information, you may review the Fund’s current prospectus dated December 31, 2025 at bny.com/investments/etfliterature or upon request at 1-833-383-2696 or by calling your financial adviser.
Changes in or Disagreements with Accountants
-
Starting January 9, 2026, in connection with the Reorganization noted above, Ernst & Young LLP (“EY”) became the independent registered public accounting firm of the Fund and KPMG LLP was discharged as the Predecessor Fund’s accounting firm. EY serves as the independent registered public accounting firm for all funds in the BNY Mellon ETF Trust II. There were no disagreements with the former accounting firm during the Predecessor Fund’s fiscal years ended August 31, 2025 and August 31, 2024 and the subsequent interim period through January 9, 2026.
This report describes changes to the Fund that occurred during the reporting period.
What were the Fund’s costs for the last year ?
(based on a hypothetical $10,000 investment)
| Fund | Costs of a $10,000 investment | Costs paid as a percentage of a $10,000 investment |
| BNY Mellon Core Plus ETF | $53 | 0.52% |
How did the Fund perform last year ?
-
For the 12-month period ended August 31, 2026, the Fund’s shares returned 2.16% on a net asset value basis and 2.36% on a market price basis.
-
In comparison, the Bloomberg U.S. Aggregate Bond Index returned 1.89% for the same period.
What affected the Fund’s performance?
-
Despite higher interest rates, bond markets delivered positive total returns. Risk assets also performed well, supported by a strong labor market and a favorable domestic economic outlook.
-
The strongest contributors to the Fund’s relative performance came from overweight allocations to high yield corporate and emerging market debt.
-
Security selection in the municipal, sovereign utility and financial hybrid sectors, along with certain non-U.S. interest rate positions, also contributed meaningfully to relative performance.
-
Interest rate positioning was a headwind throughout the reporting period, as inflation failed to moderate meaningfully, and front-end interest rates remained stubbornly high.
How did the Fund perform over the past 10 years?
The Fund’s past performance is not a good predictor of the Fund’s future performance. The graph and table do not reflect the deduction of taxes that a shareholder would pay on fund distributions or redemption of fund shares.
Cumulative Performance from September 1 , 2016 through August 31, 2026
Initial Investment of $10,000
Initial Investment of $10,000
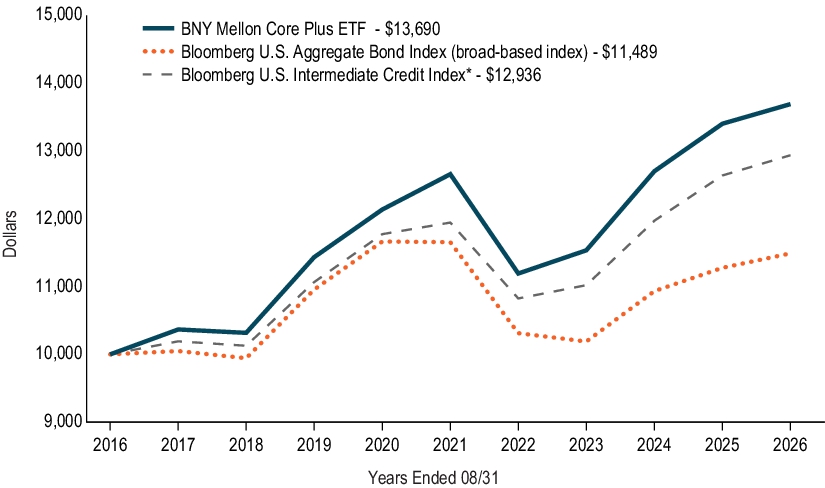
The above graph compares a hypothetical $10,000 investment in the Fund’s shares to a hypothetical investment of $10,000 made in each of the Bloomberg U.S. Aggregate Bond Index (a broad-based index) and Bloomberg U.S. Intermediate Credit Index on 8/31/2016. The performance shown takes into account applicable fees and expenses of the Fund, including management fees and other expenses. The Fund’s performance also assumes the reinvestment of dividends and capital gains. Unlike the Fund, the indexes are not subject to fees and other expenses. Investors cannot invest directly in any index.
|
*
|
Effective January 12, 2026, the date shares of the Fund began trading on NYSE Arca, Inc., the Fund will no longer use the Bloomberg U.S. Intermediate Credit Index as a performance-based benchmark. Insight North America LLC, the Fund’s sub-adviser, believes the Bloomberg U.S. Aggregate Bond Index is a more appropriate performance comparison given the Fund’s investment strategy and Insight North America LLC’s investment process. Performance of the index will not be shown in the future.
|
AVERAGE ANNUAL TOTAL RETURNS (AS OF 8/31/26 )
| 1YR | 5YR | 10YR | ||||
| BNY Mellon Core Plus ETF - NAV Return | 2.16% | 1.58% | 3.19% | |||
| Bloomberg U.S. Aggregate Bond Index (broad-based index) | 1.89% | -0.29% | 1.40% | |||
| Bloomberg U.S. Intermediate Credit Index * | 2.36% | 1.61% | 2.61% |
|
*
|
Effective January 12, 2026, the date shares of the Fund began trading on NYSE Arca, Inc., the Fund will no longer use the Bloomberg U.S. Intermediate Credit Index as a performance-based benchmark. Insight North America LLC, the Fund’s sub-adviser, believes the Bloomberg U.S. Aggregate Bond Index is a more appropriate performance comparison given the Fund’s investment strategy and Insight North America LLC’s investment process. Performance of the index will not be shown in the future.
|
KEY FUND STATISTICS (AS OF 8/31/26 )
Fund Size (Millions) |
Number of Holdings |
Total Advisory Fee Paid During Period |
Annual Portfolio Turnover |
| $309 | 364 | $1,409,990 | 190.66% |
Portfolio Holdings (as of 8/31/26 )
Sector Allocation (Based on Net Assets)
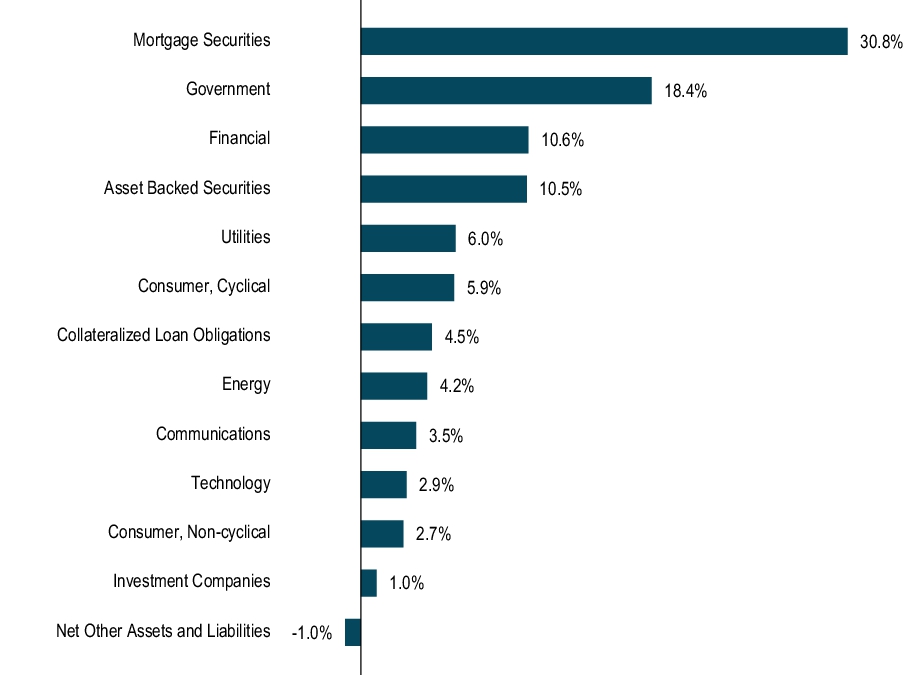
Allocation of Holdings (Based on Net Assets)
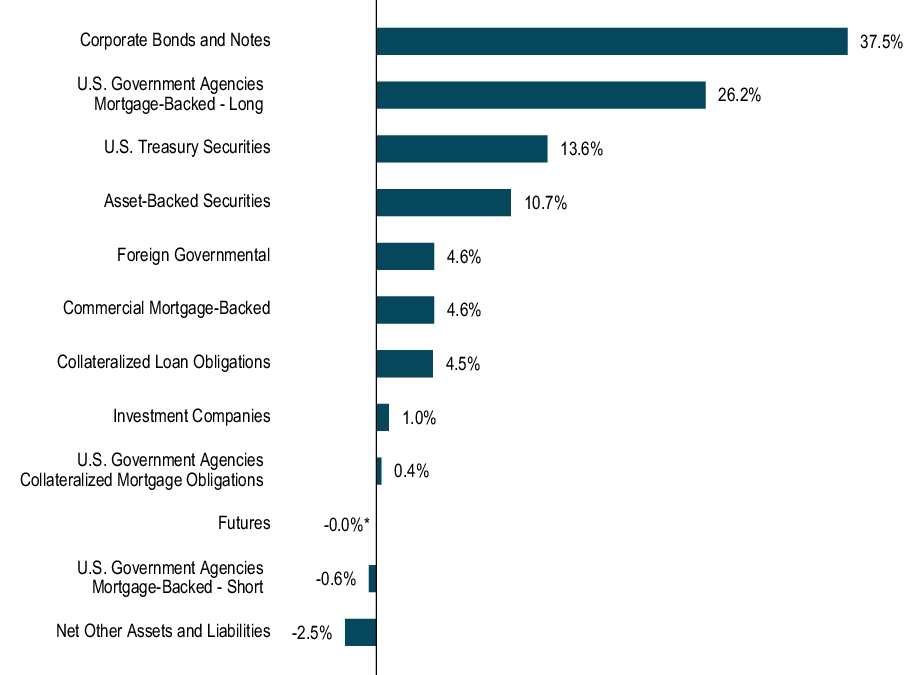
* Amount represents less than .1%.
How has the Fund changed?
-
On January 9, 2026, BNY Mellon Corporate Bond Fund (“Predecessor Fund”), a series of BNY Mellon Funds Trust, was reorganized into the Fund (“Reorganization”). The Fund commenced operations upon completion of the Reorganization and continues the operations of the Predecessor Fund. Prior to the Reorganization, the Predecessor Fund’s Investor Shares redesignated into Class M shares. In addition, the Predecessor Fund’s Class M shares effected a reverse share split to approximate the net asset value per share of the Fund prior to the Reorganization. Prior to the Reorganization, the Predecessor Fund discontinued the imposition of shareholder services fees, which had previously been paid to BNY Mellon Securities Corporation, the Predecessor Fund’s distributor (“Distributor”), at an annual rate of .25% of the value of Investor class shares based on average daily net assets.
-
In addition, effective October 1, 2025, BNY Mellon Investment Adviser, Inc., the Predecessor Fund’s investment adviser, engaged its affiliate, Insight North America LLC (“INA”), to serve as the sub-adviser to the Predecessor Fund.
This is a summary of certain changes to the Fund since September 1, 2025 . For more complete information, you may review the Fund’s current prospectus dated December 31, 2025 at bny.com/investments/etfliterature or upon request at 1-833-383-2696 or by calling your financial adviser.
This is a summary of certain changes to the Fund since September 1, 2025 . For more complete information, you may review the Fund’s current prospectus dated December 31, 2025 at bny.com/investments/etfliterature or upon request at 1-833-383-2696 or by calling your financial adviser.
Changes in or Disagreements with Accountants
-
Starting January 9, 2026, in connection with the Reorganization noted above, Ernst & Young LLP (“EY”) became the independent registered public accounting firm of the Fund and KPMG LLP was discharged as the Predecessor Fund’s accounting firm. EY serves as the independent registered public accounting firm for all funds in the BNY Mellon ETF Trust II. There were no disagreements with the former accounting firm during the Predecessor Fund’s fiscal years ended August 31, 2025 and August 31, 2024 and the subsequent interim period through January 9, 2026.
This report describes changes to the Fund that occurred during the reporting period.
What were the Fund’s costs for the last year ?
(based on a hypothetical $10,000 investment)
| Fund | Costs of a $10,000 investment | Costs paid as a percentage of a $10,000 investment |
| BNY Mellon Municipal Intermediate ETF | $44 | 0.43% |
How did the Fund perform last year ?
-
For the 12-month period ended August 31, 2026, the Fund’s shares returned 2.90% on a net asset value basis and 2.86% on a market price basis.
-
In comparison, the Bloomberg Municipal 3-15 Years Blend Index (the “Index”) returned 2.72% for the same period.
What affected the Fund’s performance?
-
The municipal bond market generated a positive total return, primarily produced by yield, with modest price appreciation, despite high volatility, also supporting returns.
-
The strongest contributors to the Fund’s performance relative to the Index included longer intermediate curve exposure and relatively high credit exposure.
-
Overweight allocations to the education, tobacco and health care sectors were particular strengths.
-
The most significant detractors from relative performance included the Fund’s exposure to water & sewer and special tax securities.
How did the Fund perform over the past 10 years?
The Fund’s past performance is not a good predictor of the Fund’s future performance. The graph and table do not reflect the deduction of taxes that a shareholder would pay on fund distributions or redemption of fund shares.
Cumulative Performance from September 1 , 2016 through August 31, 2026
Initial Investment of $10,000
Initial Investment of $10,000
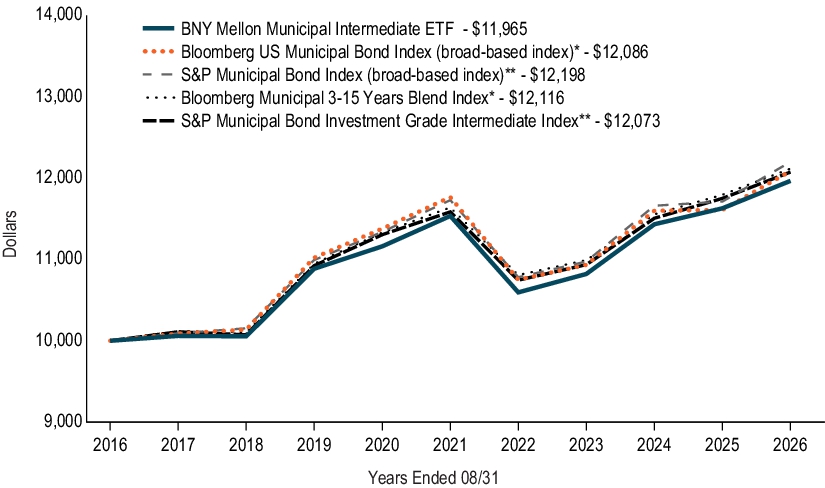
The above graph compares a hypothetical $10,000 investment in the Fund’s shares to a hypothetical investment of $10,000 made in each of the Bloomberg U.S. Municipal Bond Index (a broad-based index), S&P Municipal Bond Index (a broad-based index), Bloomberg Municipal 3-15 Years Blend Index and S&P Municipal Bond Investment Grade Intermediate Index on 8/31/2016. The performance shown takes into account applicable fees and expenses of the Fund, including management fees and other expenses. The Fund’s performance also assumes the reinvestment of dividends and capital gains. Unlike the Fund, the indexes are not subject to fees and other expenses. Investors cannot invest directly in any index.
|
*
|
Effective January 12, 2026, the date shares of the Fund began trading on The Nasdaq Stock Market LLC, the Fund’s broad-based benchmark and performance-based benchmark will be the Bloomberg U.S. Municipal Bond Index and Bloomberg Municipal 3-15 Years Blend Index, respectively. Insight North America LLC, the Fund’s sub-adviser, believes the Bloomberg indexes are more appropriate comparisons given the Fund’s investment strategy and Insight North America LLC’s investment process.
|
|
**
|
Performance of the indices will not be shown in the future.
|
AVERAGE ANNUAL TOTAL RETURNS (AS OF 8/31/26 )
| 1YR | 5YR | 10YR | ||||
| BNY Mellon Municipal Intermediate ETF - NAV Return | 2.90% | 0.74% | 1.81% | |||
| Bloomberg U.S. Municipal Bond Index (broad-based index)* | 4.12% | 0.54% | 1.91% | |||
| S&P Municipal Bond Index (broad‑based index)** | 4.16% | 0.79% | 2.01% | |||
| Bloomberg Municipal 3-15 Years Blend Index* | 2.72% | 0.81% | 1.94% | |||
| S&P Municipal Bond Investment Grade Intermediate Index** | 2.75% | 0.83% | 1.90% |
|
*
|
Effective January 12, 2026, the date shares of the Fund began trading on The Nasdaq Stock Market LLC, the Fund’s broad-based benchmark and performance-based benchmark will be the Bloomberg U.S. Municipal Bond Index and Bloomberg Municipal 3-15 Years Blend Index, respectively. Insight North America LLC, the Fund’s sub-adviser, believes the Bloomberg indexes are more appropriate comparisons given the Fund’s investment strategy and Insight North America LLC’s investment process.
|
|
**
|
Performance of the indices will not be shown in the future.
|
KEY FUND STATISTICS (AS OF 8/31/26 )
Fund Size (Millions) |
Number of Holdings |
Total Advisory Fee Paid During Period |
Annual Portfolio Turnover |
| $1,665 | 529 | $6,122,578 | 37.28% |
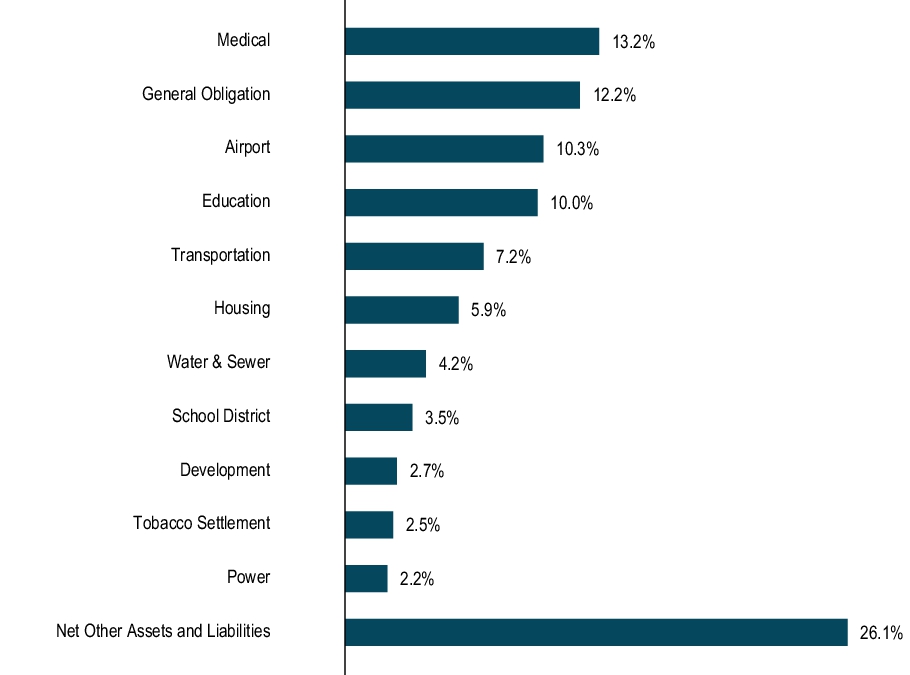
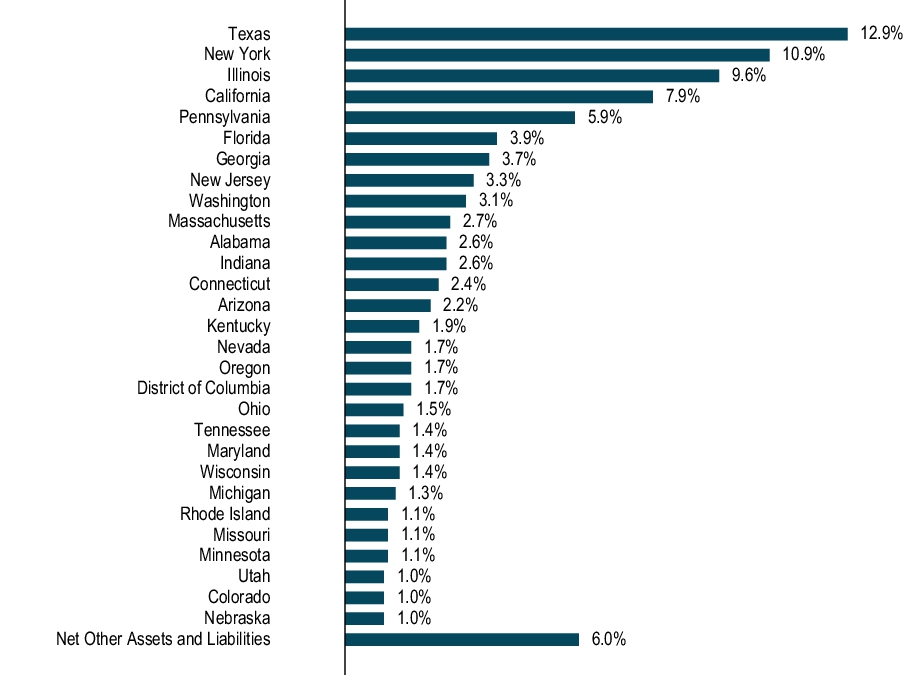
Portfolio Holdings (as of 8/31/26 )
Sector Allocation (Based on Net Assets)
State Allocation (Based on Net Assets)
How has the Fund changed?
-
On January 9, 2026, BNY Mellon National Intermediate Municipal Bond Fund (“Predecessor Fund”), a series of BNY Mellon Funds Trust, was reorganized into the Fund (“Reorganization”). The Fund commenced operations upon completion of the Reorganization and continues the operations of the Predecessor Fund. Prior to the Reorganization, the Predecessor Fund’s Investor Shares redesignated into Class M shares. In addition, the Predecessor Fund’s Class M shares effected a reverse share split to approximate the net asset value per share of the Fund prior to the Reorganization. Prior to the Reorganization, the Predecessor Fund discontinued the imposition of shareholder services fees, which had previously been paid to BNY Mellon Securities Corporation, the Predecessor Fund’s distributor (“Distributor”), at an annual rate of .25% of the value of Investor class shares based on average daily net assets.
-
In addition, effective October 1, 2025, BNY Mellon Investment Adviser, Inc., the Predecessor Fund’s investment adviser, engaged its affiliate, Insight North America LLC (“INA”), to serve as the sub-adviser to the Predecessor Fund.
This is a summary of certain changes to the Fund since September 1, 2025 . For more complete information, you may review the Fund’s current prospectus dated December 31, 2025 at bny.com/investments/etfliterature or upon request at 1-833-383-2696 or by calling your financial adviser.
This is a summary of certain changes to the Fund since September 1, 2025 . For more complete information, you may review the Fund’s current prospectus dated December 31, 2025 at bny.com/investments/etfliterature or upon request at 1-833-383-2696 or by calling your financial adviser.
Changes in or Disagreements with Accountants
-
Starting January 9, 2026, in connection with the Reorganization noted above, Ernst & Young LLP (“EY”) became the independent registered public accounting firm of the Fund and KPMG LLP was discharged as the Predecessor Fund’s accounting firm. EY serves as the independent registered public accounting firm for all funds in the BNY Mellon ETF Trust II. There were no disagreements with the former accounting firm during the Predecessor Fund’s fiscal years ended August 31, 2025 and August 31, 2024 and the subsequent interim period through January 9, 2026.
This report describes changes to the Fund that occurred during the reporting period.
What were the Fund’s costs for the last year ?
(based on a hypothetical $10,000 investment)
| Fund | Costs of a $10,000 investment | Costs paid as a percentage of a $10,000 investment |
| BNY Mellon Municipal Opportunities ETF* | $65 | 0.63% |
| * |
During the period, fees were waived and/or expenses reimbursed pursuant to an agreement with the Fund’s investment adviser, BNY Mellon ETF Investment Adviser, LLC. If this agreement is not extended in the future, expenses could be higher.
|
How did the Fund perform last year ?
-
For the 12-month period ended August 31, 2026, the Fund’s shares returned 5.29% on a net asset value basis and 5.42% on a market price basis.
-
In comparison, the Bloomberg U.S. Municipal Bond Index (the “Index”) returned 4.12% for the same period.
What affected the Fund’s performance?
-
The municipal bond market generated a positive total return, the majority produced by yield, with modest price appreciation despite high volatility also supporting returns.
-
Relative to the Index, the Fund’s longer curve exposure was additive to performance.
-
The Fund also benefited from strong security selection and asset allocation due to greater credit exposure relative to the broader market.
-
The most significant detractors included overweight exposure to education bonds, as well as certain tactical duration hedging activity.
How did the Fund perform over the past 10 years?
The Fund’s past performance is not a good predictor of the Fund’s future performance. The graph and table do not reflect the deduction of taxes that a shareholder would pay on fund distributions or redemption of fund shares.
Cumulative Performance from September 1 , 2016 through August 31, 2026
Initial Investment of $10,000
Initial Investment of $10,000
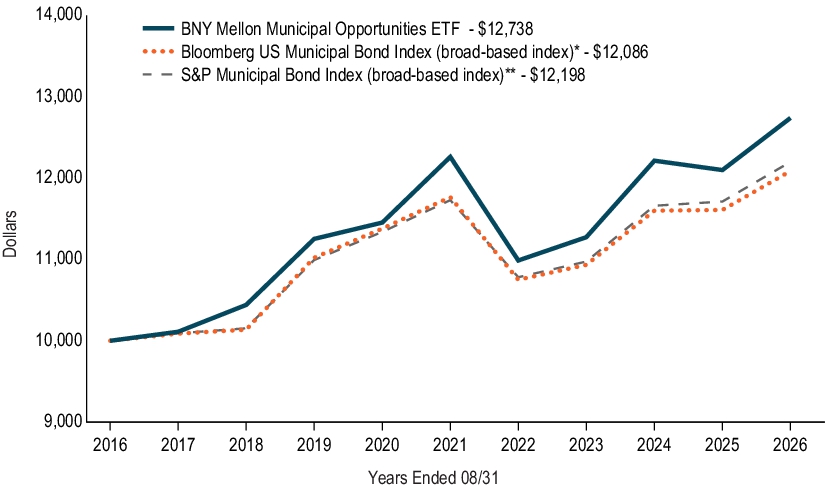
The above graph compares a hypothetical $10,000 investment in the Fund’s shares to a hypothetical investment of $10,000 made in each of the Bloomberg U.S. Municipal Bond Index (a broad-based index) and S&P Municipal Bond Index (a broad-based index) on 8/31/2016. The performance shown takes into account applicable fees and expenses of the Fund, including management fees and other expenses. The Fund’s performance also assumes the reinvestment of dividends and capital gains. Unlike the Fund, the indexes are not subject to fees and other expenses. Investors cannot invest directly in any index.
|
*
|
Effective January 12, 2026, the date shares of the Fund began trading on The Nasdaq Stock Market LLC, the Fund’s broad-based benchmark will be the Bloomberg U.S. Municipal Bond Index. Insight North America LLC, the Fund’s sub-adviser, believes the Bloomberg index is a more appropriate comparisons given the Fund’s investment strategy and Insight North America LLC’s investment process.
|
|
**
|
Performance of the index will not be shown in the future.
|
AVERAGE ANNUAL TOTAL RETURNS (AS OF 8/31/26 )
| 1YR | 5YR | 10YR | ||||
| BNY Mellon Municipal Opportunities ETF - NAV Return | 5.29% | 0.77% | 2.45% | |||
| Bloomberg U.S. Municipal Bond Index (broad-based index)* | 4.12% | 0.54% | 1.91% | |||
| S&P Municipal Bond Index (broad‑based index)** | 4.16% | 0.79% | 2.01% |
|
*
|
Effective January 12, 2026, the date shares of the Fund began trading on The Nasdaq Stock Market LLC, the Fund’s broad-based benchmark will be the Bloomberg U.S. Municipal Bond Index. Insight North America LLC, the Fund’s sub-adviser, believes the Bloomberg index is a more appropriate comparisons given the Fund’s investment strategy and Insight North America LLC’s investment process.
|
|
**
|
Performance of the index will not be shown in the future.
|
KEY FUND STATISTICS (AS OF 8/31/26 )
Fund Size (Millions) |
Number of Holdings |
Total Advisory Fee Paid During Period |
Annual Portfolio Turnover |
| $1,749 | 669 | $9,082,884 | 31.68% |
Portfolio Holdings (as of 8/31/26 )
Sector Allocation (Based on Net Assets)
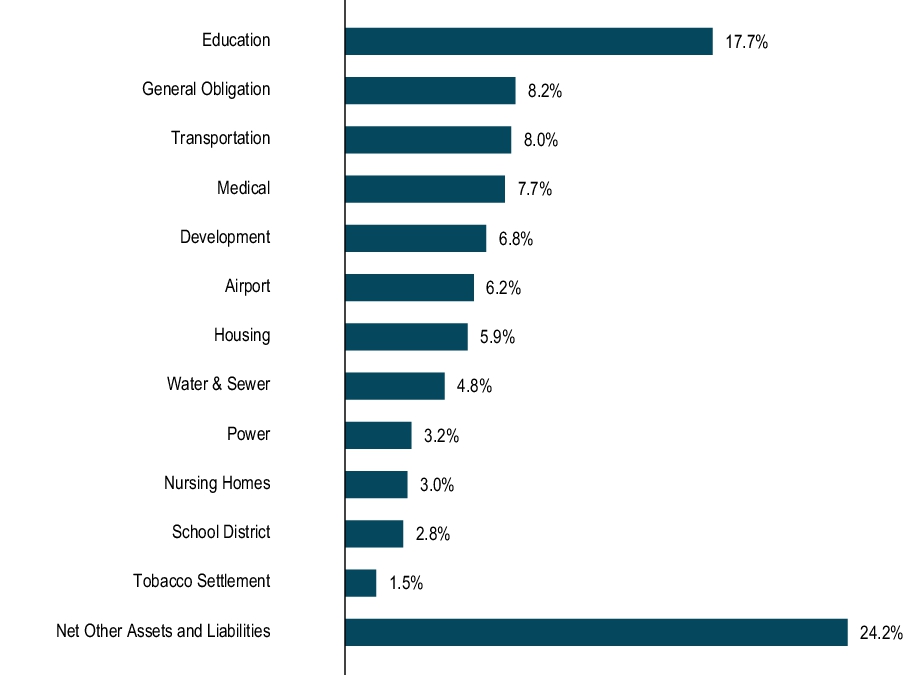
State Allocation (Based on Net Assets)
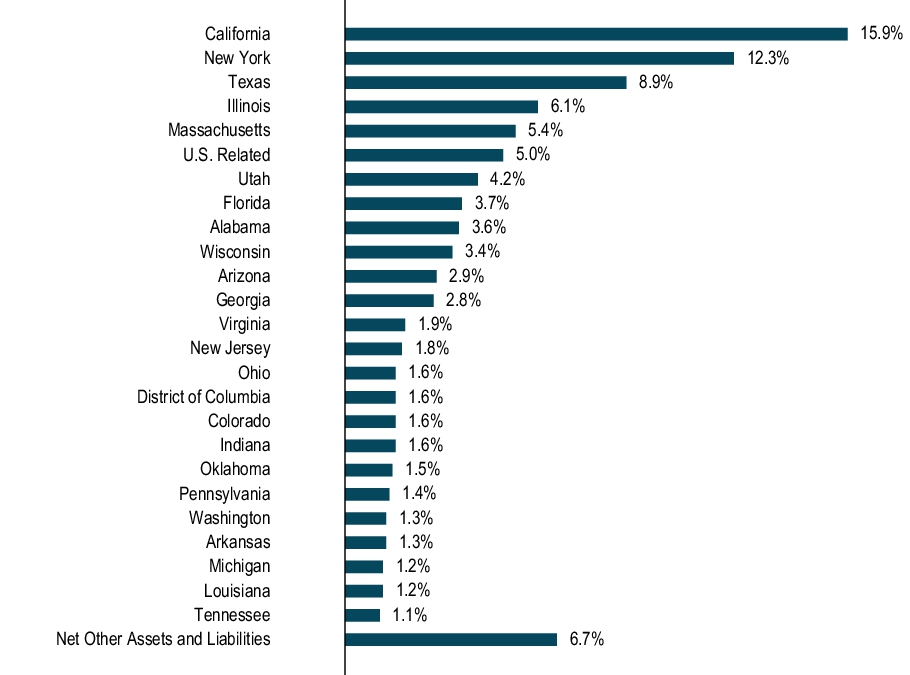
How has the Fund changed?
-
On January 9, 2026, BNY Mellon Municipal Opportunities Fund (“Predecessor Fund”), a series of BNY Mellon Funds Trust, was reorganized into the Fund (“Reorganization”). The Fund commenced operations upon completion of the Reorganization and continues the operations of the Predecessor Fund. Prior to the Reorganization, the Predecessor Fund’s Investor Shares redesignated into Class M shares. In addition, the Predecessor Fund’s Class M shares effected a reverse share split to approximate the net asset value per share of the Fund prior to the Reorganization. Prior to the Reorganization, the Predecessor Fund discontinued the imposition of shareholder services fees, which had previously been paid to BNY Mellon Securities Corporation, the Predecessor Fund’s distributor (“Distributor”), at an annual rate of .25% of the value of Investor class shares based on average daily net assets.
-
In addition, effective October 1, 2025, BNY Mellon Investment Adviser, Inc., the Predecessor Fund’s investment adviser, engaged its affiliate, Insight North America LLC (“INA”), to serve as the sub-adviser to the Predecessor Fund.
-
Effective July 13, 2026, BNY Mellon ETF Investment Adviser, LLC, the Fund’s Adviser, has agreed to waive receipt of a portion of its management fee in the amount of 0.05% of the value of the Fund's average daily net assets until December 31, 2027.
This is a summary of certain changes to the Fund since September 1, 2025 . For more complete information, you may review the Fund’s current prospectus dated December 31, 2025 at bny.com/investments/etfliterature or upon request at 1-833-383-2696 or by calling your financial adviser.
This is a summary of certain changes to the Fund since September 1, 2025 . For more complete information, you may review the Fund’s current prospectus dated December 31, 2025 at bny.com/investments/etfliterature or upon request at 1-833-383-2696 or by calling your financial adviser.
Changes in or Disagreements with Accountants
-
Starting January 9, 2026, in connection with the Reorganization noted above, Ernst & Young LLP (“EY”) became the independent registered public accounting firm of the Fund and KPMG LLP was discharged as the Predecessor Fund’s accounting firm. EY serves as the independent registered public accounting firm for all funds in the BNY Mellon ETF Trust II. There were no disagreements with the former accounting firm during the Predecessor Fund’s fiscal years ended August 31, 2025 and August 31, 2024 and the subsequent interim period through January 9, 2026.
This report describes changes to the Fund that occurred during the reporting period.
What were the Fund’s costs for the last year ?
(based on a hypothetical $10,000 investment)
| Fund | Costs of a $10,000 investment | Costs paid as a percentage of a $10,000 investment |
| BNY Mellon Municipal Short Duration ETF* | $41 | 0.41% |
| * |
During the period, fees were waived and/or expenses reimbursed pursuant to an agreement with the Fund’s investment adviser, BNY Mellon ETF Investment Adviser, LLC.
|
How did the Fund perform last year ?
-
For the 12-month period ended August 31, 2026, the Fund’s shares returned 2.14% on a net asset value basis and 2.18% on a market price basis.
-
In comparison, the Bloomberg Municipal 1-3 Years Index (the “Index”) returned 2.13% for the same period.
What affected the Fund’s performance?
-
The municipal bond market generated a positive total return, primarily produced by yield, with modest price appreciation, despite high volatility, also supporting returns.
-
The strongest contributors to the Fund’s performance relative to the Index included favorable curve exposure and relatively high credit exposure.
-
Overweight allocations to the higher education, housing and health care sectors were particular strengths.
-
The most significant detractors from relative performance included the Fund’s exposure to water & sewer and special tax securities.
How did the Fund perform over the past 10 years?
The Fund’s past performance is not a good predictor of the Fund’s future performance. The graph and table do not reflect the deduction of taxes that a shareholder would pay on fund distributions or redemption of fund shares.
Cumulative Performance from September 1 , 2016 through August 31, 2026
Initial Investment of $10,000
Initial Investment of $10,000
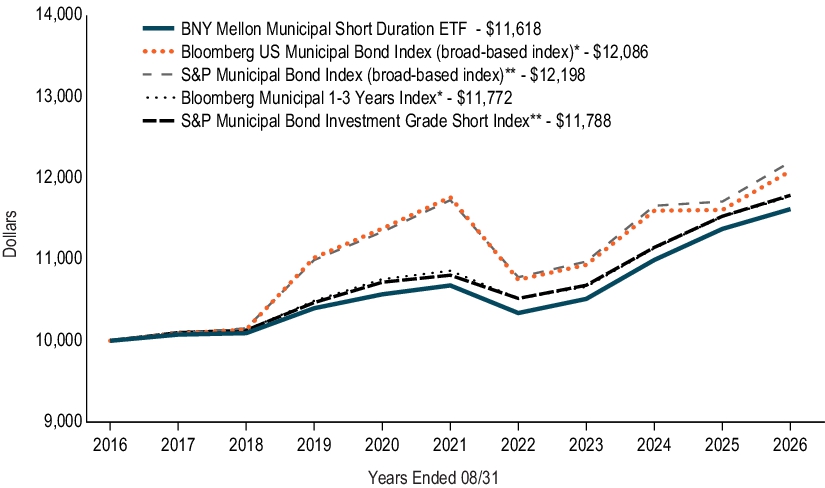
The above graph compares a hypothetical $10,000 investment in the Fund’s shares to a hypothetical investment of $10,000 made in each of the Bloomberg U.S. Municipal Bond Index (a broad-based index), S&P Municipal Bond Index (a broad-based index), Bloomberg Municipal 1-3 Years Index and S&P Municipal Bond Investment Grade Short Index on 8/31/2016. The performance shown takes into account applicable fees and expenses of the Fund, including management fees and other expenses. The Fund’s performance also assumes the reinvestment of dividends and capital gains. Unlike the Fund, the indexes are not subject to fees and other expenses. Investors cannot invest directly in any index.
|
*
|
Effective January 12, 2026, the date shares of the Fund began trading on The Nasdaq Stock Market LLC, the Fund’s broad-based benchmark and performance-based benchmark will be the Bloomberg U.S. Municipal Bond Index and Bloomberg Municipal 1-3 Years Index, respectively. Insight North America LLC, the Fund’s sub-adviser, believes the Bloomberg indexes are more appropriate comparisons given the Fund’s investment strategy and Insight North America LLC’s investment process.
|
|
**
|
Performance of the indices will not be shown in the future.
|
AVERAGE ANNUAL TOTAL RETURNS (AS OF 8/31/26 )
| 1YR | 5YR | 10YR | ||||
| BNY Mellon Municipal Short Duration ETF - NAV Return | 2.14% | 1.70% | 1.51% | |||
| Bloomberg U.S. Municipal Bond Index (broad-based index)* | 4.12% | 0.54% | 1.91% | |||
| S&P Municipal Bond Index (broad‑based index)** | 4.16% | 0.79% | 2.01% | |||
| Bloomberg Municipal 1-3 Years Index* | 2.13% | 1.62% | 1.65% | |||
| S&P Municipal Bond Investment Grade Short Index** | 2.23% | 1.75% | 1.66% |
|
*
|
Effective January 12, 2026, the date shares of the Fund began trading on The Nasdaq Stock Market LLC, the Fund’s broad-based benchmark and performance-based benchmark will be the Bloomberg U.S. Municipal Bond Index and Bloomberg Municipal 1-3 Years Index, respectively. Insight North America LLC, the Fund’s sub-adviser, believes the Bloomberg indexes are more appropriate comparisons given the Fund’s investment strategy and Insight North America LLC’s investment process.
|
|
**
|
Performance of the indices will not be shown in the future.
|
KEY FUND STATISTICS (AS OF 8/31/26 )
Fund Size (Millions) |
Number of Holdings |
Total Advisory Fee Paid During Period |
Annual Portfolio Turnover |
| $429 | 253 | $1,384,491 | 42.96% |
Portfolio Holdings (as of 8/31/26 )
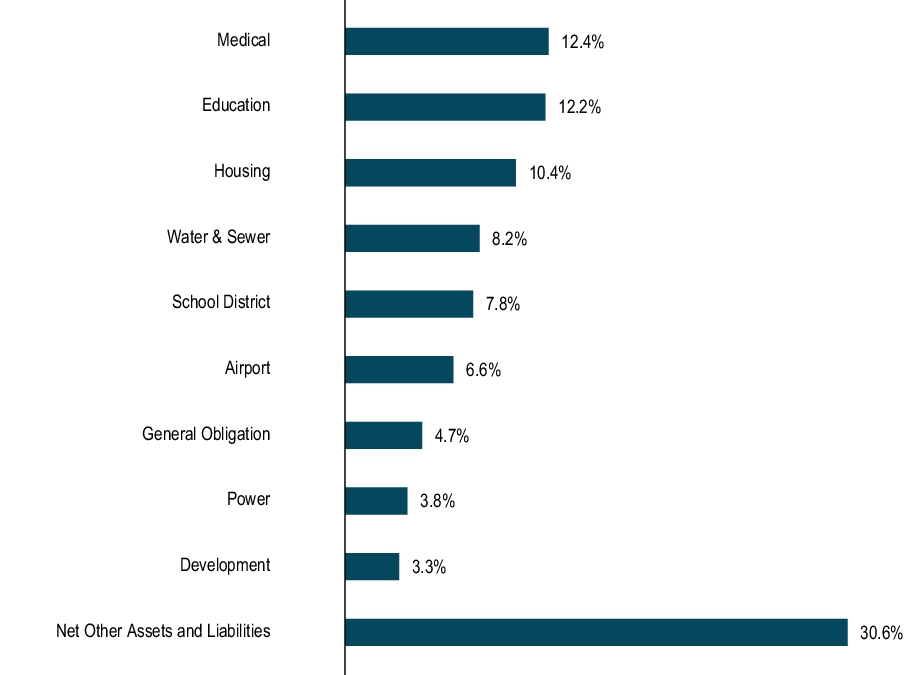
Sector Allocation (Based on Net Assets)
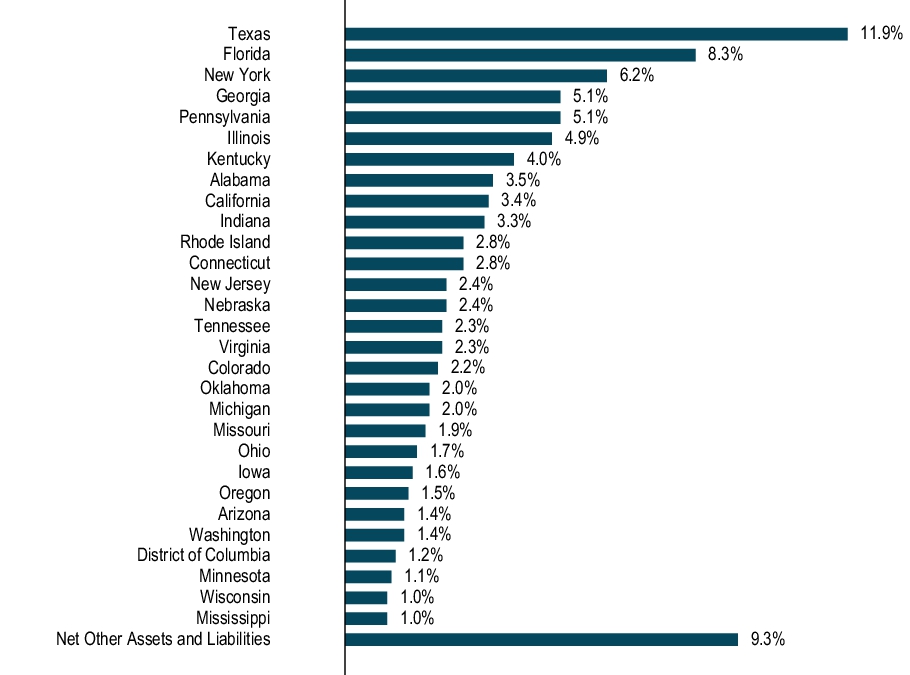
State Allocation (Based on Net Assets)
How has the Fund changed?
-
On January 9, 2026, BNY Mellon National Short-Term Municipal Bond Fund (“Predecessor Fund”), a series of BNY Mellon Funds Trust, was reorganized into the Fund (“Reorganization”). The Fund commenced operations upon completion of the Reorganization and continues the operations of the Predecessor Fund. Prior to the Reorganization, the Predecessor Fund’s Investor Shares redesignated into Class M shares. In addition, the Predecessor Fund’s Class M shares effected a reverse share split to approximate the net asset value per share of the Fund prior to the Reorganization. Prior to the Reorganization, the Predecessor Fund discontinued the imposition of shareholder services fees, which had previously been paid to BNY Mellon Securities Corporation, the Predecessor Fund’s distributor (“Distributor”), at an annual rate of .25% of the value of Investor class shares based on average daily net assets. At the time of the Reorganization, the expense limitation agreement with the Predecessor Fund’s investment adviser was discontinued.
-
In addition, effective October 1, 2025, BNY Mellon Investment Adviser, Inc., the Predecessor Fund’s investment adviser, engaged its affiliate, Insight North America LLC (“INA”), to serve as the sub-adviser to the Predecessor Fund.
This is a summary of certain changes to the Fund since September 1, 2025 . For more complete information, you may review the Fund’s current prospectus dated December 31, 2025 at bny.com/investments/etfliterature or upon request at 1-833-383-2696 or by calling your financial adviser.
This is a summary of certain changes to the Fund since September 1, 2025 . For more complete information, you may review the Fund’s current prospectus dated December 31, 2025 at bny.com/investments/etfliterature or upon request at 1-833-383-2696 or by calling your financial adviser.
Changes in or Disagreements with Accountants
-
Starting January 9, 2026, in connection with the Reorganization noted above, Ernst & Young LLP (“EY”) became the independent registered public accounting firm of the Fund and KPMG LLP was discharged as the Predecessor Fund’s accounting firm. EY serves as the independent registered public accounting firm for all funds in the BNY Mellon ETF Trust II. There were no disagreements with the former accounting firm during the Predecessor Fund’s fiscal years ended August 31, 2025 and August 31, 2024 and the subsequent interim period through January 9, 2026.
| [1] | During the period, fees were waived and/or expenses reimbursed pursuant to an agreement with the Predecessor Fund’s investment adviser, BNY Mellon Investment Adviser, Inc. |
| [2] | During the period, fees were waived and/or expenses reimbursed pursuant to an agreement with the Fund’s investment adviser, BNY Mellon ETF Investment Adviser, LLC. If this agreement is not extended in the future, expenses could be higher. |
| [3] | During the period, fees were waived and/or expenses reimbursed pursuant to an agreement with the Fund’s investment adviser, BNY Mellon ETF Investment Adviser, LLC. |