Shareholder Report
|
12 Months Ended |
|
Aug. 31, 2026
USD ($)
Holding
|
|---|
| Shareholder Report [Line Items] |
|
| Document Type |
N-CSR
|
| Amendment Flag |
false
|
| Registrant Name |
Cavanal Hill Funds (PKNA American Performance)
|
| Entity Central Index Key |
0000864508
|
| Entity Investment Company Type |
N-1A
|
| Document Period End Date |
Aug. 31, 2026
|
| Shareholder Report Annual or Semi-Annual |
Annual shareholder report
|
| C000102309 |
|
| Shareholder Report [Line Items] |
|
| Fund Name |
Bond Fund
|
| Class Name |
A Shares
|
| Trading Symbol |
AABOX
|
| Annual or Semi-Annual Statement [Text Block] |
Annual Shareholder Report
|
| Additional Information [Text Block] |
You can find additional information about the Fund at https://www.cavanalhillfunds.com/literature/mutual-fund-literature/. You can also request this information by contacting us at 1-800-762-7085.
|
| Additional Information Phone Number |
1-800-762-7085
|
| Additional Information Website |
https://www.cavanalhillfunds.com/literature/mutual-fund-literature/.
|
| Expenses [Text Block] |
What were the Fund's costs for the last year?(based on a $10,000 investment) Table SummaryClass name | Costs of a $10,000
investment | Costs paid as a percentage of a
$10,000 investment |
|---|
A Shares | $75 | 0.74% |
|---|
|
| Expenses Paid, Amount |
$ 75
|
| Expense Ratio, Percent |
0.74%
|
| Factors Affecting Performance [Text Block] |
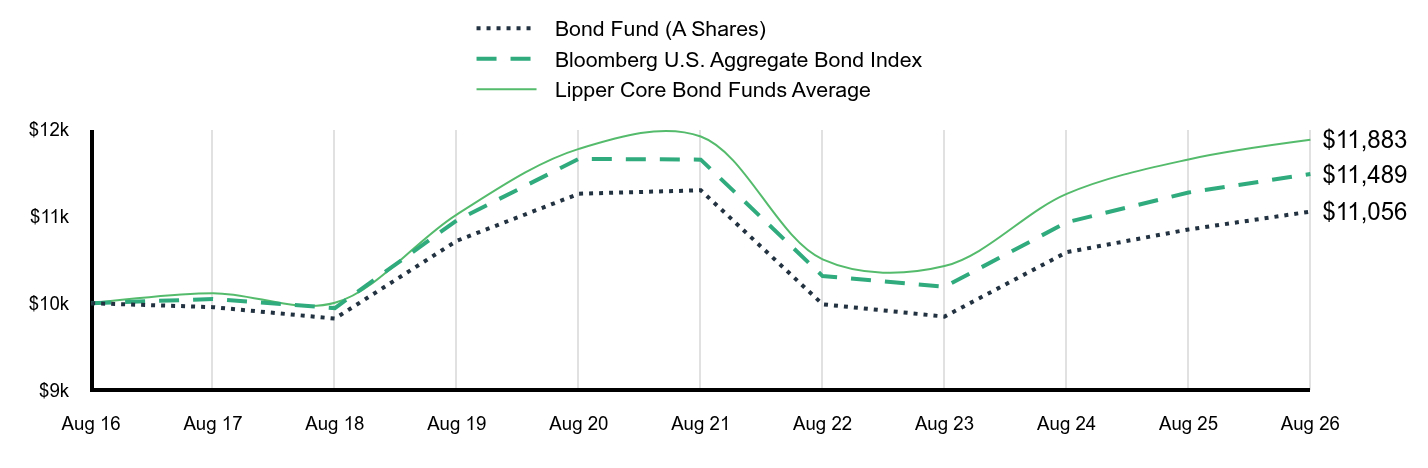
How did the Fund perform last year?The Bond Fund had a lower-than-benchmark duration for most of the year. We favored mortgage-backed securities (MBS) and asset-backed securities (ABS). We overweighted credit risk and illiquidity risk to capture the yield premium. The Fund’s institutional shares outperformed the benchmark. The Fund’s lower duration for most of the year, and an underweight to government sectors were positives. Exposure to shorter-dated ABS with higher spreads helped bolster the yield. The largest contributor was exposure to ABS and to agency MBS. Our underweight to Treasuries also contributed. Our exposure to longer duration in Treasuries detracted from performance. The short duration nature of our non-agency MBS holdings detracted as yields rose more sharply on the short end of the yield curve on expectations of multiple Fed rate hikes. We are keeping duration in line with the index for now. We continue to favor being overweight credit vs government, and exposure to illiquidity risk. A meaningful move above 5% for 10-year U.S. Treasuries would spur us to add duration. Markets remain highly liquid, reducing the cost of illiquidity exposure. |
| Performance Past Does Not Indicate Future [Text] |
The performance data quoted represents past performance and does not guarantee future results
|
| Line Graph [Table Text Block] |
Table Summary | Bond Fund (A Shares) | Bloomberg U.S. Aggregate Bond Index | Lipper Core Bond Funds Average |
|---|
Aug 16 | $10,000 | $10,000 | $10,000 |
|---|
Aug 17 | $9,955 | $10,049 | $10,116 |
|---|
Aug 18 | $9,823 | $9,944 | $10,005 |
|---|
Aug 19 | $10,719 | $10,955 | $11,022 |
|---|
Aug 20 | $11,262 | $11,664 | $11,779 |
|---|
Aug 21 | $11,302 | $11,655 | $11,922 |
|---|
Aug 22 | $9,988 | $10,313 | $10,506 |
|---|
Aug 23 | $9,846 | $10,189 | $10,428 |
|---|
Aug 24 | $10,588 | $10,933 | $11,260 |
|---|
Aug 25 | $10,850 | $11,276 | $11,657 |
|---|
Aug 26 | $11,056 | $11,489 | $11,883 |
|---|
|
| Average Annual Return [Table Text Block] |
Table Summary | 1 Year | 5 Year | 10 Year |
|---|
A Shares | 1.90% | -0.44% | 1.01% |
|---|
Bloomberg U.S. Aggregate Bond Index | 1.89% | -0.29% | 1.40% |
|---|
Lipper Core Bond Funds Average | 1.94% | -0.07% | 1.74% |
|---|
|
| AssetsNet |
$ 108,360,687
|
| Holdings Count | Holding |
156
|
| Advisory Fees Paid, Amount |
$ 217,483
|
| InvestmentCompanyPortfolioTurnover |
39.00%
|
| Additional Fund Statistics [Text Block] |
Table SummaryNet Assets | $108,360,687 |
|---|
Number of Portfolio Holdings | 156 |
|---|
Net Investment Advisory Fees | $217,483 |
|---|
Portfolio Turnover Rate | 39% |
|---|
|
| Holdings [Text Block] |
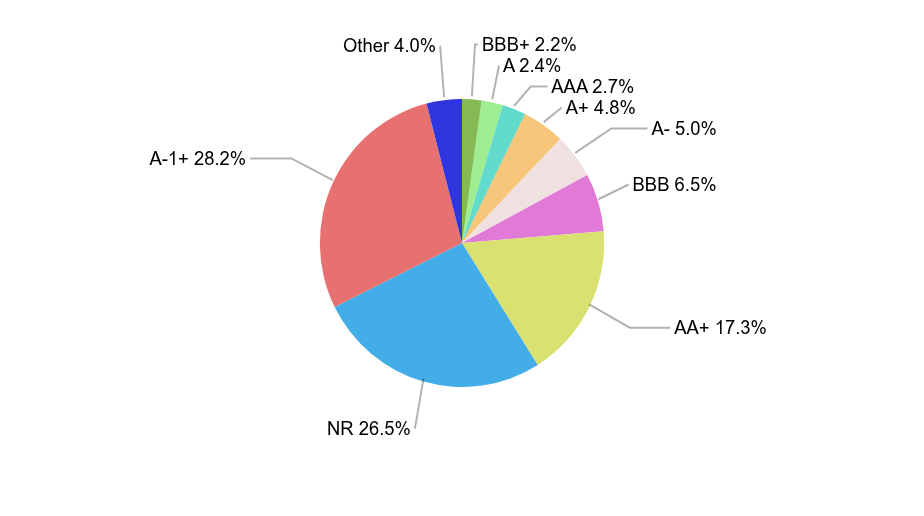
Credit Rating(as a % of Net Assets) Table SummaryValue | Value |
|---|
BBB+ | 2.2% | A | 2.4% | AAA | 2.7% | A+ | 4.8% | A- | 5.0% | BBB | 6.5% | AA+ | 17.3% | NR | 26.5% | A-1+ | 28.2% | Other | 4.0% | Portfolio Composition (as a % of Net Assets)Table SummaryAsset-Backed Securities | 13.6% |
|---|
Mortgage-Backed Securities | 29.2% |
|---|
Commercial Mortgage-Backed Securities | 3.7% |
|---|
Corporate Bonds | 25.8% |
|---|
Taxable Municipal Bonds | 5.6% |
|---|
U.S. Government Agency Securities | 0.8% |
|---|
U.S. Treasury Obligations | 19.1% |
|---|
Yankee Debt Obligations | 1.0% |
|---|
Investment in Affiliates | 0.8% |
|---|
|
| Largest Holdings [Text Block] |
Top 10 Holdings(as a % of Net Assets) Table SummaryU.S. Treasury Bonds | 11.1% |
|---|
U.S. Treasury Notes | 5.4% |
|---|
U.S. Treasury Bonds | 2.6% |
|---|
Broadcom, Inc. | 1.5% |
|---|
The University of Oklahoma Revenue, Series A | 1.5% |
|---|
Fannie Mae REMIC, Series 2023-16, Class VE | 1.4% |
|---|
HI-FI Music IP Issuer LP, Series 2022-1A, Class A2 | 1.4% |
|---|
Salesforce, Inc. | 1.4% |
|---|
Bank of America Corp. | 1.4% |
|---|
Helmerich & Payne, Inc. | 1.3% |
|---|
|
| Material Fund Change [Text Block] |
There were no material fund changes during the reporting period. |
| C000024293 |
|
| Shareholder Report [Line Items] |
|
| Fund Name |
Bond Fund
|
| Class Name |
Institutional Shares
|
| Trading Symbol |
AIBNX
|
| Annual or Semi-Annual Statement [Text Block] |
Annual Shareholder Report
|
| Additional Information [Text Block] |
You can find additional information about the Fund at https://www.cavanalhillfunds.com/literature/mutual-fund-literature/. You can also request this information by contacting us at 1-800-762-7085.
|
| Additional Information Phone Number |
1-800-762-7085
|
| Additional Information Website |
https://www.cavanalhillfunds.com/literature/mutual-fund-literature/.
|
| Expenses [Text Block] |
What were the Fund's costs for the last year?(based on a $10,000 investment) Table SummaryClass name | Costs of a $10,000
investment | Costs paid as a percentage of a
$10,000 investment |
|---|
Institutional Shares | $50 | 0.49% |
|---|
|
| Expenses Paid, Amount |
$ 50
|
| Expense Ratio, Percent |
0.49%
|
| Factors Affecting Performance [Text Block] |
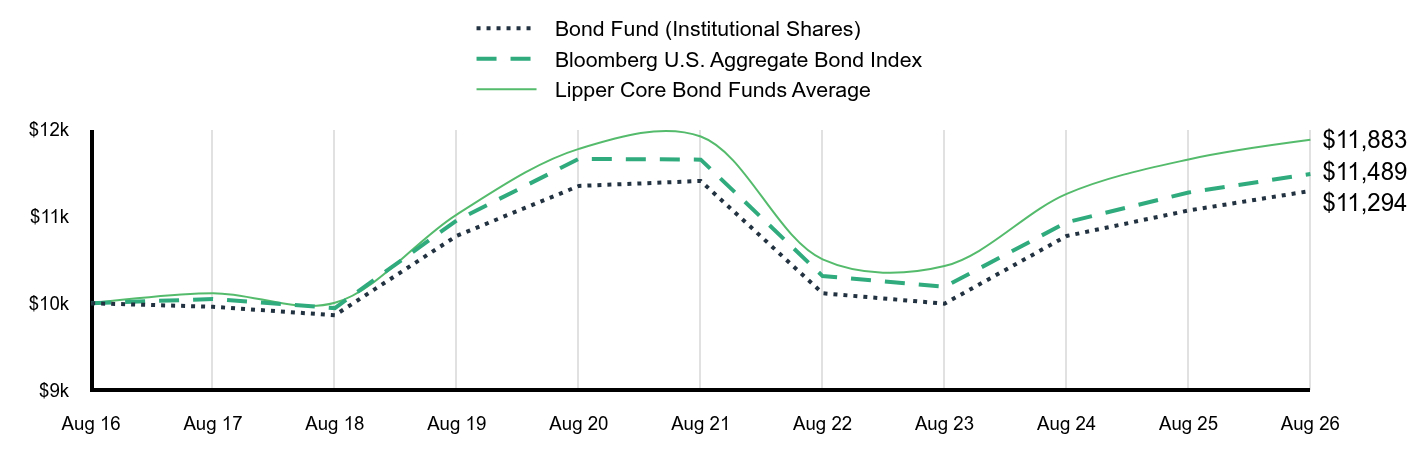
How did the Fund perform last year?The Bond Fund had a lower-than-benchmark duration for most of the year. We favored mortgage-backed securities (MBS) and asset-backed securities (ABS). We overweighted credit risk and illiquidity risk to capture the yield premium. The Fund’s institutional shares outperformed the benchmark. The Fund’s lower duration for most of the year, and an underweight to government sectors were positives. Exposure to shorter-dated ABS with higher spreads helped bolster the yield. The largest contributor was exposure to ABS and to agency MBS. Our underweight to Treasuries also contributed. Our exposure to longer duration in Treasuries detracted from performance. The short duration nature of our non-agency MBS holdings detracted as yields rose more sharply on the short end of the yield curve on expectations of multiple Fed rate hikes. We are keeping duration in line with the index for now. We continue to favor being overweight credit vs government, and exposure to illiquidity risk. A meaningful move above 5% for 10-year U.S. Treasuries would spur us to add duration. Markets remain highly liquid, reducing the cost of illiquidity exposure. |
| Performance Past Does Not Indicate Future [Text] |
The performance data quoted represents past performance and does not guarantee future results
|
| Line Graph [Table Text Block] |
Table Summary | Bond Fund (Institutional Shares) | Bloomberg U.S. Aggregate Bond Index | Lipper Core Bond Funds Average |
|---|
Aug 16 | $10,000 | $10,000 | $10,000 |
|---|
Aug 17 | $9,959 | $10,049 | $10,116 |
|---|
Aug 18 | $9,862 | $9,944 | $10,005 |
|---|
Aug 19 | $10,777 | $10,955 | $11,022 |
|---|
Aug 20 | $11,352 | $11,664 | $11,779 |
|---|
Aug 21 | $11,409 | $11,655 | $11,922 |
|---|
Aug 22 | $10,115 | $10,313 | $10,506 |
|---|
Aug 23 | $9,995 | $10,189 | $10,428 |
|---|
Aug 24 | $10,775 | $10,933 | $11,260 |
|---|
Aug 25 | $11,069 | $11,276 | $11,657 |
|---|
Aug 26 | $11,294 | $11,489 | $11,883 |
|---|
|
| Average Annual Return [Table Text Block] |
Table Summary | 1 Year | 5 Year | 10 Year |
|---|
Institutional Shares | 2.04% | -0.20% | 1.22% |
|---|
Bloomberg U.S. Aggregate Bond Index | 1.89% | -0.29% | 1.40% |
|---|
Lipper Core Bond Funds Average | 1.94% | -0.07% | 1.74% |
|---|
|
| AssetsNet |
$ 108,360,687
|
| Holdings Count | Holding |
156
|
| Advisory Fees Paid, Amount |
$ 217,483
|
| InvestmentCompanyPortfolioTurnover |
39.00%
|
| Additional Fund Statistics [Text Block] |
Table SummaryNet Assets | $108,360,687 |
|---|
Number of Portfolio Holdings | 156 |
|---|
Net Investment Advisory Fees | $217,483 |
|---|
Portfolio Turnover Rate | 39% |
|---|
|
| Holdings [Text Block] |
Credit Rating(as a % of Net Assets) Table SummaryValue | Value |
|---|
BBB+ | 2.2% | A | 2.4% | AAA | 2.7% | A+ | 4.8% | A- | 5.0% | BBB | 6.5% | AA+ | 17.3% | NR | 26.5% | A-1+ | 28.2% | Other | 4.0% | Portfolio Composition (as a % of Net Assets)Table SummaryAsset-Backed Securities | 13.6% |
|---|
Mortgage-Backed Securities | 29.2% |
|---|
Commercial Mortgage-Backed Securities | 3.7% |
|---|
Corporate Bonds | 25.8% |
|---|
Taxable Municipal Bonds | 5.6% |
|---|
U.S. Government Agency Securities | 0.8% |
|---|
U.S. Treasury Obligations | 19.1% |
|---|
Yankee Debt Obligations | 1.0% |
|---|
Investment in Affiliates | 0.8% |
|---|
|
| Largest Holdings [Text Block] |
Top 10 Holdings(as a % of Net Assets) Table SummaryU.S. Treasury Bonds | 11.1% |
|---|
U.S. Treasury Notes | 5.4% |
|---|
U.S. Treasury Bonds | 2.6% |
|---|
Broadcom, Inc. | 1.5% |
|---|
The University of Oklahoma Revenue, Series A | 1.5% |
|---|
Fannie Mae REMIC, Series 2023-16, Class VE | 1.4% |
|---|
HI-FI Music IP Issuer LP, Series 2022-1A, Class A2 | 1.4% |
|---|
Salesforce, Inc. | 1.4% |
|---|
Bank of America Corp. | 1.4% |
|---|
Helmerich & Payne, Inc. | 1.3% |
|---|
|
| Material Fund Change [Text Block] |
There were no material fund changes during the reporting period. |
| C000024292 |
|
| Shareholder Report [Line Items] |
|
| Fund Name |
Bond Fund
|
| Class Name |
Investor Shares
|
| Trading Symbol |
APBDX
|
| Annual or Semi-Annual Statement [Text Block] |
Annual Shareholder Report
|
| Additional Information [Text Block] |
You can find additional information about the Fund at https://www.cavanalhillfunds.com/literature/mutual-fund-literature/. You can also request this information by contacting us at 1-800-762-7085.
|
| Additional Information Phone Number |
1-800-762-7085
|
| Additional Information Website |
https://www.cavanalhillfunds.com/literature/mutual-fund-literature/.
|
| Expenses [Text Block] |
What were the Fund's costs for the last year?(based on a $10,000 investment) Table SummaryClass name | Costs of a $10,000
investment | Costs paid as a percentage of a
$10,000 investment |
|---|
Investor Shares | $75 | 0.74% |
|---|
|
| Expenses Paid, Amount |
$ 75
|
| Expense Ratio, Percent |
0.74%
|
| Factors Affecting Performance [Text Block] |
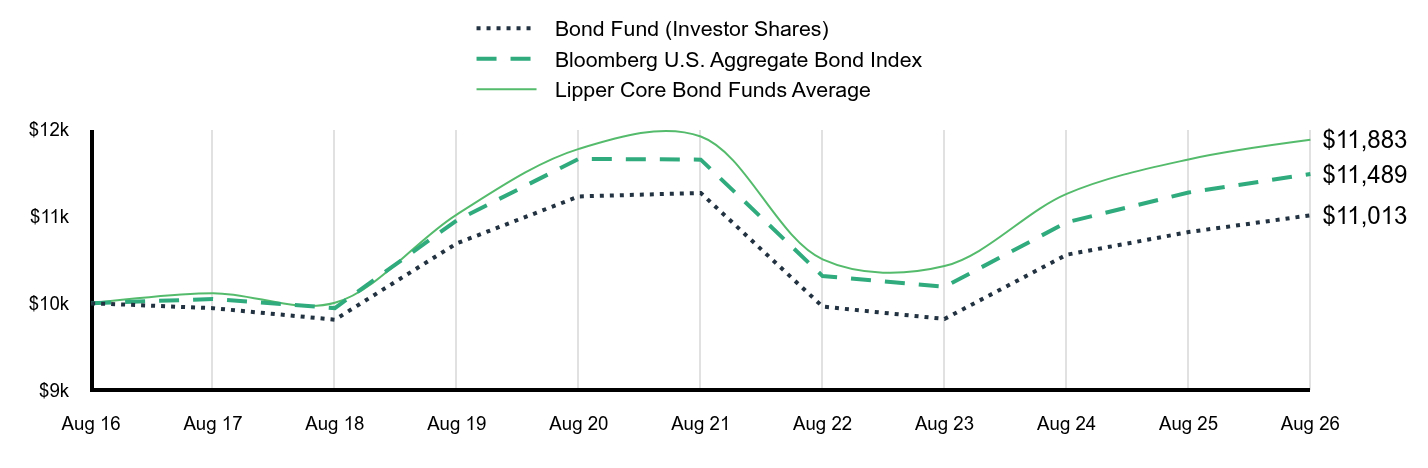
How did the Fund perform last year?The Bond Fund had a lower-than-benchmark duration for most of the year. We favored mortgage-backed securities (MBS) and asset-backed securities (ABS). We overweighted credit risk and illiquidity risk to capture the yield premium. The Fund’s institutional shares outperformed the benchmark. The Fund’s lower duration for most of the year, and an underweight to government sectors were positives. Exposure to shorter-dated ABS with higher spreads helped bolster the yield. The largest contributor was exposure to ABS and to agency MBS. Our underweight to Treasuries also contributed. Our exposure to longer duration in Treasuries detracted from performance. The short duration nature of our non-agency MBS holdings detracted as yields rose more sharply on the short end of the yield curve on expectations of multiple Fed rate hikes. We are keeping duration in line with the index for now. We continue to favor being overweight credit vs government, and exposure to illiquidity risk. A meaningful move above 5% for 10-year U.S. Treasuries would spur us to add duration. Markets remain highly liquid, reducing the cost of illiquidity exposure. |
| Performance Past Does Not Indicate Future [Text] |
The performance data quoted represents past performance and does not guarantee future results
|
| Line Graph [Table Text Block] |
Table Summary | Bond Fund (Investor Shares) | Bloomberg U.S. Aggregate Bond Index | Lipper Core Bond Funds Average |
|---|
Aug 16 | $10,000 | $10,000 | $10,000 |
|---|
Aug 17 | $9,943 | $10,049 | $10,116 |
|---|
Aug 18 | $9,810 | $9,944 | $10,005 |
|---|
Aug 19 | $10,690 | $10,955 | $11,022 |
|---|
Aug 20 | $11,231 | $11,664 | $11,779 |
|---|
Aug 21 | $11,271 | $11,655 | $11,922 |
|---|
Aug 22 | $9,961 | $10,313 | $10,506 |
|---|
Aug 23 | $9,819 | $10,189 | $10,428 |
|---|
Aug 24 | $10,559 | $10,933 | $11,260 |
|---|
Aug 25 | $10,820 | $11,276 | $11,657 |
|---|
Aug 26 | $11,013 | $11,489 | $11,883 |
|---|
|
| Average Annual Return [Table Text Block] |
Table Summary | 1 Year | 5 Year | 10 Year |
|---|
Investor Shares | 1.79% | -0.46% | 0.97% |
|---|
Bloomberg U.S. Aggregate Bond Index | 1.89% | -0.29% | 1.40% |
|---|
Lipper Core Bond Funds Average | 1.94% | -0.07% | 1.74% |
|---|
|
| AssetsNet |
$ 108,360,687
|
| Holdings Count | Holding |
156
|
| Advisory Fees Paid, Amount |
$ 217,483
|
| InvestmentCompanyPortfolioTurnover |
39.00%
|
| Additional Fund Statistics [Text Block] |
Table SummaryNet Assets | $108,360,687 |
|---|
Number of Portfolio Holdings | 156 |
|---|
Net Investment Advisory Fees | $217,483 |
|---|
Portfolio Turnover Rate | 39% |
|---|
|
| Holdings [Text Block] |
Credit Rating(as a % of Net Assets) Table SummaryValue | Value |
|---|
BBB+ | 2.2% | A | 2.4% | AAA | 2.7% | A+ | 4.8% | A- | 5.0% | BBB | 6.5% | AA+ | 17.3% | NR | 26.5% | A-1+ | 28.2% | Other | 4.0% | Portfolio Composition (as a % of Net Assets)Table SummaryAsset-Backed Securities | 13.6% |
|---|
Mortgage-Backed Securities | 29.2% |
|---|
Commercial Mortgage-Backed Securities | 3.7% |
|---|
Corporate Bonds | 25.8% |
|---|
Taxable Municipal Bonds | 5.6% |
|---|
U.S. Government Agency Securities | 0.8% |
|---|
U.S. Treasury Obligations | 19.1% |
|---|
Yankee Debt Obligations | 1.0% |
|---|
Investment in Affiliates | 0.8% |
|---|
|
| Largest Holdings [Text Block] |
Top 10 Holdings(as a % of Net Assets) Table SummaryU.S. Treasury Bonds | 11.1% |
|---|
U.S. Treasury Notes | 5.4% |
|---|
U.S. Treasury Bonds | 2.6% |
|---|
Broadcom, Inc. | 1.5% |
|---|
The University of Oklahoma Revenue, Series A | 1.5% |
|---|
Fannie Mae REMIC, Series 2023-16, Class VE | 1.4% |
|---|
HI-FI Music IP Issuer LP, Series 2022-1A, Class A2 | 1.4% |
|---|
Salesforce, Inc. | 1.4% |
|---|
Bank of America Corp. | 1.4% |
|---|
Helmerich & Payne, Inc. | 1.3% |
|---|
|
| Material Fund Change [Text Block] |
There were no material fund changes during the reporting period. |
| C000041650 |
|
| Shareholder Report [Line Items] |
|
| Fund Name |
Government Securities Money Market Fund
|
| Class Name |
Administrative Shares
|
| Trading Symbol |
APCXX
|
| Annual or Semi-Annual Statement [Text Block] |
Annual Shareholder Report
|
| Additional Information [Text Block] |
You can find additional information about the Fund at https://www.cavanalhillfunds.com/literature/mutual-fund-literature/. You can also request this information by contacting us at 1-800-762-7085.
|
| Additional Information Phone Number |
1-800-762-7085
|
| Additional Information Website |
https://www.cavanalhillfunds.com/literature/mutual-fund-literature/.
|
| Expenses [Text Block] |
What were the Fund's costs for the last year?(based on a $10,000 investment) Table SummaryClass name | Costs of a $10,000
investment | Costs paid as a percentage of a
$10,000 investment |
|---|
Administrative Shares | $68 | 0.67% |
|---|
|
| Expenses Paid, Amount |
$ 68
|
| Expense Ratio, Percent |
0.67%
|
| Factors Affecting Performance [Text Block] |
How did the Fund perform last year?During the second quarter of 2026, we became more focused on liquidity and rolling short-term maturities as market dynamics led to increasing yields. We allowed weighted average maturity to decrease naturally. As pressure increased on the Federal Reserve to raise its policy rate, we lowered our overall portfolio duration. The Select shares of our Government Securities Money Market Fund were ranked 43rd percentile by Lipper for the final three months of the period while the Administrative shares of our U.S. Treasury Fund were ranked 86th percentile. Instead of extending duration late in that quarter, we invested in repurchase agreements to position the funds to quickly take advantage of any rate hike. We increased SEC yield by 9 and 5 basis points, respectively, by well-timed adjustments in yield curve positions. Interest rate cuts were priced into the market early in 2026. Purchases made during that period created a slight yield drag. Three more interest rate hikes are priced into the market through 2027, but we still think it is early to extend duration. We are positioned shorter, with more flexibility, than peers. |
| Performance Past Does Not Indicate Future [Text] |
The performance data quoted represents past performance and does not guarantee future results
|
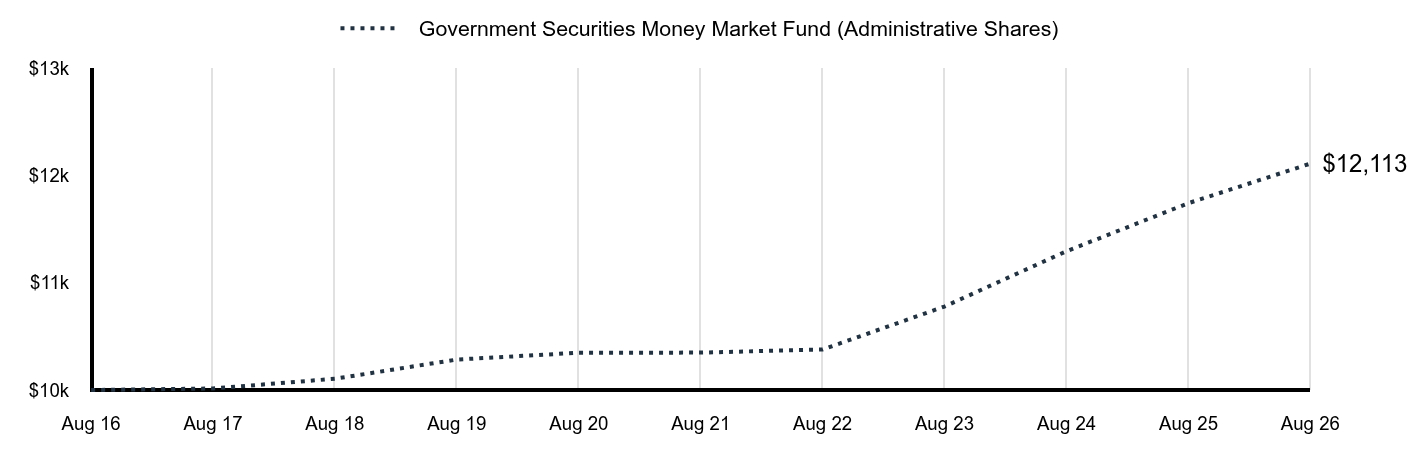
| Line Graph [Table Text Block] |
Table Summary | Government Securities Money Market Fund (Administrative Shares) |
|---|
Aug 16 | $10,000 |
|---|
Aug 17 | $10,014 |
|---|
Aug 18 | $10,105 |
|---|
Aug 19 | $10,284 |
|---|
Aug 20 | $10,348 |
|---|
Aug 21 | $10,349 |
|---|
Aug 22 | $10,378 |
|---|
Aug 23 | $10,779 |
|---|
Aug 24 | $11,296 |
|---|
Aug 25 | $11,744 |
|---|
Aug 26 | $12,113 |
|---|
|
| Average Annual Return [Table Text Block] |
Table Summary | 1 Year | 5 Year | 10 Year |
|---|
Administrative Shares | 3.14% | 3.20% | 1.94% |
|---|
|
| AssetsNet |
$ 3,330,015,450
|
| Holdings Count | Holding |
80
|
| Advisory Fees Paid, Amount |
$ 1,658,716
|
| Additional Fund Statistics [Text Block] |
Table SummaryNet Assets | $3,330,015,450 |
|---|
Number of Portfolio Holdings | 80 |
|---|
Net Investment Advisory Fees | $1,658,716 |
|---|
|
| Holdings [Text Block] |
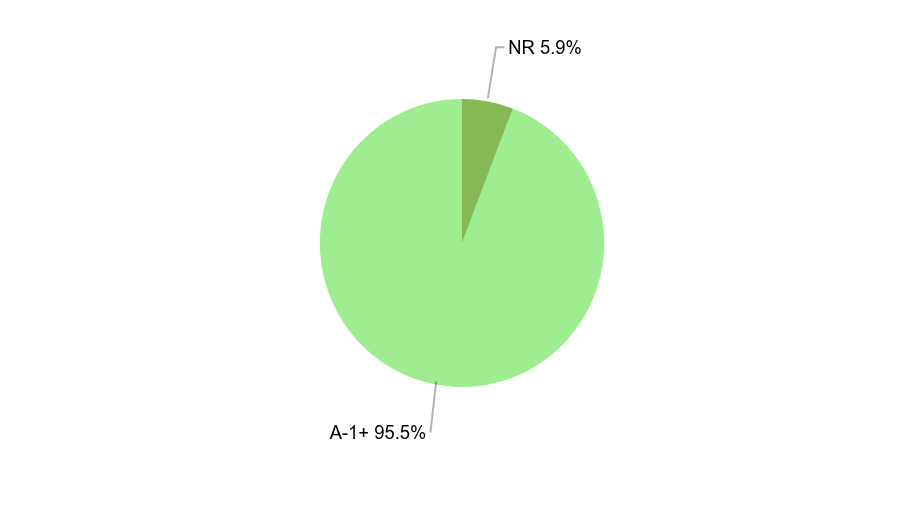
Credit Rating(as a % of Net Assets) Table SummaryValue | Value |
|---|
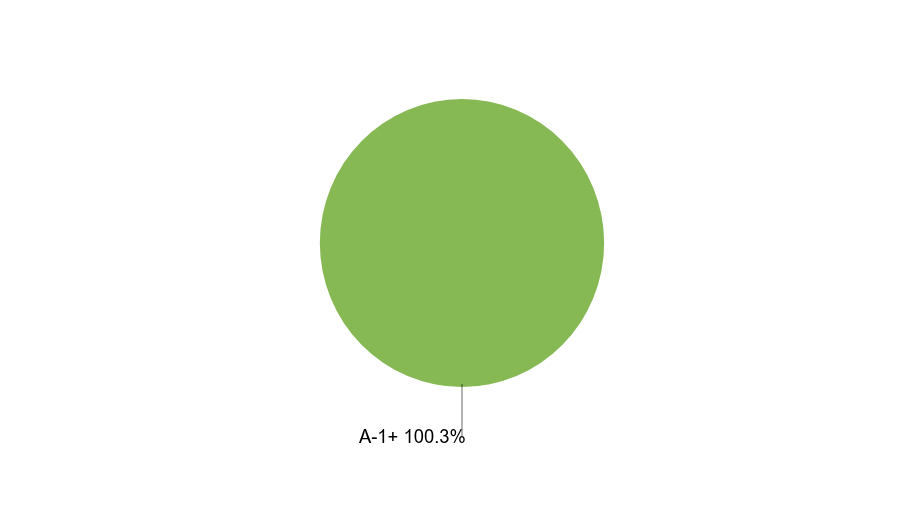
NR | 5.9% | A-1+ | 95.5% | Portfolio Composition (as a % of Net Assets)Table SummaryU.S. Government Agency Securities | 53.1% |
|---|
U.S. Treasury Obligations | 9.8% |
|---|
Repurchase Agreements | 32.6% |
|---|
Investment Companies | 5.9% |
|---|
|
| Largest Holdings [Text Block] |
Top 10 Holdings(as a % of Net Assets) Table SummaryFederal Home Loan Banks | 1.8% |
|---|
Federal Home Loan Banks | 1.7% |
|---|
Federal Home Loan Banks | 1.5% |
|---|
U.S. Treasury Notes | 1.5% |
|---|
Federal Home Loan Banks | 1.5% |
|---|
Federal Farm Credit Banks Funding Corp. | 1.5% |
|---|
Federal Farm Credit Banks Funding Corp. | 1.5% |
|---|
Federal Farm Credit Banks Funding Corp. | 1.5% |
|---|
Federal Farm Credit Banks Funding Corp. | 1.5% |
|---|
Federal Farm Credit Banks Funding Corp. | 1.5% |
|---|
|
| Material Fund Change [Text Block] |
There were no material fund changes during the reporting period. |
| C000041649 |
|
| Shareholder Report [Line Items] |
|
| Fund Name |
Government Securities Money Market Fund
|
| Class Name |
Institutional Shares
|
| Trading Symbol |
APHXX
|
| Annual or Semi-Annual Statement [Text Block] |
Annual Shareholder Report
|
| Additional Information [Text Block] |
You can find additional information about the Fund at https://www.cavanalhillfunds.com/literature/mutual-fund-literature/. You can also request this information by contacting us at 1-800-762-7085.
|
| Additional Information Phone Number |
1-800-762-7085
|
| Additional Information Website |
https://www.cavanalhillfunds.com/literature/mutual-fund-literature/.
|
| Expenses [Text Block] |
What were the Fund's costs for the last year?(based on a $10,000 investment) Table SummaryClass name | Costs of a $10,000
investment | Costs paid as a percentage of a
$10,000 investment |
|---|
Institutional Shares | $25 | 0.25% |
|---|
|
| Expenses Paid, Amount |
$ 25
|
| Expense Ratio, Percent |
0.25%
|
| Factors Affecting Performance [Text Block] |
How did the Fund perform last year?During the second quarter of 2026, we became more focused on liquidity and rolling short-term maturities as market dynamics led to increasing yields. We allowed weighted average maturity to decrease naturally. As pressure increased on the Federal Reserve to raise its policy rate, we lowered our overall portfolio duration. The Select shares of our Government Securities Money Market Fund were ranked 43rd percentile by Lipper for the final three months of the period while the Administrative shares of our U.S. Treasury Fund were ranked 86th percentile. Instead of extending duration late in that quarter, we invested in repurchase agreements to position the funds to quickly take advantage of any rate hike. We increased SEC yield by 9 and 5 basis points, respectively, by well-timed adjustments in yield curve positions. Interest rate cuts were priced into the market early in 2026. Purchases made during that period created a slight yield drag. Three more interest rate hikes are priced into the market through 2027, but we still think it is early to extend duration. We are positioned shorter, with more flexibility, than peers. |
| Performance Past Does Not Indicate Future [Text] |
The performance data quoted represents past performance and does not guarantee future results
|
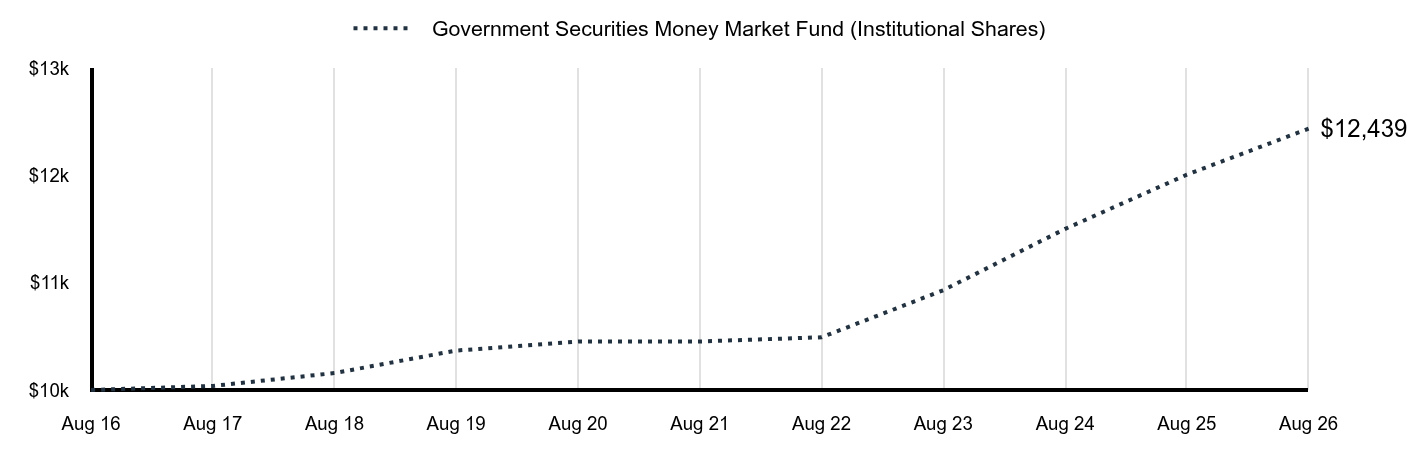
| Line Graph [Table Text Block] |
Table Summary | Government Securities Money Market Fund (Institutional Shares) |
|---|
Aug 16 | $10,000 |
|---|
Aug 17 | $10,038 |
|---|
Aug 18 | $10,158 |
|---|
Aug 19 | $10,368 |
|---|
Aug 20 | $10,452 |
|---|
Aug 21 | $10,453 |
|---|
Aug 22 | $10,492 |
|---|
Aug 23 | $10,931 |
|---|
Aug 24 | $11,504 |
|---|
Aug 25 | $12,010 |
|---|
Aug 26 | $12,439 |
|---|
|
| Average Annual Return [Table Text Block] |
Table Summary | 1 Year | 5 Year | 10 Year |
|---|
Institutional Shares | 3.57% | 3.54% | 2.21% |
|---|
|
| AssetsNet |
$ 3,330,015,450
|
| Holdings Count | Holding |
80
|
| Advisory Fees Paid, Amount |
$ 1,658,716
|
| Additional Fund Statistics [Text Block] |
Table SummaryNet Assets | $3,330,015,450 |
|---|
Number of Portfolio Holdings | 80 |
|---|
Net Investment Advisory Fees | $1,658,716 |
|---|
|
| Holdings [Text Block] |
Credit Rating(as a % of Net Assets) Table SummaryValue | Value |
|---|
NR | 5.9% | A-1+ | 95.5% | Portfolio Composition (as a % of Net Assets)Table SummaryU.S. Government Agency Securities | 53.1% |
|---|
U.S. Treasury Obligations | 9.8% |
|---|
Repurchase Agreements | 32.6% |
|---|
Investment Companies | 5.9% |
|---|
|
| Largest Holdings [Text Block] |
Top 10 Holdings(as a % of Net Assets) Table SummaryFederal Home Loan Banks | 1.8% |
|---|
Federal Home Loan Banks | 1.7% |
|---|
Federal Home Loan Banks | 1.5% |
|---|
U.S. Treasury Notes | 1.5% |
|---|
Federal Home Loan Banks | 1.5% |
|---|
Federal Farm Credit Banks Funding Corp. | 1.5% |
|---|
Federal Farm Credit Banks Funding Corp. | 1.5% |
|---|
Federal Farm Credit Banks Funding Corp. | 1.5% |
|---|
Federal Farm Credit Banks Funding Corp. | 1.5% |
|---|
Federal Farm Credit Banks Funding Corp. | 1.5% |
|---|
|
| Material Fund Change [Text Block] |
There were no material fund changes during the reporting period. |
| C000073542 |
|
| Shareholder Report [Line Items] |
|
| Fund Name |
Government Securities Money Market Fund
|
| Class Name |
Premier Shares
|
| Trading Symbol |
APPXX
|
| Annual or Semi-Annual Statement [Text Block] |
Annual Shareholder Report
|
| Additional Information [Text Block] |
You can find additional information about the Fund at https://www.cavanalhillfunds.com/literature/mutual-fund-literature/. You can also request this information by contacting us at 1-800-762-7085.
|
| Additional Information Phone Number |
1-800-762-7085
|
| Additional Information Website |
https://www.cavanalhillfunds.com/literature/mutual-fund-literature/.
|
| Expenses [Text Block] |
What were the Fund's costs for the last year?(based on a $10,000 investment) Table SummaryClass name | Costs of a $10,000
investment | Costs paid as a percentage of a
$10,000 investment |
|---|
Premier Shares | $68 | 0.67% |
|---|
|
| Expenses Paid, Amount |
$ 68
|
| Expense Ratio, Percent |
0.67%
|
| Factors Affecting Performance [Text Block] |
How did the Fund perform last year?During the second quarter of 2026, we became more focused on liquidity and rolling short-term maturities as market dynamics led to increasing yields. We allowed weighted average maturity to decrease naturally. As pressure increased on the Federal Reserve to raise its policy rate, we lowered our overall portfolio duration. The Select shares of our Government Securities Money Market Fund were ranked 43rd percentile by Lipper for the final three months of the period while the Administrative shares of our U.S. Treasury Fund were ranked 86th percentile. Instead of extending duration late in that quarter, we invested in repurchase agreements to position the funds to quickly take advantage of any rate hike. We increased SEC yield by 9 and 5 basis points, respectively, by well-timed adjustments in yield curve positions. Interest rate cuts were priced into the market early in 2026. Purchases made during that period created a slight yield drag. Three more interest rate hikes are priced into the market through 2027, but we still think it is early to extend duration. We are positioned shorter, with more flexibility, than peers. |
| Performance Past Does Not Indicate Future [Text] |
The performance data quoted represents past performance and does not guarantee future results
|
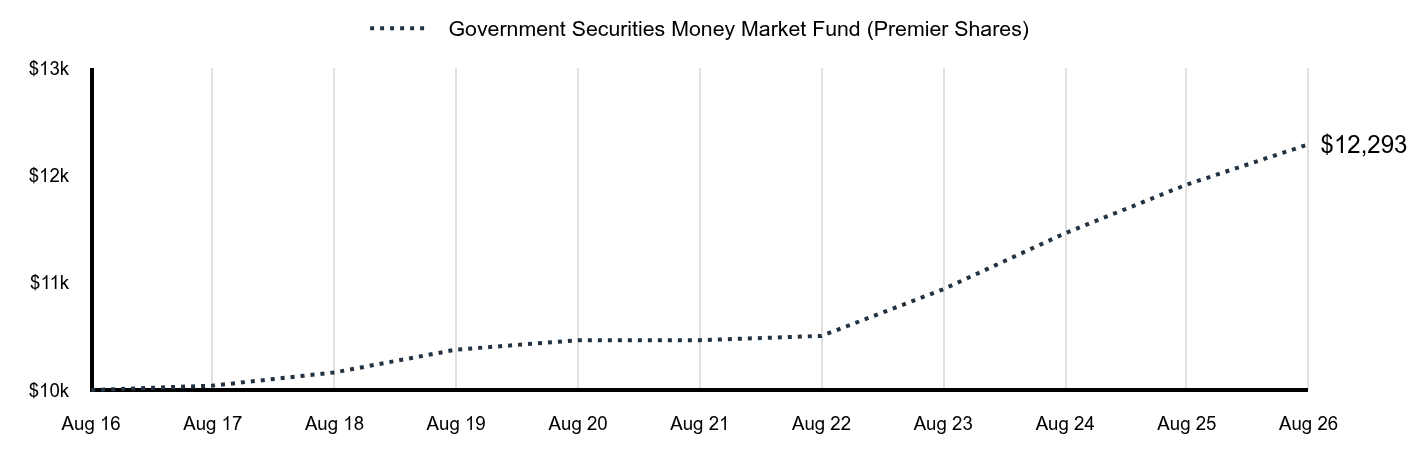
| Line Graph [Table Text Block] |
Table Summary | Government Securities Money Market Fund (Premier Shares) |
|---|
Aug 16 | $10,000 |
|---|
Aug 17 | $10,041 |
|---|
Aug 18 | $10,164 |
|---|
Aug 19 | $10,377 |
|---|
Aug 20 | $10,464 |
|---|
Aug 21 | $10,465 |
|---|
Aug 22 | $10,505 |
|---|
Aug 23 | $10,940 |
|---|
Aug 24 | $11,464 |
|---|
Aug 25 | $11,918 |
|---|
Aug 26 | $12,293 |
|---|
|
| Average Annual Return [Table Text Block] |
Table Summary | 1 Year | 5 Year | 10 Year |
|---|
Premier Shares | 3.14% | 3.27% | 2.09% |
|---|
|
| AssetsNet |
$ 3,330,015,450
|
| Holdings Count | Holding |
80
|
| Advisory Fees Paid, Amount |
$ 1,658,716
|
| Additional Fund Statistics [Text Block] |
Table SummaryNet Assets | $3,330,015,450 |
|---|
Number of Portfolio Holdings | 80 |
|---|
Net Investment Advisory Fees | $1,658,716 |
|---|
|
| Holdings [Text Block] |
Credit Rating(as a % of Net Assets) Table SummaryValue | Value |
|---|
NR | 5.9% | A-1+ | 95.5% | Portfolio Composition (as a % of Net Assets)Table SummaryU.S. Government Agency Securities | 53.1% |
|---|
U.S. Treasury Obligations | 9.8% |
|---|
Repurchase Agreements | 32.6% |
|---|
Investment Companies | 5.9% |
|---|
|
| Largest Holdings [Text Block] |
Top 10 Holdings(as a % of Net Assets) Table SummaryFederal Home Loan Banks | 1.8% |
|---|
Federal Home Loan Banks | 1.7% |
|---|
Federal Home Loan Banks | 1.5% |
|---|
U.S. Treasury Notes | 1.5% |
|---|
Federal Home Loan Banks | 1.5% |
|---|
Federal Farm Credit Banks Funding Corp. | 1.5% |
|---|
Federal Farm Credit Banks Funding Corp. | 1.5% |
|---|
Federal Farm Credit Banks Funding Corp. | 1.5% |
|---|
Federal Farm Credit Banks Funding Corp. | 1.5% |
|---|
Federal Farm Credit Banks Funding Corp. | 1.5% |
|---|
|
| Material Fund Change [Text Block] |
There were no material fund changes during the reporting period. |
| C000041652 |
|
| Shareholder Report [Line Items] |
|
| Fund Name |
Government Securities Money Market Fund
|
| Class Name |
Select Shares
|
| Trading Symbol |
APSXX
|
| Annual or Semi-Annual Statement [Text Block] |
Annual Shareholder Report
|
| Additional Information [Text Block] |
You can find additional information about the Fund at https://www.cavanalhillfunds.com/literature/mutual-fund-literature/. You can also request this information by contacting us at 1-800-762-7085.
|
| Additional Information Phone Number |
1-800-762-7085
|
| Additional Information Website |
https://www.cavanalhillfunds.com/literature/mutual-fund-literature/.
|
| Expenses [Text Block] |
What were the Fund's costs for the last year?(based on a $10,000 investment) Table SummaryClass name | Costs of a $10,000
investment | Costs paid as a percentage of a
$10,000 investment |
|---|
Select Shares | $17 | 0.17% |
|---|
|
| Expenses Paid, Amount |
$ 17
|
| Expense Ratio, Percent |
0.17%
|
| Factors Affecting Performance [Text Block] |
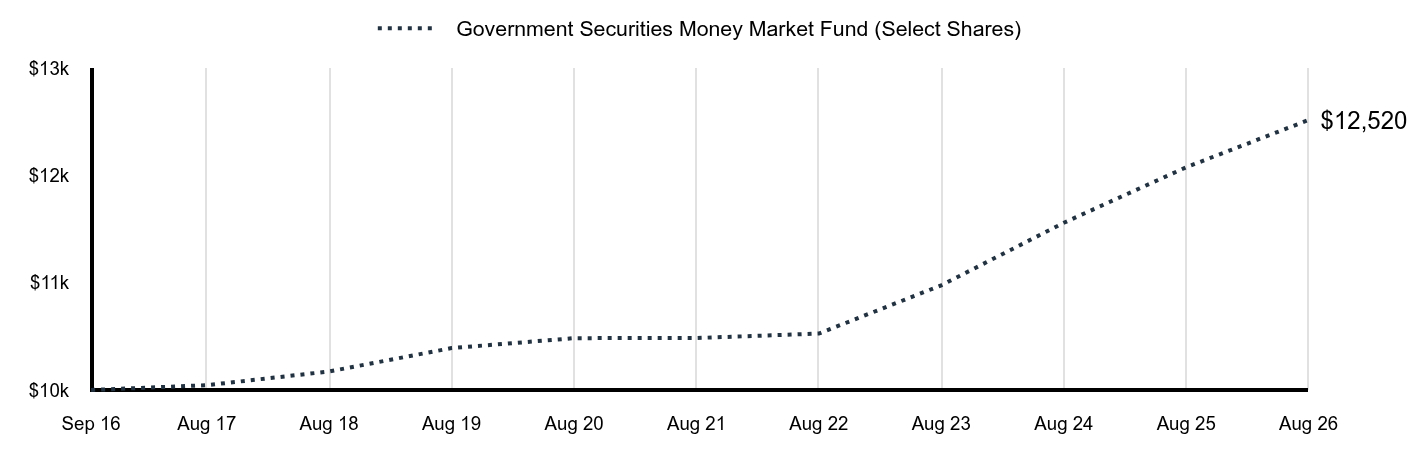
How did the Fund perform last year?During the second quarter of 2026, we became more focused on liquidity and rolling short-term maturities as market dynamics led to increasing yields. We allowed weighted average maturity to decrease naturally. As pressure increased on the Federal Reserve to raise its policy rate, we lowered our overall portfolio duration. The Select shares of our Government Securities Money Market Fund were ranked 43rd percentile by Lipper for the final three months of the period while the Administrative shares of our U.S. Treasury Fund were ranked 86th percentile. Instead of extending duration late in that quarter, we invested in repurchase agreements to position the funds to quickly take advantage of any rate hike. We increased SEC yield by 9 and 5 basis points, respectively, by well-timed adjustments in yield curve positions. Interest rate cuts were priced into the market early in 2026. Purchases made during that period created a slight yield drag. Three more interest rate hikes are priced into the market through 2027, but we still think it is early to extend duration. We are positioned shorter, with more flexibility, than peers. |
| Performance Past Does Not Indicate Future [Text] |
The performance data quoted represents past performance and does not guarantee future results
|
| Line Graph [Table Text Block] |
Table Summary | Government Securities Money Market Fund (Select Shares) |
|---|
Sep 16 | $10,000 |
|---|
Aug 17 | $10,045 |
|---|
Aug 18 | $10,173 |
|---|
Aug 19 | $10,391 |
|---|
Aug 20 | $10,484 |
|---|
Aug 21 | $10,485 |
|---|
Aug 22 | $10,527 |
|---|
Aug 23 | $10,977 |
|---|
Aug 24 | $11,561 |
|---|
Aug 25 | $12,079 |
|---|
Aug 26 | $12,520 |
|---|
|
| Average Annual Return [Table Text Block] |
Table Summary | 1 Year | 5 Year | Since Inception |
|---|
Select Shares | 3.66% | 3.61% | 2.29% |
|---|
|
| AssetsNet |
$ 3,330,015,450
|
| Holdings Count | Holding |
80
|
| Advisory Fees Paid, Amount |
$ 1,658,716
|
| Additional Fund Statistics [Text Block] |
Table SummaryNet Assets | $3,330,015,450 |
|---|
Number of Portfolio Holdings | 80 |
|---|
Net Investment Advisory Fees | $1,658,716 |
|---|
|
| Holdings [Text Block] |
Credit Rating(as a % of Net Assets) Table SummaryValue | Value |
|---|
NR | 5.9% | A-1+ | 95.5% | Portfolio Composition (as a % of Net Assets)Table SummaryU.S. Government Agency Securities | 53.1% |
|---|
U.S. Treasury Obligations | 9.8% |
|---|
Repurchase Agreements | 32.6% |
|---|
Investment Companies | 5.9% |
|---|
|
| Largest Holdings [Text Block] |
Top 10 Holdings(as a % of Net Assets) Table SummaryFederal Home Loan Banks | 1.8% |
|---|
Federal Home Loan Banks | 1.7% |
|---|
Federal Home Loan Banks | 1.5% |
|---|
U.S. Treasury Notes | 1.5% |
|---|
Federal Home Loan Banks | 1.5% |
|---|
Federal Farm Credit Banks Funding Corp. | 1.5% |
|---|
Federal Farm Credit Banks Funding Corp. | 1.5% |
|---|
Federal Farm Credit Banks Funding Corp. | 1.5% |
|---|
Federal Farm Credit Banks Funding Corp. | 1.5% |
|---|
Federal Farm Credit Banks Funding Corp. | 1.5% |
|---|
|
| Material Fund Change [Text Block] |
There were no material fund changes during the reporting period. |
| C000223873 |
|
| Shareholder Report [Line Items] |
|
| Fund Name |
Hedged Equity Income Fund
|
| Class Name |
A Shares
|
| Trading Symbol |
AALIX
|
| Annual or Semi-Annual Statement [Text Block] |
Annual Shareholder Report
|
| Additional Information [Text Block] |
You can find additional information about the Fund at https://www.cavanalhillfunds.com/literature/mutual-fund-literature/. You can also request this information by contacting us at 1-800-762-7085.
|
| Additional Information Phone Number |
1-800-762-7085
|
| Additional Information Website |
https://www.cavanalhillfunds.com/literature/mutual-fund-literature/.
|
| Expenses [Text Block] |
What were the Fund's costs for the last year?(based on a $10,000 investment) Table SummaryClass name | Costs of a $10,000
investment | Costs paid as a percentage of a
$10,000 investment |
|---|
A Shares | $143 | 1.35% |
|---|
|
| Expenses Paid, Amount |
$ 143
|
| Expense Ratio, Percent |
1.35%
|
| Factors Affecting Performance [Text Block] |
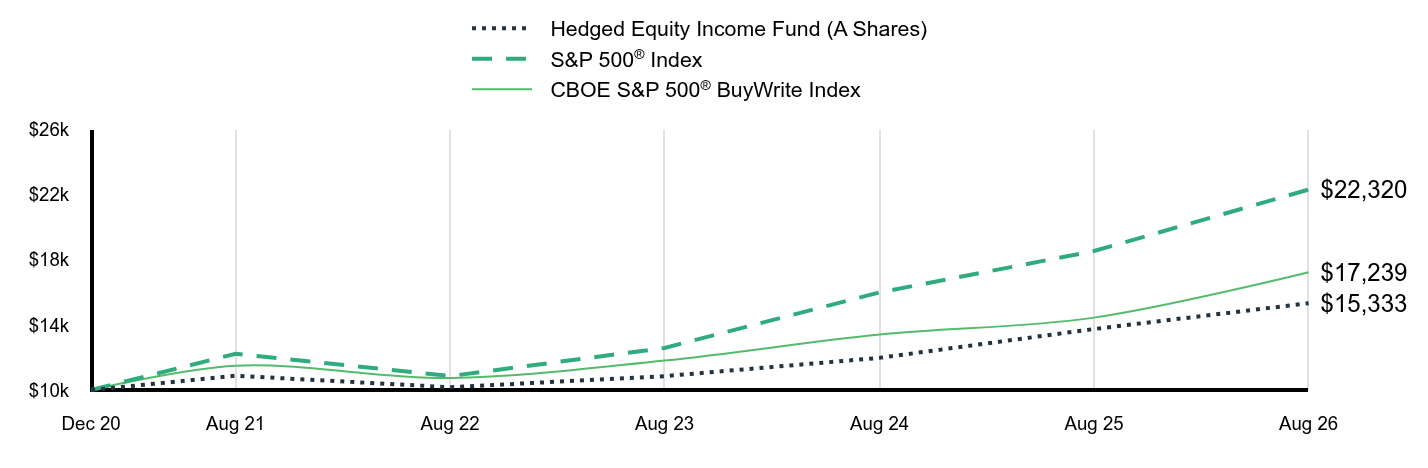
How did the Fund perform last year?Our options overlay balances risk and reward. The Fund’s put options lower volatility relative to the broader market while our disciplined approach to call writing helps preserve upside capture during rallies. The Fund underperformed its benchmark by more than 700 basis points. The Fund tends to underweight the low-yielding information technology (IT) sector because of our mandate to generate meaningful dividend income. This detracted, particularly during the second quarter of 2026, when IT stocks returned more than 40%, vastly outperforming the S&P 500 Index and our benchmark. Performance benefited from stock picking in the IT and consumer discretionary sectors, while stock picking in the energy, communication services, and financials sectors detracted. We believe markets and the economy are at a crossroads. Longer term, the AI capital expenditure supercycle should continue to support economic growth, particularly in the U.S. In the near term, however, a major risk looms as oil prices and general inflation trend higher as a result of the war in Iran. As such, the Fund’s positioning reflects a relatively neutral outlook. |
| Performance Past Does Not Indicate Future [Text] |
The performance data quoted represents past performance and does not guarantee future results
|
| Line Graph [Table Text Block] |
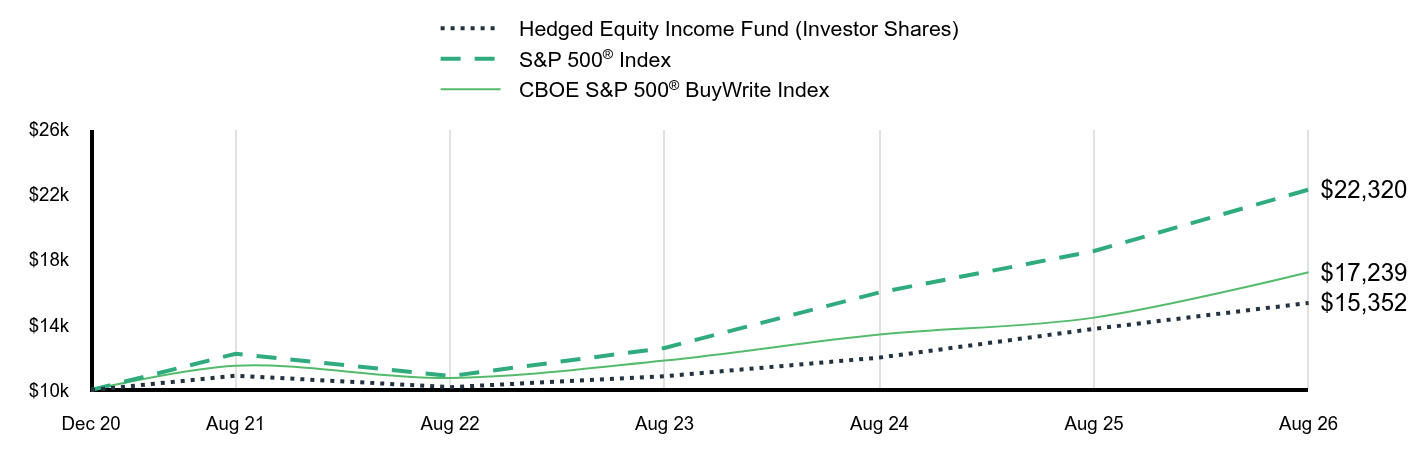
Table Summary | Hedged Equity Income Fund (A Shares) | S&P 500® Index | CBOE S&P 500® BuyWrite Index |
|---|
Dec 20 | $10,000 | $10,000 | $10,000 |
|---|
Aug 21 | $10,877 | $12,227 | $11,494 |
|---|
Aug 22 | $10,170 | $10,855 | $10,735 |
|---|
Aug 23 | $10,852 | $12,585 | $11,812 |
|---|
Aug 24 | $11,977 | $16,000 | $13,413 |
|---|
Aug 25 | $13,751 | $18,541 | $14,449 |
|---|
Aug 26 | $15,333 | $22,320 | $17,239 |
|---|
|
| Average Annual Return [Table Text Block] |
Table Summary | 1 Year | 5 Year | Since Inception |
|---|
A Shares | 11.51% | 7.11% | 7.82% |
|---|
S&P 500® Index | 20.38% | 12.79% | 15.20% |
|---|
CBOE S&P 500® BuyWrite Index | 19.31% | 8.45% | 10.07% |
|---|
|
| AssetsNet |
$ 34,072,219
|
| Holdings Count | Holding |
69
|
| Advisory Fees Paid, Amount |
$ 157,938
|
| InvestmentCompanyPortfolioTurnover |
41.00%
|
| Additional Fund Statistics [Text Block] |
Table SummaryNet Assets | $34,072,219 |
|---|
Number of Portfolio Holdings | 69 |
|---|
Net Investment Advisory Fees | $157,938 |
|---|
Portfolio Turnover Rate | 41% |
|---|
|
| Holdings [Text Block] |
Sector Allocation(as a % of Net Assets) Table SummaryValue | Value |
|---|
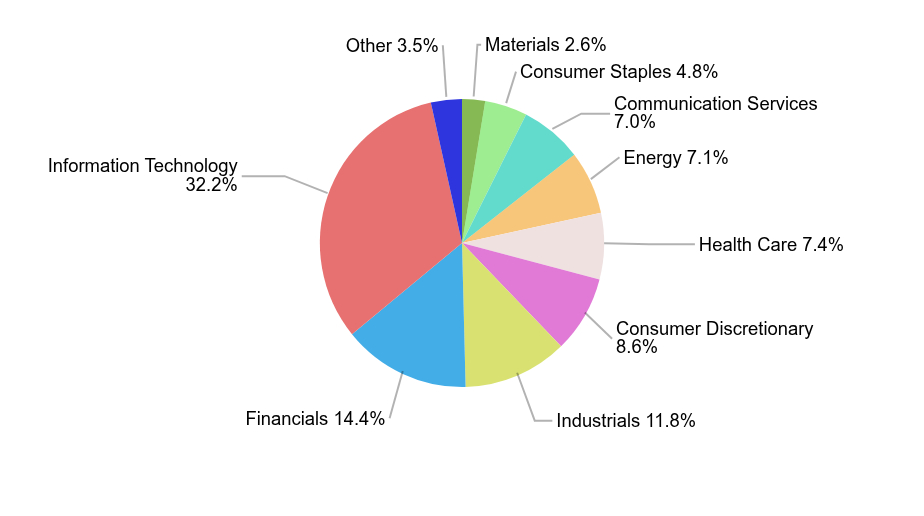
Materials | 2.6% | Consumer Staples | 4.8% | Communication Services | 7.0% | Energy | 7.1% | Health Care | 7.4% | Consumer Discretionary | 8.6% | Industrials | 11.8% | Financials | 14.4% | Information Technology | 32.2% | Other | 3.5% | Portfolio Composition (as a % of Net Assets)Table SummaryCommon Stocks | 97.8% |
|---|
Purchased Options | 0.7% |
|---|
Investment in Affiliates | 1.6% |
|---|
|
| Largest Holdings [Text Block] |
Top 10 Holdings(as a % of Net Assets) Table SummaryAlphabet, Inc., Class C | 6.0% |
|---|
NVIDIA Corp. | 5.9% |
|---|
Apple, Inc. | 5.9% |
|---|
Phillips 66 | 5.4% |
|---|
Cisco Systems, Inc. | 4.6% |
|---|
Microsoft Corp. | 4.3% |
|---|
Morgan Stanley | 4.2% |
|---|
Amazon.com, Inc. | 3.9% |
|---|
Broadcom, Inc. | 3.6% |
|---|
Truist Financial Corp. | 3.4% |
|---|
|
| Material Fund Change [Text Block] |
There were no material fund changes during the reporting period. |
| C000223874 |
|
| Shareholder Report [Line Items] |
|
| Fund Name |
Hedged Equity Income Fund
|
| Class Name |
Institutional Shares
|
| Trading Symbol |
AILIX
|
| Annual or Semi-Annual Statement [Text Block] |
Annual Shareholder Report
|
| Additional Information [Text Block] |
You can find additional information about the Fund at https://www.cavanalhillfunds.com/literature/mutual-fund-literature/. You can also request this information by contacting us at 1-800-762-7085.
|
| Additional Information Phone Number |
1-800-762-7085
|
| Additional Information Website |
https://www.cavanalhillfunds.com/literature/mutual-fund-literature/.
|
| Expenses [Text Block] |
What were the Fund's costs for the last year?(based on a $10,000 investment) Table SummaryClass name | Costs of a $10,000
investment | Costs paid as a percentage of a
$10,000 investment |
|---|
Institutional Shares | $116 | 1.10% |
|---|
|
| Expenses Paid, Amount |
$ 116
|
| Expense Ratio, Percent |
1.10%
|
| Factors Affecting Performance [Text Block] |
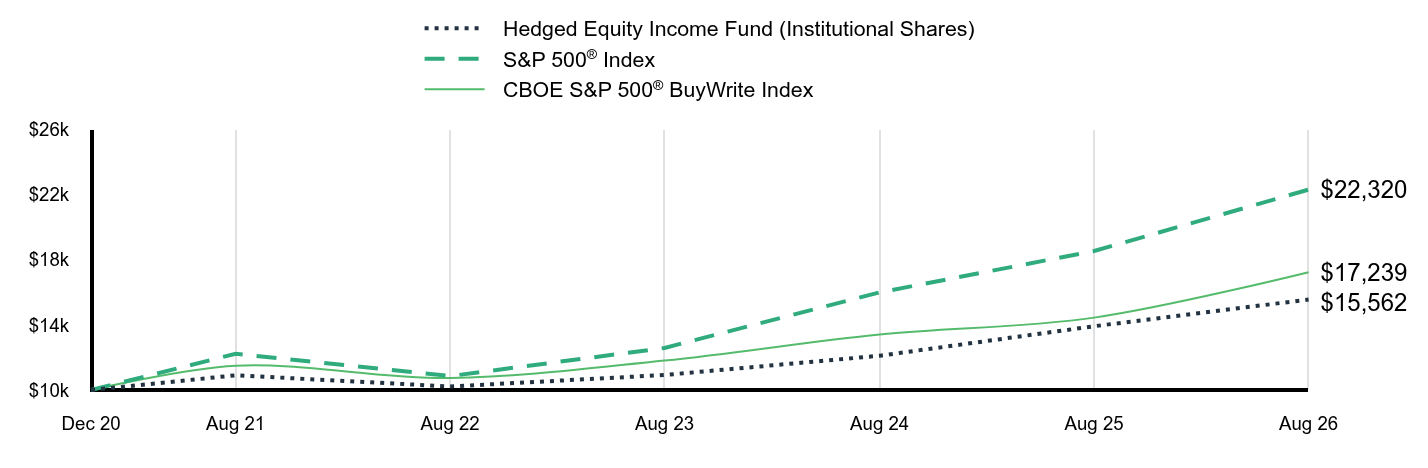
How did the Fund perform last year?Our options overlay balances risk and reward. The Fund’s put options lower volatility relative to the broader market while our disciplined approach to call writing helps preserve upside capture during rallies. The Fund underperformed its benchmark by more than 700 basis points. The Fund tends to underweight the low-yielding information technology (IT) sector because of our mandate to generate meaningful dividend income. This detracted, particularly during the second quarter of 2026, when IT stocks returned more than 40%, vastly outperforming the S&P 500 Index and our benchmark. Performance benefited from stock picking in the IT and consumer discretionary sectors, while stock picking in the energy, communication services, and financials sectors detracted. We believe markets and the economy are at a crossroads. Longer term, the AI capital expenditure supercycle should continue to support economic growth, particularly in the U.S. In the near term, however, a major risk looms as oil prices and general inflation trend higher as a result of the war in Iran. As such, the Fund’s positioning reflects a relatively neutral outlook. |
| Performance Past Does Not Indicate Future [Text] |
The performance data quoted represents past performance and does not guarantee future results
|
| Line Graph [Table Text Block] |
Table Summary | Hedged Equity Income Fund (Institutional Shares) | S&P 500® Index | CBOE S&P 500® BuyWrite Index |
|---|
Dec 20 | $10,000 | $10,000 | $10,000 |
|---|
Aug 21 | $10,904 | $12,227 | $11,494 |
|---|
Aug 22 | $10,216 | $10,855 | $10,735 |
|---|
Aug 23 | $10,923 | $12,585 | $11,812 |
|---|
Aug 24 | $12,106 | $16,000 | $13,413 |
|---|
Aug 25 | $13,921 | $18,541 | $14,449 |
|---|
Aug 26 | $15,562 | $22,320 | $17,239 |
|---|
|
| Average Annual Return [Table Text Block] |
Table Summary | 1 Year | 5 Year | Since Inception |
|---|
Institutional Shares | 11.78% | 7.37% | 8.11% |
|---|
S&P 500® Index | 20.38% | 12.79% | 15.20% |
|---|
CBOE S&P 500® BuyWrite Index | 19.31% | 8.45% | 10.07% |
|---|
|
| AssetsNet |
$ 34,072,219
|
| Holdings Count | Holding |
69
|
| Advisory Fees Paid, Amount |
$ 157,938
|
| InvestmentCompanyPortfolioTurnover |
41.00%
|
| Additional Fund Statistics [Text Block] |
Table SummaryNet Assets | $34,072,219 |
|---|
Number of Portfolio Holdings | 69 |
|---|
Net Investment Advisory Fees | $157,938 |
|---|
Portfolio Turnover Rate | 41% |
|---|
|
| Holdings [Text Block] |
Sector Allocation(as a % of Net Assets) Table SummaryValue | Value |
|---|
Materials | 2.6% | Consumer Staples | 4.8% | Communication Services | 7.0% | Energy | 7.1% | Health Care | 7.4% | Consumer Discretionary | 8.6% | Industrials | 11.8% | Financials | 14.4% | Information Technology | 32.2% | Other | 3.5% | Portfolio Composition (as a % of Net Assets)Table SummaryCommon Stocks | 97.8% |
|---|
Purchased Options | 0.7% |
|---|
Investment in Affiliates | 1.6% |
|---|
|
| Largest Holdings [Text Block] |
Top 10 Holdings(as a % of Net Assets) Table SummaryAlphabet, Inc., Class C | 6.0% |
|---|
NVIDIA Corp. | 5.9% |
|---|
Apple, Inc. | 5.9% |
|---|
Phillips 66 | 5.4% |
|---|
Cisco Systems, Inc. | 4.6% |
|---|
Microsoft Corp. | 4.3% |
|---|
Morgan Stanley | 4.2% |
|---|
Amazon.com, Inc. | 3.9% |
|---|
Broadcom, Inc. | 3.6% |
|---|
Truist Financial Corp. | 3.4% |
|---|
|
| Material Fund Change [Text Block] |
There were no material fund changes during the reporting period. |
| C000223872 |
|
| Shareholder Report [Line Items] |
|
| Fund Name |
Hedged Equity Income Fund
|
| Class Name |
Investor Shares
|
| Trading Symbol |
APLIX
|
| Annual or Semi-Annual Statement [Text Block] |
Annual Shareholder Report
|
| Additional Information [Text Block] |
You can find additional information about the Fund at https://www.cavanalhillfunds.com/literature/mutual-fund-literature/. You can also request this information by contacting us at 1-800-762-7085.
|
| Additional Information Phone Number |
1-800-762-7085
|
| Additional Information Website |
https://www.cavanalhillfunds.com/literature/mutual-fund-literature/.
|
| Expenses [Text Block] |
What were the Fund's costs for the last year?(based on a $10,000 investment) Table SummaryClass name | Costs of a $10,000
investment | Costs paid as a percentage of a
$10,000 investment |
|---|
Investor Shares | $143 | 1.35% |
|---|
|
| Expenses Paid, Amount |
$ 143
|
| Expense Ratio, Percent |
1.35%
|
| Factors Affecting Performance [Text Block] |
How did the Fund perform last year?Our options overlay balances risk and reward. The Fund’s put options lower volatility relative to the broader market while our disciplined approach to call writing helps preserve upside capture during rallies. The Fund underperformed its benchmark by more than 700 basis points. The Fund tends to underweight the low-yielding information technology (IT) sector because of our mandate to generate meaningful dividend income. This detracted, particularly during the second quarter of 2026, when IT stocks returned more than 40%, vastly outperforming the S&P 500 Index and our benchmark. Performance benefited from stock picking in the IT and consumer discretionary sectors, while stock picking in the energy, communication services, and financials sectors detracted. We believe markets and the economy are at a crossroads. Longer term, the AI capital expenditure supercycle should continue to support economic growth, particularly in the U.S. In the near term, however, a major risk looms as oil prices and general inflation trend higher as a result of the war in Iran. As such, the Fund’s positioning reflects a relatively neutral outlook. |
| Performance Past Does Not Indicate Future [Text] |
The performance data quoted represents past performance and does not guarantee future results
|
| Line Graph [Table Text Block] |
Table Summary | Hedged Equity Income Fund (Investor Shares) | S&P 500® Index | CBOE S&P 500® BuyWrite Index |
|---|
Dec 20 | $10,000 | $10,000 | $10,000 |
|---|
Aug 21 | $10,879 | $12,227 | $11,494 |
|---|
Aug 22 | $10,176 | $10,855 | $10,735 |
|---|
Aug 23 | $10,848 | $12,585 | $11,812 |
|---|
Aug 24 | $11,993 | $16,000 | $13,413 |
|---|
Aug 25 | $13,757 | $18,541 | $14,449 |
|---|
Aug 26 | $15,352 | $22,320 | $17,239 |
|---|
|
| Average Annual Return [Table Text Block] |
Table Summary | 1 Year | 5 Year | Since Inception |
|---|
Investor Shares | 11.60% | 7.13% | 7.85% |
|---|
S&P 500® Index | 20.38% | 12.79% | 15.20% |
|---|
CBOE S&P 500® BuyWrite Index | 19.31% | 8.45% | 10.07% |
|---|
|
| AssetsNet |
$ 34,072,219
|
| Holdings Count | Holding |
69
|
| Advisory Fees Paid, Amount |
$ 157,938
|
| InvestmentCompanyPortfolioTurnover |
41.00%
|
| Additional Fund Statistics [Text Block] |
Table SummaryNet Assets | $34,072,219 |
|---|
Number of Portfolio Holdings | 69 |
|---|
Net Investment Advisory Fees | $157,938 |
|---|
Portfolio Turnover Rate | 41% |
|---|
|
| Holdings [Text Block] |
Sector Allocation(as a % of Net Assets) Table SummaryValue | Value |
|---|
Materials | 2.6% | Consumer Staples | 4.8% | Communication Services | 7.0% | Energy | 7.1% | Health Care | 7.4% | Consumer Discretionary | 8.6% | Industrials | 11.8% | Financials | 14.4% | Information Technology | 32.2% | Other | 3.5% | Portfolio Composition (as a % of Net Assets)Table SummaryCommon Stocks | 97.8% |
|---|
Purchased Options | 0.7% |
|---|
Investment in Affiliates | 1.6% |
|---|
|
| Largest Holdings [Text Block] |
Top 10 Holdings(as a % of Net Assets) Table SummaryAlphabet, Inc., Class C | 6.0% |
|---|
NVIDIA Corp. | 5.9% |
|---|
Apple, Inc. | 5.9% |
|---|
Phillips 66 | 5.4% |
|---|
Cisco Systems, Inc. | 4.6% |
|---|
Microsoft Corp. | 4.3% |
|---|
Morgan Stanley | 4.2% |
|---|
Amazon.com, Inc. | 3.9% |
|---|
Broadcom, Inc. | 3.6% |
|---|
Truist Financial Corp. | 3.4% |
|---|
|
| Material Fund Change [Text Block] |
There were no material fund changes during the reporting period. |
| C000102307 |
|
| Shareholder Report [Line Items] |
|
| Fund Name |
Limited Duration Fund
|
| Class Name |
A Shares
|
| Trading Symbol |
AASTX
|
| Annual or Semi-Annual Statement [Text Block] |
Annual Shareholder Report
|
| Additional Information [Text Block] |
You can find additional information about the Fund at https://www.cavanalhillfunds.com/literature/mutual-fund-literature/. You can also request this information by contacting us at 1-800-762-7085.
|
| Additional Information Phone Number |
1-800-762-7085
|
| Additional Information Website |
https://www.cavanalhillfunds.com/literature/mutual-fund-literature/.
|
| Expenses [Text Block] |
What were the Fund's costs for the last year?(based on a $10,000 investment) Table SummaryClass name | Costs of a $10,000
investment | Costs paid as a percentage of a
$10,000 investment |
|---|
A Shares | $76 | 0.75% |
|---|
|
| Expenses Paid, Amount |
$ 76
|
| Expense Ratio, Percent |
0.75%
|
| Factors Affecting Performance [Text Block] |
How did the Fund perform last year?The Fund’s duration was slightly higher than its benchmark for most of the year, allowing it to drift naturally toward a lower target rather than through active shifts. We favored mortgage-backed securities (MBS) and asset-backed securities (ABS) over U.S. Treasuries and agencies. The goal was to capture excess yield on widened spreads in mortgage and securitized markets. The Fund outperformed its benchmark. The main contributor was sector allocation, specifically an underweight to government securities plus an overweight to MBS and ABS. Spreads on agency MBS tightened significantly during the year. However, longer-than-benchmark portfolio duration, particularly longer-dated Treasuries, detracted from performance as markets began to anticipate higher rates. This strategy’s focus is to avoid adding duration. Being close to the benchmark is acceptable, combined with allowing for duration to drift lower naturally over time. We continue to hold overweights toward securitized products as we see more room for spreads there to tighten. We’re watching corporate credit exposure as we seek opportunities to add exposure. |
| Performance Past Does Not Indicate Future [Text] |
The performance data quoted represents past performance and does not guarantee future results
|
| Line Graph [Table Text Block] |
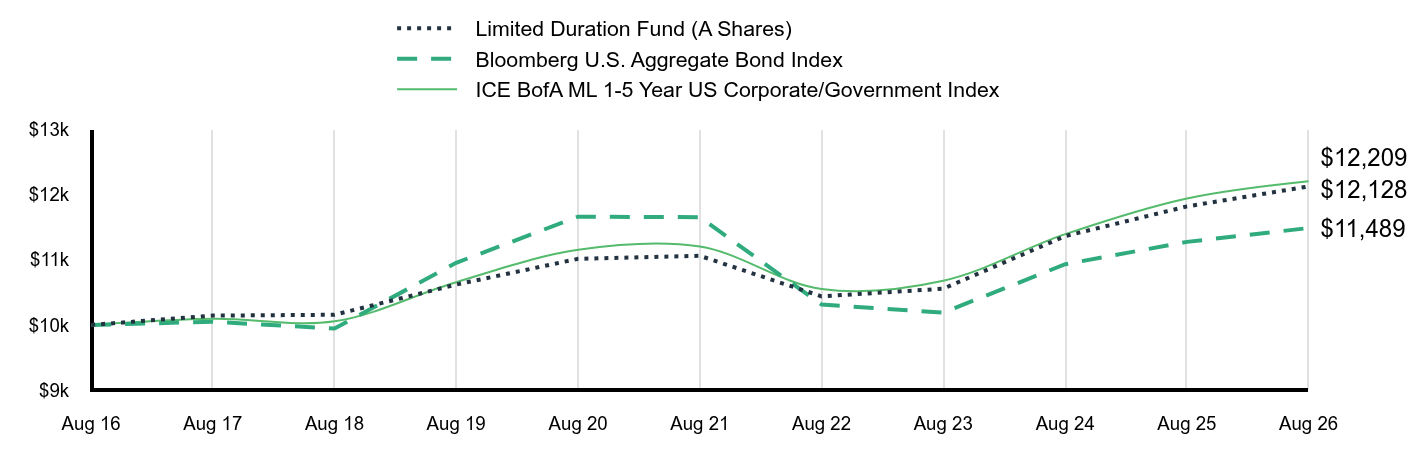
Table Summary | Limited Duration Fund (A Shares) | Bloomberg U.S. Aggregate Bond Index | ICE BofA ML 1-5 Year US Corporate/Government Index |
|---|
Aug 16 | $10,000 | $10,000 | $10,000 |
|---|
Aug 17 | $10,143 | $10,049 | $10,093 |
|---|
Aug 18 | $10,156 | $9,944 | $10,055 |
|---|
Aug 19 | $10,620 | $10,955 | $10,657 |
|---|
Aug 20 | $11,016 | $11,664 | $11,154 |
|---|
Aug 21 | $11,062 | $11,655 | $11,204 |
|---|
Aug 22 | $10,439 | $10,313 | $10,552 |
|---|
Aug 23 | $10,557 | $10,189 | $10,679 |
|---|
Aug 24 | $11,365 | $10,933 | $11,395 |
|---|
Aug 25 | $11,821 | $11,276 | $11,944 |
|---|
Aug 26 | $12,128 | $11,489 | $12,209 |
|---|
|
| Average Annual Return [Table Text Block] |
Table Summary | 1 Year | 5 Year | 10 Year |
|---|
A Shares | 2.59% | 1.86% | 1.95% |
|---|
Bloomberg U.S. Aggregate Bond Index | 1.89% | -0.29% | 1.40% |
|---|
ICE BofA ML 1-5 Year US Corporate/Government Index | 2.22% | 1.73% | 2.02% |
|---|
|
| AssetsNet |
$ 22,054,060
|
| Holdings Count | Holding |
112
|
| Advisory Fees Paid, Amount |
$ (101,870)
|
| InvestmentCompanyPortfolioTurnover |
50.00%
|
| Additional Fund Statistics [Text Block] |
Table SummaryNet Assets | $22,054,060 |
|---|
Number of Portfolio Holdings | 112 |
|---|
Net Investment Advisory Fees | $(101,870) |
|---|
Portfolio Turnover Rate | 50% |
|---|
|
| Holdings [Text Block] |
Credit Rating(as a % of Net Assets) Table SummaryValue | Value |
|---|
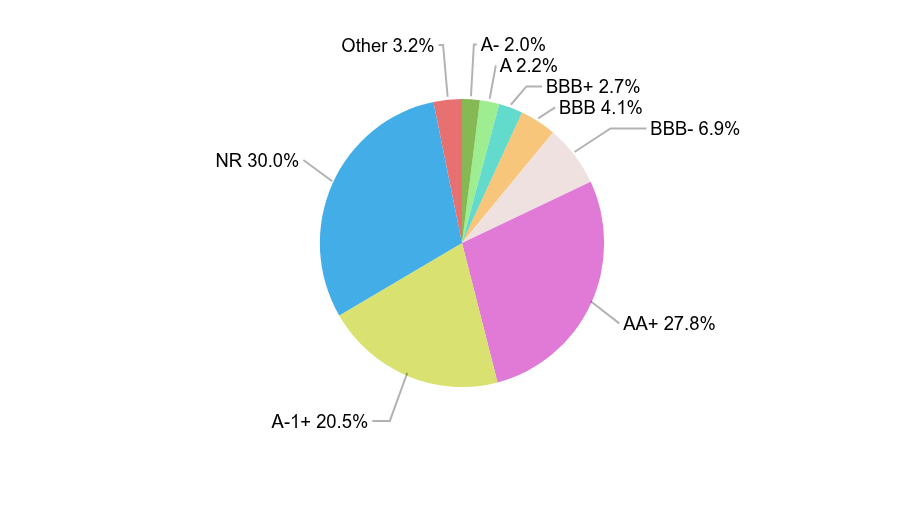
A- | 2.0% | A | 2.2% | BBB+ | 2.7% | BBB | 4.1% | BBB- | 6.9% | AA+ | 27.8% | A-1+ | 20.5% | NR | 30.0% | Other | 3.2% | Portfolio Composition (as a % of Net Assets)Table SummaryAsset-Backed Securities | 18.5% |
|---|
Mortgage-Backed Securities | 44.3% |
|---|
Commercial Mortgage-Backed Securities | 1.5% |
|---|
Corporate Bonds | 16.5% |
|---|
U.S. Government Agency Securities | 2.3% |
|---|
U.S. Treasury Obligations | 13.9% |
|---|
Investment in Affiliates | 2.4% |
|---|
|
| Largest Holdings [Text Block] |
Top 10 Holdings(as a % of Net Assets) Table SummaryU.S. Treasury Notes | 4.0% |
|---|
Truist Financial Corp., Series N | 3.6% |
|---|
U.S. Treasury Notes | 3.4% |
|---|
Goodgreen Trust, Series 2020-1A, Class A | 3.3% |
|---|
JPMorgan Mortgage Trust, Series 2024-CCM1, Class A3 | 2.9% |
|---|
BAT Capital Corp. | 2.7% |
|---|
Zaxbys Funding LLC, Series 2021-1A, Class A2 | 2.7% |
|---|
HI-FI Music IP Issuer LP, Series 2022-1A, Class A2 | 2.7% |
|---|
AIO Issuer LLC, Series 2024-1A, Class A2 | 2.4% |
|---|
CWABS Asset-Backed Certificates Trust, Series 2007-4, Class A4W | 2.3% |
|---|
|
| Material Fund Change [Text Block] |
There were no material fund changes during the reporting period. |
| C000024286 |
|
| Shareholder Report [Line Items] |
|
| Fund Name |
Limited Duration Fund
|
| Class Name |
Institutional Shares
|
| Trading Symbol |
AISTX
|
| Annual or Semi-Annual Statement [Text Block] |
Annual Shareholder Report
|
| Additional Information [Text Block] |
You can find additional information about the Fund at https://www.cavanalhillfunds.com/literature/mutual-fund-literature/. You can also request this information by contacting us at 1-800-762-7085.
|
| Additional Information Phone Number |
1-800-762-7085
|
| Additional Information Website |
https://www.cavanalhillfunds.com/literature/mutual-fund-literature/.
|
| Expenses [Text Block] |
What were the Fund's costs for the last year?(based on a $10,000 investment) Table SummaryClass name | Costs of a $10,000
investment | Costs paid as a percentage of a
$10,000 investment |
|---|
Institutional Shares | $51 | 0.50% |
|---|
|
| Expenses Paid, Amount |
$ 51
|
| Expense Ratio, Percent |
0.50%
|
| Factors Affecting Performance [Text Block] |
How did the Fund perform last year?The Fund’s duration was slightly higher than its benchmark for most of the year, allowing it to drift naturally toward a lower target rather than through active shifts. We favored mortgage-backed securities (MBS) and asset-backed securities (ABS) over U.S. Treasuries and agencies. The goal was to capture excess yield on widened spreads in mortgage and securitized markets. The Fund outperformed its benchmark. The main contributor was sector allocation, specifically an underweight to government securities plus an overweight to MBS and ABS. Spreads on agency MBS tightened significantly during the year. However, longer-than-benchmark portfolio duration, particularly longer-dated Treasuries, detracted from performance as markets began to anticipate higher rates. This strategy’s focus is to avoid adding duration. Being close to the benchmark is acceptable, combined with allowing for duration to drift lower naturally over time. We continue to hold overweights toward securitized products as we see more room for spreads there to tighten. We’re watching corporate credit exposure as we seek opportunities to add exposure. |
| Performance Past Does Not Indicate Future [Text] |
The performance data quoted represents past performance and does not guarantee future results
|
| Line Graph [Table Text Block] |
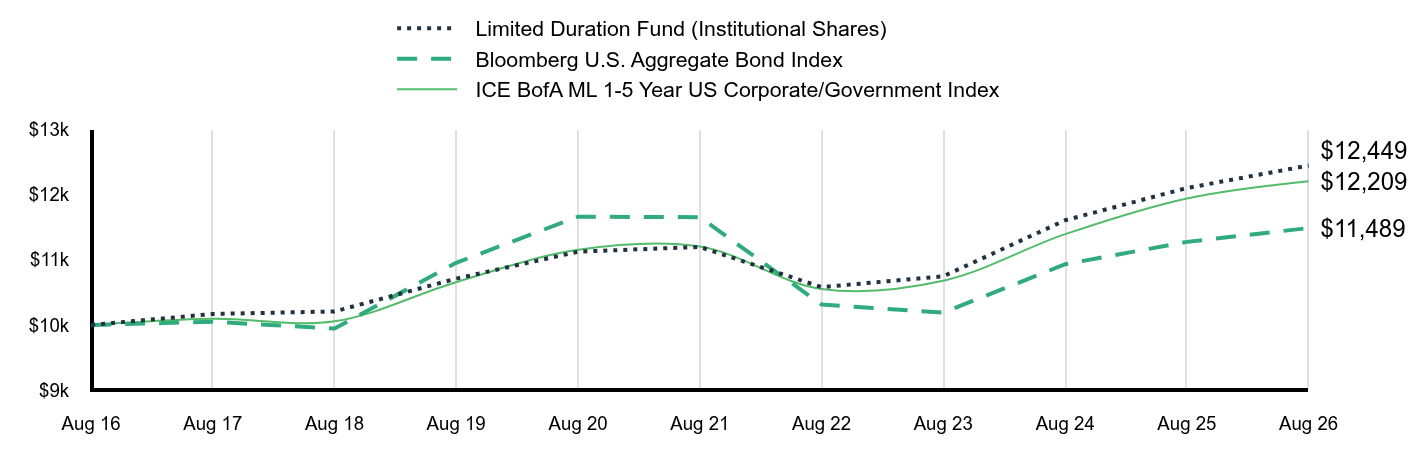
Table Summary | Limited Duration Fund (Institutional Shares) | Bloomberg U.S. Aggregate Bond Index | ICE BofA ML 1-5 Year US Corporate/Government Index |
|---|
Aug 16 | $10,000 | $10,000 | $10,000 |
|---|
Aug 17 | $10,168 | $10,049 | $10,093 |
|---|
Aug 18 | $10,207 | $9,944 | $10,055 |
|---|
Aug 19 | $10,711 | $10,955 | $10,657 |
|---|
Aug 20 | $11,126 | $11,664 | $11,154 |
|---|
Aug 21 | $11,198 | $11,655 | $11,204 |
|---|
Aug 22 | $10,581 | $10,313 | $10,552 |
|---|
Aug 23 | $10,747 | $10,189 | $10,679 |
|---|
Aug 24 | $11,609 | $10,933 | $11,395 |
|---|
Aug 25 | $12,104 | $11,276 | $11,944 |
|---|
Aug 26 | $12,449 | $11,489 | $12,209 |
|---|
|
| Average Annual Return [Table Text Block] |
Table Summary | 1 Year | 5 Year | 10 Year |
|---|
Institutional Shares | 2.85% | 2.14% | 2.21% |
|---|
Bloomberg U.S. Aggregate Bond Index | 1.89% | -0.29% | 1.40% |
|---|
ICE BofA ML 1-5 Year US Corporate/Government Index | 2.22% | 1.73% | 2.02% |
|---|
|
| AssetsNet |
$ 22,054,060
|
| Holdings Count | Holding |
112
|
| Advisory Fees Paid, Amount |
$ (101,870)
|
| InvestmentCompanyPortfolioTurnover |
50.00%
|
| Additional Fund Statistics [Text Block] |
Table SummaryNet Assets | $22,054,060 |
|---|
Number of Portfolio Holdings | 112 |
|---|
Net Investment Advisory Fees | $(101,870) |
|---|
Portfolio Turnover Rate | 50% |
|---|
|
| Holdings [Text Block] |
Credit Rating(as a % of Net Assets) Table SummaryValue | Value |
|---|
A- | 2.0% | A | 2.2% | BBB+ | 2.7% | BBB | 4.1% | BBB- | 6.9% | AA+ | 27.8% | A-1+ | 20.5% | NR | 30.0% | Other | 3.2% | Portfolio Composition (as a % of Net Assets)Table SummaryAsset-Backed Securities | 18.5% |
|---|
Mortgage-Backed Securities | 44.3% |
|---|
Commercial Mortgage-Backed Securities | 1.5% |
|---|
Corporate Bonds | 16.5% |
|---|
U.S. Government Agency Securities | 2.3% |
|---|
U.S. Treasury Obligations | 13.9% |
|---|
Investment in Affiliates | 2.4% |
|---|
|
| Largest Holdings [Text Block] |
Top 10 Holdings(as a % of Net Assets) Table SummaryU.S. Treasury Notes | 4.0% |
|---|
Truist Financial Corp., Series N | 3.6% |
|---|
U.S. Treasury Notes | 3.4% |
|---|
Goodgreen Trust, Series 2020-1A, Class A | 3.3% |
|---|
JPMorgan Mortgage Trust, Series 2024-CCM1, Class A3 | 2.9% |
|---|
BAT Capital Corp. | 2.7% |
|---|
Zaxbys Funding LLC, Series 2021-1A, Class A2 | 2.7% |
|---|
HI-FI Music IP Issuer LP, Series 2022-1A, Class A2 | 2.7% |
|---|
AIO Issuer LLC, Series 2024-1A, Class A2 | 2.4% |
|---|
CWABS Asset-Backed Certificates Trust, Series 2007-4, Class A4W | 2.3% |
|---|
|
| Material Fund Change [Text Block] |
There were no material fund changes during the reporting period. |
| C000024285 |
|
| Shareholder Report [Line Items] |
|
| Fund Name |
Limited Duration Fund
|
| Class Name |
Investor Shares
|
| Trading Symbol |
APSTX
|
| Annual or Semi-Annual Statement [Text Block] |
Annual Shareholder Report
|
| Additional Information [Text Block] |
You can find additional information about the Fund at https://www.cavanalhillfunds.com/literature/mutual-fund-literature/. You can also request this information by contacting us at 1-800-762-7085.
|
| Additional Information Phone Number |
1-800-762-7085
|
| Additional Information Website |
https://www.cavanalhillfunds.com/literature/mutual-fund-literature/.
|
| Expenses [Text Block] |
What were the Fund's costs for the last year?(based on a $10,000 investment) Table SummaryClass name | Costs of a $10,000
investment | Costs paid as a percentage of a
$10,000 investment |
|---|
Investor Shares | $76 | 0.75% |
|---|
|
| Expenses Paid, Amount |
$ 76
|
| Expense Ratio, Percent |
0.75%
|
| Factors Affecting Performance [Text Block] |
How did the Fund perform last year?The Fund’s duration was slightly higher than its benchmark for most of the year, allowing it to drift naturally toward a lower target rather than through active shifts. We favored mortgage-backed securities (MBS) and asset-backed securities (ABS) over U.S. Treasuries and agencies. The goal was to capture excess yield on widened spreads in mortgage and securitized markets. The Fund outperformed its benchmark. The main contributor was sector allocation, specifically an underweight to government securities plus an overweight to MBS and ABS. Spreads on agency MBS tightened significantly during the year. However, longer-than-benchmark portfolio duration, particularly longer-dated Treasuries, detracted from performance as markets began to anticipate higher rates. This strategy’s focus is to avoid adding duration. Being close to the benchmark is acceptable, combined with allowing for duration to drift lower naturally over time. We continue to hold overweights toward securitized products as we see more room for spreads there to tighten. We’re watching corporate credit exposure as we seek opportunities to add exposure. |
| Performance Past Does Not Indicate Future [Text] |
The performance data quoted represents past performance and does not guarantee future results
|
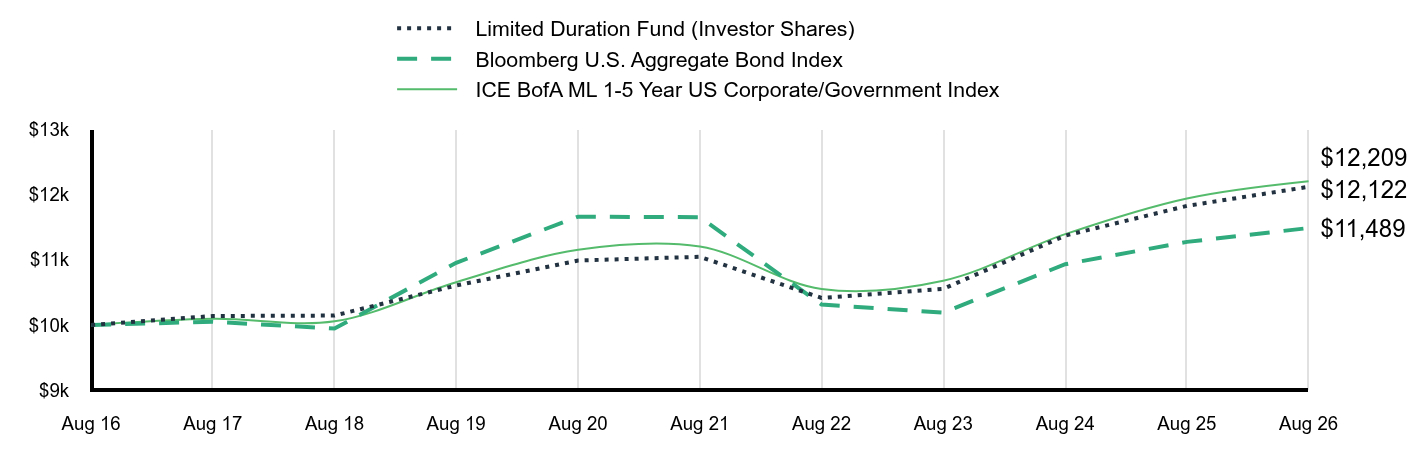
| Line Graph [Table Text Block] |
Table Summary | Limited Duration Fund (Investor Shares) | Bloomberg U.S. Aggregate Bond Index | ICE BofA ML 1-5 Year US Corporate/Government Index |
|---|
Aug 16 | $10,000 | $10,000 | $10,000 |
|---|
Aug 17 | $10,137 | $10,049 | $10,093 |
|---|
Aug 18 | $10,144 | $9,944 | $10,055 |
|---|
Aug 19 | $10,606 | $10,955 | $10,657 |
|---|
Aug 20 | $10,990 | $11,664 | $11,154 |
|---|
Aug 21 | $11,047 | $11,655 | $11,204 |
|---|
Aug 22 | $10,415 | $10,313 | $10,552 |
|---|
Aug 23 | $10,554 | $10,189 | $10,679 |
|---|
Aug 24 | $11,372 | $10,933 | $11,395 |
|---|
Aug 25 | $11,829 | $11,276 | $11,944 |
|---|
Aug 26 | $12,122 | $11,489 | $12,209 |
|---|
|
| Average Annual Return [Table Text Block] |
Table Summary | 1 Year | 5 Year | 10 Year |
|---|
Investor Shares | 2.48% | 1.88% | 1.94% |
|---|
Bloomberg U.S. Aggregate Bond Index | 1.89% | -0.29% | 1.40% |
|---|
ICE BofA ML 1-5 Year US Corporate/Government Index | 2.22% | 1.73% | 2.02% |
|---|
|
| AssetsNet |
$ 22,054,060
|
| Holdings Count | Holding |
112
|
| Advisory Fees Paid, Amount |
$ (101,870)
|
| InvestmentCompanyPortfolioTurnover |
50.00%
|
| Additional Fund Statistics [Text Block] |
Table SummaryNet Assets | $22,054,060 |
|---|
Number of Portfolio Holdings | 112 |
|---|
Net Investment Advisory Fees | $(101,870) |
|---|
Portfolio Turnover Rate | 50% |
|---|
|
| Holdings [Text Block] |
Credit Rating(as a % of Net Assets) Table SummaryValue | Value |
|---|
A- | 2.0% | A | 2.2% | BBB+ | 2.7% | BBB | 4.1% | BBB- | 6.9% | AA+ | 27.8% | A-1+ | 20.5% | NR | 30.0% | Other | 3.2% | Portfolio Composition (as a % of Net Assets)Table SummaryAsset-Backed Securities | 18.5% |
|---|
Mortgage-Backed Securities | 44.3% |
|---|
Commercial Mortgage-Backed Securities | 1.5% |
|---|
Corporate Bonds | 16.5% |
|---|
U.S. Government Agency Securities | 2.3% |
|---|
U.S. Treasury Obligations | 13.9% |
|---|
Investment in Affiliates | 2.4% |
|---|
|
| Largest Holdings [Text Block] |
Top 10 Holdings(as a % of Net Assets) Table SummaryU.S. Treasury Notes | 4.0% |
|---|
Truist Financial Corp., Series N | 3.6% |
|---|
U.S. Treasury Notes | 3.4% |
|---|
Goodgreen Trust, Series 2020-1A, Class A | 3.3% |
|---|
JPMorgan Mortgage Trust, Series 2024-CCM1, Class A3 | 2.9% |
|---|
BAT Capital Corp. | 2.7% |
|---|
Zaxbys Funding LLC, Series 2021-1A, Class A2 | 2.7% |
|---|
HI-FI Music IP Issuer LP, Series 2022-1A, Class A2 | 2.7% |
|---|
AIO Issuer LLC, Series 2024-1A, Class A2 | 2.4% |
|---|
CWABS Asset-Backed Certificates Trust, Series 2007-4, Class A4W | 2.3% |
|---|
|
| Material Fund Change [Text Block] |
There were no material fund changes during the reporting period. |
| C000196700 |
|
| Shareholder Report [Line Items] |
|
| Fund Name |
Strategic Enhanced Yield Fund
|
| Class Name |
A Shares
|
| Trading Symbol |
AAENX
|
| Annual or Semi-Annual Statement [Text Block] |
Annual Shareholder Report
|
| Additional Information [Text Block] |
You can find additional information about the Fund at https://www.cavanalhillfunds.com/literature/mutual-fund-literature/. You can also request this information by contacting us at 1-800-762-7085.
|
| Additional Information Phone Number |
1-800-762-7085
|
| Additional Information Website |
https://www.cavanalhillfunds.com/literature/mutual-fund-literature/.
|
| Expenses [Text Block] |
What were the Fund's costs for the last year?(based on a $10,000 investment) Table SummaryClass name | Costs of a $10,000
investment | Costs paid as a percentage of a
$10,000 investment |
|---|
A Shares | $102 | 1.01% |
|---|
|
| Expenses Paid, Amount |
$ 102
|
| Expense Ratio, Percent |
1.01%
|
| Factors Affecting Performance [Text Block] |
How did the Fund perform last year?We started the period with slightly higher-than-benchmark duration. As the year progressed, we targeted toward a neutral duration. We increased exposure to mortgage-backed securities as credit spreads tightened and we relied on the emerging market debt (EMD) and high yield sectors for additional return. The Fund outperformed the benchmark. Major contributors were the high yield and EMD sectors, whose returns were much higher than the core sectors. High yield and EMD showed significant spread tightening, leading to major price increases. Both sectors contain large exposure to energy securities, which gained from global price increases. EMD benefited from more capital-friendly governments. The Treasury sector experienced significant volatility and was hurt by its long duration positioning. The U.S. economy remains strong, supported by a stable labor market, while inflation is unlikely to ease soon. Rising federal debt and debt-service costs will require greater Treasury issuance, pointing to higher interest rates. Accordingly, the Fund will maintain a slightly shorter duration while retaining exposure to risk sectors. |
| Performance Past Does Not Indicate Future [Text] |
The performance data quoted represents past performance and does not guarantee future results
|
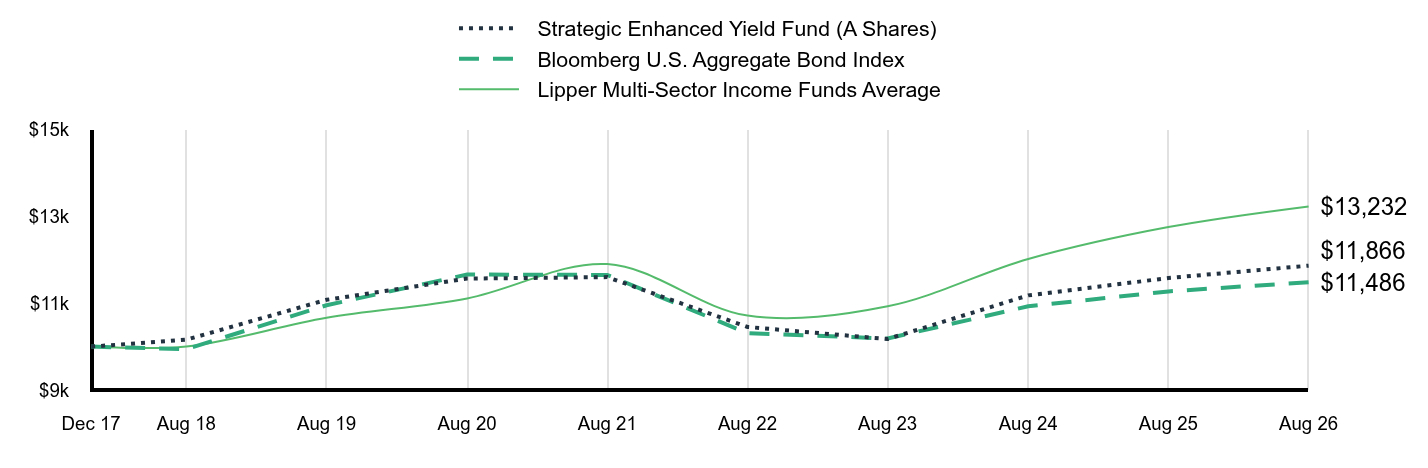
| Line Graph [Table Text Block] |
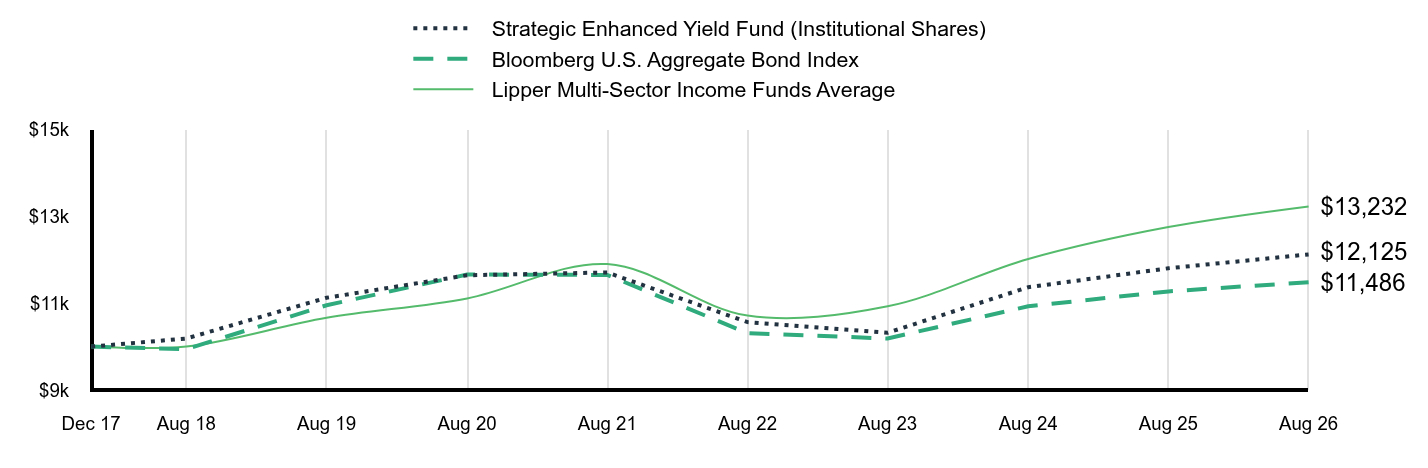
Table Summary | Strategic Enhanced Yield Fund (A Shares) | Bloomberg U.S. Aggregate Bond Index | Lipper Multi-Sector Income Funds Average |
|---|
Dec 17 | $10,000 | $10,000 | $10,000 |
|---|
Aug 18 | $10,160 | $9,941 | $10,003 |
|---|
Aug 19 | $11,079 | $10,953 | $10,665 |
|---|
Aug 20 | $11,568 | $11,662 | $11,111 |
|---|
Aug 21 | $11,602 | $11,652 | $11,903 |
|---|
Aug 22 | $10,453 | $10,310 | $10,715 |
|---|
Aug 23 | $10,175 | $10,187 | $10,930 |
|---|
Aug 24 | $11,181 | $10,930 | $12,020 |
|---|
Aug 25 | $11,582 | $11,273 | $12,756 |
|---|
Aug 26 | $11,866 | $11,486 | $13,232 |
|---|
|
| Average Annual Return [Table Text Block] |
Table Summary | 1 Year | 5 Year | Since Inception |
|---|
A Shares | 2.45% | 0.45% | 1.99% |
|---|
Bloomberg U.S. Aggregate Bond Index | 1.89% | -0.29% | 1.61% |
|---|
Lipper Multi-Sector Income Funds Average | 3.73% | 2.14% | 3.28% |
|---|
|
| AssetsNet |
$ 20,127,421
|
| Holdings Count | Holding |
109
|
| Advisory Fees Paid, Amount |
$ (25,696)
|
| InvestmentCompanyPortfolioTurnover |
67.00%
|
| Additional Fund Statistics [Text Block] |
Table SummaryNet Assets | $20,127,421 |
|---|
Number of Portfolio Holdings | 109 |
|---|
Net Investment Advisory Fees | $(25,696) |
|---|
Portfolio Turnover Rate | 67% |
|---|
|
| Holdings [Text Block] |
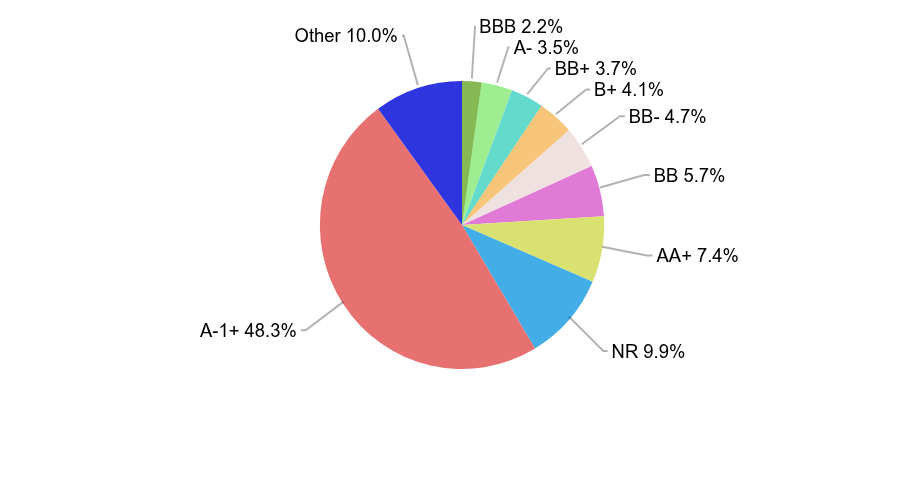
Credit Rating(as a % of Net Assets) Table SummaryValue | Value |
|---|
BBB | 2.2% | A- | 3.5% | BB+ | 3.7% | B+ | 4.1% | BB- | 4.7% | BB | 5.7% | AA+ | 7.4% | NR | 9.9% | A-1+ | 48.3% | Other | 10.0% | Portfolio Composition (as a % of Net Assets)Table SummaryMortgage-Backed Securities | 31.4% |
|---|
Corporate Bonds | 17.4% |
|---|
U.S. Government Agency Securities | 2.7% |
|---|
U.S. Treasury Obligations | 22.5% |
|---|
Yankee Debt Obligations | 22.6% |
|---|
Investment in Affiliates | 2.9% |
|---|
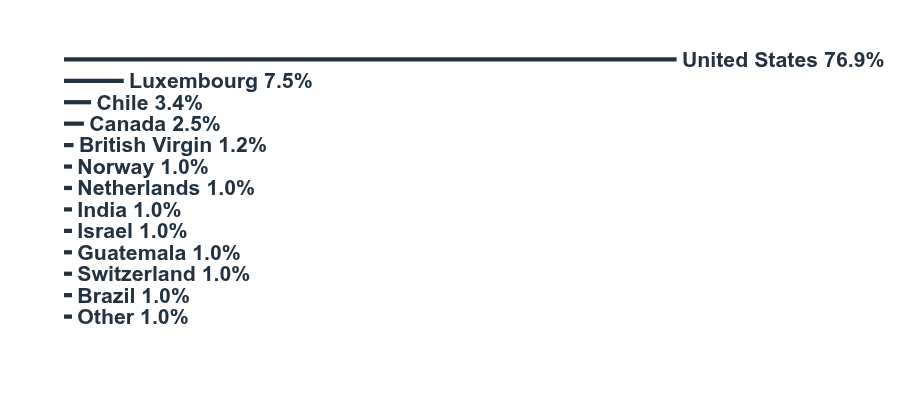
Country Diversification(as a % of Net Assets) Table SummaryValue | Value |
|---|
Other | 1.0% | Brazil | 1.0% | Switzerland | 1.0% | Guatemala | 1.0% | Israel | 1.0% | India | 1.0% | Netherlands | 1.0% | Norway | 1.0% | British Virgin | 1.2% | Canada | 2.5% | Chile | 3.4% | Luxembourg | 7.5% | United States | 76.9% | |
| Largest Holdings [Text Block] |
Top 10 Holdings(as a % of Net Assets) Table SummaryU.S. Treasury Bonds | 3.3% |
|---|
U.S. Treasury Bonds | 2.5% |
|---|
U.S. Treasury Bonds | 2.1% |
|---|
Freddie Mac | 2.0% |
|---|
U.S. Treasury Notes | 2.0% |
|---|
U.S. Treasury Notes | 2.0% |
|---|
U.S. Treasury Notes | 1.9% |
|---|
Brean Asset-Backed Securities Trust, Series 2021-RM1, Class M1 | 1.8% |
|---|
Minerva Luxembourg SA | 1.7% |
|---|
U.S. Treasury Notes | 1.7% |
|---|
|
| Material Fund Change [Text Block] |
There were no material fund changes during the reporting period. |
| C000196701 |
|
| Shareholder Report [Line Items] |
|
| Fund Name |
Strategic Enhanced Yield Fund
|
| Class Name |
Institutional Shares
|
| Trading Symbol |
AIENX
|
| Annual or Semi-Annual Statement [Text Block] |
Annual Shareholder Report
|
| Additional Information [Text Block] |
You can find additional information about the Fund at https://www.cavanalhillfunds.com/literature/mutual-fund-literature/. You can also request this information by contacting us at 1-800-762-7085.
|
| Additional Information Phone Number |
1-800-762-7085
|
| Additional Information Website |
https://www.cavanalhillfunds.com/literature/mutual-fund-literature/.
|
| Expenses [Text Block] |
What were the Fund's costs for the last year?(based on a $10,000 investment) Table SummaryClass name | Costs of a $10,000
investment | Costs paid as a percentage of a
$10,000 investment |
|---|
Institutional Shares | $77 | 0.76% |
|---|
|
| Expenses Paid, Amount |
$ 77
|
| Expense Ratio, Percent |
0.76%
|
| Factors Affecting Performance [Text Block] |
How did the Fund perform last year?We started the period with slightly higher-than-benchmark duration. As the year progressed, we targeted toward a neutral duration. We increased exposure to mortgage-backed securities as credit spreads tightened and we relied on the emerging market debt (EMD) and high yield sectors for additional return. The Fund outperformed the benchmark. Major contributors were the high yield and EMD sectors, whose returns were much higher than the core sectors. High yield and EMD showed significant spread tightening, leading to major price increases. Both sectors contain large exposure to energy securities, which gained from global price increases. EMD benefited from more capital-friendly governments. The Treasury sector experienced significant volatility and was hurt by its long duration positioning. The U.S. economy remains strong, supported by a stable labor market, while inflation is unlikely to ease soon. Rising federal debt and debt-service costs will require greater Treasury issuance, pointing to higher interest rates. Accordingly, the Fund will maintain a slightly shorter duration while retaining exposure to risk sectors. |
| Performance Past Does Not Indicate Future [Text] |
The performance data quoted represents past performance and does not guarantee future results
|
| Line Graph [Table Text Block] |
Table Summary | Strategic Enhanced Yield Fund (Institutional Shares) | Bloomberg U.S. Aggregate Bond Index | Lipper Multi-Sector Income Funds Average |
|---|
Dec 17 | $10,000 | $10,000 | $10,000 |
|---|
Aug 18 | $10,187 | $9,941 | $10,003 |
|---|
Aug 19 | $11,126 | $10,953 | $10,665 |
|---|
Aug 20 | $11,645 | $11,662 | $11,111 |
|---|
Aug 21 | $11,709 | $11,652 | $11,903 |
|---|
Aug 22 | $10,564 | $10,310 | $10,715 |
|---|
Aug 23 | $10,320 | $10,187 | $10,930 |
|---|
Aug 24 | $11,369 | $10,930 | $12,020 |
|---|
Aug 25 | $11,806 | $11,273 | $12,756 |
|---|
Aug 26 | $12,125 | $11,486 | $13,232 |
|---|
|
| Average Annual Return [Table Text Block] |
Table Summary | 1 Year | 5 Year | Since Inception |
|---|
Institutional Shares | 2.70% | 0.70% | 2.25% |
|---|
Bloomberg U.S. Aggregate Bond Index | 1.89% | -0.29% | 1.61% |
|---|
Lipper Multi-Sector Income Funds Average | 3.73% | 2.14% | 3.28% |
|---|
|
| AssetsNet |
$ 20,127,421
|
| Holdings Count | Holding |
109
|
| Advisory Fees Paid, Amount |
$ (25,696)
|
| InvestmentCompanyPortfolioTurnover |
67.00%
|
| Additional Fund Statistics [Text Block] |
Table SummaryNet Assets | $20,127,421 |
|---|
Number of Portfolio Holdings | 109 |
|---|
Net Investment Advisory Fees | $(25,696) |
|---|
Portfolio Turnover Rate | 67% |
|---|
|
| Holdings [Text Block] |
Credit Rating(as a % of Net Assets) Table SummaryValue | Value |
|---|
BBB | 2.2% | A- | 3.5% | BB+ | 3.7% | B+ | 4.1% | BB- | 4.7% | BB | 5.7% | AA+ | 7.4% | NR | 9.9% | A-1+ | 48.3% | Other | 10.0% | Portfolio Composition (as a % of Net Assets)Table SummaryMortgage-Backed Securities | 31.4% |
|---|
Corporate Bonds | 17.4% |
|---|
U.S. Government Agency Securities | 2.7% |
|---|
U.S. Treasury Obligations | 22.5% |
|---|
Yankee Debt Obligations | 22.6% |
|---|
Investment in Affiliates | 2.9% |
|---|
Country Diversification(as a % of Net Assets) Table SummaryValue | Value |
|---|
Other | 1.0% | Brazil | 1.0% | Switzerland | 1.0% | Guatemala | 1.0% | Israel | 1.0% | India | 1.0% | Netherlands | 1.0% | Norway | 1.0% | British Virgin | 1.2% | Canada | 2.5% | Chile | 3.4% | Luxembourg | 7.5% | United States | 76.9% | |
| Largest Holdings [Text Block] |
Top 10 Holdings(as a % of Net Assets) Table SummaryU.S. Treasury Bonds | 3.3% |
|---|
U.S. Treasury Bonds | 2.5% |
|---|
U.S. Treasury Bonds | 2.1% |
|---|
Freddie Mac | 2.0% |
|---|
U.S. Treasury Notes | 2.0% |
|---|
U.S. Treasury Notes | 2.0% |
|---|
U.S. Treasury Notes | 1.9% |
|---|
Brean Asset-Backed Securities Trust, Series 2021-RM1, Class M1 | 1.8% |
|---|
Minerva Luxembourg SA | 1.7% |
|---|
U.S. Treasury Notes | 1.7% |
|---|
|
| Material Fund Change [Text Block] |
There were no material fund changes during the reporting period. |
| C000196702 |
|
| Shareholder Report [Line Items] |
|
| Fund Name |
Strategic Enhanced Yield Fund
|
| Class Name |
Investor Shares
|
| Trading Symbol |
APENX
|
| Annual or Semi-Annual Statement [Text Block] |
Annual Shareholder Report
|
| Additional Information [Text Block] |
You can find additional information about the Fund at https://www.cavanalhillfunds.com/literature/mutual-fund-literature/. You can also request this information by contacting us at 1-800-762-7085.
|
| Additional Information Phone Number |
1-800-762-7085
|
| Additional Information Website |
https://www.cavanalhillfunds.com/literature/mutual-fund-literature/.
|
| Expenses [Text Block] |
What were the Fund's costs for the last year?(based on a $10,000 investment) Table SummaryClass name | Costs of a $10,000
investment | Costs paid as a percentage of a
$10,000 investment |
|---|
Investor Shares | $102 | 1.01% |
|---|
|
| Expenses Paid, Amount |
$ 102
|
| Expense Ratio, Percent |
1.01%
|
| Factors Affecting Performance [Text Block] |
How did the Fund perform last year?We started the period with slightly higher-than-benchmark duration. As the year progressed, we targeted toward a neutral duration. We increased exposure to mortgage-backed securities as credit spreads tightened and we relied on the emerging market debt (EMD) and high yield sectors for additional return. The Fund outperformed the benchmark. Major contributors were the high yield and EMD sectors, whose returns were much higher than the core sectors. High yield and EMD showed significant spread tightening, leading to major price increases. Both sectors contain large exposure to energy securities, which gained from global price increases. EMD benefited from more capital-friendly governments. The Treasury sector experienced significant volatility and was hurt by its long duration positioning. The U.S. economy remains strong, supported by a stable labor market, while inflation is unlikely to ease soon. Rising federal debt and debt-service costs will require greater Treasury issuance, pointing to higher interest rates. Accordingly, the Fund will maintain a slightly shorter duration while retaining exposure to risk sectors. |
| Performance Past Does Not Indicate Future [Text] |
The performance data quoted represents past performance and does not guarantee future results
|
| Line Graph [Table Text Block] |
Table Summary | Strategic Enhanced Yield Fund (Investor Shares) | Bloomberg U.S. Aggregate Bond Index | Lipper Multi-Sector Income Funds Average |
|---|
Dec 17 | $10,000 | $10,000 | $10,000 |
|---|
Aug 18 | $10,205 | $9,941 | $10,003 |
|---|
Aug 19 | $11,120 | $10,953 | $10,665 |
|---|
Aug 20 | $11,617 | $11,662 | $11,111 |
|---|
Aug 21 | $11,643 | $11,652 | $11,903 |
|---|
Aug 22 | $10,487 | $10,310 | $10,715 |
|---|
Aug 23 | $10,204 | $10,187 | $10,930 |
|---|
Aug 24 | $11,219 | $10,930 | $12,020 |
|---|
Aug 25 | $11,622 | $11,273 | $12,756 |
|---|
Aug 26 | $11,896 | $11,486 | $13,232 |
|---|
|
| Average Annual Return [Table Text Block] |
Table Summary | 1 Year | 5 Year | Since Inception |
|---|
Investor Shares | 2.35% | 0.43% | 2.02% |
|---|
Bloomberg U.S. Aggregate Bond Index | 1.89% | -0.29% | 1.61% |
|---|
Lipper Multi-Sector Income Funds Average | 3.73% | 2.14% | 3.28% |
|---|
|
| AssetsNet |
$ 20,127,421
|
| Holdings Count | Holding |
109
|
| Advisory Fees Paid, Amount |
$ (25,696)
|
| InvestmentCompanyPortfolioTurnover |
67.00%
|
| Additional Fund Statistics [Text Block] |
Table SummaryNet Assets | $20,127,421 |
|---|
Number of Portfolio Holdings | 109 |
|---|
Net Investment Advisory Fees | $(25,696) |
|---|
Portfolio Turnover Rate | 67% |
|---|
|
| Holdings [Text Block] |
Credit Rating(as a % of Net Assets) Table SummaryValue | Value |
|---|
BBB | 2.2% | A- | 3.5% | BB+ | 3.7% | B+ | 4.1% | BB- | 4.7% | BB | 5.7% | AA+ | 7.4% | NR | 9.9% | A-1+ | 48.3% | Other | 10.0% | Portfolio Composition (as a % of Net Assets)Table SummaryMortgage-Backed Securities | 31.4% |
|---|
Corporate Bonds | 17.4% |
|---|
U.S. Government Agency Securities | 2.7% |
|---|
U.S. Treasury Obligations | 22.5% |
|---|
Yankee Debt Obligations | 22.6% |
|---|
Investment in Affiliates | 2.9% |
|---|
Country Diversification(as a % of Net Assets) Table SummaryValue | Value |
|---|
Other | 1.0% | Brazil | 1.0% | Switzerland | 1.0% | Guatemala | 1.0% | Israel | 1.0% | India | 1.0% | Netherlands | 1.0% | Norway | 1.0% | British Virgin | 1.2% | Canada | 2.5% | Chile | 3.4% | Luxembourg | 7.5% | United States | 76.9% | |
| Largest Holdings [Text Block] |
Top 10 Holdings(as a % of Net Assets) Table SummaryU.S. Treasury Bonds | 3.3% |
|---|
U.S. Treasury Bonds | 2.5% |
|---|
U.S. Treasury Bonds | 2.1% |
|---|
Freddie Mac | 2.0% |
|---|
U.S. Treasury Notes | 2.0% |
|---|
U.S. Treasury Notes | 2.0% |
|---|
U.S. Treasury Notes | 1.9% |
|---|
Brean Asset-Backed Securities Trust, Series 2021-RM1, Class M1 | 1.8% |
|---|
Minerva Luxembourg SA | 1.7% |
|---|
U.S. Treasury Notes | 1.7% |
|---|
|
| Material Fund Change [Text Block] |
There were no material fund changes during the reporting period. |
| C000041646 |
|
| Shareholder Report [Line Items] |
|
| Fund Name |
U.S. Treasury Fund
|
| Class Name |
Administrative Shares
|
| Trading Symbol |
APGXX
|
| Annual or Semi-Annual Statement [Text Block] |
Annual Shareholder Report
|
| Additional Information [Text Block] |
You can find additional information about the Fund at https://www.cavanalhillfunds.com/literature/mutual-fund-literature/. You can also request this information by contacting us at 1-800-762-7085.
|
| Additional Information Phone Number |
1-800-762-7085
|
| Additional Information Website |
https://www.cavanalhillfunds.com/literature/mutual-fund-literature/.
|
| Expenses [Text Block] |
What were the Fund's costs for the last year?(based on a $10,000 investment) Table SummaryClass name | Costs of a $10,000
investment | Costs paid as a percentage of a
$10,000 investment |
|---|
Administrative Shares | $67 | 0.66% |
|---|
|
| Expenses Paid, Amount |
$ 67
|
| Expense Ratio, Percent |
0.66%
|
| Factors Affecting Performance [Text Block] |
How did the Fund perform last year?During the second quarter of 2026, we became more focused on liquidity and rolling short-term maturities as market dynamics led to increasing yields. We allowed weighted average maturity to decrease naturally. As pressure increased on the Federal Reserve to raise its policy rate, we lowered our overall portfolio duration. The Select shares of our Government Securities Money Market Fund were ranked 43rd percentile by Lipper for the final three months of the period while the Administrative shares of our U.S. Treasury Fund were ranked 86th percentile. Instead of extending duration late in that quarter, we invested in repurchase agreements to position the funds to quickly take advantage of any rate hike. We increased SEC yield by 9 and 5 basis points, respectively, by well-timed adjustments in yield curve positions. Interest rate cuts were priced into the market early in 2026. Purchases made during that period created a slight yield drag. Three more interest rate hikes are priced into the market through 2027, but we still think it is early to extend duration. We are positioned shorter, with more flexibility, than peers. |
| Performance Past Does Not Indicate Future [Text] |
The performance data quoted represents past performance and does not guarantee future results
|
| Line Graph [Table Text Block] |
Table Summary | U.S. Treasury Fund (Administrative Shares) |
|---|
Aug 16 | $10,000 |
|---|
Aug 17 | $10,008 |
|---|
Aug 18 | $10,088 |
|---|
Aug 19 | $10,252 |
|---|
Aug 20 | $10,308 |
|---|
Aug 21 | $10,309 |
|---|
Aug 22 | $10,330 |
|---|
Aug 23 | $10,713 |
|---|
Aug 24 | $11,228 |
|---|
Aug 25 | $11,667 |
|---|
Aug 26 | $12,038 |
|---|
|
| Average Annual Return [Table Text Block] |
Table Summary | 1 Year | 5 Year | 10 Year |
|---|
Administrative Shares | 3.18% | 3.15% | 1.87% |
|---|
|
| AssetsNet |
$ 1,835,349,240
|
| Holdings Count | Holding |
35
|
| Advisory Fees Paid, Amount |
$ 913,858
|
| Additional Fund Statistics [Text Block] |
Table SummaryNet Assets | $1,835,349,240 |
|---|
Number of Portfolio Holdings | 35 |
|---|
Net Investment Advisory Fees | $913,858 |
|---|
|
| Holdings [Text Block] |
Credit Rating(as a % of Net Assets) Table SummaryValue | Value |
|---|
A-1+ | 100.3% | Portfolio Composition (as a % of Net Assets)Table SummaryU.S. Treasury Obligations | 32.1% |
|---|
Repurchase Agreements | 68.2% |
|---|
|
| Largest Holdings [Text Block] |
Top 10 Holdings(as a % of Net Assets) Table SummaryU.S. Treasury Notes | 2.7% |
|---|
U.S. Treasury Bills | 2.4% |
|---|
U.S. Treasury Notes | 2.2% |
|---|
U.S. Treasury Notes | 1.7% |
|---|
U.S. Treasury Notes | 1.4% |
|---|
U.S. Treasury Bills | 1.4% |
|---|
U.S. Treasury Bills | 1.3% |
|---|
U.S. Treasury Bills | 1.1% |
|---|
U.S. Treasury Bills | 1.1% |
|---|
U.S. Treasury Bills | 1.1% |
|---|
|
| Material Fund Change [Text Block] |
There were no material fund changes during the reporting period. |
| C000041645 |
|
| Shareholder Report [Line Items] |
|
| Fund Name |
U.S. Treasury Fund
|
| Class Name |
Institutional Shares
|
| Trading Symbol |
APKXX
|
| Annual or Semi-Annual Statement [Text Block] |
Annual Shareholder Report
|
| Additional Information [Text Block] |
You can find additional information about the Fund at https://www.cavanalhillfunds.com/literature/mutual-fund-literature/. You can also request this information by contacting us at 1-800-762-7085.
|
| Additional Information Phone Number |
1-800-762-7085
|
| Additional Information Website |
https://www.cavanalhillfunds.com/literature/mutual-fund-literature/.
|
| Expenses [Text Block] |
What were the Fund's costs for the last year?(based on a $10,000 investment) Table SummaryClass name | Costs of a $10,000
investment | Costs paid as a percentage of a
$10,000 investment |
|---|
Institutional Shares | $24 | 0.24% |
|---|
|
| Expenses Paid, Amount |
$ 24
|
| Expense Ratio, Percent |
0.24%
|
| Factors Affecting Performance [Text Block] |
How did the Fund perform last year?During the second quarter of 2026, we became more focused on liquidity and rolling short-term maturities as market dynamics led to increasing yields. We allowed weighted average maturity to decrease naturally. As pressure increased on the Federal Reserve to raise its policy rate, we lowered our overall portfolio duration. The Select shares of our Government Securities Money Market Fund were ranked 43rd percentile by Lipper for the final three months of the period while the Administrative shares of our U.S. Treasury Fund were ranked 86th percentile. Instead of extending duration late in that quarter, we invested in repurchase agreements to position the funds to quickly take advantage of any rate hike. We increased SEC yield by 9 and 5 basis points, respectively, by well-timed adjustments in yield curve positions. Interest rate cuts were priced into the market early in 2026. Purchases made during that period created a slight yield drag. Three more interest rate hikes are priced into the market through 2027, but we still think it is early to extend duration. We are positioned shorter, with more flexibility, than peers. |
| Performance Past Does Not Indicate Future [Text] |
The performance data quoted represents past performance and does not guarantee future results
|
| Line Graph [Table Text Block] |
Table Summary | U.S. Treasury Fund (Institutional Shares) |
|---|
Aug 16 | $10,000 |
|---|
Aug 17 | $10,035 |
|---|
Aug 18 | $10,157 |
|---|
Aug 19 | $10,366 |
|---|
Aug 20 | $10,450 |
|---|
Aug 21 | $10,450 |
|---|
Aug 22 | $10,485 |
|---|
Aug 23 | $10,921 |
|---|
Aug 24 | $11,493 |
|---|
Aug 25 | $11,992 |
|---|
Aug 26 | $12,426 |
|---|
|
| Average Annual Return [Table Text Block] |
Table Summary | 1 Year | 5 Year | 10 Year |
|---|
Institutional Shares | 3.61% | 3.52% | 2.20% |
|---|
|
| AssetsNet |
$ 1,835,349,240
|
| Holdings Count | Holding |
35
|
| Advisory Fees Paid, Amount |
$ 913,858
|
| Additional Fund Statistics [Text Block] |
Table SummaryNet Assets | $1,835,349,240 |
|---|
Number of Portfolio Holdings | 35 |
|---|
Net Investment Advisory Fees | $913,858 |
|---|
|
| Holdings [Text Block] |
Credit Rating(as a % of Net Assets) Table SummaryValue | Value |
|---|
A-1+ | 100.3% | Portfolio Composition (as a % of Net Assets)Table SummaryU.S. Treasury Obligations | 32.1% |
|---|
Repurchase Agreements | 68.2% |
|---|
|
| Largest Holdings [Text Block] |
Top 10 Holdings(as a % of Net Assets) Table SummaryU.S. Treasury Notes | 2.7% |
|---|
U.S. Treasury Bills | 2.4% |
|---|
U.S. Treasury Notes | 2.2% |
|---|
U.S. Treasury Notes | 1.7% |
|---|
U.S. Treasury Notes | 1.4% |
|---|
U.S. Treasury Bills | 1.4% |
|---|
U.S. Treasury Bills | 1.3% |
|---|
U.S. Treasury Bills | 1.1% |
|---|
U.S. Treasury Bills | 1.1% |
|---|
U.S. Treasury Bills | 1.1% |
|---|
|
| Material Fund Change [Text Block] |
There were no material fund changes during the reporting period. |
| C000041648 |
|
| Shareholder Report [Line Items] |
|
| Fund Name |
U.S. Treasury Fund
|
| Class Name |
Select Shares
|
| Trading Symbol |
APNXX
|
| Annual or Semi-Annual Statement [Text Block] |
Annual Shareholder Report
|
| Additional Information [Text Block] |
You can find additional information about the Fund at https://www.cavanalhillfunds.com/literature/mutual-fund-literature/. You can also request this information by contacting us at 1-800-762-7085.
|
| Additional Information Phone Number |
1-800-762-7085
|
| Additional Information Website |
https://www.cavanalhillfunds.com/literature/mutual-fund-literature/.
|
| Expenses [Text Block] |
What were the Fund's costs for the last year?(based on a $10,000 investment) Table SummaryClass name | Costs of a $10,000
investment | Costs paid as a percentage of a
$10,000 investment |
|---|
Select Shares | $16 | 0.16% |
|---|
|
| Expenses Paid, Amount |
$ 16
|
| Expense Ratio, Percent |
0.16%
|
| Factors Affecting Performance [Text Block] |
How did the Fund perform last year?During the second quarter of 2026, we became more focused on liquidity and rolling short-term maturities as market dynamics led to increasing yields. We allowed weighted average maturity to decrease naturally. As pressure increased on the Federal Reserve to raise its policy rate, we lowered our overall portfolio duration. The Select shares of our Government Securities Money Market Fund were ranked 43rd percentile by Lipper for the final three months of the period while the Administrative shares of our U.S. Treasury Fund were ranked 86th percentile. Instead of extending duration late in that quarter, we invested in repurchase agreements to position the funds to quickly take advantage of any rate hike. We increased SEC yield by 9 and 5 basis points, respectively, by well-timed adjustments in yield curve positions. Interest rate cuts were priced into the market early in 2026. Purchases made during that period created a slight yield drag. Three more interest rate hikes are priced into the market through 2027, but we still think it is early to extend duration. We are positioned shorter, with more flexibility, than peers. |
| Performance Past Does Not Indicate Future [Text] |
The performance data quoted represents past performance and does not guarantee future results
|
| Line Graph [Table Text Block] |
Table Summary | U.S. Treasury Fund (Select Shares) |
|---|
Dec 17 | $10,000 |
|---|
Aug 18 | $10,099 |
|---|
Aug 19 | $10,315 |
|---|
Aug 20 | $10,406 |
|---|
Aug 21 | $10,406 |
|---|
Aug 22 | $10,445 |
|---|
Aug 23 | $10,887 |
|---|
Aug 24 | $11,467 |
|---|
Aug 25 | $11,975 |
|---|
Aug 26 | $12,417 |
|---|
|
| Average Annual Return [Table Text Block] |
Table Summary | 1 Year | 5 Year | Since Inception |
|---|
Select Shares | 3.70% | 3.60% | 2.53% |
|---|
|
| AssetsNet |
$ 1,835,349,240
|
| Holdings Count | Holding |
35
|
| Advisory Fees Paid, Amount |
$ 913,858
|
| Additional Fund Statistics [Text Block] |
Table SummaryNet Assets | $1,835,349,240 |
|---|
Number of Portfolio Holdings | 35 |
|---|
Net Investment Advisory Fees | $913,858 |
|---|
|
| Holdings [Text Block] |
Credit Rating(as a % of Net Assets) Table SummaryValue | Value |
|---|
A-1+ | 100.3% | Portfolio Composition (as a % of Net Assets)Table SummaryU.S. Treasury Obligations | 32.1% |
|---|
Repurchase Agreements | 68.2% |
|---|
|
| Largest Holdings [Text Block] |
Top 10 Holdings(as a % of Net Assets) Table SummaryU.S. Treasury Notes | 2.7% |
|---|
U.S. Treasury Bills | 2.4% |
|---|
U.S. Treasury Notes | 2.2% |
|---|
U.S. Treasury Notes | 1.7% |
|---|
U.S. Treasury Notes | 1.4% |
|---|
U.S. Treasury Bills | 1.4% |
|---|
U.S. Treasury Bills | 1.3% |
|---|
U.S. Treasury Bills | 1.1% |
|---|
U.S. Treasury Bills | 1.1% |
|---|
U.S. Treasury Bills | 1.1% |
|---|
|
| Material Fund Change [Text Block] |
There were no material fund changes during the reporting period. |
| C000196703 |
|
| Shareholder Report [Line Items] |
|
| Fund Name |
Ultra Short Tax-Free Income Fund
|
| Class Name |
A Shares
|
| Trading Symbol |
AAUSX
|
| Annual or Semi-Annual Statement [Text Block] |
Annual Shareholder Report
|
| Additional Information [Text Block] |
You can find additional information about the Fund at https://www.cavanalhillfunds.com/literature/mutual-fund-literature/. You can also request this information by contacting us at 1-800-762-7085.
|
| Additional Information Phone Number |
1-800-762-7085
|
| Additional Information Website |
https://www.cavanalhillfunds.com/literature/mutual-fund-literature/.
|
| Expenses [Text Block] |
What were the Fund's costs for the last year?(based on a $10,000 investment) Table SummaryClass name | Costs of a $10,000
investment | Costs paid as a percentage of a
$10,000 investment |
|---|
A Shares | $61 | 0.60% |
|---|
|
| Expenses Paid, Amount |
$ 61
|
| Expense Ratio, Percent |
0.60%
|
| Factors Affecting Performance [Text Block] |
How did the Fund perform last year?The Ultra Short Tax-Free Income Fund looked for opportunities to lock in attractive yields in the fixed rate market while maintaining a core position of variable rate demand notes (VRDNs). Final maturities of new fixed positions were shortened to increase liquidity while maintaining yield. VRDN rates increased at the close of the quarter, providing additional yield as fixed positions were unwound. Short duration was effective for performance relative to the benchmark. The Fund outperformed its benchmark, returning 2.45% (institutional shares) for the period ended August 31, 2026, versus 2.36% for Bloomberg 1-Year Municipal Bond Index, primarily because of its shorter-than-benchmark duration. A higher allocation to VRDNs and shortened final maturity of fixed positions served to decrease the Fund’s duration and increase its liquidity. The Fund is closing in the upcoming quarter. We are positioned to offer an attractive tax-free yield while maintaining adequate liquidity as funds exit the strategy. |
| Performance Past Does Not Indicate Future [Text] |
The performance data quoted represents past performance and does not guarantee future results
|
| Line Graph [Table Text Block] |
Table Summary | Ultra Short Tax-Free Income Fund (A Shares) | Bloomberg Municipal Bond Index | Bloomberg 1-Year Municipal Bond Index |
|---|
Dec 17 | $10,000 | $10,000 | $10,000 |
|---|
Aug 18 | $10,010 | $10,064 | $10,109 |
|---|
Aug 19 | $10,046 | $10,942 | $10,378 |
|---|
Aug 20 | $10,111 | $11,296 | $10,580 |
|---|
Aug 21 | $10,081 | $11,680 | $10,646 |
|---|
Aug 22 | $9,995 | $10,671 | $10,477 |
|---|
Aug 23 | $10,232 | $10,853 | $10,669 |
|---|
Aug 24 | $10,573 | $11,514 | $11,117 |
|---|
Aug 25 | $10,866 | $11,523 | $11,480 |
|---|
Aug 26 | $11,104 | $11,998 | $11,750 |
|---|
|
| Average Annual Return [Table Text Block] |
Table Summary | 1 Year | 5 Year | Since Inception |
|---|
A Shares | 2.19% | 1.95% | 1.21% |
|---|
Bloomberg Municipal Bond Index | 4.12% | 0.54% | 2.12% |
|---|
Bloomberg 1-Year Municipal Bond Index | 2.36% | 1.99% | 1.88% |
|---|
|
| AssetsNet |
$ 3,725,596
|
| Holdings Count | Holding |
15
|
| Advisory Fees Paid, Amount |
$ (116,113)
|
| InvestmentCompanyPortfolioTurnover |
177.00%
|
| Additional Fund Statistics [Text Block] |
Table SummaryNet Assets | $3,725,596 |
|---|
Number of Portfolio Holdings | 15 |
|---|
Net Investment Advisory Fees | $(116,113) |
|---|
Portfolio Turnover Rate | 177% |
|---|
|
| Holdings [Text Block] |
Credit Rating(as a % of Net Assets) Table SummaryValue | Value |
|---|
AA | 5.2% | AA+ | 6.6% | A-1 | 13.5% | A-1+ | 12.1% | NR | 62.6% | Portfolio Composition (as a % of Net Assets)Table SummaryMunicipal Bonds | 64.3% |
|---|
Investment in Affiliates | 35.7% |
|---|
|
| Largest Holdings [Text Block] |
Top 10 Holdings(as a % of Net Assets) Table SummaryCity of New York NY, GO, Series L-4 | 5.4% |
|---|
County of Lincoln WY Revenue, Series E | 5.4% |
|---|
Montgomery County Public Building Authority Revenue | 5.4% |
|---|
Iowa Finance Authority Revenue, Series S | 5.4% |
|---|
Illinois Finance Authority Revenue, Series B | 5.4% |
|---|
Idaho Health Facilities Authority Revenue, Series C | 5.4% |
|---|
The Public Building Authority of Blount County Tennessee Revenue, Series D-3-A | 5.4% |
|---|
Clarksville Public Building Authority Revenue, Series PO | 5.3% |
|---|
State of Kansas Department of Transportation Revenue, Series A | 5.2% |
|---|
Mississippi Business Finance Corp. Revenue, Series G | 4.0% |
|---|
|
| Material Fund Change [Text Block] |
On July 30, 2026, the Board of Trustees of the Funds approved a plan to liquidate and terminate the Ultra Short Tax-Free Income Fund. |
| C000196704 |
|
| Shareholder Report [Line Items] |
|
| Fund Name |
Ultra Short Tax-Free Income Fund
|
| Class Name |
Institutional Shares
|
| Trading Symbol |
AIUSX
|
| Annual or Semi-Annual Statement [Text Block] |
Annual Shareholder Report
|
| Additional Information [Text Block] |
You can find additional information about the Fund at https://www.cavanalhillfunds.com/literature/mutual-fund-literature/. You can also request this information by contacting us at 1-800-762-7085.
|
| Additional Information Phone Number |
1-800-762-7085
|
| Additional Information Website |
https://www.cavanalhillfunds.com/literature/mutual-fund-literature/.
|
| Expenses [Text Block] |
What were the Fund's costs for the last year?(based on a $10,000 investment) Table SummaryClass name | Costs of a $10,000
investment | Costs paid as a percentage of a
$10,000 investment |
|---|
Institutional Shares | $35 | 0.35% |
|---|
|
| Expenses Paid, Amount |
$ 35
|
| Expense Ratio, Percent |
0.35%
|
| Factors Affecting Performance [Text Block] |
How did the Fund perform last year?The Ultra Short Tax-Free Income Fund looked for opportunities to lock in attractive yields in the fixed rate market while maintaining a core position of variable rate demand notes (VRDNs). Final maturities of new fixed positions were shortened to increase liquidity while maintaining yield. VRDN rates increased at the close of the quarter, providing additional yield as fixed positions were unwound. Short duration was effective for performance relative to the benchmark. The Fund outperformed its benchmark, returning 2.45% (institutional shares) for the period ended August 31, 2026, versus 2.36% for Bloomberg 1-Year Municipal Bond Index, primarily because of its shorter-than-benchmark duration. A higher allocation to VRDNs and shortened final maturity of fixed positions served to decrease the Fund’s duration and increase its liquidity. The Fund is closing in the upcoming quarter. We are positioned to offer an attractive tax-free yield while maintaining adequate liquidity as funds exit the strategy. |
| Performance Past Does Not Indicate Future [Text] |
The performance data quoted represents past performance and does not guarantee future results
|
| Line Graph [Table Text Block] |
Table Summary | Ultra Short Tax-Free Income Fund (Institutional Shares) | Bloomberg Municipal Bond Index | Bloomberg 1-Year Municipal Bond Index |
|---|
Dec 17 | $10,000 | $10,000 | $10,000 |
|---|
Aug 18 | $10,065 | $10,064 | $10,109 |
|---|
Aug 19 | $10,217 | $10,942 | $10,378 |
|---|
Aug 20 | $10,307 | $11,296 | $10,580 |
|---|
Aug 21 | $10,308 | $11,680 | $10,646 |
|---|
Aug 22 | $10,231 | $10,671 | $10,477 |
|---|
Aug 23 | $10,500 | $10,853 | $10,669 |
|---|
Aug 24 | $10,876 | $11,514 | $11,117 |
|---|
Aug 25 | $11,206 | $11,523 | $11,480 |
|---|
Aug 26 | $11,480 | $11,998 | $11,750 |
|---|
|
| Average Annual Return [Table Text Block] |
Table Summary | 1 Year | 5 Year | Since Inception |
|---|
Institutional Shares | 2.45% | 2.18% | 1.60% |
|---|
Bloomberg Municipal Bond Index | 4.12% | 0.54% | 2.12% |
|---|
Bloomberg 1-Year Municipal Bond Index | 2.36% | 1.99% | 1.88% |
|---|
|
| AssetsNet |
$ 3,725,596
|
| Holdings Count | Holding |
15
|
| Advisory Fees Paid, Amount |
$ (116,113)
|
| InvestmentCompanyPortfolioTurnover |
177.00%
|
| Additional Fund Statistics [Text Block] |
Table SummaryNet Assets | $3,725,596 |
|---|
Number of Portfolio Holdings | 15 |
|---|
Net Investment Advisory Fees | $(116,113) |
|---|
Portfolio Turnover Rate | 177% |
|---|
|
| Holdings [Text Block] |
Credit Rating(as a % of Net Assets) Table SummaryValue | Value |
|---|
AA | 5.2% | AA+ | 6.6% | A-1 | 13.5% | A-1+ | 12.1% | NR | 62.6% | Portfolio Composition (as a % of Net Assets)Table SummaryMunicipal Bonds | 64.3% |
|---|
Investment in Affiliates | 35.7% |
|---|
|
| Largest Holdings [Text Block] |
Top 10 Holdings(as a % of Net Assets) Table SummaryCity of New York NY, GO, Series L-4 | 5.4% |
|---|
County of Lincoln WY Revenue, Series E | 5.4% |
|---|
Montgomery County Public Building Authority Revenue | 5.4% |
|---|
Iowa Finance Authority Revenue, Series S | 5.4% |
|---|
Illinois Finance Authority Revenue, Series B | 5.4% |
|---|
Idaho Health Facilities Authority Revenue, Series C | 5.4% |
|---|
The Public Building Authority of Blount County Tennessee Revenue, Series D-3-A | 5.4% |
|---|
Clarksville Public Building Authority Revenue, Series PO | 5.3% |
|---|
State of Kansas Department of Transportation Revenue, Series A | 5.2% |
|---|
Mississippi Business Finance Corp. Revenue, Series G | 4.0% |
|---|
|
| Material Fund Change [Text Block] |
On July 30, 2026, the Board of Trustees of the Funds approved a plan to liquidate and terminate the Ultra Short Tax-Free Income Fund. |
| C000196705 |
|
| Shareholder Report [Line Items] |
|
| Fund Name |
Ultra Short Tax-Free Income Fund
|
| Class Name |
Investor Shares
|
| Trading Symbol |
APUSX
|
| Annual or Semi-Annual Statement [Text Block] |
Annual Shareholder Report
|
| Additional Information [Text Block] |
You can find additional information about the Fund at https://www.cavanalhillfunds.com/literature/mutual-fund-literature/. You can also request this information by contacting us at 1-800-762-7085.
|
| Additional Information Phone Number |
1-800-762-7085
|
| Additional Information Website |
https://www.cavanalhillfunds.com/literature/mutual-fund-literature/.
|
| Expenses [Text Block] |
What were the Fund's costs for the last year?(based on a $10,000 investment) Table SummaryClass name | Costs of a $10,000
investment | Costs paid as a percentage of a
$10,000 investment |
|---|
Investor Shares | $61 | 0.60% |
|---|
|
| Expenses Paid, Amount |
$ 61
|
| Expense Ratio, Percent |
0.60%
|
| Factors Affecting Performance [Text Block] |
How did the Fund perform last year?The Ultra Short Tax-Free Income Fund looked for opportunities to lock in attractive yields in the fixed rate market while maintaining a core position of variable rate demand notes (VRDNs). Final maturities of new fixed positions were shortened to increase liquidity while maintaining yield. VRDN rates increased at the close of the quarter, providing additional yield as fixed positions were unwound. Short duration was effective for performance relative to the benchmark. The Fund outperformed its benchmark, returning 2.45% (institutional shares) for the period ended August 31, 2026, versus 2.36% for Bloomberg 1-Year Municipal Bond Index, primarily because of its shorter-than-benchmark duration. A higher allocation to VRDNs and shortened final maturity of fixed positions served to decrease the Fund’s duration and increase its liquidity. The Fund is closing in the upcoming quarter. We are positioned to offer an attractive tax-free yield while maintaining adequate liquidity as funds exit the strategy. |
| Performance Past Does Not Indicate Future [Text] |
The performance data quoted represents past performance and does not guarantee future results
|
| Line Graph [Table Text Block] |
Table Summary | Ultra Short Tax-Free Income Fund (Investor Shares) | Bloomberg Municipal Bond Index | Bloomberg 1-Year Municipal Bond Index |
|---|
Dec 17 | $10,000 | $10,000 | $10,000 |
|---|
Aug 18 | $10,014 | $10,064 | $10,109 |
|---|
Aug 19 | $10,150 | $10,942 | $10,378 |
|---|
Aug 20 | $10,215 | $11,296 | $10,580 |
|---|
Aug 21 | $10,185 | $11,680 | $10,646 |
|---|
Aug 22 | $10,088 | $10,671 | $10,477 |
|---|
Aug 23 | $10,327 | $10,853 | $10,669 |
|---|
Aug 24 | $10,675 | $11,514 | $11,117 |
|---|
Aug 25 | $10,989 | $11,523 | $11,480 |
|---|
Aug 26 | $11,230 | $11,998 | $11,750 |
|---|
|
| Average Annual Return [Table Text Block] |
Table Summary | 1 Year | 5 Year | Since Inception |
|---|
Investor Shares | 2.19% | 1.97% | 1.35% |
|---|
Bloomberg Municipal Bond Index | 4.12% | 0.54% | 2.12% |
|---|
Bloomberg 1-Year Municipal Bond Index | 2.36% | 1.99% | 1.88% |
|---|
|
| AssetsNet |
$ 3,725,596
|
| Holdings Count | Holding |
15
|
| Advisory Fees Paid, Amount |
$ (116,113)
|
| InvestmentCompanyPortfolioTurnover |
177.00%
|
| Additional Fund Statistics [Text Block] |
Table SummaryNet Assets | $3,725,596 |
|---|
Number of Portfolio Holdings | 15 |
|---|
Net Investment Advisory Fees | $(116,113) |
|---|
Portfolio Turnover Rate | 177% |
|---|
|
| Holdings [Text Block] |
Credit Rating(as a % of Net Assets) Table SummaryValue | Value |
|---|
AA | 5.2% | AA+ | 6.6% | A-1 | 13.5% | A-1+ | 12.1% | NR | 62.6% | Portfolio Composition (as a % of Net Assets)Table SummaryMunicipal Bonds | 64.3% |
|---|
Investment in Affiliates | 35.7% |
|---|
|
| Largest Holdings [Text Block] |
Top 10 Holdings(as a % of Net Assets) Table SummaryCity of New York NY, GO, Series L-4 | 5.4% |
|---|
County of Lincoln WY Revenue, Series E | 5.4% |
|---|
Montgomery County Public Building Authority Revenue | 5.4% |
|---|
Iowa Finance Authority Revenue, Series S | 5.4% |
|---|
Illinois Finance Authority Revenue, Series B | 5.4% |
|---|
Idaho Health Facilities Authority Revenue, Series C | 5.4% |
|---|
The Public Building Authority of Blount County Tennessee Revenue, Series D-3-A | 5.4% |
|---|
Clarksville Public Building Authority Revenue, Series PO | 5.3% |
|---|
State of Kansas Department of Transportation Revenue, Series A | 5.2% |
|---|
Mississippi Business Finance Corp. Revenue, Series G | 4.0% |
|---|
|
| Material Fund Change [Text Block] |
On July 30, 2026, the Board of Trustees of the Funds approved a plan to liquidate and terminate the Ultra Short Tax-Free Income Fund. |
| C000136573 |
|
| Shareholder Report [Line Items] |
|
| Fund Name |
World Energy & Power Fund
|
| Class Name |
A Shares
|
| Trading Symbol |
AAWEX
|
| Annual or Semi-Annual Statement [Text Block] |
Annual Shareholder Report
|
| Additional Information [Text Block] |
You can find additional information about the Fund at https://www.cavanalhillfunds.com/literature/mutual-fund-literature/. You can also request this information by contacting us at 1-800-762-7085.
|
| Additional Information Phone Number |
1-800-762-7085
|
| Additional Information Website |
https://www.cavanalhillfunds.com/literature/mutual-fund-literature/.
|
| Expenses [Text Block] |
What were the Fund's costs for the last year?(based on a $10,000 investment) Table SummaryClass name | Costs of a $10,000
investment | Costs paid as a percentage of a
$10,000 investment |
|---|
A Shares | $132 | 1.11% |
|---|
|
| Expenses Paid, Amount |
$ 132
|
| Expense Ratio, Percent |
1.11%
|
| Factors Affecting Performance [Text Block] |
How did the Fund perform last year?We favored investments in refining, gas transportation, electricity equipment, and nuclear power. Our exposure to oil-focused companies was below benchmark, but we added to those positions as the conflict in Iran extended. The Fund underperformed its benchmark, returning 38.59% (institutional shares) for the year ended August 31, 2026, versus 43.07% for the MSCI World Energy Index. Our investments in refining companies and electricity equipment outperformed as investors focused on the Iran conflict and the need for electricity generation to power data centers. The Fund’s fixed income holdings lagged the total portfolio returns as did our investment in nuclear power-related equipment providers and oilfield service stocks. The economic shock of the Iran war is creating opportunities in refining, new sources of western hemisphere oil, and demand for natural gas. Consequently, we have added to those areas of the portfolio. In addition, AI-related demand for power remains a key driver for electrical equipment. We expect the nuclear renaissance to continue as investors look to nuclear as a source of clean energy. |
| Performance Past Does Not Indicate Future [Text] |
The performance data quoted represents past performance and does not guarantee future results
|
| Line Graph [Table Text Block] |
Table Summary | World Energy & Power Fund (A Shares) | S&P 500® Index | MSCI World Energy Index |
|---|
Aug 16 | $10,000 | $10,000 | $10,000 |
|---|
Aug 17 | $9,416 | $11,623 | $10,067 |
|---|
Aug 18 | $11,146 | $13,909 | $12,299 |
|---|
Aug 19 | $7,986 | $14,315 | $10,152 |
|---|
Aug 20 | $7,496 | $17,455 | $7,090 |
|---|
Aug 21 | $10,969 | $22,895 | $9,605 |
|---|
Aug 22 | $15,745 | $20,325 | $14,955 |
|---|
Aug 23 | $17,440 | $23,566 | $17,042 |
|---|
Aug 24 | $18,070 | $29,960 | $18,511 |
|---|
Aug 25 | $22,282 | $34,718 | $19,576 |
|---|
Aug 26 | $30,796 | $41,793 | $28,007 |
|---|
|
| Average Annual Return [Table Text Block] |
Table Summary | 1 Year | 5 Year | 10 Year |
|---|
A Shares | 38.21% | 22.93% | 11.90% |
|---|
S&P 500® Index | 20.38% | 12.79% | 15.37% |
|---|
MSCI World Energy Index | 43.07% | 23.87% | 10.85% |
|---|
|
| AssetsNet |
$ 353,943,871
|
| Holdings Count | Holding |
55
|
| Advisory Fees Paid, Amount |
$ 1,282,093
|
| InvestmentCompanyPortfolioTurnover |
116.00%
|
| Additional Fund Statistics [Text Block] |
Table SummaryNet Assets | $353,943,871 |
|---|
Number of Portfolio Holdings | 55 |
|---|
Net Investment Advisory Fees | $1,282,093 |
|---|
Portfolio Turnover Rate | 116% |
|---|
|
| Holdings [Text Block] |
Sector Allocation(as a % of Net Assets) Table SummaryValue | Value |
|---|
Industrials | 14.3% | Energy | 84.1% | Other | 2.2% | Portfolio Composition (as a % of Net Assets)Table SummaryCommon Stocks | 97.1% |
|---|
Corporate Bonds | 1.1% |
|---|
Yankee Debt Obligations | 0.7% |
|---|
Investment in Affiliates | 1.7% |
|---|
Country Diversification(as a % of Net Assets) Table SummaryValue | Value |
|---|
Other | 2.8% | Ireland | 1.7% | France | 1.7% | Germany | 1.9% | Switzerland | 2.1% | Italy | 2.2% | Argentina | 2.4% | Mexico | 4.2% | Canada | 5.8% | United Kingdom | 8.9% | United States | 66.9% | |
| Largest Holdings [Text Block] |
Top 10 Holdings(as a % of Net Assets) Table SummaryMarathon Petroleum Corp. | 6.4% |
|---|
Valero Energy Corp. | 5.3% |
|---|
ConocoPhillips | 4.8% |
|---|
Phillips 66 | 4.7% |
|---|
Chevron Corp. | 4.7% |
|---|
TechnipFMC PLC | 4.7% |
|---|
SLB, Ltd. | 4.4% |
|---|
Baker Hughes Co., Class A | 4.4% |
|---|
APA Corp. | 4.4% |
|---|
Vista Energy SAB de CV | 4.2% |
|---|
|
| Material Fund Change [Text Block] |
Effective June 1, 2026, the name of the Cavanal Hill World Energy Fund changed to the Cavanal Hill World Energy & Power Fund. The Fund changed its name to better align with the investments the Fund makes in pursuit of its investment objective. Neither the Fund’s investment objective nor its principal investment strategies have changed. |
| C000136574 |
|
| Shareholder Report [Line Items] |
|
| Fund Name |
World Energy & Power Fund
|
| Class Name |
C Shares
|
| Trading Symbol |
ACWEX
|
| Annual or Semi-Annual Statement [Text Block] |
Annual Shareholder Report
|
| Additional Information [Text Block] |
You can find additional information about the Fund at https://www.cavanalhillfunds.com/literature/mutual-fund-literature/. You can also request this information by contacting us at 1-800-762-7085.
|
| Additional Information Phone Number |
1-800-762-7085
|
| Additional Information Website |
https://www.cavanalhillfunds.com/literature/mutual-fund-literature/.
|
| Expenses [Text Block] |
What were the Fund's costs for the last year?(based on a $10,000 investment) Table SummaryClass name | Costs of a $10,000
investment | Costs paid as a percentage of a
$10,000 investment |
|---|
C Shares | $219 | 1.85% |
|---|
|
| Expenses Paid, Amount |
$ 219
|
| Expense Ratio, Percent |
1.85%
|
| Factors Affecting Performance [Text Block] |
How did the Fund perform last year?We favored investments in refining, gas transportation, electricity equipment, and nuclear power. Our exposure to oil-focused companies was below benchmark, but we added to those positions as the conflict in Iran extended. The Fund underperformed its benchmark, returning 38.59% (institutional shares) for the year ended August 31, 2026, versus 43.07% for the MSCI World Energy Index. Our investments in refining companies and electricity equipment outperformed as investors focused on the Iran conflict and the need for electricity generation to power data centers. The Fund’s fixed income holdings lagged the total portfolio returns as did our investment in nuclear power-related equipment providers and oilfield service stocks. The economic shock of the Iran war is creating opportunities in refining, new sources of western hemisphere oil, and demand for natural gas. Consequently, we have added to those areas of the portfolio. In addition, AI-related demand for power remains a key driver for electrical equipment. We expect the nuclear renaissance to continue as investors look to nuclear as a source of clean energy. |
| Performance Past Does Not Indicate Future [Text] |
The performance data quoted represents past performance and does not guarantee future results
|
| Line Graph [Table Text Block] |
Table Summary | World Energy & Power Fund (C Shares) | S&P 500® Index | MSCI World Energy Index |
|---|
Aug 16 | $10,000 | $10,000 | $10,000 |
|---|
Aug 17 | $9,341 | $11,623 | $10,067 |
|---|
Aug 18 | $10,977 | $13,909 | $12,299 |
|---|
Aug 19 | $7,813 | $14,315 | $10,152 |
|---|
Aug 20 | $7,275 | $17,455 | $7,090 |
|---|
Aug 21 | $10,567 | $22,895 | $9,605 |
|---|
Aug 22 | $15,049 | $20,325 | $14,955 |
|---|
Aug 23 | $16,543 | $23,566 | $17,042 |
|---|
Aug 24 | $17,010 | $29,960 | $18,511 |
|---|
Aug 25 | $20,813 | $34,718 | $19,576 |
|---|
Aug 26 | $28,556 | $41,793 | $28,007 |
|---|
|
| Average Annual Return [Table Text Block] |
Table Summary | 1 Year | 5 Year | 10 Year |
|---|
C Shares | 37.20% | 22.00% | 11.06% |
|---|
S&P 500® Index | 20.38% | 12.79% | 15.37% |
|---|
MSCI World Energy Index | 43.07% | 23.87% | 10.85% |
|---|
|
| AssetsNet |
$ 353,943,871
|
| Holdings Count | Holding |
55
|
| Advisory Fees Paid, Amount |
$ 1,282,093
|
| InvestmentCompanyPortfolioTurnover |
116.00%
|
| Additional Fund Statistics [Text Block] |
Table SummaryNet Assets | $353,943,871 |
|---|
Number of Portfolio Holdings | 55 |
|---|
Net Investment Advisory Fees | $1,282,093 |
|---|
Portfolio Turnover Rate | 116% |
|---|
|
| Holdings [Text Block] |
Sector Allocation(as a % of Net Assets) Table SummaryValue | Value |
|---|
Industrials | 14.3% | Energy | 84.1% | Other | 2.2% | Portfolio Composition (as a % of Net Assets)Table SummaryCommon Stocks | 97.1% |
|---|
Corporate Bonds | 1.1% |
|---|
Yankee Debt Obligations | 0.7% |
|---|
Investment in Affiliates | 1.7% |
|---|
Country Diversification(as a % of Net Assets) Table SummaryValue | Value |
|---|
Other | 2.8% | Ireland | 1.7% | France | 1.7% | Germany | 1.9% | Switzerland | 2.1% | Italy | 2.2% | Argentina | 2.4% | Mexico | 4.2% | Canada | 5.8% | United Kingdom | 8.9% | United States | 66.9% | |
| Largest Holdings [Text Block] |
Top 10 Holdings(as a % of Net Assets) Table SummaryMarathon Petroleum Corp. | 6.4% |
|---|
Valero Energy Corp. | 5.3% |
|---|
ConocoPhillips | 4.8% |
|---|
Phillips 66 | 4.7% |
|---|
Chevron Corp. | 4.7% |
|---|
TechnipFMC PLC | 4.7% |
|---|
SLB, Ltd. | 4.4% |
|---|
Baker Hughes Co., Class A | 4.4% |
|---|
APA Corp. | 4.4% |
|---|
Vista Energy SAB de CV | 4.2% |
|---|
|
| Material Fund Change [Text Block] |
Effective June 1, 2026, the name of the Cavanal Hill World Energy Fund changed to the Cavanal Hill World Energy & Power Fund. The Fund changed its name to better align with the investments the Fund makes in pursuit of its investment objective. Neither the Fund’s investment objective nor its principal investment strategies have changed. |
| C000136571 |
|
| Shareholder Report [Line Items] |
|
| Fund Name |
World Energy & Power Fund
|
| Class Name |
Institutional Shares
|
| Trading Symbol |
AIWEX
|
| Annual or Semi-Annual Statement [Text Block] |
Annual Shareholder Report
|
| Additional Information [Text Block] |
You can find additional information about the Fund at https://www.cavanalhillfunds.com/literature/mutual-fund-literature/. You can also request this information by contacting us at 1-800-762-7085.
|
| Additional Information Phone Number |
1-800-762-7085
|
| Additional Information Website |
https://www.cavanalhillfunds.com/literature/mutual-fund-literature/.
|
| Expenses [Text Block] |
What were the Fund's costs for the last year?(based on a $10,000 investment) Table SummaryClass name | Costs of a $10,000
investment | Costs paid as a percentage of a
$10,000 investment |
|---|
Institutional Shares | $100 | 0.84% |
|---|
|
| Expenses Paid, Amount |
$ 100
|
| Expense Ratio, Percent |
0.84%
|
| Factors Affecting Performance [Text Block] |
How did the Fund perform last year?We favored investments in refining, gas transportation, electricity equipment, and nuclear power. Our exposure to oil-focused companies was below benchmark, but we added to those positions as the conflict in Iran extended. The Fund underperformed its benchmark, returning 38.59% (institutional shares) for the year ended August 31, 2026, versus 43.07% for the MSCI World Energy Index. Our investments in refining companies and electricity equipment outperformed as investors focused on the Iran conflict and the need for electricity generation to power data centers. The Fund’s fixed income holdings lagged the total portfolio returns as did our investment in nuclear power-related equipment providers and oilfield service stocks. The economic shock of the Iran war is creating opportunities in refining, new sources of western hemisphere oil, and demand for natural gas. Consequently, we have added to those areas of the portfolio. In addition, AI-related demand for power remains a key driver for electrical equipment. We expect the nuclear renaissance to continue as investors look to nuclear as a source of clean energy. |
| Performance Past Does Not Indicate Future [Text] |
The performance data quoted represents past performance and does not guarantee future results
|
| Line Graph [Table Text Block] |
Table Summary | World Energy & Power Fund (Institutional Shares) | S&P 500® Index | MSCI World Energy Index |
|---|
Aug 16 | $10,000 | $10,000 | $10,000 |
|---|
Aug 17 | $9,431 | $11,623 | $10,067 |
|---|
Aug 18 | $11,196 | $13,909 | $12,299 |
|---|
Aug 19 | $8,047 | $14,315 | $10,152 |
|---|
Aug 20 | $7,572 | $17,455 | $7,090 |
|---|
Aug 21 | $11,114 | $22,895 | $9,605 |
|---|
Aug 22 | $15,983 | $20,325 | $14,955 |
|---|
Aug 23 | $17,744 | $23,566 | $17,042 |
|---|
Aug 24 | $18,439 | $29,960 | $18,511 |
|---|
Aug 25 | $22,785 | $34,718 | $19,576 |
|---|
Aug 26 | $31,577 | $41,793 | $28,007 |
|---|
|
| Average Annual Return [Table Text Block] |
Table Summary | 1 Year | 5 Year | 10 Year |
|---|
Institutional Shares | 38.59% | 23.23% | 12.19% |
|---|
S&P 500® Index | 20.38% | 12.79% | 15.37% |
|---|
MSCI World Energy Index | 43.07% | 23.87% | 10.85% |
|---|
|
| AssetsNet |
$ 353,943,871
|
| Holdings Count | Holding |
55
|
| Advisory Fees Paid, Amount |
$ 1,282,093
|
| InvestmentCompanyPortfolioTurnover |
116.00%
|
| Additional Fund Statistics [Text Block] |
Table SummaryNet Assets | $353,943,871 |
|---|
Number of Portfolio Holdings | 55 |
|---|
Net Investment Advisory Fees | $1,282,093 |
|---|
Portfolio Turnover Rate | 116% |
|---|
|
| Holdings [Text Block] |
Sector Allocation(as a % of Net Assets) Table SummaryValue | Value |
|---|
Industrials | 14.3% | Energy | 84.1% | Other | 2.2% | Portfolio Composition (as a % of Net Assets)Table SummaryCommon Stocks | 97.1% |
|---|
Corporate Bonds | 1.1% |
|---|
Yankee Debt Obligations | 0.7% |
|---|
Investment in Affiliates | 1.7% |
|---|
Country Diversification(as a % of Net Assets) Table SummaryValue | Value |
|---|
Other | 2.8% | Ireland | 1.7% | France | 1.7% | Germany | 1.9% | Switzerland | 2.1% | Italy | 2.2% | Argentina | 2.4% | Mexico | 4.2% | Canada | 5.8% | United Kingdom | 8.9% | United States | 66.9% | |
| Largest Holdings [Text Block] |
Top 10 Holdings(as a % of Net Assets) Table SummaryMarathon Petroleum Corp. | 6.4% |
|---|
Valero Energy Corp. | 5.3% |
|---|
ConocoPhillips | 4.8% |
|---|
Phillips 66 | 4.7% |
|---|
Chevron Corp. | 4.7% |
|---|
TechnipFMC PLC | 4.7% |
|---|
SLB, Ltd. | 4.4% |
|---|
Baker Hughes Co., Class A | 4.4% |
|---|
APA Corp. | 4.4% |
|---|
Vista Energy SAB de CV | 4.2% |
|---|
|
| Material Fund Change [Text Block] |
Effective June 1, 2026, the name of the Cavanal Hill World Energy Fund changed to the Cavanal Hill World Energy & Power Fund. The Fund changed its name to better align with the investments the Fund makes in pursuit of its investment objective. Neither the Fund’s investment objective nor its principal investment strategies have changed. |
| C000136572 |
|
| Shareholder Report [Line Items] |
|
| Fund Name |
World Energy & Power Fund
|
| Class Name |
Investor Shares
|
| Trading Symbol |
APWEX
|
| Annual or Semi-Annual Statement [Text Block] |
Annual Shareholder Report
|
| Additional Information [Text Block] |
You can find additional information about the Fund at https://www.cavanalhillfunds.com/literature/mutual-fund-literature/. You can also request this information by contacting us at 1-800-762-7085.
|
| Additional Information Phone Number |
1-800-762-7085
|
| Additional Information Website |
https://www.cavanalhillfunds.com/literature/mutual-fund-literature/.
|
| Expenses [Text Block] |
What were the Fund's costs for the last year?(based on a $10,000 investment) Table SummaryClass name | Costs of a $10,000
investment | Costs paid as a percentage of a
$10,000 investment |
|---|
Investor Shares | $131 | 1.10% |
|---|
|
| Expenses Paid, Amount |
$ 131
|
| Expense Ratio, Percent |
1.10%
|
| Factors Affecting Performance [Text Block] |
How did the Fund perform last year?We favored investments in refining, gas transportation, electricity equipment, and nuclear power. Our exposure to oil-focused companies was below benchmark, but we added to those positions as the conflict in Iran extended. The Fund underperformed its benchmark, returning 38.59% (institutional shares) for the year ended August 31, 2026, versus 43.07% for the MSCI World Energy Index. Our investments in refining companies and electricity equipment outperformed as investors focused on the Iran conflict and the need for electricity generation to power data centers. The Fund’s fixed income holdings lagged the total portfolio returns as did our investment in nuclear power-related equipment providers and oilfield service stocks. The economic shock of the Iran war is creating opportunities in refining, new sources of western hemisphere oil, and demand for natural gas. Consequently, we have added to those areas of the portfolio. In addition, AI-related demand for power remains a key driver for electrical equipment. We expect the nuclear renaissance to continue as investors look to nuclear as a source of clean energy. |
| Performance Past Does Not Indicate Future [Text] |
The performance data quoted represents past performance and does not guarantee future results
|
| Line Graph [Table Text Block] |
Table Summary | World Energy & Power Fund (Investor Shares) | S&P 500® Index | MSCI World Energy Index |
|---|
Aug 16 | $10,000 | $10,000 | $10,000 |
|---|
Aug 17 | $9,413 | $11,623 | $10,067 |
|---|
Aug 18 | $11,133 | $13,909 | $12,299 |
|---|
Aug 19 | $7,986 | $14,315 | $10,152 |
|---|
Aug 20 | $7,492 | $17,455 | $7,090 |
|---|
Aug 21 | $10,974 | $22,895 | $9,605 |
|---|
Aug 22 | $15,735 | $20,325 | $14,955 |
|---|
Aug 23 | $17,422 | $23,566 | $17,042 |
|---|
Aug 24 | $18,062 | $29,960 | $18,511 |
|---|
Aug 25 | $22,262 | $34,718 | $19,576 |
|---|
Aug 26 | $30,768 | $41,793 | $28,007 |
|---|
|
| Average Annual Return [Table Text Block] |
Table Summary | 1 Year | 5 Year | 10 Year |
|---|
Investor Shares | 38.21% | 22.90% | 11.89% |
|---|
S&P 500® Index | 20.38% | 12.79% | 15.37% |
|---|
MSCI World Energy Index | 43.07% | 23.87% | 10.85% |
|---|
|
| AssetsNet |
$ 353,943,871
|
| Holdings Count | Holding |
55
|
| Advisory Fees Paid, Amount |
$ 1,282,093
|
| InvestmentCompanyPortfolioTurnover |
116.00%
|
| Additional Fund Statistics [Text Block] |
Table SummaryNet Assets | $353,943,871 |
|---|
Number of Portfolio Holdings | 55 |
|---|
Net Investment Advisory Fees | $1,282,093 |
|---|
Portfolio Turnover Rate | 116% |
|---|
|
| Holdings [Text Block] |
Sector Allocation(as a % of Net Assets) Table SummaryValue | Value |
|---|
Industrials | 14.3% | Energy | 84.1% | Other | 2.2% | Portfolio Composition (as a % of Net Assets)Table SummaryCommon Stocks | 97.1% |
|---|
Corporate Bonds | 1.1% |
|---|
Yankee Debt Obligations | 0.7% |
|---|
Investment in Affiliates | 1.7% |
|---|
Country Diversification(as a % of Net Assets) Table SummaryValue | Value |
|---|
Other | 2.8% | Ireland | 1.7% | France | 1.7% | Germany | 1.9% | Switzerland | 2.1% | Italy | 2.2% | Argentina | 2.4% | Mexico | 4.2% | Canada | 5.8% | United Kingdom | 8.9% | United States | 66.9% | |
| Largest Holdings [Text Block] |
Top 10 Holdings(as a % of Net Assets) Table SummaryMarathon Petroleum Corp. | 6.4% |
|---|
Valero Energy Corp. | 5.3% |
|---|
ConocoPhillips | 4.8% |
|---|
Phillips 66 | 4.7% |
|---|
Chevron Corp. | 4.7% |
|---|
TechnipFMC PLC | 4.7% |
|---|
SLB, Ltd. | 4.4% |
|---|
Baker Hughes Co., Class A | 4.4% |
|---|
APA Corp. | 4.4% |
|---|
Vista Energy SAB de CV | 4.2% |
|---|
|
| Material Fund Change [Text Block] |
Effective June 1, 2026, the name of the Cavanal Hill World Energy Fund changed to the Cavanal Hill World Energy & Power Fund. The Fund changed its name to better align with the investments the Fund makes in pursuit of its investment objective. Neither the Fund’s investment objective nor its principal investment strategies have changed. |