Shareholder Report
Aug. 31, 2026
USD ($)
Holding
This report describes certain changes to the Fund that occurred during the reporting period.
FUND EXPENSES
What were the fund costs for the last year?
| (based on a hypothetical $10,000 investment) | ||
| Class Name | Costs of a $10,000 investment | Costs paid as a percentage of a $10,000 investment |
| R6 | $65 | 0.65% |
MANAGEMENT'S DISCUSSION OF FUND PERFORMANCE
-
For the twelve months ended August 31, 2026, Class R6 shares of the MFS Mid Cap Growth Fund (fund) provided a total return of ‑1.12%, at net asset value. This compares with a return of 20.10% for the fund’s benchmark, the Russell 3000® Index. The fund's other benchmark, the Russell Midcap® Growth Index, generated a return of ‑1.16%.
-
Global equity markets reached record levels during the period, withstanding considerable volatility amid tariffs, geopolitical conflict and high levels of uncertainty. A new geopolitical event distressed markets as US and Israeli forces launched strikes against Iran, disrupting Mideast oil and natural gas exports. During the period, renewed focus on defense and infrastructure spending brightened the economic outlook in Europe while in Japan, the election of a pro-growth prime minister sent stocks to new highs. Optimism over artificial intelligence remained high globally.
-
While the US Supreme Court struck down part of the Trump administration’s tariff strategy, the administration began deploying other authorities to largely replace the ones that were ruled unconstitutional.
-
Higher energy prices and the lingering impact from tariffs kept inflation elevated in the US, prompting the Federal Reserve to end its easing cycle. Both the European Central Bank and the Bank of Japan raised rates toward the end of the period.
-
In fixed income markets, previously range-bound global bond yields climbed following the February 2026 onset of the conflict in the Middle East and as investors appeared to price in greater fiscal and monetary uncertainty. During the Iran war, global credit spreads widened modestly before stabilizing near pre-conflict levels, supported by strong demand and resilient underlying fundamentals. Similarly, US rate volatility (as measured by the Merrill Lynch Option Volatility Estimate (MOVE) Index) rose from intra-period lows before retracting back near prior levels.
-
Top contributors to performance relative to the Russell Midcap® Growth Index:
-
Stock selection within the health care sector strengthened the fund's relative performance.
-
-
Top detractors from performance relative to the Russell Midcap® Growth Index:
-
Stock selection within both the energy and materials sectors held back relative performance.
-
The fund's underweight position in the industrials sector also weakened relative returns.
-
FUND PERFORMANCE
The fund’s past performance is not a good predictor of the fund’s future performance. The graph and table below do not reflect the deduction of taxes that a shareholder would pay on fund distributions or the redemption of fund shares. The graph and table below assume reinvestment of dividends and capital gain distributions.
Growth of a Hypothetical $10,000 Investment
This graph shows the performance of a hypothetical $10,000 investment in Class R6 over a ten year period or since inception, if shorter, in comparison to (i) a broad measure of market performance and (ii) an additional index that MFS believes more closely reflects the market segments in which the fund invests.
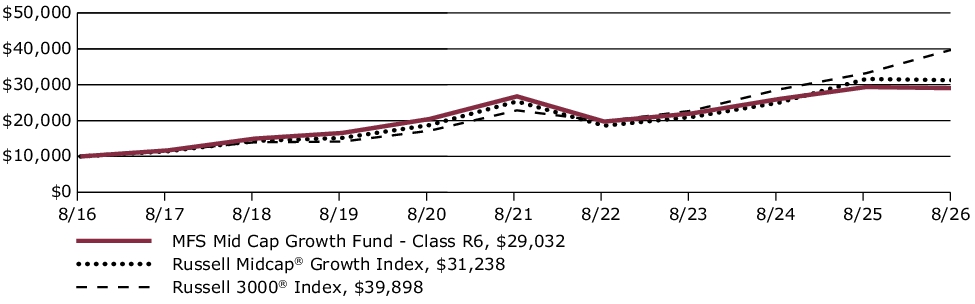
Average Annual Total Returns through 8/31/26
This table shows the average annual total returns of the class of shares noted for the periods shown, both with (if any) and without sales charges. It also shows the average annual total returns of (i) a broad measure of market performance and (ii) an additional index that MFS believes more closely reflects the market segments in which the fund invests, over the same periods.
| Share Class | 1-yr | 5-yr | 10-yr |
| R6 without sales charge | (1.12)% | 1.66% | 11.25% |
| Comparative Benchmark(s) | |||
| Russell 3000® Index ∆ | 20.10% | 11.80% | 14.84% |
| Russell Midcap® Growth Index ∆ | (1.16)% | 4.27% | 12.06% |
|
∆
|
Source: FactSet Research Systems Inc.
|
Visit mfs.com/perf/r6 for more recent performance information.
FUND STATISTICS AS OF 8/31/26
| Net Assets ($): | 12,963,583,519 | Total Management Fee ($)#: | 87,122,303 | |
| Total Number of Holdings: | 105 | Portfolio Turnover Rate (%): | 64 |
# Includes the effect of any management fee waivers, if applicable.
Where the fund holds derivatives, they are not included in the total number of portfolio holdings.
PORTFOLIO COMPOSITION (BASED ON TOTAL INVESTMENTS AS OF 8/31/26)
Portfolio structure
| Equities | 99.0% |
| Money Market Funds | 1.0% |
Equity sectors
| Information Technology | 27.4% |
| Health Care | 20.2% |
| Industrials | 16.9% |
| Communication Services | 9.6% |
| Consumer Discretionary | 8.2% |
| Energy | 7.1% |
| Financials | 5.1% |
| Materials | 2.7% |
| Consumer Staples | 0.8% |
| Utilities | 0.8% |
| Real Estate | 0.2% |
Top ten holdings
| Natera, Inc. | 3.4% |
| Live Nation Entertainment, Inc. | 3.0% |
| Cloudflare, Inc., "A" | 2.9% |
| Snowflake, Inc., "A" | 2.7% |
| Monolithic Power Systems, Inc. | 2.7% |
| Ascendis Pharma A.S., ADR | 2.6% |
| Revolution Medicines, Inc. | 2.5% |
| Take-Two Interactive Software, Inc. | 2.4% |
| Robinhood Markets, Inc. | 2.1% |
| Axon Enterprise, Inc. | 2.1% |
MFS uses the Global Industry Classification Standard (GICS®) for sector/industry reporting. MFS has applied its own internal sector/industry classification methodology for equity securities and non-equity securities that are unclassified by GICS.
Top ten holdings
| Natera, Inc. | 3.4% |
| Live Nation Entertainment, Inc. | 3.0% |
| Cloudflare, Inc., "A" | 2.9% |
| Snowflake, Inc., "A" | 2.7% |
| Monolithic Power Systems, Inc. | 2.7% |
| Ascendis Pharma A.S., ADR | 2.6% |
| Revolution Medicines, Inc. | 2.5% |
| Take-Two Interactive Software, Inc. | 2.4% |
| Robinhood Markets, Inc. | 2.1% |
| Axon Enterprise, Inc. | 2.1% |
MATERIAL FUND CHANGES
This is a summary of certain changes to the fund since September 1, 2025. For more complete information, you may review the fund's prospectus as amended, which is available at funds.mfs.com or upon request at 1‑800‑225‑2606.
Effective June 10, 2026, the MFS Mid Cap Growth Fund revised its existing policy to invest at least 80% of its net assets in issuers with medium market capitalizations to reflect that the Fund will invest at least 80% of its net assets in growth companies with medium market capitalizations and expanded on the factors used to define issuers with medium market capitalizations and growth companies.
Effective June 10, 2026, the MFS Mid Cap Growth Fund revised its existing policy to invest at least 80% of its net assets in issuers with medium market capitalizations to reflect that the Fund will invest at least 80% of its net assets in growth companies with medium market capitalizations and expanded on the factors used to define issuers with medium market capitalizations and growth companies.
This is a summary of certain changes to the fund since September 1, 2025. For more complete information, you may review the fund's prospectus as amended, which is available at funds.mfs.com or upon request at 1‑800‑225‑2606.
This report describes certain changes to the Fund that occurred during the reporting period.
FUND EXPENSES
What were the fund costs for the last year?
| (based on a hypothetical $10,000 investment) | ||
| Class Name | Costs of a $10,000 investment | Costs paid as a percentage of a $10,000 investment |
| R4 | $77 | 0.77% |
MANAGEMENT'S DISCUSSION OF FUND PERFORMANCE
-
For the twelve months ended August 31, 2026, Class R4 shares of the MFS Mid Cap Growth Fund (fund) provided a total return of ‑1.23%, at net asset value. This compares with a return of 20.10% for the fund’s benchmark, the Russell 3000® Index. The fund's other benchmark, the Russell Midcap® Growth Index, generated a return of ‑1.16%.
-
Global equity markets reached record levels during the period, withstanding considerable volatility amid tariffs, geopolitical conflict and high levels of uncertainty. A new geopolitical event distressed markets as US and Israeli forces launched strikes against Iran, disrupting Mideast oil and natural gas exports. During the period, renewed focus on defense and infrastructure spending brightened the economic outlook in Europe while in Japan, the election of a pro-growth prime minister sent stocks to new highs. Optimism over artificial intelligence remained high globally.
-
While the US Supreme Court struck down part of the Trump administration’s tariff strategy, the administration began deploying other authorities to largely replace the ones that were ruled unconstitutional.
-
Higher energy prices and the lingering impact from tariffs kept inflation elevated in the US, prompting the Federal Reserve to end its easing cycle. Both the European Central Bank and the Bank of Japan raised rates toward the end of the period.
-
In fixed income markets, previously range-bound global bond yields climbed following the February 2026 onset of the conflict in the Middle East and as investors appeared to price in greater fiscal and monetary uncertainty. During the Iran war, global credit spreads widened modestly before stabilizing near pre-conflict levels, supported by strong demand and resilient underlying fundamentals. Similarly, US rate volatility (as measured by the Merrill Lynch Option Volatility Estimate (MOVE) Index) rose from intra-period lows before retracting back near prior levels.
-
Top contributors to performance relative to the Russell Midcap® Growth Index:
-
Stock selection within the health care sector strengthened the fund's relative performance.
-
-
Top detractors from performance relative to the Russell Midcap® Growth Index:
-
Stock selection within both the energy and materials sectors held back relative performance.
-
The fund's underweight position in the industrials sector also weakened relative returns.
-
FUND PERFORMANCE
The fund’s past performance is not a good predictor of the fund’s future performance. The graph and table below do not reflect the deduction of taxes that a shareholder would pay on fund distributions or the redemption of fund shares. The graph and table below assume reinvestment of dividends and capital gain distributions.
Growth of a Hypothetical $10,000 Investment
This graph shows the performance of a hypothetical $10,000 investment in Class R4 over a ten year period or since inception, if shorter, in comparison to (i) a broad measure of market performance and (ii) an additional index that MFS believes more closely reflects the market segments in which the fund invests.
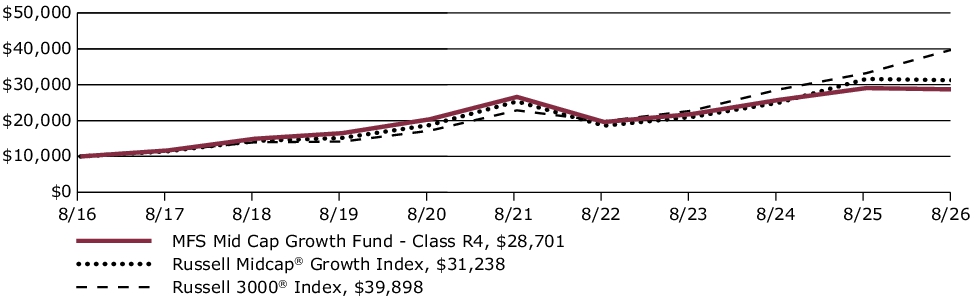
Average Annual Total Returns through 8/31/26
This table shows the average annual total returns of the class of shares noted for the periods shown, both with (if any) and without sales charges. It also shows the average annual total returns of (i) a broad measure of market performance and (ii) an additional index that MFS believes more closely reflects the market segments in which the fund invests, over the same periods.
| Share Class | 1-yr | 5-yr | 10-yr |
| R4 without sales charge | (1.23)% | 1.54% | 11.12% |
| Comparative Benchmark(s) | |||
| Russell 3000® Index ∆ | 20.10% | 11.80% | 14.84% |
| Russell Midcap® Growth Index ∆ | (1.16)% | 4.27% | 12.06% |
|
∆
|
Source: FactSet Research Systems Inc.
|
Visit mfs.com/perf/r4 for more recent performance information.
FUND STATISTICS AS OF 8/31/26
| Net Assets ($): | 12,963,583,519 | Total Management Fee ($)#: | 87,122,303 | |
| Total Number of Holdings: | 105 | Portfolio Turnover Rate (%): | 64 |
# Includes the effect of any management fee waivers, if applicable.
Where the fund holds derivatives, they are not included in the total number of portfolio holdings.
PORTFOLIO COMPOSITION (BASED ON TOTAL INVESTMENTS AS OF 8/31/26)
Portfolio structure
| Equities | 99.0% |
| Money Market Funds | 1.0% |
Equity sectors
| Information Technology | 27.4% |
| Health Care | 20.2% |
| Industrials | 16.9% |
| Communication Services | 9.6% |
| Consumer Discretionary | 8.2% |
| Energy | 7.1% |
| Financials | 5.1% |
| Materials | 2.7% |
| Consumer Staples | 0.8% |
| Utilities | 0.8% |
| Real Estate | 0.2% |
Top ten holdings
| Natera, Inc. | 3.4% |
| Live Nation Entertainment, Inc. | 3.0% |
| Cloudflare, Inc., "A" | 2.9% |
| Snowflake, Inc., "A" | 2.7% |
| Monolithic Power Systems, Inc. | 2.7% |
| Ascendis Pharma A.S., ADR | 2.6% |
| Revolution Medicines, Inc. | 2.5% |
| Take-Two Interactive Software, Inc. | 2.4% |
| Robinhood Markets, Inc. | 2.1% |
| Axon Enterprise, Inc. | 2.1% |
MFS uses the Global Industry Classification Standard (GICS®) for sector/industry reporting. MFS has applied its own internal sector/industry classification methodology for equity securities and non-equity securities that are unclassified by GICS.
Top ten holdings
| Natera, Inc. | 3.4% |
| Live Nation Entertainment, Inc. | 3.0% |
| Cloudflare, Inc., "A" | 2.9% |
| Snowflake, Inc., "A" | 2.7% |
| Monolithic Power Systems, Inc. | 2.7% |
| Ascendis Pharma A.S., ADR | 2.6% |
| Revolution Medicines, Inc. | 2.5% |
| Take-Two Interactive Software, Inc. | 2.4% |
| Robinhood Markets, Inc. | 2.1% |
| Axon Enterprise, Inc. | 2.1% |
MATERIAL FUND CHANGES
This is a summary of certain changes to the fund since September 1, 2025. For more complete information, you may review the fund's prospectus as amended, which is available at funds.mfs.com or upon request at 1‑800‑225‑2606.
Effective June 10, 2026, the MFS Mid Cap Growth Fund revised its existing policy to invest at least 80% of its net assets in issuers with medium market capitalizations to reflect that the Fund will invest at least 80% of its net assets in growth companies with medium market capitalizations and expanded on the factors used to define issuers with medium market capitalizations and growth companies.
Effective June 10, 2026, the MFS Mid Cap Growth Fund revised its existing policy to invest at least 80% of its net assets in issuers with medium market capitalizations to reflect that the Fund will invest at least 80% of its net assets in growth companies with medium market capitalizations and expanded on the factors used to define issuers with medium market capitalizations and growth companies.
This is a summary of certain changes to the fund since September 1, 2025. For more complete information, you may review the fund's prospectus as amended, which is available at funds.mfs.com or upon request at 1‑800‑225‑2606.
This report describes certain changes to the Fund that occurred during the reporting period.
FUND EXPENSES
What were the fund costs for the last year?
| (based on a hypothetical $10,000 investment) | ||
| Class Name | Costs of a $10,000 investment | Costs paid as a percentage of a $10,000 investment |
| R3 | $101 | 1.02% |
MANAGEMENT'S DISCUSSION OF FUND PERFORMANCE
-
For the twelve months ended August 31, 2026, Class R3 shares of the MFS Mid Cap Growth Fund (fund) provided a total return of ‑1.51%, at net asset value. This compares with a return of 20.10% for the fund’s benchmark, the Russell 3000® Index. The fund's other benchmark, the Russell Midcap® Growth Index, generated a return of ‑1.16%.
-
Global equity markets reached record levels during the period, withstanding considerable volatility amid tariffs, geopolitical conflict and high levels of uncertainty. A new geopolitical event distressed markets as US and Israeli forces launched strikes against Iran, disrupting Mideast oil and natural gas exports. During the period, renewed focus on defense and infrastructure spending brightened the economic outlook in Europe while in Japan, the election of a pro-growth prime minister sent stocks to new highs. Optimism over artificial intelligence remained high globally.
-
While the US Supreme Court struck down part of the Trump administration’s tariff strategy, the administration began deploying other authorities to largely replace the ones that were ruled unconstitutional.
-
Higher energy prices and the lingering impact from tariffs kept inflation elevated in the US, prompting the Federal Reserve to end its easing cycle. Both the European Central Bank and the Bank of Japan raised rates toward the end of the period.
-
In fixed income markets, previously range-bound global bond yields climbed following the February 2026 onset of the conflict in the Middle East and as investors appeared to price in greater fiscal and monetary uncertainty. During the Iran war, global credit spreads widened modestly before stabilizing near pre-conflict levels, supported by strong demand and resilient underlying fundamentals. Similarly, US rate volatility (as measured by the Merrill Lynch Option Volatility Estimate (MOVE) Index) rose from intra-period lows before retracting back near prior levels.
-
Top contributors to performance relative to the Russell Midcap® Growth Index:
-
Stock selection within the health care sector strengthened the fund's relative performance.
-
-
Top detractors from performance relative to the Russell Midcap® Growth Index:
-
Stock selection within both the energy and materials sectors held back relative performance.
-
The fund's underweight position in the industrials sector also weakened relative returns.
-
FUND PERFORMANCE
The fund’s past performance is not a good predictor of the fund’s future performance. The graph and table below do not reflect the deduction of taxes that a shareholder would pay on fund distributions or the redemption of fund shares. The graph and table below assume reinvestment of dividends and capital gain distributions.
Growth of a Hypothetical $10,000 Investment
This graph shows the performance of a hypothetical $10,000 investment in Class R3 over a ten year period or since inception, if shorter, in comparison to (i) a broad measure of market performance and (ii) an additional index that MFS believes more closely reflects the market segments in which the fund invests.
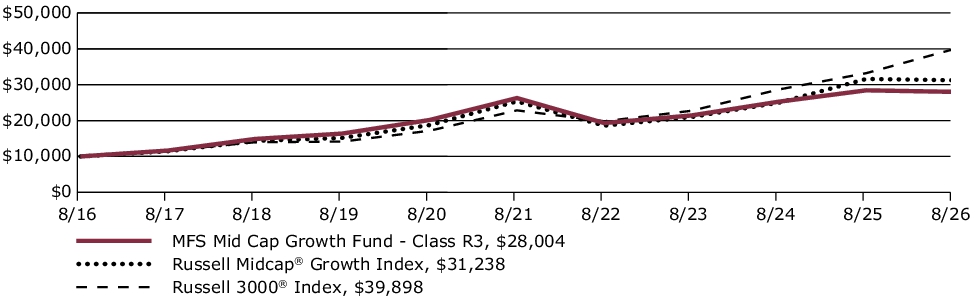
Average Annual Total Returns through 8/31/26
This table shows the average annual total returns of the class of shares noted for the periods shown, both with (if any) and without sales charges. It also shows the average annual total returns of (i) a broad measure of market performance and (ii) an additional index that MFS believes more closely reflects the market segments in which the fund invests, over the same periods.
| Share Class | 1-yr | 5-yr | 10-yr |
| R3 without sales charge | (1.51)% | 1.28% | 10.85% |
| Comparative Benchmark(s) | |||
| Russell 3000® Index ∆ | 20.10% | 11.80% | 14.84% |
| Russell Midcap® Growth Index ∆ | (1.16)% | 4.27% | 12.06% |
|
∆
|
Source: FactSet Research Systems Inc.
|
Visit mfs.com/perf/r3 for more recent performance information.
FUND STATISTICS AS OF 8/31/26
| Net Assets ($): | 12,963,583,519 | Total Management Fee ($)#: | 87,122,303 | |
| Total Number of Holdings: | 105 | Portfolio Turnover Rate (%): | 64 |
# Includes the effect of any management fee waivers, if applicable.
Where the fund holds derivatives, they are not included in the total number of portfolio holdings.
PORTFOLIO COMPOSITION (BASED ON TOTAL INVESTMENTS AS OF 8/31/26)
Portfolio structure
| Equities | 99.0% |
| Money Market Funds | 1.0% |
Equity sectors
| Information Technology | 27.4% |
| Health Care | 20.2% |
| Industrials | 16.9% |
| Communication Services | 9.6% |
| Consumer Discretionary | 8.2% |
| Energy | 7.1% |
| Financials | 5.1% |
| Materials | 2.7% |
| Consumer Staples | 0.8% |
| Utilities | 0.8% |
| Real Estate | 0.2% |
Top ten holdings
| Natera, Inc. | 3.4% |
| Live Nation Entertainment, Inc. | 3.0% |
| Cloudflare, Inc., "A" | 2.9% |
| Snowflake, Inc., "A" | 2.7% |
| Monolithic Power Systems, Inc. | 2.7% |
| Ascendis Pharma A.S., ADR | 2.6% |
| Revolution Medicines, Inc. | 2.5% |
| Take-Two Interactive Software, Inc. | 2.4% |
| Robinhood Markets, Inc. | 2.1% |
| Axon Enterprise, Inc. | 2.1% |
MFS uses the Global Industry Classification Standard (GICS®) for sector/industry reporting. MFS has applied its own internal sector/industry classification methodology for equity securities and non-equity securities that are unclassified by GICS.
Top ten holdings
| Natera, Inc. | 3.4% |
| Live Nation Entertainment, Inc. | 3.0% |
| Cloudflare, Inc., "A" | 2.9% |
| Snowflake, Inc., "A" | 2.7% |
| Monolithic Power Systems, Inc. | 2.7% |
| Ascendis Pharma A.S., ADR | 2.6% |
| Revolution Medicines, Inc. | 2.5% |
| Take-Two Interactive Software, Inc. | 2.4% |
| Robinhood Markets, Inc. | 2.1% |
| Axon Enterprise, Inc. | 2.1% |
MATERIAL FUND CHANGES
This is a summary of certain changes to the fund since September 1, 2025. For more complete information, you may review the fund's prospectus as amended, which is available at funds.mfs.com or upon request at 1‑800‑225‑2606.
Effective June 10, 2026, the MFS Mid Cap Growth Fund revised its existing policy to invest at least 80% of its net assets in issuers with medium market capitalizations to reflect that the Fund will invest at least 80% of its net assets in growth companies with medium market capitalizations and expanded on the factors used to define issuers with medium market capitalizations and growth companies.
Effective June 10, 2026, the MFS Mid Cap Growth Fund revised its existing policy to invest at least 80% of its net assets in issuers with medium market capitalizations to reflect that the Fund will invest at least 80% of its net assets in growth companies with medium market capitalizations and expanded on the factors used to define issuers with medium market capitalizations and growth companies.
This is a summary of certain changes to the fund since September 1, 2025. For more complete information, you may review the fund's prospectus as amended, which is available at funds.mfs.com or upon request at 1‑800‑225‑2606.
This report describes certain changes to the Fund that occurred during the reporting period.
FUND EXPENSES
What were the fund costs for the last year?
| (based on a hypothetical $10,000 investment) | ||
| Class Name | Costs of a $10,000 investment | Costs paid as a percentage of a $10,000 investment |
| R2 | $126 | 1.27% |
MANAGEMENT'S DISCUSSION OF FUND PERFORMANCE
-
For the twelve months ended August 31, 2026, Class R2 shares of the MFS Mid Cap Growth Fund (fund) provided a total return of ‑1.73%, at net asset value. This compares with a return of 20.10% for the fund’s benchmark, the Russell 3000® Index. The fund's other benchmark, the Russell Midcap® Growth Index, generated a return of ‑1.16%.
-
Global equity markets reached record levels during the period, withstanding considerable volatility amid tariffs, geopolitical conflict and high levels of uncertainty. A new geopolitical event distressed markets as US and Israeli forces launched strikes against Iran, disrupting Mideast oil and natural gas exports. During the period, renewed focus on defense and infrastructure spending brightened the economic outlook in Europe while in Japan, the election of a pro-growth prime minister sent stocks to new highs. Optimism over artificial intelligence remained high globally.
-
While the US Supreme Court struck down part of the Trump administration’s tariff strategy, the administration began deploying other authorities to largely replace the ones that were ruled unconstitutional.
-
Higher energy prices and the lingering impact from tariffs kept inflation elevated in the US, prompting the Federal Reserve to end its easing cycle. Both the European Central Bank and the Bank of Japan raised rates toward the end of the period.
-
In fixed income markets, previously range-bound global bond yields climbed following the February 2026 onset of the conflict in the Middle East and as investors appeared to price in greater fiscal and monetary uncertainty. During the Iran war, global credit spreads widened modestly before stabilizing near pre-conflict levels, supported by strong demand and resilient underlying fundamentals. Similarly, US rate volatility (as measured by the Merrill Lynch Option Volatility Estimate (MOVE) Index) rose from intra-period lows before retracting back near prior levels.
-
Top contributors to performance relative to the Russell Midcap® Growth Index:
-
Stock selection within the health care sector strengthened the fund's relative performance.
-
-
Top detractors from performance relative to the Russell Midcap® Growth Index:
-
Stock selection within both the energy and materials sectors held back relative performance.
-
The fund's underweight position in the industrials sector also weakened relative returns.
-
FUND PERFORMANCE
The fund’s past performance is not a good predictor of the fund’s future performance. The graph and table below do not reflect the deduction of taxes that a shareholder would pay on fund distributions or the redemption of fund shares. The graph and table below assume reinvestment of dividends and capital gain distributions.
Growth of a Hypothetical $10,000 Investment
This graph shows the performance of a hypothetical $10,000 investment in Class R2 over a ten year period or since inception, if shorter, in comparison to (i) a broad measure of market performance and (ii) an additional index that MFS believes more closely reflects the market segments in which the fund invests.
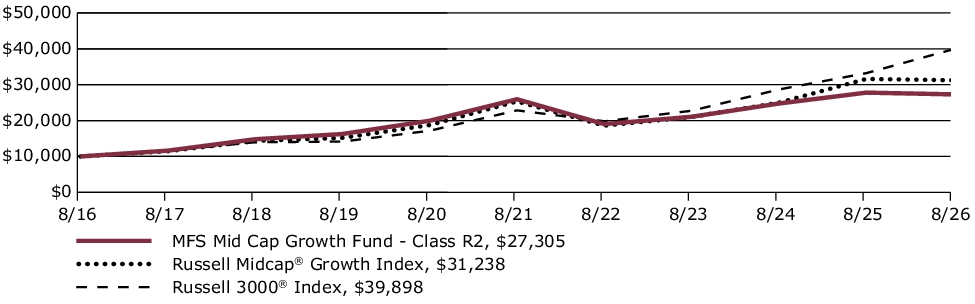
Average Annual Total Returns through 8/31/26
This table shows the average annual total returns of the class of shares noted for the periods shown, both with (if any) and without sales charges. It also shows the average annual total returns of (i) a broad measure of market performance and (ii) an additional index that MFS believes more closely reflects the market segments in which the fund invests, over the same periods.
| Share Class | 1-yr | 5-yr | 10-yr |
| R2 without sales charge | (1.73)% | 1.03% | 10.57% |
| Comparative Benchmark(s) | |||
| Russell 3000® Index ∆ | 20.10% | 11.80% | 14.84% |
| Russell Midcap® Growth Index ∆ | (1.16)% | 4.27% | 12.06% |
|
∆
|
Source: FactSet Research Systems Inc.
|
Visit mfs.com/perf/r2 for more recent performance information.
FUND STATISTICS AS OF 8/31/26
| Net Assets ($): | 12,963,583,519 | Total Management Fee ($)#: | 87,122,303 | |
| Total Number of Holdings: | 105 | Portfolio Turnover Rate (%): | 64 |
# Includes the effect of any management fee waivers, if applicable.
Where the fund holds derivatives, they are not included in the total number of portfolio holdings.
PORTFOLIO COMPOSITION (BASED ON TOTAL INVESTMENTS AS OF 8/31/26)
Portfolio structure
| Equities | 99.0% |
| Money Market Funds | 1.0% |
Equity sectors
| Information Technology | 27.4% |
| Health Care | 20.2% |
| Industrials | 16.9% |
| Communication Services | 9.6% |
| Consumer Discretionary | 8.2% |
| Energy | 7.1% |
| Financials | 5.1% |
| Materials | 2.7% |
| Consumer Staples | 0.8% |
| Utilities | 0.8% |
| Real Estate | 0.2% |
Top ten holdings
| Natera, Inc. | 3.4% |
| Live Nation Entertainment, Inc. | 3.0% |
| Cloudflare, Inc., "A" | 2.9% |
| Snowflake, Inc., "A" | 2.7% |
| Monolithic Power Systems, Inc. | 2.7% |
| Ascendis Pharma A.S., ADR | 2.6% |
| Revolution Medicines, Inc. | 2.5% |
| Take-Two Interactive Software, Inc. | 2.4% |
| Robinhood Markets, Inc. | 2.1% |
| Axon Enterprise, Inc. | 2.1% |
MFS uses the Global Industry Classification Standard (GICS®) for sector/industry reporting. MFS has applied its own internal sector/industry classification methodology for equity securities and non-equity securities that are unclassified by GICS.
Top ten holdings
| Natera, Inc. | 3.4% |
| Live Nation Entertainment, Inc. | 3.0% |
| Cloudflare, Inc., "A" | 2.9% |
| Snowflake, Inc., "A" | 2.7% |
| Monolithic Power Systems, Inc. | 2.7% |
| Ascendis Pharma A.S., ADR | 2.6% |
| Revolution Medicines, Inc. | 2.5% |
| Take-Two Interactive Software, Inc. | 2.4% |
| Robinhood Markets, Inc. | 2.1% |
| Axon Enterprise, Inc. | 2.1% |
MATERIAL FUND CHANGES
This is a summary of certain changes to the fund since September 1, 2025. For more complete information, you may review the fund's prospectus as amended, which is available at funds.mfs.com or upon request at 1‑800‑225‑2606.
Effective June 10, 2026, the MFS Mid Cap Growth Fund revised its existing policy to invest at least 80% of its net assets in issuers with medium market capitalizations to reflect that the Fund will invest at least 80% of its net assets in growth companies with medium market capitalizations and expanded on the factors used to define issuers with medium market capitalizations and growth companies.
Effective June 10, 2026, the MFS Mid Cap Growth Fund revised its existing policy to invest at least 80% of its net assets in issuers with medium market capitalizations to reflect that the Fund will invest at least 80% of its net assets in growth companies with medium market capitalizations and expanded on the factors used to define issuers with medium market capitalizations and growth companies.
This is a summary of certain changes to the fund since September 1, 2025. For more complete information, you may review the fund's prospectus as amended, which is available at funds.mfs.com or upon request at 1‑800‑225‑2606.
This report describes certain changes to the Fund that occurred during the reporting period.
FUND EXPENSES
What were the fund costs for the last year?
| (based on a hypothetical $10,000 investment) | ||
| Class Name | Costs of a $10,000 investment | Costs paid as a percentage of a $10,000 investment |
| R1 | $175 | 1.77% |
MANAGEMENT'S DISCUSSION OF FUND PERFORMANCE
-
For the twelve months ended August 31, 2026, Class R1 shares of the MFS Mid Cap Growth Fund (fund) provided a total return of ‑2.23%, at net asset value. This compares with a return of 20.10% for the fund’s benchmark, the Russell 3000® Index. The fund's other benchmark, the Russell Midcap® Growth Index, generated a return of ‑1.16%.
-
Global equity markets reached record levels during the period, withstanding considerable volatility amid tariffs, geopolitical conflict and high levels of uncertainty. A new geopolitical event distressed markets as US and Israeli forces launched strikes against Iran, disrupting Mideast oil and natural gas exports. During the period, renewed focus on defense and infrastructure spending brightened the economic outlook in Europe while in Japan, the election of a pro-growth prime minister sent stocks to new highs. Optimism over artificial intelligence remained high globally.
-
While the US Supreme Court struck down part of the Trump administration’s tariff strategy, the administration began deploying other authorities to largely replace the ones that were ruled unconstitutional.
-
Higher energy prices and the lingering impact from tariffs kept inflation elevated in the US, prompting the Federal Reserve to end its easing cycle. Both the European Central Bank and the Bank of Japan raised rates toward the end of the period.
-
In fixed income markets, previously range-bound global bond yields climbed following the February 2026 onset of the conflict in the Middle East and as investors appeared to price in greater fiscal and monetary uncertainty. During the Iran war, global credit spreads widened modestly before stabilizing near pre-conflict levels, supported by strong demand and resilient underlying fundamentals. Similarly, US rate volatility (as measured by the Merrill Lynch Option Volatility Estimate (MOVE) Index) rose from intra-period lows before retracting back near prior levels.
-
Top contributors to performance relative to the Russell Midcap® Growth Index:
-
Stock selection within the health care sector strengthened the fund's relative performance.
-
-
Top detractors from performance relative to the Russell Midcap® Growth Index:
-
Stock selection within both the energy and materials sectors held back relative performance.
-
The fund's underweight position in the industrials sector also weakened relative returns.
-
FUND PERFORMANCE
The fund’s past performance is not a good predictor of the fund’s future performance. The graph and table below do not reflect the deduction of taxes that a shareholder would pay on fund distributions or the redemption of fund shares. The graph and table below assume reinvestment of dividends and capital gain distributions.
Growth of a Hypothetical $10,000 Investment
This graph shows the performance of a hypothetical $10,000 investment in Class R1 over a ten year period or since inception, if shorter, in comparison to (i) a broad measure of market performance and (ii) an additional index that MFS believes more closely reflects the market segments in which the fund invests.
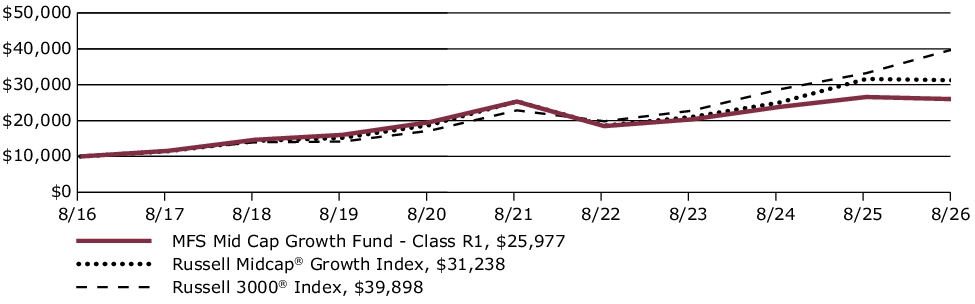
Average Annual Total Returns through 8/31/26
This table shows the average annual total returns of the class of shares noted for the periods shown, both with (if any) and without sales charges. It also shows the average annual total returns of (i) a broad measure of market performance and (ii) an additional index that MFS believes more closely reflects the market segments in which the fund invests, over the same periods.
| Share Class | 1-yr | 5-yr | 10-yr |
| R1 without sales charge | (2.23)% | 0.53% | 10.02% |
| Comparative Benchmark(s) | |||
| Russell 3000® Index ∆ | 20.10% | 11.80% | 14.84% |
| Russell Midcap® Growth Index ∆ | (1.16)% | 4.27% | 12.06% |
|
∆
|
Source: FactSet Research Systems Inc.
|
Visit mfs.com/perf/r1 for more recent performance information.
FUND STATISTICS AS OF 8/31/26
| Net Assets ($): | 12,963,583,519 | Total Management Fee ($)#: | 87,122,303 | |
| Total Number of Holdings: | 105 | Portfolio Turnover Rate (%): | 64 |
# Includes the effect of any management fee waivers, if applicable.
Where the fund holds derivatives, they are not included in the total number of portfolio holdings.
PORTFOLIO COMPOSITION (BASED ON TOTAL INVESTMENTS AS OF 8/31/26)
Portfolio structure
| Equities | 99.0% |
| Money Market Funds | 1.0% |
Equity sectors
| Information Technology | 27.4% |
| Health Care | 20.2% |
| Industrials | 16.9% |
| Communication Services | 9.6% |
| Consumer Discretionary | 8.2% |
| Energy | 7.1% |
| Financials | 5.1% |
| Materials | 2.7% |
| Consumer Staples | 0.8% |
| Utilities | 0.8% |
| Real Estate | 0.2% |
Top ten holdings
| Natera, Inc. | 3.4% |
| Live Nation Entertainment, Inc. | 3.0% |
| Cloudflare, Inc., "A" | 2.9% |
| Snowflake, Inc., "A" | 2.7% |
| Monolithic Power Systems, Inc. | 2.7% |
| Ascendis Pharma A.S., ADR | 2.6% |
| Revolution Medicines, Inc. | 2.5% |
| Take-Two Interactive Software, Inc. | 2.4% |
| Robinhood Markets, Inc. | 2.1% |
| Axon Enterprise, Inc. | 2.1% |
MFS uses the Global Industry Classification Standard (GICS®) for sector/industry reporting. MFS has applied its own internal sector/industry classification methodology for equity securities and non-equity securities that are unclassified by GICS.
Top ten holdings
| Natera, Inc. | 3.4% |
| Live Nation Entertainment, Inc. | 3.0% |
| Cloudflare, Inc., "A" | 2.9% |
| Snowflake, Inc., "A" | 2.7% |
| Monolithic Power Systems, Inc. | 2.7% |
| Ascendis Pharma A.S., ADR | 2.6% |
| Revolution Medicines, Inc. | 2.5% |
| Take-Two Interactive Software, Inc. | 2.4% |
| Robinhood Markets, Inc. | 2.1% |
| Axon Enterprise, Inc. | 2.1% |
MATERIAL FUND CHANGES
This is a summary of certain changes to the fund since September 1, 2025. For more complete information, you may review the fund's prospectus as amended, which is available at funds.mfs.com or upon request at 1‑800‑225‑2606.
Effective June 10, 2026, the MFS Mid Cap Growth Fund revised its existing policy to invest at least 80% of its net assets in issuers with medium market capitalizations to reflect that the Fund will invest at least 80% of its net assets in growth companies with medium market capitalizations and expanded on the factors used to define issuers with medium market capitalizations and growth companies.
Effective June 10, 2026, the MFS Mid Cap Growth Fund revised its existing policy to invest at least 80% of its net assets in issuers with medium market capitalizations to reflect that the Fund will invest at least 80% of its net assets in growth companies with medium market capitalizations and expanded on the factors used to define issuers with medium market capitalizations and growth companies.
This is a summary of certain changes to the fund since September 1, 2025. For more complete information, you may review the fund's prospectus as amended, which is available at funds.mfs.com or upon request at 1‑800‑225‑2606.
This report describes certain changes to the Fund that occurred during the reporting period.
FUND EXPENSES
What were the fund costs for the last year?
| (based on a hypothetical $10,000 investment) | ||
| Class Name | Costs of a $10,000 investment | Costs paid as a percentage of a $10,000 investment |
| I | $77 | 0.77% |
MANAGEMENT'S DISCUSSION OF FUND PERFORMANCE
-
For the twelve months ended August 31, 2026, Class I shares of the MFS Mid Cap Growth Fund (fund) provided a total return of ‑1.23%, at net asset value. This compares with a return of 20.10% for the fund’s benchmark, the Russell 3000® Index. The fund's other benchmark, the Russell Midcap® Growth Index, generated a return of ‑1.16%.
-
Global equity markets reached record levels during the period, withstanding considerable volatility amid tariffs, geopolitical conflict and high levels of uncertainty. A new geopolitical event distressed markets as US and Israeli forces launched strikes against Iran, disrupting Mideast oil and natural gas exports. During the period, renewed focus on defense and infrastructure spending brightened the economic outlook in Europe while in Japan, the election of a pro-growth prime minister sent stocks to new highs. Optimism over artificial intelligence remained high globally.
-
While the US Supreme Court struck down part of the Trump administration’s tariff strategy, the administration began deploying other authorities to largely replace the ones that were ruled unconstitutional.
-
Higher energy prices and the lingering impact from tariffs kept inflation elevated in the US, prompting the Federal Reserve to end its easing cycle. Both the European Central Bank and the Bank of Japan raised rates toward the end of the period.
-
In fixed income markets, previously range-bound global bond yields climbed following the February 2026 onset of the conflict in the Middle East and as investors appeared to price in greater fiscal and monetary uncertainty. During the Iran war, global credit spreads widened modestly before stabilizing near pre-conflict levels, supported by strong demand and resilient underlying fundamentals. Similarly, US rate volatility (as measured by the Merrill Lynch Option Volatility Estimate (MOVE) Index) rose from intra-period lows before retracting back near prior levels.
-
Top contributors to performance relative to the Russell Midcap® Growth Index:
-
Stock selection within the health care sector strengthened the fund's relative performance.
-
-
Top detractors from performance relative to the Russell Midcap® Growth Index:
-
Stock selection within both the energy and materials sectors held back relative performance.
-
The fund's underweight position in the industrials sector also weakened relative returns.
-
FUND PERFORMANCE
The fund’s past performance is not a good predictor of the fund’s future performance. The graph and table below do not reflect the deduction of taxes that a shareholder would pay on fund distributions or the redemption of fund shares. The graph and table below assume reinvestment of dividends and capital gain distributions.
Growth of a Hypothetical $10,000 Investment
This graph shows the performance of a hypothetical $10,000 investment in Class I over a ten year period or since inception, if shorter, in comparison to (i) a broad measure of market performance and (ii) an additional index that MFS believes more closely reflects the market segments in which the fund invests.
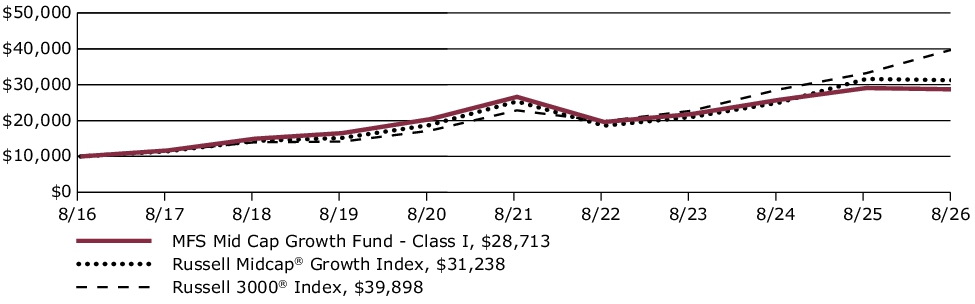
Average Annual Total Returns through 8/31/26
This table shows the average annual total returns of the class of shares noted for the periods shown, both with (if any) and without sales charges. It also shows the average annual total returns of (i) a broad measure of market performance and (ii) an additional index that MFS believes more closely reflects the market segments in which the fund invests, over the same periods.
| Share Class | 1-yr | 5-yr | 10-yr |
| I without sales charge | (1.23)% | 1.54% | 11.12% |
| Comparative Benchmark(s) | |||
| Russell 3000® Index ∆ | 20.10% | 11.80% | 14.84% |
| Russell Midcap® Growth Index ∆ | (1.16)% | 4.27% | 12.06% |
|
∆
|
Source: FactSet Research Systems Inc.
|
Visit mfs.com/perf/i for more recent performance information.
FUND STATISTICS AS OF 8/31/26
| Net Assets ($): | 12,963,583,519 | Total Management Fee ($)#: | 87,122,303 | |
| Total Number of Holdings: | 105 | Portfolio Turnover Rate (%): | 64 |
# Includes the effect of any management fee waivers, if applicable.
Where the fund holds derivatives, they are not included in the total number of portfolio holdings.
PORTFOLIO COMPOSITION (BASED ON TOTAL INVESTMENTS AS OF 8/31/26)
Portfolio structure
| Equities | 99.0% |
| Money Market Funds | 1.0% |
Equity sectors
| Information Technology | 27.4% |
| Health Care | 20.2% |
| Industrials | 16.9% |
| Communication Services | 9.6% |
| Consumer Discretionary | 8.2% |
| Energy | 7.1% |
| Financials | 5.1% |
| Materials | 2.7% |
| Consumer Staples | 0.8% |
| Utilities | 0.8% |
| Real Estate | 0.2% |
Top ten holdings
| Natera, Inc. | 3.4% |
| Live Nation Entertainment, Inc. | 3.0% |
| Cloudflare, Inc., "A" | 2.9% |
| Snowflake, Inc., "A" | 2.7% |
| Monolithic Power Systems, Inc. | 2.7% |
| Ascendis Pharma A.S., ADR | 2.6% |
| Revolution Medicines, Inc. | 2.5% |
| Take-Two Interactive Software, Inc. | 2.4% |
| Robinhood Markets, Inc. | 2.1% |
| Axon Enterprise, Inc. | 2.1% |
MFS uses the Global Industry Classification Standard (GICS®) for sector/industry reporting. MFS has applied its own internal sector/industry classification methodology for equity securities and non-equity securities that are unclassified by GICS.
Top ten holdings
| Natera, Inc. | 3.4% |
| Live Nation Entertainment, Inc. | 3.0% |
| Cloudflare, Inc., "A" | 2.9% |
| Snowflake, Inc., "A" | 2.7% |
| Monolithic Power Systems, Inc. | 2.7% |
| Ascendis Pharma A.S., ADR | 2.6% |
| Revolution Medicines, Inc. | 2.5% |
| Take-Two Interactive Software, Inc. | 2.4% |
| Robinhood Markets, Inc. | 2.1% |
| Axon Enterprise, Inc. | 2.1% |
MATERIAL FUND CHANGES
This is a summary of certain changes to the fund since September 1, 2025. For more complete information, you may review the fund's prospectus as amended, which is available at funds.mfs.com or upon request at 1‑800‑225‑2606.
Effective June 10, 2026, the MFS Mid Cap Growth Fund revised its existing policy to invest at least 80% of its net assets in issuers with medium market capitalizations to reflect that the Fund will invest at least 80% of its net assets in growth companies with medium market capitalizations and expanded on the factors used to define issuers with medium market capitalizations and growth companies.
Effective June 10, 2026, the MFS Mid Cap Growth Fund revised its existing policy to invest at least 80% of its net assets in issuers with medium market capitalizations to reflect that the Fund will invest at least 80% of its net assets in growth companies with medium market capitalizations and expanded on the factors used to define issuers with medium market capitalizations and growth companies.
This is a summary of certain changes to the fund since September 1, 2025. For more complete information, you may review the fund's prospectus as amended, which is available at funds.mfs.com or upon request at 1‑800‑225‑2606.
This report describes certain changes to the Fund that occurred during the reporting period.
FUND EXPENSES
What were the fund costs for the last year?
| (based on a hypothetical $10,000 investment) | ||
| Class Name | Costs of a $10,000 investment | Costs paid as a percentage of a $10,000 investment |
| C | $175 | 1.77% |
MANAGEMENT'S DISCUSSION OF FUND PERFORMANCE
-
For the twelve months ended August 31, 2026, Class C shares of the MFS Mid Cap Growth Fund (fund) provided a total return of ‑2.26%, at net asset value. This compares with a return of 20.10% for the fund’s benchmark, the Russell 3000® Index. The fund's other benchmark, the Russell Midcap® Growth Index, generated a return of ‑1.16%.
-
Global equity markets reached record levels during the period, withstanding considerable volatility amid tariffs, geopolitical conflict and high levels of uncertainty. A new geopolitical event distressed markets as US and Israeli forces launched strikes against Iran, disrupting Mideast oil and natural gas exports. During the period, renewed focus on defense and infrastructure spending brightened the economic outlook in Europe while in Japan, the election of a pro-growth prime minister sent stocks to new highs. Optimism over artificial intelligence remained high globally.
-
While the US Supreme Court struck down part of the Trump administration’s tariff strategy, the administration began deploying other authorities to largely replace the ones that were ruled unconstitutional.
-
Higher energy prices and the lingering impact from tariffs kept inflation elevated in the US, prompting the Federal Reserve to end its easing cycle. Both the European Central Bank and the Bank of Japan raised rates toward the end of the period.
-
In fixed income markets, previously range-bound global bond yields climbed following the February 2026 onset of the conflict in the Middle East and as investors appeared to price in greater fiscal and monetary uncertainty. During the Iran war, global credit spreads widened modestly before stabilizing near pre-conflict levels, supported by strong demand and resilient underlying fundamentals. Similarly, US rate volatility (as measured by the Merrill Lynch Option Volatility Estimate (MOVE) Index) rose from intra-period lows before retracting back near prior levels.
-
Top contributors to performance relative to the Russell Midcap® Growth Index:
-
Stock selection within the health care sector strengthened the fund's relative performance.
-
-
Top detractors from performance relative to the Russell Midcap® Growth Index:
-
Stock selection within both the energy and materials sectors held back relative performance.
-
The fund's underweight position in the industrials sector also weakened relative returns.
-
FUND PERFORMANCE
The fund’s past performance is not a good predictor of the fund’s future performance. The graph and table below do not reflect the deduction of taxes that a shareholder would pay on fund distributions or the redemption of fund shares. The graph and table below assume reinvestment of dividends and capital gain distributions.
Growth of a Hypothetical $10,000 Investment
This graph shows the performance of a hypothetical $10,000 investment in Class C over a ten year period or since inception, if shorter, in comparison to (i) a broad measure of market performance and (ii) an additional index that MFS believes more closely reflects the market segments in which the fund invests.
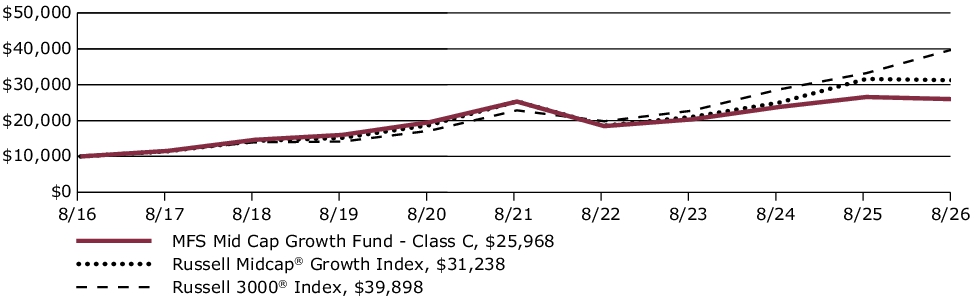
Average Annual Total Returns through 8/31/26
This table shows the average annual total returns of the class of shares noted for the periods shown, both with (if any) and without sales charges. It also shows the average annual total returns of (i) a broad measure of market performance and (ii) an additional index that MFS believes more closely reflects the market segments in which the fund invests, over the same periods.
| Share Class | 1-yr | 5-yr | 10-yr |
| C without sales charge | (2.26)% | 0.52% | 10.01% |
| C with CDSC (1% for 12 months)× | (3.05)% | 0.52% | 10.01% |
| Comparative Benchmark(s) | |||
| Russell 3000® Index ∆ | 20.10% | 11.80% | 14.84% |
| Russell Midcap® Growth Index ∆ | (1.16)% | 4.27% | 12.06% |
|
∆
|
Source: FactSet Research Systems Inc.
|
|
×
|
Assuming redemption at the end of the applicable period.
|
Visit mfs.com/perf/c for more recent performance information.
FUND STATISTICS AS OF 8/31/26
| Net Assets ($): | 12,963,583,519 | Total Management Fee ($)#: | 87,122,303 | |
| Total Number of Holdings: | 105 | Portfolio Turnover Rate (%): | 64 |
# Includes the effect of any management fee waivers, if applicable.
Where the fund holds derivatives, they are not included in the total number of portfolio holdings.
PORTFOLIO COMPOSITION (BASED ON TOTAL INVESTMENTS AS OF 8/31/26)
Portfolio structure
| Equities | 99.0% |
| Money Market Funds | 1.0% |
Equity sectors
| Information Technology | 27.4% |
| Health Care | 20.2% |
| Industrials | 16.9% |
| Communication Services | 9.6% |
| Consumer Discretionary | 8.2% |
| Energy | 7.1% |
| Financials | 5.1% |
| Materials | 2.7% |
| Consumer Staples | 0.8% |
| Utilities | 0.8% |
| Real Estate | 0.2% |
Top ten holdings
| Natera, Inc. | 3.4% |
| Live Nation Entertainment, Inc. | 3.0% |
| Cloudflare, Inc., "A" | 2.9% |
| Snowflake, Inc., "A" | 2.7% |
| Monolithic Power Systems, Inc. | 2.7% |
| Ascendis Pharma A.S., ADR | 2.6% |
| Revolution Medicines, Inc. | 2.5% |
| Take-Two Interactive Software, Inc. | 2.4% |
| Robinhood Markets, Inc. | 2.1% |
| Axon Enterprise, Inc. | 2.1% |
MFS uses the Global Industry Classification Standard (GICS®) for sector/industry reporting. MFS has applied its own internal sector/industry classification methodology for equity securities and non-equity securities that are unclassified by GICS.
Top ten holdings
| Natera, Inc. | 3.4% |
| Live Nation Entertainment, Inc. | 3.0% |
| Cloudflare, Inc., "A" | 2.9% |
| Snowflake, Inc., "A" | 2.7% |
| Monolithic Power Systems, Inc. | 2.7% |
| Ascendis Pharma A.S., ADR | 2.6% |
| Revolution Medicines, Inc. | 2.5% |
| Take-Two Interactive Software, Inc. | 2.4% |
| Robinhood Markets, Inc. | 2.1% |
| Axon Enterprise, Inc. | 2.1% |
MATERIAL FUND CHANGES
This is a summary of certain changes to the fund since September 1, 2025. For more complete information, you may review the fund's prospectus as amended, which is available at funds.mfs.com or upon request at 1‑800‑225‑2606.
Effective June 10, 2026, the MFS Mid Cap Growth Fund revised its existing policy to invest at least 80% of its net assets in issuers with medium market capitalizations to reflect that the Fund will invest at least 80% of its net assets in growth companies with medium market capitalizations and expanded on the factors used to define issuers with medium market capitalizations and growth companies.
Effective June 10, 2026, the MFS Mid Cap Growth Fund revised its existing policy to invest at least 80% of its net assets in issuers with medium market capitalizations to reflect that the Fund will invest at least 80% of its net assets in growth companies with medium market capitalizations and expanded on the factors used to define issuers with medium market capitalizations and growth companies.
This is a summary of certain changes to the fund since September 1, 2025. For more complete information, you may review the fund's prospectus as amended, which is available at funds.mfs.com or upon request at 1‑800‑225‑2606.
This report describes certain changes to the Fund that occurred during the reporting period.
FUND EXPENSES
What were the fund costs for the last year?
| (based on a hypothetical $10,000 investment) | ||
| Class Name | Costs of a $10,000 investment | Costs paid as a percentage of a $10,000 investment |
| B | $175 | 1.77% |
MANAGEMENT'S DISCUSSION OF FUND PERFORMANCE
-
For the twelve months ended August 31, 2026, Class B shares of the MFS Mid Cap Growth Fund (fund) provided a total return of ‑2.22%, at net asset value. This compares with a return of 20.10% for the fund’s benchmark, the Russell 3000® Index. The fund's other benchmark, the Russell Midcap® Growth Index, generated a return of ‑1.16%.
-
Global equity markets reached record levels during the period, withstanding considerable volatility amid tariffs, geopolitical conflict and high levels of uncertainty. A new geopolitical event distressed markets as US and Israeli forces launched strikes against Iran, disrupting Mideast oil and natural gas exports. During the period, renewed focus on defense and infrastructure spending brightened the economic outlook in Europe while in Japan, the election of a pro-growth prime minister sent stocks to new highs. Optimism over artificial intelligence remained high globally.
-
While the US Supreme Court struck down part of the Trump administration’s tariff strategy, the administration began deploying other authorities to largely replace the ones that were ruled unconstitutional.
-
Higher energy prices and the lingering impact from tariffs kept inflation elevated in the US, prompting the Federal Reserve to end its easing cycle. Both the European Central Bank and the Bank of Japan raised rates toward the end of the period.
-
In fixed income markets, previously range-bound global bond yields climbed following the February 2026 onset of the conflict in the Middle East and as investors appeared to price in greater fiscal and monetary uncertainty. During the Iran war, global credit spreads widened modestly before stabilizing near pre-conflict levels, supported by strong demand and resilient underlying fundamentals. Similarly, US rate volatility (as measured by the Merrill Lynch Option Volatility Estimate (MOVE) Index) rose from intra-period lows before retracting back near prior levels.
-
Top contributors to performance relative to the Russell Midcap® Growth Index:
-
Stock selection within the health care sector strengthened the fund's relative performance.
-
-
Top detractors from performance relative to the Russell Midcap® Growth Index:
-
Stock selection within both the energy and materials sectors held back relative performance.
-
The fund's underweight position in the industrials sector also weakened relative returns.
-
FUND PERFORMANCE
The fund’s past performance is not a good predictor of the fund’s future performance. The graph and table below do not reflect the deduction of taxes that a shareholder would pay on fund distributions or the redemption of fund shares. The graph and table below assume reinvestment of dividends and capital gain distributions.
Growth of a Hypothetical $10,000 Investment
This graph shows the performance of a hypothetical $10,000 investment in Class B over a ten year period or since inception, if shorter, in comparison to (i) a broad measure of market performance and (ii) an additional index that MFS believes more closely reflects the market segments in which the fund invests.
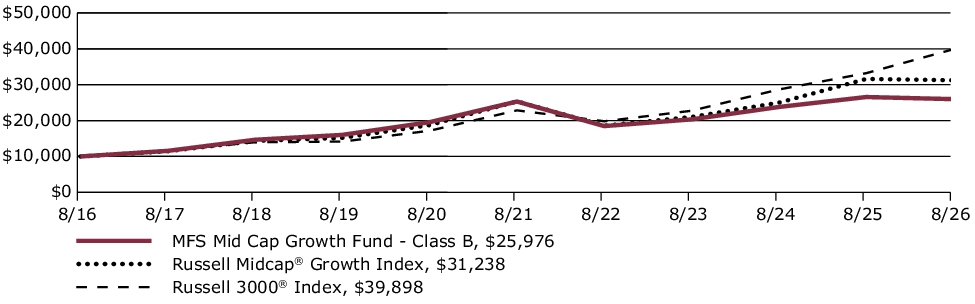
Average Annual Total Returns through 8/31/26
This table shows the average annual total returns of the class of shares noted for the periods shown, both with (if any) and without sales charges. It also shows the average annual total returns of (i) a broad measure of market performance and (ii) an additional index that MFS believes more closely reflects the market segments in which the fund invests, over the same periods.
| Share Class | 1-yr | 5-yr | 10-yr |
| B without sales charge | (2.22)% | 0.52% | 10.02% |
| B with CDSC (declining over six years from 4% to 0%)× | (5.39)% | 0.24% | 10.02% |
| Comparative Benchmark(s) | |||
| Russell 3000® Index ∆ | 20.10% | 11.80% | 14.84% |
| Russell Midcap® Growth Index ∆ | (1.16)% | 4.27% | 12.06% |
|
∆
|
Source: FactSet Research Systems Inc.
|
|
×
|
Assuming redemption at the end of the applicable period.
|
Visit mfs.com/perf/b for more recent performance information.
FUND STATISTICS AS OF 8/31/26
| Net Assets ($): | 12,963,583,519 | Total Management Fee ($)#: | 87,122,303 | |
| Total Number of Holdings: | 105 | Portfolio Turnover Rate (%): | 64 |
# Includes the effect of any management fee waivers, if applicable.
Where the fund holds derivatives, they are not included in the total number of portfolio holdings.
PORTFOLIO COMPOSITION (BASED ON TOTAL INVESTMENTS AS OF 8/31/26)
Portfolio structure
| Equities | 99.0% |
| Money Market Funds | 1.0% |
Equity sectors
| Information Technology | 27.4% |
| Health Care | 20.2% |
| Industrials | 16.9% |
| Communication Services | 9.6% |
| Consumer Discretionary | 8.2% |
| Energy | 7.1% |
| Financials | 5.1% |
| Materials | 2.7% |
| Consumer Staples | 0.8% |
| Utilities | 0.8% |
| Real Estate | 0.2% |
Top ten holdings
| Natera, Inc. | 3.4% |
| Live Nation Entertainment, Inc. | 3.0% |
| Cloudflare, Inc., "A" | 2.9% |
| Snowflake, Inc., "A" | 2.7% |
| Monolithic Power Systems, Inc. | 2.7% |
| Ascendis Pharma A.S., ADR | 2.6% |
| Revolution Medicines, Inc. | 2.5% |
| Take-Two Interactive Software, Inc. | 2.4% |
| Robinhood Markets, Inc. | 2.1% |
| Axon Enterprise, Inc. | 2.1% |
MFS uses the Global Industry Classification Standard (GICS®) for sector/industry reporting. MFS has applied its own internal sector/industry classification methodology for equity securities and non-equity securities that are unclassified by GICS.
Top ten holdings
| Natera, Inc. | 3.4% |
| Live Nation Entertainment, Inc. | 3.0% |
| Cloudflare, Inc., "A" | 2.9% |
| Snowflake, Inc., "A" | 2.7% |
| Monolithic Power Systems, Inc. | 2.7% |
| Ascendis Pharma A.S., ADR | 2.6% |
| Revolution Medicines, Inc. | 2.5% |
| Take-Two Interactive Software, Inc. | 2.4% |
| Robinhood Markets, Inc. | 2.1% |
| Axon Enterprise, Inc. | 2.1% |
MATERIAL FUND CHANGES
This is a summary of certain changes to the fund since September 1, 2025. For more complete information, you may review the fund's prospectus as amended, which is available at funds.mfs.com or upon request at 1‑800‑225‑2606.
Effective June 10, 2026, the MFS Mid Cap Growth Fund revised its existing policy to invest at least 80% of its net assets in issuers with medium market capitalizations to reflect that the Fund will invest at least 80% of its net assets in growth companies with medium market capitalizations and expanded on the factors used to define issuers with medium market capitalizations and growth companies.
Effective June 10, 2026, the MFS Mid Cap Growth Fund revised its existing policy to invest at least 80% of its net assets in issuers with medium market capitalizations to reflect that the Fund will invest at least 80% of its net assets in growth companies with medium market capitalizations and expanded on the factors used to define issuers with medium market capitalizations and growth companies.
This is a summary of certain changes to the fund since September 1, 2025. For more complete information, you may review the fund's prospectus as amended, which is available at funds.mfs.com or upon request at 1‑800‑225‑2606.
This report describes certain changes to the Fund that occurred during the reporting period.
FUND EXPENSES
What were the fund costs for the last year?
| (based on a hypothetical $10,000 investment) | ||
| Class Name | Costs of a $10,000 investment | Costs paid as a percentage of a $10,000 investment |
| A | $101 | 1.02% |
MANAGEMENT'S DISCUSSION OF FUND PERFORMANCE
-
For the twelve months ended August 31, 2026, Class A shares of the MFS Mid Cap Growth Fund (fund) provided a total return of ‑1.50%, at net asset value. This compares with a return of 20.10% for the fund’s benchmark, the Russell 3000® Index. The fund's other benchmark, the Russell Midcap® Growth Index, generated a return of ‑1.16%.
-
Global equity markets reached record levels during the period, withstanding considerable volatility amid tariffs, geopolitical conflict and high levels of uncertainty. A new geopolitical event distressed markets as US and Israeli forces launched strikes against Iran, disrupting Mideast oil and natural gas exports. During the period, renewed focus on defense and infrastructure spending brightened the economic outlook in Europe while in Japan, the election of a pro-growth prime minister sent stocks to new highs. Optimism over artificial intelligence remained high globally.
-
While the US Supreme Court struck down part of the Trump administration’s tariff strategy, the administration began deploying other authorities to largely replace the ones that were ruled unconstitutional.
-
Higher energy prices and the lingering impact from tariffs kept inflation elevated in the US, prompting the Federal Reserve to end its easing cycle. Both the European Central Bank and the Bank of Japan raised rates toward the end of the period.
-
In fixed income markets, previously range-bound global bond yields climbed following the February 2026 onset of the conflict in the Middle East and as investors appeared to price in greater fiscal and monetary uncertainty. During the Iran war, global credit spreads widened modestly before stabilizing near pre-conflict levels, supported by strong demand and resilient underlying fundamentals. Similarly, US rate volatility (as measured by the Merrill Lynch Option Volatility Estimate (MOVE) Index) rose from intra-period lows before retracting back near prior levels.
-
Top contributors to performance relative to the Russell Midcap® Growth Index:
-
Stock selection within the health care sector strengthened the fund's relative performance.
-
-
Top detractors from performance relative to the Russell Midcap® Growth Index:
-
Stock selection within both the energy and materials sectors held back relative performance.
-
The fund's underweight position in the industrials sector also weakened relative returns.
-
FUND PERFORMANCE
The fund’s past performance is not a good predictor of the fund’s future performance. The graph and table below do not reflect the deduction of taxes that a shareholder would pay on fund distributions or the redemption of fund shares. The graph and table below assume reinvestment of dividends and capital gain distributions.
Growth of a Hypothetical $10,000 Investment
This graph shows the performance of a hypothetical $10,000 investment in Class A over a ten year period or since inception, if shorter, in comparison to (i) a broad measure of market performance and (ii) an additional index that MFS believes more closely reflects the market segments in which the fund invests. This graph includes the deduction of the maximum applicable sales charge.
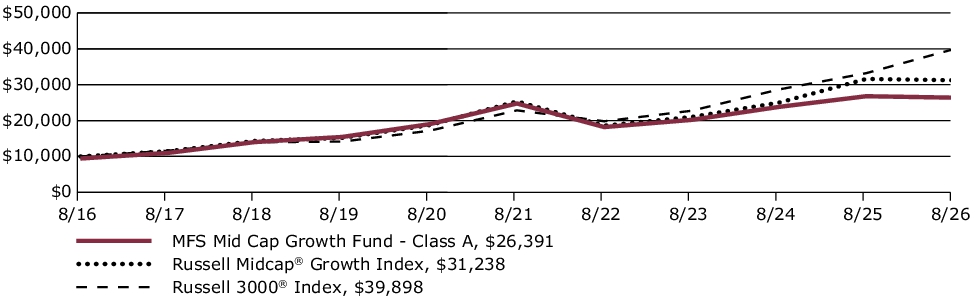
Average Annual Total Returns through 8/31/26
This table shows the average annual total returns of the class of shares noted for the periods shown, both with (if any) and without sales charges. It also shows the average annual total returns of (i) a broad measure of market performance and (ii) an additional index that MFS believes more closely reflects the market segments in which the fund invests, over the same periods.
| Share Class | 1-yr | 5-yr | 10-yr |
| A without sales charge | (1.50)% | 1.28% | 10.85% |
| A with initial sales charge (5.75%) | (7.16)% | 0.09% | 10.19% |
| Comparative Benchmark(s) | |||
| Russell 3000® Index ∆ | 20.10% | 11.80% | 14.84% |
| Russell Midcap® Growth Index ∆ | (1.16)% | 4.27% | 12.06% |
|
∆
|
Source: FactSet Research Systems Inc.
|
Visit mfs.com/perf/a for more recent performance information.
FUND STATISTICS AS OF 8/31/26
| Net Assets ($): | 12,963,583,519 | Total Management Fee ($)#: | 87,122,303 | |
| Total Number of Holdings: | 105 | Portfolio Turnover Rate (%): | 64 |
# Includes the effect of any management fee waivers, if applicable.
Where the fund holds derivatives, they are not included in the total number of portfolio holdings.
PORTFOLIO COMPOSITION (BASED ON TOTAL INVESTMENTS AS OF 8/31/26)
Portfolio structure
| Equities | 99.0% |
| Money Market Funds | 1.0% |
Equity sectors
| Information Technology | 27.4% |
| Health Care | 20.2% |
| Industrials | 16.9% |
| Communication Services | 9.6% |
| Consumer Discretionary | 8.2% |
| Energy | 7.1% |
| Financials | 5.1% |
| Materials | 2.7% |
| Consumer Staples | 0.8% |
| Utilities | 0.8% |
| Real Estate | 0.2% |
Top ten holdings
| Natera, Inc. | 3.4% |
| Live Nation Entertainment, Inc. | 3.0% |
| Cloudflare, Inc., "A" | 2.9% |
| Snowflake, Inc., "A" | 2.7% |
| Monolithic Power Systems, Inc. | 2.7% |
| Ascendis Pharma A.S., ADR | 2.6% |
| Revolution Medicines, Inc. | 2.5% |
| Take-Two Interactive Software, Inc. | 2.4% |
| Robinhood Markets, Inc. | 2.1% |
| Axon Enterprise, Inc. | 2.1% |
MFS uses the Global Industry Classification Standard (GICS®) for sector/industry reporting. MFS has applied its own internal sector/industry classification methodology for equity securities and non-equity securities that are unclassified by GICS.
Top ten holdings
| Natera, Inc. | 3.4% |
| Live Nation Entertainment, Inc. | 3.0% |
| Cloudflare, Inc., "A" | 2.9% |
| Snowflake, Inc., "A" | 2.7% |
| Monolithic Power Systems, Inc. | 2.7% |
| Ascendis Pharma A.S., ADR | 2.6% |
| Revolution Medicines, Inc. | 2.5% |
| Take-Two Interactive Software, Inc. | 2.4% |
| Robinhood Markets, Inc. | 2.1% |
| Axon Enterprise, Inc. | 2.1% |
MATERIAL FUND CHANGES
This is a summary of certain changes to the fund since September 1, 2025. For more complete information, you may review the fund's prospectus as amended, which is available at funds.mfs.com or upon request at 1‑800‑225‑2606.
Effective June 10, 2026, the MFS Mid Cap Growth Fund revised its existing policy to invest at least 80% of its net assets in issuers with medium market capitalizations to reflect that the Fund will invest at least 80% of its net assets in growth companies with medium market capitalizations and expanded on the factors used to define issuers with medium market capitalizations and growth companies.
Effective June 10, 2026, the MFS Mid Cap Growth Fund revised its existing policy to invest at least 80% of its net assets in issuers with medium market capitalizations to reflect that the Fund will invest at least 80% of its net assets in growth companies with medium market capitalizations and expanded on the factors used to define issuers with medium market capitalizations and growth companies.
This is a summary of certain changes to the fund since September 1, 2025. For more complete information, you may review the fund's prospectus as amended, which is available at funds.mfs.com or upon request at 1‑800‑225‑2606.
FUND EXPENSES
What were the fund costs for the last year?
| (based on a hypothetical $10,000 investment) | ||
| Fund Name | Costs of a $10,000 investment | Costs paid as a percentage of a $10,000 investment |
| MFS U.S. Government Money Market Fund | $46 | 0.45% |
FUND STATISTICS AS OF 8/31/26
| Net Assets ($): | 308,123,845 | Total Management Fee ($)#: | $1,278,016 | |
| Total Number of Holdings: | 23 |
# Includes the effect of any management fee waivers, if applicable.
PORTFOLIO COMPOSITION (BASED ON TOTAL INVESTMENTS AS OF 8/31/26)
Portfolio structure
| U.S. Treasury and U.S. Government Agency Securities and Equivalents | 62.3% |
| Repurchase Agreements, collateralized by U.S. Treasury and/or U.S. Government Agency Securities | 37.7% |
Composition including fixed income credit
quality
quality
| A-1+ | 51.6% |
| A-1 | 48.4% |
Maturity breakdown
| 0 - 7 days | 44.8% |
| 8 - 29 days | 5.5% |
| 30 - 59 days | 32.3% |
| 60 - 89 days | 8.9% |
| 90 - 365 days | 8.5% |
Ratings are assigned to portfolio securities utilizing ratings from Moody’s, Fitch, and Standard & Poor’s rating agencies and applying the following hierarchy: If all three agencies provide a rating, the middle rating (after dropping the highest and lowest ratings) is assigned; if two of the three agencies rate a security, the lower of the two is assigned. Ratings are shown in the S&P scale. All ratings are subject to change. The fund did not hold unrated securities. The fund is not rated by these agencies.
Ratings are assigned to portfolio securities utilizing ratings from Moody’s, Fitch, and Standard & Poor’s rating agencies and applying the following hierarchy: If all three agencies provide a rating, the middle rating (after dropping the highest and lowest ratings) is assigned; if two of the three agencies rate a security, the lower of the two is assigned. Ratings are shown in the S&P scale. All ratings are subject to change. The fund did not hold unrated securities. The fund is not rated by these agencies.
FUND EXPENSES
What were the fund costs for the last year?
| (based on a hypothetical $10,000 investment) | ||
| Class Name | Costs of a $10,000 investment | Costs paid as a percentage of a $10,000 investment |
| R6 | $105 | 1.01% |
MANAGEMENT'S DISCUSSION OF FUND PERFORMANCE
-
For the twelve months ended August 31, 2026, Class R6 shares of the MFS Global New Discovery Fund (fund) provided a total return of 6.96%, at net asset value. This compares with a return of 22.35% for the fund’s benchmark, the MSCI All Country World Index (net div). The fund's other benchmark, the MSCI All Country World Small Mid Cap Index (net div), generated a return of 19.70%.
-
Global equity markets reached record levels during the period, withstanding considerable volatility amid tariffs, geopolitical conflict and high levels of uncertainty. A new geopolitical event distressed markets as US and Israeli forces launched strikes against Iran, disrupting Mideast oil and natural gas exports. During the period, renewed focus on defense and infrastructure spending brightened the economic outlook in Europe while in Japan, the election of a pro-growth prime minister sent stocks to new highs. Optimism over artificial intelligence remained high globally.
-
While the US Supreme Court struck down part of the Trump administration’s tariff strategy, the administration began deploying other authorities to largely replace the ones that were ruled unconstitutional.
-
Higher energy prices and the lingering impact from tariffs kept inflation elevated in the US, prompting the Federal Reserve to end its easing cycle. Both the European Central Bank and the Bank of Japan raised rates toward the end of the period.
-
In fixed income markets, previously range-bound global bond yields climbed following the February 2026 onset of the conflict in the Middle East and as investors appeared to price in greater fiscal and monetary uncertainty. During the Iran war, global credit spreads widened modestly before stabilizing near pre-conflict levels, supported by strong demand and resilient underlying fundamentals. Similarly, US rate volatility (as measured by the Merrill Lynch Option Volatility Estimate (MOVE) Index) rose from intra-period lows before retracting back near prior levels.
-
Top contributors to performance relative to the MSCI All Country World Small Mid Cap Index:
-
Stock selection and underweight positions in both the real estate and financials sectors aided relative performance.
-
The fund's avoidance of the utilities sector also benefited relative returns.
-
-
Top detractors from performance relative to the MSCI All Country World Small Mid Cap Index:
-
Stock selection and an underweight position in the information technology sector weighed on the fund's relative performance.
-
Stock selection within both the industrials and materials sectors also hindered relative results.
-
FUND PERFORMANCE
The fund’s past performance is not a good predictor of the fund’s future performance. The graph and table below do not reflect the deduction of taxes that a shareholder would pay on fund distributions or the redemption of fund shares. The graph and table below assume reinvestment of dividends and capital gain distributions.
Growth of a Hypothetical $10,000 Investment
This graph shows the performance of a hypothetical $10,000 investment in Class R6 over a ten year period or since inception, if shorter, in comparison to (i) a broad measure of market performance and (ii) an additional index that MFS believes more closely reflects the market segments in which the fund invests.
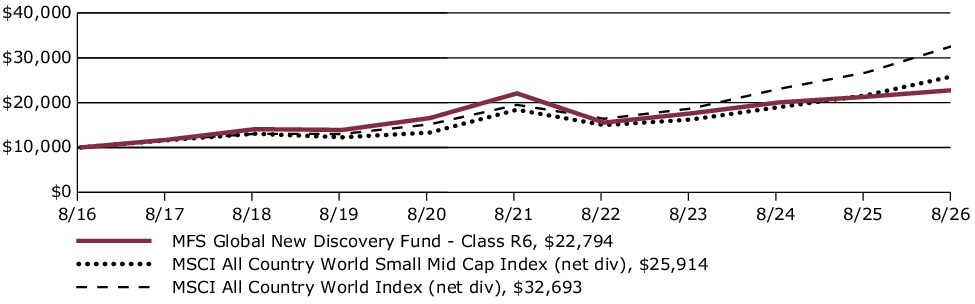
Average Annual Total Returns through 8/31/26
This table shows the average annual total returns of the class of shares noted for the periods shown, both with (if any) and without sales charges. It also shows the average annual total returns of (i) a broad measure of market performance and (ii) an additional index that MFS believes more closely reflects the market segments in which the fund invests, over the same periods.
| Share Class | 1-yr | 5-yr | 10-yr |
| R6 without sales charge | 6.96% | 0.65% | 8.59% |
| Comparative Benchmark(s) | |||
| MSCI All Country World Index (net div) ∆ | 22.35% | 10.88% | 12.58% |
| MSCI All Country World Small Mid Cap Index (net div) ∆ | 19.70% | 7.07% | 9.99% |
|
∆
|
Source: FactSet Research Systems Inc.
|
Visit mfs.com/perf/r6 for more recent performance information.
FUND STATISTICS AS OF 8/31/26
| Net Assets ($): | 67,121,542 | Total Management Fee ($)#: | 658,524 | |
| Total Number of Holdings: | 111 | Portfolio Turnover Rate (%): | 51 |
# Includes the effect of any management fee waivers, if applicable.
Where the fund holds derivatives, they are not included in the total number of portfolio holdings.
PORTFOLIO COMPOSITION (BASED ON TOTAL INVESTMENTS AS OF 8/31/26)
Portfolio structure
| Equities | 98.8% |
| Money Market Funds | 1.2% |
Top ten holdings
| GFL Environmental, Inc. | 1.8% |
| TechnipFMC PLC | 1.7% |
| OBIC Co. Ltd. | 1.7% |
| Cranswick PLC | 1.5% |
| Okta, Inc. | 1.5% |
| STERIS PLC | 1.5% |
| Shizuoka Financial Group, Inc. | 1.4% |
| Elis S.A. | 1.4% |
| Euronext N.V. | 1.4% |
| Charles River Laboratories International, Inc. | 1.4% |
Issuer country weightings
| United States | 42.8% |
| Japan | 12.2% |
| United Kingdom | 9.2% |
| Canada | 7.2% |
| Germany | 6.0% |
| France | 5.0% |
| Australia | 3.6% |
| Norway | 2.2% |
| Brazil | 2.1% |
| Other Countries | 9.7% |
Top ten holdings
| GFL Environmental, Inc. | 1.8% |
| TechnipFMC PLC | 1.7% |
| OBIC Co. Ltd. | 1.7% |
| Cranswick PLC | 1.5% |
| Okta, Inc. | 1.5% |
| STERIS PLC | 1.5% |
| Shizuoka Financial Group, Inc. | 1.4% |
| Elis S.A. | 1.4% |
| Euronext N.V. | 1.4% |
| Charles River Laboratories International, Inc. | 1.4% |
FUND EXPENSES
What were the fund costs for the last year?
| (based on a hypothetical $10,000 investment) | ||
| Class Name | Costs of a $10,000 investment | Costs paid as a percentage of a $10,000 investment |
| R4 | $114 | 1.10% |
MANAGEMENT'S DISCUSSION OF FUND PERFORMANCE
-
For the twelve months ended August 31, 2026, Class R4 shares of the MFS Global New Discovery Fund (fund) provided a total return of 6.89%, at net asset value. This compares with a return of 22.35% for the fund’s benchmark, the MSCI All Country World Index (net div). The fund's other benchmark, the MSCI All Country World Small Mid Cap Index (net div), generated a return of 19.70%.
-
Global equity markets reached record levels during the period, withstanding considerable volatility amid tariffs, geopolitical conflict and high levels of uncertainty. A new geopolitical event distressed markets as US and Israeli forces launched strikes against Iran, disrupting Mideast oil and natural gas exports. During the period, renewed focus on defense and infrastructure spending brightened the economic outlook in Europe while in Japan, the election of a pro-growth prime minister sent stocks to new highs. Optimism over artificial intelligence remained high globally.
-
While the US Supreme Court struck down part of the Trump administration’s tariff strategy, the administration began deploying other authorities to largely replace the ones that were ruled unconstitutional.
-
Higher energy prices and the lingering impact from tariffs kept inflation elevated in the US, prompting the Federal Reserve to end its easing cycle. Both the European Central Bank and the Bank of Japan raised rates toward the end of the period.
-
In fixed income markets, previously range-bound global bond yields climbed following the February 2026 onset of the conflict in the Middle East and as investors appeared to price in greater fiscal and monetary uncertainty. During the Iran war, global credit spreads widened modestly before stabilizing near pre-conflict levels, supported by strong demand and resilient underlying fundamentals. Similarly, US rate volatility (as measured by the Merrill Lynch Option Volatility Estimate (MOVE) Index) rose from intra-period lows before retracting back near prior levels.
-
Top contributors to performance relative to the MSCI All Country World Small Mid Cap Index:
-
Stock selection and underweight positions in both the real estate and financials sectors aided relative performance.
-
The fund's avoidance of the utilities sector also benefited relative returns.
-
-
Top detractors from performance relative to the MSCI All Country World Small Mid Cap Index:
-
Stock selection and an underweight position in the information technology sector weighed on the fund's relative performance.
-
Stock selection within both the industrials and materials sectors also hindered relative results.
-
FUND PERFORMANCE
The fund’s past performance is not a good predictor of the fund’s future performance. The graph and table below do not reflect the deduction of taxes that a shareholder would pay on fund distributions or the redemption of fund shares. The graph and table below assume reinvestment of dividends and capital gain distributions.
Growth of a Hypothetical $10,000 Investment
This graph shows the performance of a hypothetical $10,000 investment in Class R4 over a ten year period or since inception, if shorter, in comparison to (i) a broad measure of market performance and (ii) an additional index that MFS believes more closely reflects the market segments in which the fund invests.
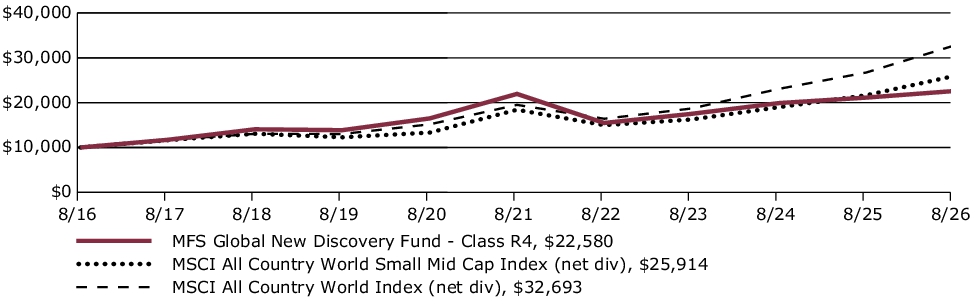
Average Annual Total Returns through 8/31/26
This table shows the average annual total returns of the class of shares noted for the periods shown, both with (if any) and without sales charges. It also shows the average annual total returns of (i) a broad measure of market performance and (ii) an additional index that MFS believes more closely reflects the market segments in which the fund invests, over the same periods.
| Share Class | 1-yr | 5-yr | 10-yr |
| R4 without sales charge | 6.89% | 0.57% | 8.49% |
| Comparative Benchmark(s) | |||
| MSCI All Country World Index (net div) ∆ | 22.35% | 10.88% | 12.58% |
| MSCI All Country World Small Mid Cap Index (net div) ∆ | 19.70% | 7.07% | 9.99% |
|
∆
|
Source: FactSet Research Systems Inc.
|
Visit mfs.com/perf/r4 for more recent performance information.
FUND STATISTICS AS OF 8/31/26
| Net Assets ($): | 67,121,542 | Total Management Fee ($)#: | 658,524 | |
| Total Number of Holdings: | 111 | Portfolio Turnover Rate (%): | 51 |
# Includes the effect of any management fee waivers, if applicable.
Where the fund holds derivatives, they are not included in the total number of portfolio holdings.
PORTFOLIO COMPOSITION (BASED ON TOTAL INVESTMENTS AS OF 8/31/26)
Portfolio structure
| Equities | 98.8% |
| Money Market Funds | 1.2% |
Top ten holdings
| GFL Environmental, Inc. | 1.8% |
| TechnipFMC PLC | 1.7% |
| OBIC Co. Ltd. | 1.7% |
| Cranswick PLC | 1.5% |
| Okta, Inc. | 1.5% |
| STERIS PLC | 1.5% |
| Shizuoka Financial Group, Inc. | 1.4% |
| Elis S.A. | 1.4% |
| Euronext N.V. | 1.4% |
| Charles River Laboratories International, Inc. | 1.4% |
Issuer country weightings
| United States | 42.8% |
| Japan | 12.2% |
| United Kingdom | 9.2% |
| Canada | 7.2% |
| Germany | 6.0% |
| France | 5.0% |
| Australia | 3.6% |
| Norway | 2.2% |
| Brazil | 2.1% |
| Other Countries | 9.7% |
Top ten holdings
| GFL Environmental, Inc. | 1.8% |
| TechnipFMC PLC | 1.7% |
| OBIC Co. Ltd. | 1.7% |
| Cranswick PLC | 1.5% |
| Okta, Inc. | 1.5% |
| STERIS PLC | 1.5% |
| Shizuoka Financial Group, Inc. | 1.4% |
| Elis S.A. | 1.4% |
| Euronext N.V. | 1.4% |
| Charles River Laboratories International, Inc. | 1.4% |
FUND EXPENSES
What were the fund costs for the last year?
| (based on a hypothetical $10,000 investment) | ||
| Class Name | Costs of a $10,000 investment | Costs paid as a percentage of a $10,000 investment |
| R3 | $139 | 1.35% |
MANAGEMENT'S DISCUSSION OF FUND PERFORMANCE
-
For the twelve months ended August 31, 2026, Class R3 shares of the MFS Global New Discovery Fund (fund) provided a total return of 6.60%, at net asset value. This compares with a return of 22.35% for the fund’s benchmark, the MSCI All Country World Index (net div). The fund's other benchmark, the MSCI All Country World Small Mid Cap Index (net div), generated a return of 19.70%.
-
Global equity markets reached record levels during the period, withstanding considerable volatility amid tariffs, geopolitical conflict and high levels of uncertainty. A new geopolitical event distressed markets as US and Israeli forces launched strikes against Iran, disrupting Mideast oil and natural gas exports. During the period, renewed focus on defense and infrastructure spending brightened the economic outlook in Europe while in Japan, the election of a pro-growth prime minister sent stocks to new highs. Optimism over artificial intelligence remained high globally.
-
While the US Supreme Court struck down part of the Trump administration’s tariff strategy, the administration began deploying other authorities to largely replace the ones that were ruled unconstitutional.
-
Higher energy prices and the lingering impact from tariffs kept inflation elevated in the US, prompting the Federal Reserve to end its easing cycle. Both the European Central Bank and the Bank of Japan raised rates toward the end of the period.
-
In fixed income markets, previously range-bound global bond yields climbed following the February 2026 onset of the conflict in the Middle East and as investors appeared to price in greater fiscal and monetary uncertainty. During the Iran war, global credit spreads widened modestly before stabilizing near pre-conflict levels, supported by strong demand and resilient underlying fundamentals. Similarly, US rate volatility (as measured by the Merrill Lynch Option Volatility Estimate (MOVE) Index) rose from intra-period lows before retracting back near prior levels.
-
Top contributors to performance relative to the MSCI All Country World Small Mid Cap Index:
-
Stock selection and underweight positions in both the real estate and financials sectors aided relative performance.
-
The fund's avoidance of the utilities sector also benefited relative returns.
-
-
Top detractors from performance relative to the MSCI All Country World Small Mid Cap Index:
-
Stock selection and an underweight position in the information technology sector weighed on the fund's relative performance.
-
Stock selection within both the industrials and materials sectors also hindered relative results.
-
FUND PERFORMANCE
The fund’s past performance is not a good predictor of the fund’s future performance. The graph and table below do not reflect the deduction of taxes that a shareholder would pay on fund distributions or the redemption of fund shares. The graph and table below assume reinvestment of dividends and capital gain distributions.
Growth of a Hypothetical $10,000 Investment
This graph shows the performance of a hypothetical $10,000 investment in Class R3 over a ten year period or since inception, if shorter, in comparison to (i) a broad measure of market performance and (ii) an additional index that MFS believes more closely reflects the market segments in which the fund invests.
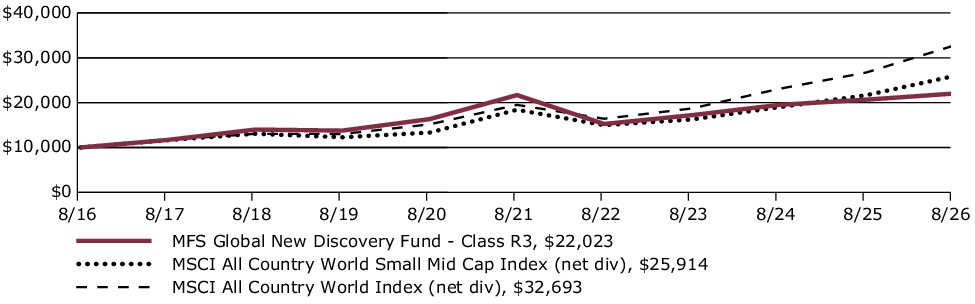
Average Annual Total Returns through 8/31/26
This table shows the average annual total returns of the class of shares noted for the periods shown, both with (if any) and without sales charges. It also shows the average annual total returns of (i) a broad measure of market performance and (ii) an additional index that MFS believes more closely reflects the market segments in which the fund invests, over the same periods.
| Share Class | 1-yr | 5-yr | 10-yr |
| R3 without sales charge | 6.60% | 0.31% | 8.21% |
| Comparative Benchmark(s) | |||
| MSCI All Country World Index (net div) ∆ | 22.35% | 10.88% | 12.58% |
| MSCI All Country World Small Mid Cap Index (net div) ∆ | 19.70% | 7.07% | 9.99% |
|
∆
|
Source: FactSet Research Systems Inc.
|
Visit mfs.com/perf/r3 for more recent performance information.
FUND STATISTICS AS OF 8/31/26
| Net Assets ($): | 67,121,542 | Total Management Fee ($)#: | 658,524 | |
| Total Number of Holdings: | 111 | Portfolio Turnover Rate (%): | 51 |
# Includes the effect of any management fee waivers, if applicable.
Where the fund holds derivatives, they are not included in the total number of portfolio holdings.
PORTFOLIO COMPOSITION (BASED ON TOTAL INVESTMENTS AS OF 8/31/26)
Portfolio structure
| Equities | 98.8% |
| Money Market Funds | 1.2% |
Top ten holdings
| GFL Environmental, Inc. | 1.8% |
| TechnipFMC PLC | 1.7% |
| OBIC Co. Ltd. | 1.7% |
| Cranswick PLC | 1.5% |
| Okta, Inc. | 1.5% |
| STERIS PLC | 1.5% |
| Shizuoka Financial Group, Inc. | 1.4% |
| Elis S.A. | 1.4% |
| Euronext N.V. | 1.4% |
| Charles River Laboratories International, Inc. | 1.4% |
Issuer country weightings
| United States | 42.8% |
| Japan | 12.2% |
| United Kingdom | 9.2% |
| Canada | 7.2% |
| Germany | 6.0% |
| France | 5.0% |
| Australia | 3.6% |
| Norway | 2.2% |
| Brazil | 2.1% |
| Other Countries | 9.7% |
Top ten holdings
| GFL Environmental, Inc. | 1.8% |
| TechnipFMC PLC | 1.7% |
| OBIC Co. Ltd. | 1.7% |
| Cranswick PLC | 1.5% |
| Okta, Inc. | 1.5% |
| STERIS PLC | 1.5% |
| Shizuoka Financial Group, Inc. | 1.4% |
| Elis S.A. | 1.4% |
| Euronext N.V. | 1.4% |
| Charles River Laboratories International, Inc. | 1.4% |
FUND EXPENSES
What were the fund costs for the last year?
| (based on a hypothetical $10,000 investment) | ||
| Class Name | Costs of a $10,000 investment | Costs paid as a percentage of a $10,000 investment |
| R2 | $165 | 1.60% |
MANAGEMENT'S DISCUSSION OF FUND PERFORMANCE
-
For the twelve months ended August 31, 2026, Class R2 shares of the MFS Global New Discovery Fund (fund) provided a total return of 6.34%, at net asset value. This compares with a return of 22.35% for the fund’s benchmark, the MSCI All Country World Index (net div). The fund's other benchmark, the MSCI All Country World Small Mid Cap Index (net div), generated a return of 19.70%.
-
Global equity markets reached record levels during the period, withstanding considerable volatility amid tariffs, geopolitical conflict and high levels of uncertainty. A new geopolitical event distressed markets as US and Israeli forces launched strikes against Iran, disrupting Mideast oil and natural gas exports. During the period, renewed focus on defense and infrastructure spending brightened the economic outlook in Europe while in Japan, the election of a pro-growth prime minister sent stocks to new highs. Optimism over artificial intelligence remained high globally.
-
While the US Supreme Court struck down part of the Trump administration’s tariff strategy, the administration began deploying other authorities to largely replace the ones that were ruled unconstitutional.
-
Higher energy prices and the lingering impact from tariffs kept inflation elevated in the US, prompting the Federal Reserve to end its easing cycle. Both the European Central Bank and the Bank of Japan raised rates toward the end of the period.
-
In fixed income markets, previously range-bound global bond yields climbed following the February 2026 onset of the conflict in the Middle East and as investors appeared to price in greater fiscal and monetary uncertainty. During the Iran war, global credit spreads widened modestly before stabilizing near pre-conflict levels, supported by strong demand and resilient underlying fundamentals. Similarly, US rate volatility (as measured by the Merrill Lynch Option Volatility Estimate (MOVE) Index) rose from intra-period lows before retracting back near prior levels.
-
Top contributors to performance relative to the MSCI All Country World Small Mid Cap Index:
-
Stock selection and underweight positions in both the real estate and financials sectors aided relative performance.
-
The fund's avoidance of the utilities sector also benefited relative returns.
-
-
Top detractors from performance relative to the MSCI All Country World Small Mid Cap Index:
-
Stock selection and an underweight position in the information technology sector weighed on the fund's relative performance.
-
Stock selection within both the industrials and materials sectors also hindered relative results.
-
FUND PERFORMANCE
The fund’s past performance is not a good predictor of the fund’s future performance. The graph and table below do not reflect the deduction of taxes that a shareholder would pay on fund distributions or the redemption of fund shares. The graph and table below assume reinvestment of dividends and capital gain distributions.
Growth of a Hypothetical $10,000 Investment
This graph shows the performance of a hypothetical $10,000 investment in Class R2 over a ten year period or since inception, if shorter, in comparison to (i) a broad measure of market performance and (ii) an additional index that MFS believes more closely reflects the market segments in which the fund invests.
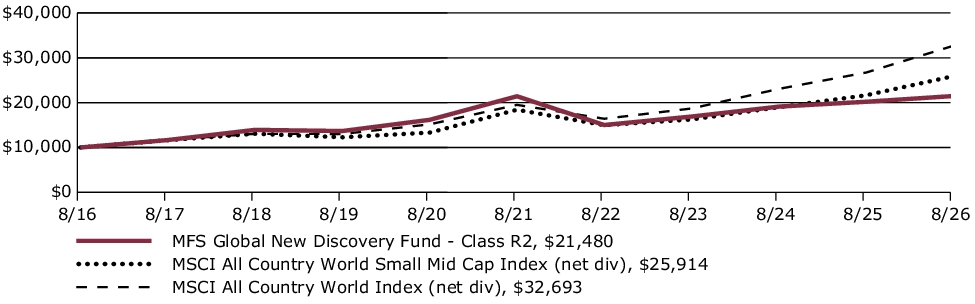
Average Annual Total Returns through 8/31/26
This table shows the average annual total returns of the class of shares noted for the periods shown, both with (if any) and without sales charges. It also shows the average annual total returns of (i) a broad measure of market performance and (ii) an additional index that MFS believes more closely reflects the market segments in which the fund invests, over the same periods.
| Share Class | 1-yr | 5-yr | 10-yr |
| R2 without sales charge | 6.34% | 0.06% | 7.95% |
| Comparative Benchmark(s) | |||
| MSCI All Country World Index (net div) ∆ | 22.35% | 10.88% | 12.58% |
| MSCI All Country World Small Mid Cap Index (net div) ∆ | 19.70% | 7.07% | 9.99% |
|
∆
|
Source: FactSet Research Systems Inc.
|
Visit mfs.com/perf/r2 for more recent performance information.
FUND STATISTICS AS OF 8/31/26
| Net Assets ($): | 67,121,542 | Total Management Fee ($)#: | 658,524 | |
| Total Number of Holdings: | 111 | Portfolio Turnover Rate (%): | 51 |
# Includes the effect of any management fee waivers, if applicable.
Where the fund holds derivatives, they are not included in the total number of portfolio holdings.
PORTFOLIO COMPOSITION (BASED ON TOTAL INVESTMENTS AS OF 8/31/26)
Portfolio structure
| Equities | 98.8% |
| Money Market Funds | 1.2% |
Top ten holdings
| GFL Environmental, Inc. | 1.8% |
| TechnipFMC PLC | 1.7% |
| OBIC Co. Ltd. | 1.7% |
| Cranswick PLC | 1.5% |
| Okta, Inc. | 1.5% |
| STERIS PLC | 1.5% |
| Shizuoka Financial Group, Inc. | 1.4% |
| Elis S.A. | 1.4% |
| Euronext N.V. | 1.4% |
| Charles River Laboratories International, Inc. | 1.4% |
Issuer country weightings
| United States | 42.8% |
| Japan | 12.2% |
| United Kingdom | 9.2% |
| Canada | 7.2% |
| Germany | 6.0% |
| France | 5.0% |
| Australia | 3.6% |
| Norway | 2.2% |
| Brazil | 2.1% |
| Other Countries | 9.7% |
Top ten holdings
| GFL Environmental, Inc. | 1.8% |
| TechnipFMC PLC | 1.7% |
| OBIC Co. Ltd. | 1.7% |
| Cranswick PLC | 1.5% |
| Okta, Inc. | 1.5% |
| STERIS PLC | 1.5% |
| Shizuoka Financial Group, Inc. | 1.4% |
| Elis S.A. | 1.4% |
| Euronext N.V. | 1.4% |
| Charles River Laboratories International, Inc. | 1.4% |
FUND EXPENSES
What were the fund costs for the last year?
| (based on a hypothetical $10,000 investment) | ||
| Class Name | Costs of a $10,000 investment | Costs paid as a percentage of a $10,000 investment |
| R1 | $216 | 2.10% |
MANAGEMENT'S DISCUSSION OF FUND PERFORMANCE
-
For the twelve months ended August 31, 2026, Class R1 shares of the MFS Global New Discovery Fund (fund) provided a total return of 5.84%, at net asset value. This compares with a return of 22.35% for the fund’s benchmark, the MSCI All Country World Index (net div). The fund's other benchmark, the MSCI All Country World Small Mid Cap Index (net div), generated a return of 19.70%.
-
Global equity markets reached record levels during the period, withstanding considerable volatility amid tariffs, geopolitical conflict and high levels of uncertainty. A new geopolitical event distressed markets as US and Israeli forces launched strikes against Iran, disrupting Mideast oil and natural gas exports. During the period, renewed focus on defense and infrastructure spending brightened the economic outlook in Europe while in Japan, the election of a pro-growth prime minister sent stocks to new highs. Optimism over artificial intelligence remained high globally.
-
While the US Supreme Court struck down part of the Trump administration’s tariff strategy, the administration began deploying other authorities to largely replace the ones that were ruled unconstitutional.
-
Higher energy prices and the lingering impact from tariffs kept inflation elevated in the US, prompting the Federal Reserve to end its easing cycle. Both the European Central Bank and the Bank of Japan raised rates toward the end of the period.
-
In fixed income markets, previously range-bound global bond yields climbed following the February 2026 onset of the conflict in the Middle East and as investors appeared to price in greater fiscal and monetary uncertainty. During the Iran war, global credit spreads widened modestly before stabilizing near pre-conflict levels, supported by strong demand and resilient underlying fundamentals. Similarly, US rate volatility (as measured by the Merrill Lynch Option Volatility Estimate (MOVE) Index) rose from intra-period lows before retracting back near prior levels.
-
Top contributors to performance relative to the MSCI All Country World Small Mid Cap Index:
-
Stock selection and underweight positions in both the real estate and financials sectors aided relative performance.
-
The fund's avoidance of the utilities sector also benefited relative returns.
-
-
Top detractors from performance relative to the MSCI All Country World Small Mid Cap Index:
-
Stock selection and an underweight position in the information technology sector weighed on the fund's relative performance.
-
Stock selection within both the industrials and materials sectors also hindered relative results.
-
FUND PERFORMANCE
The fund’s past performance is not a good predictor of the fund’s future performance. The graph and table below do not reflect the deduction of taxes that a shareholder would pay on fund distributions or the redemption of fund shares. The graph and table below assume reinvestment of dividends and capital gain distributions.
Growth of a Hypothetical $10,000 Investment
This graph shows the performance of a hypothetical $10,000 investment in Class R1 over a ten year period or since inception, if shorter, in comparison to (i) a broad measure of market performance and (ii) an additional index that MFS believes more closely reflects the market segments in which the fund invests.
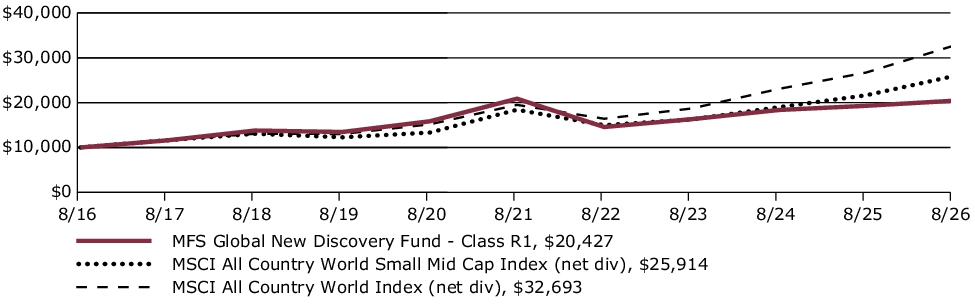
Average Annual Total Returns through 8/31/26
This table shows the average annual total returns of the class of shares noted for the periods shown, both with (if any) and without sales charges. It also shows the average annual total returns of (i) a broad measure of market performance and (ii) an additional index that MFS believes more closely reflects the market segments in which the fund invests, over the same periods.
| Share Class | 1-yr | 5-yr | 10-yr |
| R1 without sales charge | 5.84% | (0.43)% | 7.40% |
| Comparative Benchmark(s) | |||
| MSCI All Country World Index (net div) ∆ | 22.35% | 10.88% | 12.58% |
| MSCI All Country World Small Mid Cap Index (net div) ∆ | 19.70% | 7.07% | 9.99% |
|
∆
|
Source: FactSet Research Systems Inc.
|
Visit mfs.com/perf/r1 for more recent performance information.
FUND STATISTICS AS OF 8/31/26
| Net Assets ($): | 67,121,542 | Total Management Fee ($)#: | 658,524 | |
| Total Number of Holdings: | 111 | Portfolio Turnover Rate (%): | 51 |
# Includes the effect of any management fee waivers, if applicable.
Where the fund holds derivatives, they are not included in the total number of portfolio holdings.
PORTFOLIO COMPOSITION (BASED ON TOTAL INVESTMENTS AS OF 8/31/26)
Portfolio structure
| Equities | 98.8% |
| Money Market Funds | 1.2% |
Top ten holdings
| GFL Environmental, Inc. | 1.8% |
| TechnipFMC PLC | 1.7% |
| OBIC Co. Ltd. | 1.7% |
| Cranswick PLC | 1.5% |
| Okta, Inc. | 1.5% |
| STERIS PLC | 1.5% |
| Shizuoka Financial Group, Inc. | 1.4% |
| Elis S.A. | 1.4% |
| Euronext N.V. | 1.4% |
| Charles River Laboratories International, Inc. | 1.4% |
Issuer country weightings
| United States | 42.8% |
| Japan | 12.2% |
| United Kingdom | 9.2% |
| Canada | 7.2% |
| Germany | 6.0% |
| France | 5.0% |
| Australia | 3.6% |
| Norway | 2.2% |
| Brazil | 2.1% |
| Other Countries | 9.7% |
Top ten holdings
| GFL Environmental, Inc. | 1.8% |
| TechnipFMC PLC | 1.7% |
| OBIC Co. Ltd. | 1.7% |
| Cranswick PLC | 1.5% |
| Okta, Inc. | 1.5% |
| STERIS PLC | 1.5% |
| Shizuoka Financial Group, Inc. | 1.4% |
| Elis S.A. | 1.4% |
| Euronext N.V. | 1.4% |
| Charles River Laboratories International, Inc. | 1.4% |
FUND EXPENSES
What were the fund costs for the last year?
| (based on a hypothetical $10,000 investment) | ||
| Class Name | Costs of a $10,000 investment | Costs paid as a percentage of a $10,000 investment |
| I | $114 | 1.10% |
MANAGEMENT'S DISCUSSION OF FUND PERFORMANCE
-
For the twelve months ended August 31, 2026, Class I shares of the MFS Global New Discovery Fund (fund) provided a total return of 6.86%, at net asset value. This compares with a return of 22.35% for the fund’s benchmark, the MSCI All Country World Index (net div). The fund's other benchmark, the MSCI All Country World Small Mid Cap Index (net div), generated a return of 19.70%.
-
Global equity markets reached record levels during the period, withstanding considerable volatility amid tariffs, geopolitical conflict and high levels of uncertainty. A new geopolitical event distressed markets as US and Israeli forces launched strikes against Iran, disrupting Mideast oil and natural gas exports. During the period, renewed focus on defense and infrastructure spending brightened the economic outlook in Europe while in Japan, the election of a pro-growth prime minister sent stocks to new highs. Optimism over artificial intelligence remained high globally.
-
While the US Supreme Court struck down part of the Trump administration’s tariff strategy, the administration began deploying other authorities to largely replace the ones that were ruled unconstitutional.
-
Higher energy prices and the lingering impact from tariffs kept inflation elevated in the US, prompting the Federal Reserve to end its easing cycle. Both the European Central Bank and the Bank of Japan raised rates toward the end of the period.
-
In fixed income markets, previously range-bound global bond yields climbed following the February 2026 onset of the conflict in the Middle East and as investors appeared to price in greater fiscal and monetary uncertainty. During the Iran war, global credit spreads widened modestly before stabilizing near pre-conflict levels, supported by strong demand and resilient underlying fundamentals. Similarly, US rate volatility (as measured by the Merrill Lynch Option Volatility Estimate (MOVE) Index) rose from intra-period lows before retracting back near prior levels.
-
Top contributors to performance relative to the MSCI All Country World Small Mid Cap Index:
-
Stock selection and underweight positions in both the real estate and financials sectors aided relative performance.
-
The fund's avoidance of the utilities sector also benefited relative returns.
-
-
Top detractors from performance relative to the MSCI All Country World Small Mid Cap Index:
-
Stock selection and an underweight position in the information technology sector weighed on the fund's relative performance.
-
Stock selection within both the industrials and materials sectors also hindered relative results.
-
FUND PERFORMANCE
The fund’s past performance is not a good predictor of the fund’s future performance. The graph and table below do not reflect the deduction of taxes that a shareholder would pay on fund distributions or the redemption of fund shares. The graph and table below assume reinvestment of dividends and capital gain distributions.
Growth of a Hypothetical $10,000 Investment
This graph shows the performance of a hypothetical $10,000 investment in Class I over a ten year period or since inception, if shorter, in comparison to (i) a broad measure of market performance and (ii) an additional index that MFS believes more closely reflects the market segments in which the fund invests.
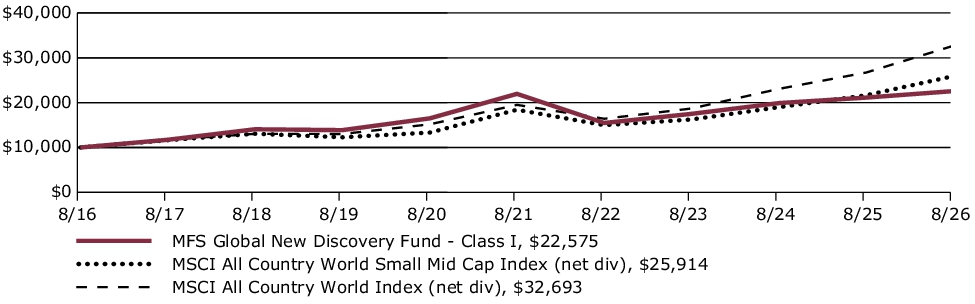
Average Annual Total Returns through 8/31/26
This table shows the average annual total returns of the class of shares noted for the periods shown, both with (if any) and without sales charges. It also shows the average annual total returns of (i) a broad measure of market performance and (ii) an additional index that MFS believes more closely reflects the market segments in which the fund invests, over the same periods.
| Share Class | 1-yr | 5-yr | 10-yr |
| I without sales charge | 6.86% | 0.55% | 8.48% |
| Comparative Benchmark(s) | |||
| MSCI All Country World Index (net div) ∆ | 22.35% | 10.88% | 12.58% |
| MSCI All Country World Small Mid Cap Index (net div) ∆ | 19.70% | 7.07% | 9.99% |
|
∆
|
Source: FactSet Research Systems Inc.
|
Visit mfs.com/perf/i for more recent performance information.
FUND STATISTICS AS OF 8/31/26
| Net Assets ($): | 67,121,542 | Total Management Fee ($)#: | 658,524 | |
| Total Number of Holdings: | 111 | Portfolio Turnover Rate (%): | 51 |
# Includes the effect of any management fee waivers, if applicable.
Where the fund holds derivatives, they are not included in the total number of portfolio holdings.
PORTFOLIO COMPOSITION (BASED ON TOTAL INVESTMENTS AS OF 8/31/26)
Portfolio structure
| Equities | 98.8% |
| Money Market Funds | 1.2% |
Top ten holdings
| GFL Environmental, Inc. | 1.8% |
| TechnipFMC PLC | 1.7% |
| OBIC Co. Ltd. | 1.7% |
| Cranswick PLC | 1.5% |
| Okta, Inc. | 1.5% |
| STERIS PLC | 1.5% |
| Shizuoka Financial Group, Inc. | 1.4% |
| Elis S.A. | 1.4% |
| Euronext N.V. | 1.4% |
| Charles River Laboratories International, Inc. | 1.4% |
Issuer country weightings
| United States | 42.8% |
| Japan | 12.2% |
| United Kingdom | 9.2% |
| Canada | 7.2% |
| Germany | 6.0% |
| France | 5.0% |
| Australia | 3.6% |
| Norway | 2.2% |
| Brazil | 2.1% |
| Other Countries | 9.7% |
Top ten holdings
| GFL Environmental, Inc. | 1.8% |
| TechnipFMC PLC | 1.7% |
| OBIC Co. Ltd. | 1.7% |
| Cranswick PLC | 1.5% |
| Okta, Inc. | 1.5% |
| STERIS PLC | 1.5% |
| Shizuoka Financial Group, Inc. | 1.4% |
| Elis S.A. | 1.4% |
| Euronext N.V. | 1.4% |
| Charles River Laboratories International, Inc. | 1.4% |
FUND EXPENSES
What were the fund costs for the last year?
| (based on a hypothetical $10,000 investment) | ||
| Class Name | Costs of a $10,000 investment | Costs paid as a percentage of a $10,000 investment |
| C | $216 | 2.10% |
MANAGEMENT'S DISCUSSION OF FUND PERFORMANCE
-
For the twelve months ended August 31, 2026, Class C shares of the MFS Global New Discovery Fund (fund) provided a total return of 5.79%, at net asset value. This compares with a return of 22.35% for the fund’s benchmark, the MSCI All Country World Index (net div). The fund's other benchmark, the MSCI All Country World Small Mid Cap Index (net div), generated a return of 19.70%.
-
Global equity markets reached record levels during the period, withstanding considerable volatility amid tariffs, geopolitical conflict and high levels of uncertainty. A new geopolitical event distressed markets as US and Israeli forces launched strikes against Iran, disrupting Mideast oil and natural gas exports. During the period, renewed focus on defense and infrastructure spending brightened the economic outlook in Europe while in Japan, the election of a pro-growth prime minister sent stocks to new highs. Optimism over artificial intelligence remained high globally.
-
While the US Supreme Court struck down part of the Trump administration’s tariff strategy, the administration began deploying other authorities to largely replace the ones that were ruled unconstitutional.
-
Higher energy prices and the lingering impact from tariffs kept inflation elevated in the US, prompting the Federal Reserve to end its easing cycle. Both the European Central Bank and the Bank of Japan raised rates toward the end of the period.
-
In fixed income markets, previously range-bound global bond yields climbed following the February 2026 onset of the conflict in the Middle East and as investors appeared to price in greater fiscal and monetary uncertainty. During the Iran war, global credit spreads widened modestly before stabilizing near pre-conflict levels, supported by strong demand and resilient underlying fundamentals. Similarly, US rate volatility (as measured by the Merrill Lynch Option Volatility Estimate (MOVE) Index) rose from intra-period lows before retracting back near prior levels.
-
Top contributors to performance relative to the MSCI All Country World Small Mid Cap Index:
-
Stock selection and underweight positions in both the real estate and financials sectors aided relative performance.
-
The fund's avoidance of the utilities sector also benefited relative returns.
-
-
Top detractors from performance relative to the MSCI All Country World Small Mid Cap Index:
-
Stock selection and an underweight position in the information technology sector weighed on the fund's relative performance.
-
Stock selection within both the industrials and materials sectors also hindered relative results.
-
FUND PERFORMANCE
The fund’s past performance is not a good predictor of the fund’s future performance. The graph and table below do not reflect the deduction of taxes that a shareholder would pay on fund distributions or the redemption of fund shares. The graph and table below assume reinvestment of dividends and capital gain distributions.
Growth of a Hypothetical $10,000 Investment
This graph shows the performance of a hypothetical $10,000 investment in Class C over a ten year period or since inception, if shorter, in comparison to (i) a broad measure of market performance and (ii) an additional index that MFS believes more closely reflects the market segments in which the fund invests.
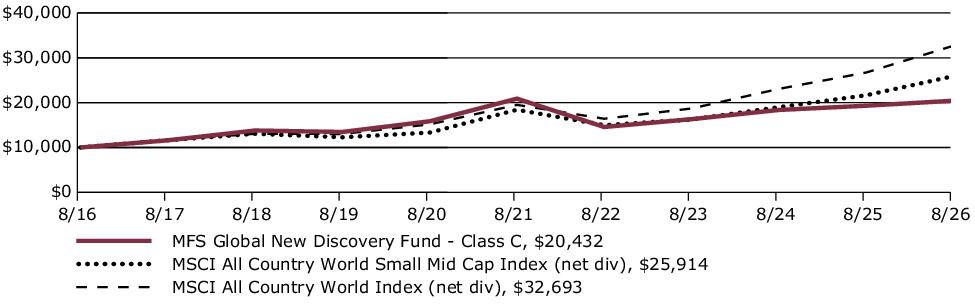
Average Annual Total Returns through 8/31/26
This table shows the average annual total returns of the class of shares noted for the periods shown, both with (if any) and without sales charges. It also shows the average annual total returns of (i) a broad measure of market performance and (ii) an additional index that MFS believes more closely reflects the market segments in which the fund invests, over the same periods.
| Share Class | 1-yr | 5-yr | 10-yr |
| C without sales charge | 5.79% | (0.44)% | 7.41% |
| C with CDSC (1% for 12 months)× | 4.79% | (0.44)% | 7.41% |
| Comparative Benchmark(s) | |||
| MSCI All Country World Index (net div) ∆ | 22.35% | 10.88% | 12.58% |
| MSCI All Country World Small Mid Cap Index (net div) ∆ | 19.70% | 7.07% | 9.99% |
|
∆
|
Source: FactSet Research Systems Inc.
|
|
×
|
Assuming redemption at the end of the applicable period.
|
Visit mfs.com/perf/c for more recent performance information.
FUND STATISTICS AS OF 8/31/26
| Net Assets ($): | 67,121,542 | Total Management Fee ($)#: | 658,524 | |
| Total Number of Holdings: | 111 | Portfolio Turnover Rate (%): | 51 |
# Includes the effect of any management fee waivers, if applicable.
Where the fund holds derivatives, they are not included in the total number of portfolio holdings.
PORTFOLIO COMPOSITION (BASED ON TOTAL INVESTMENTS AS OF 8/31/26)
Portfolio structure
| Equities | 98.8% |
| Money Market Funds | 1.2% |
Top ten holdings
| GFL Environmental, Inc. | 1.8% |
| TechnipFMC PLC | 1.7% |
| OBIC Co. Ltd. | 1.7% |
| Cranswick PLC | 1.5% |
| Okta, Inc. | 1.5% |
| STERIS PLC | 1.5% |
| Shizuoka Financial Group, Inc. | 1.4% |
| Elis S.A. | 1.4% |
| Euronext N.V. | 1.4% |
| Charles River Laboratories International, Inc. | 1.4% |
Issuer country weightings
| United States | 42.8% |
| Japan | 12.2% |
| United Kingdom | 9.2% |
| Canada | 7.2% |
| Germany | 6.0% |
| France | 5.0% |
| Australia | 3.6% |
| Norway | 2.2% |
| Brazil | 2.1% |
| Other Countries | 9.7% |
Top ten holdings
| GFL Environmental, Inc. | 1.8% |
| TechnipFMC PLC | 1.7% |
| OBIC Co. Ltd. | 1.7% |
| Cranswick PLC | 1.5% |
| Okta, Inc. | 1.5% |
| STERIS PLC | 1.5% |
| Shizuoka Financial Group, Inc. | 1.4% |
| Elis S.A. | 1.4% |
| Euronext N.V. | 1.4% |
| Charles River Laboratories International, Inc. | 1.4% |
FUND EXPENSES
What were the fund costs for the last year?
| (based on a hypothetical $10,000 investment) | ||
| Class Name | Costs of a $10,000 investment | Costs paid as a percentage of a $10,000 investment |
| B | $216 | 2.10% |
MANAGEMENT'S DISCUSSION OF FUND PERFORMANCE
-
For the twelve months ended August 31, 2026, Class B shares of the MFS Global New Discovery Fund (fund) provided a total return of 5.79%, at net asset value. This compares with a return of 22.35% for the fund’s benchmark, the MSCI All Country World Index (net div). The fund's other benchmark, the MSCI All Country World Small Mid Cap Index (net div), generated a return of 19.70%.
-
Global equity markets reached record levels during the period, withstanding considerable volatility amid tariffs, geopolitical conflict and high levels of uncertainty. A new geopolitical event distressed markets as US and Israeli forces launched strikes against Iran, disrupting Mideast oil and natural gas exports. During the period, renewed focus on defense and infrastructure spending brightened the economic outlook in Europe while in Japan, the election of a pro-growth prime minister sent stocks to new highs. Optimism over artificial intelligence remained high globally.
-
While the US Supreme Court struck down part of the Trump administration’s tariff strategy, the administration began deploying other authorities to largely replace the ones that were ruled unconstitutional.
-
Higher energy prices and the lingering impact from tariffs kept inflation elevated in the US, prompting the Federal Reserve to end its easing cycle. Both the European Central Bank and the Bank of Japan raised rates toward the end of the period.
-
In fixed income markets, previously range-bound global bond yields climbed following the February 2026 onset of the conflict in the Middle East and as investors appeared to price in greater fiscal and monetary uncertainty. During the Iran war, global credit spreads widened modestly before stabilizing near pre-conflict levels, supported by strong demand and resilient underlying fundamentals. Similarly, US rate volatility (as measured by the Merrill Lynch Option Volatility Estimate (MOVE) Index) rose from intra-period lows before retracting back near prior levels.
-
Top contributors to performance relative to the MSCI All Country World Small Mid Cap Index:
-
Stock selection and underweight positions in both the real estate and financials sectors aided relative performance.
-
The fund's avoidance of the utilities sector also benefited relative returns.
-
-
Top detractors from performance relative to the MSCI All Country World Small Mid Cap Index:
-
Stock selection and an underweight position in the information technology sector weighed on the fund's relative performance.
-
Stock selection within both the industrials and materials sectors also hindered relative results.
-
FUND PERFORMANCE
The fund’s past performance is not a good predictor of the fund’s future performance. The graph and table below do not reflect the deduction of taxes that a shareholder would pay on fund distributions or the redemption of fund shares. The graph and table below assume reinvestment of dividends and capital gain distributions.
Growth of a Hypothetical $10,000 Investment
This graph shows the performance of a hypothetical $10,000 investment in Class B over a ten year period or since inception, if shorter, in comparison to (i) a broad measure of market performance and (ii) an additional index that MFS believes more closely reflects the market segments in which the fund invests.
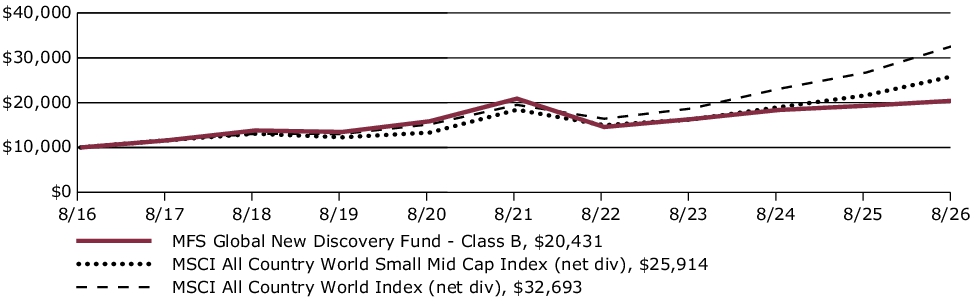
Average Annual Total Returns through 8/31/26
This table shows the average annual total returns of the class of shares noted for the periods shown, both with (if any) and without sales charges. It also shows the average annual total returns of (i) a broad measure of market performance and (ii) an additional index that MFS believes more closely reflects the market segments in which the fund invests, over the same periods.
| Share Class | 1-yr | 5-yr | 10-yr |
| B without sales charge | 5.79% | (0.44)% | 7.41% |
| B with CDSC (declining over six years from 4% to 0%)× | 1.79% | (0.81)% | 7.41% |
| Comparative Benchmark(s) | |||
| MSCI All Country World Index (net div) ∆ | 22.35% | 10.88% | 12.58% |
| MSCI All Country World Small Mid Cap Index (net div) ∆ | 19.70% | 7.07% | 9.99% |
|
∆
|
Source: FactSet Research Systems Inc.
|
|
×
|
Assuming redemption at the end of the applicable period.
|
Visit mfs.com/perf/b for more recent performance information.
FUND STATISTICS AS OF 8/31/26
| Net Assets ($): | 67,121,542 | Total Management Fee ($)#: | 658,524 | |
| Total Number of Holdings: | 111 | Portfolio Turnover Rate (%): | 51 |
# Includes the effect of any management fee waivers, if applicable.
Where the fund holds derivatives, they are not included in the total number of portfolio holdings.
PORTFOLIO COMPOSITION (BASED ON TOTAL INVESTMENTS AS OF 8/31/26)
Portfolio structure
| Equities | 98.8% |
| Money Market Funds | 1.2% |
Top ten holdings
| GFL Environmental, Inc. | 1.8% |
| TechnipFMC PLC | 1.7% |
| OBIC Co. Ltd. | 1.7% |
| Cranswick PLC | 1.5% |
| Okta, Inc. | 1.5% |
| STERIS PLC | 1.5% |
| Shizuoka Financial Group, Inc. | 1.4% |
| Elis S.A. | 1.4% |
| Euronext N.V. | 1.4% |
| Charles River Laboratories International, Inc. | 1.4% |
Issuer country weightings
| United States | 42.8% |
| Japan | 12.2% |
| United Kingdom | 9.2% |
| Canada | 7.2% |
| Germany | 6.0% |
| France | 5.0% |
| Australia | 3.6% |
| Norway | 2.2% |
| Brazil | 2.1% |
| Other Countries | 9.7% |
Top ten holdings
| GFL Environmental, Inc. | 1.8% |
| TechnipFMC PLC | 1.7% |
| OBIC Co. Ltd. | 1.7% |
| Cranswick PLC | 1.5% |
| Okta, Inc. | 1.5% |
| STERIS PLC | 1.5% |
| Shizuoka Financial Group, Inc. | 1.4% |
| Elis S.A. | 1.4% |
| Euronext N.V. | 1.4% |
| Charles River Laboratories International, Inc. | 1.4% |
FUND EXPENSES
What were the fund costs for the last year?
| (based on a hypothetical $10,000 investment) | ||
| Class Name | Costs of a $10,000 investment | Costs paid as a percentage of a $10,000 investment |
| A | $139 | 1.35% |
MANAGEMENT'S DISCUSSION OF FUND PERFORMANCE
-
For the twelve months ended August 31, 2026, Class A shares of the MFS Global New Discovery Fund (fund) provided a total return of 6.58%, at net asset value. This compares with a return of 22.35% for the fund’s benchmark, the MSCI All Country World Index (net div). The fund's other benchmark, the MSCI All Country World Small Mid Cap Index (net div), generated a return of 19.70%.
-
Global equity markets reached record levels during the period, withstanding considerable volatility amid tariffs, geopolitical conflict and high levels of uncertainty. A new geopolitical event distressed markets as US and Israeli forces launched strikes against Iran, disrupting Mideast oil and natural gas exports. During the period, renewed focus on defense and infrastructure spending brightened the economic outlook in Europe while in Japan, the election of a pro-growth prime minister sent stocks to new highs. Optimism over artificial intelligence remained high globally.
-
While the US Supreme Court struck down part of the Trump administration’s tariff strategy, the administration began deploying other authorities to largely replace the ones that were ruled unconstitutional.
-
Higher energy prices and the lingering impact from tariffs kept inflation elevated in the US, prompting the Federal Reserve to end its easing cycle. Both the European Central Bank and the Bank of Japan raised rates toward the end of the period.
-
In fixed income markets, previously range-bound global bond yields climbed following the February 2026 onset of the conflict in the Middle East and as investors appeared to price in greater fiscal and monetary uncertainty. During the Iran war, global credit spreads widened modestly before stabilizing near pre-conflict levels, supported by strong demand and resilient underlying fundamentals. Similarly, US rate volatility (as measured by the Merrill Lynch Option Volatility Estimate (MOVE) Index) rose from intra-period lows before retracting back near prior levels.
-
Top contributors to performance relative to the MSCI All Country World Small Mid Cap Index:
-
Stock selection and underweight positions in both the real estate and financials sectors aided relative performance.
-
The fund's avoidance of the utilities sector also benefited relative returns.
-
-
Top detractors from performance relative to the MSCI All Country World Small Mid Cap Index:
-
Stock selection and an underweight position in the information technology sector weighed on the fund's relative performance.
-
Stock selection within both the industrials and materials sectors also hindered relative results.
-
FUND PERFORMANCE
The fund’s past performance is not a good predictor of the fund’s future performance. The graph and table below do not reflect the deduction of taxes that a shareholder would pay on fund distributions or the redemption of fund shares. The graph and table below assume reinvestment of dividends and capital gain distributions.
Growth of a Hypothetical $10,000 Investment
This graph shows the performance of a hypothetical $10,000 investment in Class A over a ten year period or since inception, if shorter, in comparison to (i) a broad measure of market performance and (ii) an additional index that MFS believes more closely reflects the market segments in which the fund invests. This graph includes the deduction of the maximum applicable sales charge.
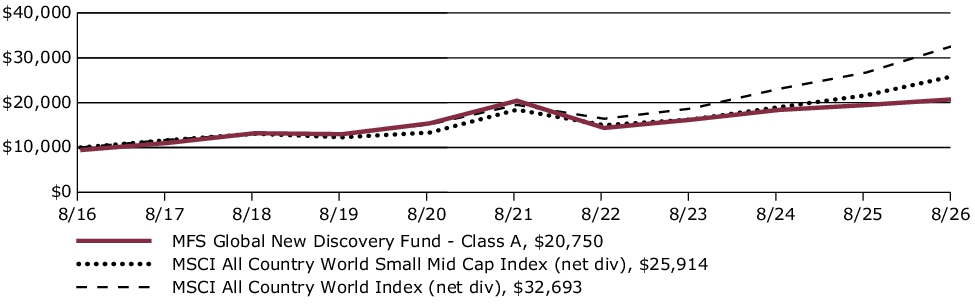
Average Annual Total Returns through 8/31/26
This table shows the average annual total returns of the class of shares noted for the periods shown, both with (if any) and without sales charges. It also shows the average annual total returns of (i) a broad measure of market performance and (ii) an additional index that MFS believes more closely reflects the market segments in which the fund invests, over the same periods.
| Share Class | 1-yr | 5-yr | 10-yr |
| A without sales charge | 6.58% | 0.31% | 8.21% |
| A with initial sales charge (5.75%) | 0.45% | (0.87)% | 7.57% |
| Comparative Benchmark(s) | |||
| MSCI All Country World Index (net div) ∆ | 22.35% | 10.88% | 12.58% |
| MSCI All Country World Small Mid Cap Index (net div) ∆ | 19.70% | 7.07% | 9.99% |
|
∆
|
Source: FactSet Research Systems Inc.
|
Visit mfs.com/perf/a for more recent performance information.
FUND STATISTICS AS OF 8/31/26
| Net Assets ($): | 67,121,542 | Total Management Fee ($)#: | 658,524 | |
| Total Number of Holdings: | 111 | Portfolio Turnover Rate (%): | 51 |
# Includes the effect of any management fee waivers, if applicable.
Where the fund holds derivatives, they are not included in the total number of portfolio holdings.
PORTFOLIO COMPOSITION (BASED ON TOTAL INVESTMENTS AS OF 8/31/26)
Portfolio structure
| Equities | 98.8% |
| Money Market Funds | 1.2% |
Top ten holdings
| GFL Environmental, Inc. | 1.8% |
| TechnipFMC PLC | 1.7% |
| OBIC Co. Ltd. | 1.7% |
| Cranswick PLC | 1.5% |
| Okta, Inc. | 1.5% |
| STERIS PLC | 1.5% |
| Shizuoka Financial Group, Inc. | 1.4% |
| Elis S.A. | 1.4% |
| Euronext N.V. | 1.4% |
| Charles River Laboratories International, Inc. | 1.4% |
Issuer country weightings
| United States | 42.8% |
| Japan | 12.2% |
| United Kingdom | 9.2% |
| Canada | 7.2% |
| Germany | 6.0% |
| France | 5.0% |
| Australia | 3.6% |
| Norway | 2.2% |
| Brazil | 2.1% |
| Other Countries | 9.7% |
Top ten holdings
| GFL Environmental, Inc. | 1.8% |
| TechnipFMC PLC | 1.7% |
| OBIC Co. Ltd. | 1.7% |
| Cranswick PLC | 1.5% |
| Okta, Inc. | 1.5% |
| STERIS PLC | 1.5% |
| Shizuoka Financial Group, Inc. | 1.4% |
| Elis S.A. | 1.4% |
| Euronext N.V. | 1.4% |
| Charles River Laboratories International, Inc. | 1.4% |
This report describes certain changes to the Fund that occurred during the reporting period.
FUND EXPENSES
What were the fund costs for the last year?
| (based on a hypothetical $10,000 investment) | ||
| Class Name | Costs of a $10,000 investment | Costs paid as a percentage of a $10,000 investment |
| A | $121 | 1.00% |
MANAGEMENT'S DISCUSSION OF FUND PERFORMANCE
-
For the twelve months ended August 31, 2026, Class A shares of the MFS Blended Research Emerging Markets Equity Fund (fund) provided a total return of 42.83%, at net asset value. This compares with a return of 39.25% for the fund’s benchmark, the MSCI Emerging Markets Index (net div).
-
Global equity markets reached record levels during the period, withstanding considerable volatility amid tariffs, geopolitical conflict and high levels of uncertainty. A new geopolitical event distressed markets as US and Israeli forces launched strikes against Iran, disrupting Mideast oil and natural gas exports. During the period, renewed focus on defense and infrastructure spending brightened the economic outlook in Europe while in Japan, the election of a pro-growth prime minister sent stocks to new highs. Optimism over artificial intelligence remained high globally.
-
While the US Supreme Court struck down part of the Trump administration’s tariff strategy, the administration began deploying other authorities to largely replace the ones that were ruled unconstitutional.
-
Higher energy prices and the lingering impact from tariffs kept inflation elevated in the US, prompting the Federal Reserve to end its easing cycle. Both the European Central Bank and the Bank of Japan raised rates toward the end of the period.
-
In fixed income markets, previously range-bound global bond yields climbed following the February 2026 onset of the conflict in the Middle East and as investors appeared to price in greater fiscal and monetary uncertainty. During the Iran war, global credit spreads widened modestly before stabilizing near pre-conflict levels, supported by strong demand and resilient underlying fundamentals. Similarly, US rate volatility (as measured by the Merrill Lynch Option Volatility Estimate (MOVE) Index) rose from intra-period lows before retracting back near prior levels.
-
Top contributors to performance relative to the MSCI Emerging Markets Index:
-
Security selection and an underweight position in the information technology sector contributed to the fund's relative performance.
-
Stock selection within the industrials, financials and energy sectors also supported relative results.
-
-
Top detractors from performance relative to the MSCI Emerging Markets Index:
-
Stock selection within the materials sector held back relative performance.
-
Stock selection and an overweight position in the communication services sector further weighed on the fund's relative returns.
-
FUND PERFORMANCE
The fund’s past performance is not a good predictor of the fund’s future performance. The graph and table below do not reflect the deduction of taxes that a shareholder would pay on fund distributions or the redemption of fund shares. The graph and table below assume reinvestment of dividends and capital gain distributions.
Growth of a Hypothetical $10,000 Investment
This graph shows the performance of a hypothetical $10,000 investment in Class A over a ten year period or since inception, if shorter, in comparison to a broad measure of market performance. This graph includes the deduction of the maximum applicable sales charge.
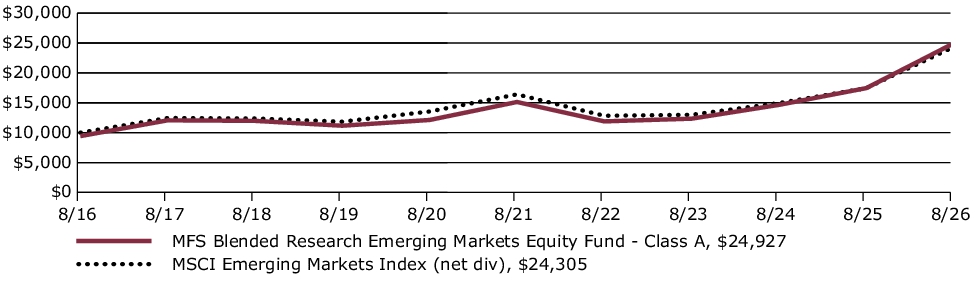
Average Annual Total Returns through 8/31/26
This table shows the average annual total returns of the class of shares noted for the periods shown, both with (if any) and without sales charges. It also shows the average annual total returns of a broad measure of market performance over the same periods.
| Share Class | 1-yr | 5-yr | 10-yr |
| A without sales charge | 42.83% | 10.50% | 10.21% |
| A with initial sales charge (5.75%) | 34.62% | 9.20% | 9.56% |
| Comparative Benchmark(s) | |||
| MSCI Emerging Markets Index (net div) ∆ | 39.25% | 8.18% | 9.29% |
|
∆
|
Source: FactSet Research Systems Inc.
|
Visit mfs.com/perf/a for more recent performance information.
FUND STATISTICS AS OF 8/31/26
| Net Assets ($): | 223,531,926 | Total Management Fee ($)#: | 934,444 | |
| Total Number of Holdings: | 140 | Portfolio Turnover Rate (%): | 80 |
# Includes the effect of any management fee waivers, if applicable.
Where the fund holds derivatives, they are not included in the total number of portfolio holdings.
PORTFOLIO COMPOSITION (BASED ON TOTAL INVESTMENTS AS OF 8/31/26)
Portfolio structure
| Equities | 99.7% |
| Money Market Funds | 0.3% |
Top ten holdings
| Taiwan Semiconductor Manufacturing Co. Ltd. | 13.9% |
| Samsung Electronics Co. Ltd. | 5.9% |
| SK hynix, Inc. | 5.1% |
| Tencent Holdings Ltd. | 3.3% |
| China Construction Bank Corp. | 2.3% |
| Hon Hai Precision Industry Co. Ltd. | 2.0% |
| Samsung Electronics Co. Ltd. | 1.9% |
| MediaTek, Inc. | 1.8% |
| KB Financial Group, Inc. | 1.8% |
| Alibaba Group Holding Ltd. | 1.8% |
Issuer country weightings
| Taiwan | 26.5% |
| South Korea | 21.4% |
| China | 21.0% |
| India | 9.7% |
| Brazil | 4.7% |
| South Africa | 2.9% |
| Mexico | 1.7% |
| Greece | 1.7% |
| United Arab Emirates | 1.6% |
| Other Countries | 8.8% |
Top ten holdings
| Taiwan Semiconductor Manufacturing Co. Ltd. | 13.9% |
| Samsung Electronics Co. Ltd. | 5.9% |
| SK hynix, Inc. | 5.1% |
| Tencent Holdings Ltd. | 3.3% |
| China Construction Bank Corp. | 2.3% |
| Hon Hai Precision Industry Co. Ltd. | 2.0% |
| Samsung Electronics Co. Ltd. | 1.9% |
| MediaTek, Inc. | 1.8% |
| KB Financial Group, Inc. | 1.8% |
| Alibaba Group Holding Ltd. | 1.8% |
MATERIAL FUND CHANGES
This is a summary of certain changes to the fund since September 1, 2025. For more complete information, you may review the fund's prospectus as amended, which is available at funds.mfs.com or upon request at 1‑800‑225‑2606.
Effective March 1, 2026, the management fee is computed daily and paid monthly at the following annual rates based on the fund’s average daily net assets: 0.45% up to $5 billion; and 0.40% in excess of $5 billion.
Effective March 1, 2026, for Class A shares, the investment adviser has agreed in writing to pay a portion of the fund’s total annual operating expenses, excluding interest, taxes, extraordinary expenses, brokerage and transaction costs, certain tax reclaim recovery expenses (including contingency fees and closing agreement expenses), and investment-related expenses, such that total operating expenses do not exceed 0.85% annually of the class’s average daily net assets. This written agreement will continue until modified by the fund’s Board of Trustees, but such agreement will continue at least until December 31, 2027.
This is a summary of certain changes to the fund since September 1, 2025. For more complete information, you may review the fund's prospectus as amended, which is available at funds.mfs.com or upon request at 1‑800‑225‑2606.
This report describes certain changes to the Fund that occurred during the reporting period.
FUND EXPENSES
What were the fund costs for the last year?
| (based on a hypothetical $10,000 investment) | ||
| Class Name | Costs of a $10,000 investment | Costs paid as a percentage of a $10,000 investment |
| B | $216 | 1.79% |
MANAGEMENT'S DISCUSSION OF FUND PERFORMANCE
-
For the twelve months ended August 31, 2026, Class B shares of the MFS Blended Research Emerging Markets Equity Fund (fund) provided a total return of 41.82%, at net asset value. This compares with a return of 39.25% for the fund’s benchmark, the MSCI Emerging Markets Index (net div).
-
Global equity markets reached record levels during the period, withstanding considerable volatility amid tariffs, geopolitical conflict and high levels of uncertainty. A new geopolitical event distressed markets as US and Israeli forces launched strikes against Iran, disrupting Mideast oil and natural gas exports. During the period, renewed focus on defense and infrastructure spending brightened the economic outlook in Europe while in Japan, the election of a pro-growth prime minister sent stocks to new highs. Optimism over artificial intelligence remained high globally.
-
While the US Supreme Court struck down part of the Trump administration’s tariff strategy, the administration began deploying other authorities to largely replace the ones that were ruled unconstitutional.
-
Higher energy prices and the lingering impact from tariffs kept inflation elevated in the US, prompting the Federal Reserve to end its easing cycle. Both the European Central Bank and the Bank of Japan raised rates toward the end of the period.
-
In fixed income markets, previously range-bound global bond yields climbed following the February 2026 onset of the conflict in the Middle East and as investors appeared to price in greater fiscal and monetary uncertainty. During the Iran war, global credit spreads widened modestly before stabilizing near pre-conflict levels, supported by strong demand and resilient underlying fundamentals. Similarly, US rate volatility (as measured by the Merrill Lynch Option Volatility Estimate (MOVE) Index) rose from intra-period lows before retracting back near prior levels.
-
Top contributors to performance relative to the MSCI Emerging Markets Index:
-
Security selection and an underweight position in the information technology sector contributed to the fund's relative performance.
-
Stock selection within the industrials, financials and energy sectors also supported relative results.
-
-
Top detractors from performance relative to the MSCI Emerging Markets Index:
-
Stock selection within the materials sector held back relative performance.
-
Stock selection and an overweight position in the communication services sector further weighed on the fund's relative returns.
-
FUND PERFORMANCE
The fund’s past performance is not a good predictor of the fund’s future performance. The graph and table below do not reflect the deduction of taxes that a shareholder would pay on fund distributions or the redemption of fund shares. The graph and table below assume reinvestment of dividends and capital gain distributions.
Growth of a Hypothetical $10,000 Investment
This graph shows the performance of a hypothetical $10,000 investment in Class B over a ten year period or since inception, if shorter, in comparison to a broad measure of market performance.
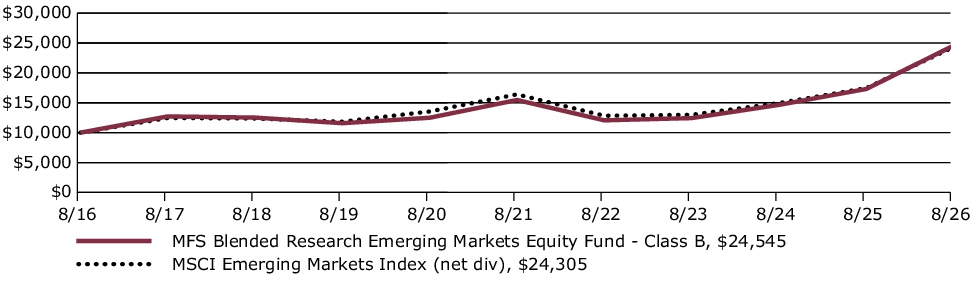
Average Annual Total Returns through 8/31/26
This table shows the average annual total returns of the class of shares noted for the periods shown, both with (if any) and without sales charges. It also shows the average annual total returns of a broad measure of market performance over the same periods.
| Share Class | 1-yr | 5-yr | 10-yr |
| B without sales charge | 41.82% | 9.68% | 9.39% |
| B with CDSC (declining over six years from 4% to 0%)× | 37.82% | 9.40% | 9.39% |
| Comparative Benchmark(s) | |||
| MSCI Emerging Markets Index (net div) ∆ | 39.25% | 8.18% | 9.29% |
|
∆
|
Source: FactSet Research Systems Inc.
|
|
×
|
Assuming redemption at the end of the applicable period.
|
CDSC – Contingent Deferred Sales Charge.
Visit mfs.com/perf/b for more recent performance information.
FUND STATISTICS AS OF 8/31/26
| Net Assets ($): | 223,531,926 | Total Management Fee ($)#: | 934,444 | |
| Total Number of Holdings: | 140 | Portfolio Turnover Rate (%): | 80 |
# Includes the effect of any management fee waivers, if applicable.
Where the fund holds derivatives, they are not included in the total number of portfolio holdings.
PORTFOLIO COMPOSITION (BASED ON TOTAL INVESTMENTS AS OF 8/31/26)
Portfolio structure
| Equities | 99.7% |
| Money Market Funds | 0.3% |
Top ten holdings
| Taiwan Semiconductor Manufacturing Co. Ltd. | 13.9% |
| Samsung Electronics Co. Ltd. | 5.9% |
| SK hynix, Inc. | 5.1% |
| Tencent Holdings Ltd. | 3.3% |
| China Construction Bank Corp. | 2.3% |
| Hon Hai Precision Industry Co. Ltd. | 2.0% |
| Samsung Electronics Co. Ltd. | 1.9% |
| MediaTek, Inc. | 1.8% |
| KB Financial Group, Inc. | 1.8% |
| Alibaba Group Holding Ltd. | 1.8% |
Issuer country weightings
| Taiwan | 26.5% |
| South Korea | 21.4% |
| China | 21.0% |
| India | 9.7% |
| Brazil | 4.7% |
| South Africa | 2.9% |
| Mexico | 1.7% |
| Greece | 1.7% |
| United Arab Emirates | 1.6% |
| Other Countries | 8.8% |
Top ten holdings
| Taiwan Semiconductor Manufacturing Co. Ltd. | 13.9% |
| Samsung Electronics Co. Ltd. | 5.9% |
| SK hynix, Inc. | 5.1% |
| Tencent Holdings Ltd. | 3.3% |
| China Construction Bank Corp. | 2.3% |
| Hon Hai Precision Industry Co. Ltd. | 2.0% |
| Samsung Electronics Co. Ltd. | 1.9% |
| MediaTek, Inc. | 1.8% |
| KB Financial Group, Inc. | 1.8% |
| Alibaba Group Holding Ltd. | 1.8% |
MATERIAL FUND CHANGES
This is a summary of certain changes to the fund since September 1, 2025. For more complete information, you may review the fund's prospectus as amended, which is available at funds.mfs.com or upon request at 1‑800‑225‑2606.
Effective March 1, 2026, the management fee is computed daily and paid monthly at the following annual rates based on the fund’s average daily net assets: 0.45% up to $5 billion; and 0.40% in excess of $5 billion.
Effective March 1, 2026, for Class B shares, the investment adviser has agreed in writing to pay a portion of the fund’s total annual operating expenses, excluding interest, taxes, extraordinary expenses, brokerage and transaction costs, certain tax reclaim recovery expenses (including contingency fees and closing agreement expenses), and investment-related expenses, such that total operating expenses do not exceed 1.60% annually of the class’s average daily net assets. This written agreement will continue until modified by the fund’s Board of Trustees, but such agreement will continue at least until December 31, 2027.
This is a summary of certain changes to the fund since September 1, 2025. For more complete information, you may review the fund's prospectus as amended, which is available at funds.mfs.com or upon request at 1‑800‑225‑2606.
This report describes certain changes to the Fund that occurred during the reporting period.
FUND EXPENSES
What were the fund costs for the last year?
| (based on a hypothetical $10,000 investment) | ||
| Class Name | Costs of a $10,000 investment | Costs paid as a percentage of a $10,000 investment |
| C | $210 | 1.74% |
MANAGEMENT'S DISCUSSION OF FUND PERFORMANCE
-
For the twelve months ended August 31, 2026, Class C shares of the MFS Blended Research Emerging Markets Equity Fund (fund) provided a total return of 41.77%, at net asset value. This compares with a return of 39.25% for the fund’s benchmark, the MSCI Emerging Markets Index (net div).
-
Global equity markets reached record levels during the period, withstanding considerable volatility amid tariffs, geopolitical conflict and high levels of uncertainty. A new geopolitical event distressed markets as US and Israeli forces launched strikes against Iran, disrupting Mideast oil and natural gas exports. During the period, renewed focus on defense and infrastructure spending brightened the economic outlook in Europe while in Japan, the election of a pro-growth prime minister sent stocks to new highs. Optimism over artificial intelligence remained high globally.
-
While the US Supreme Court struck down part of the Trump administration’s tariff strategy, the administration began deploying other authorities to largely replace the ones that were ruled unconstitutional.
-
Higher energy prices and the lingering impact from tariffs kept inflation elevated in the US, prompting the Federal Reserve to end its easing cycle. Both the European Central Bank and the Bank of Japan raised rates toward the end of the period.
-
In fixed income markets, previously range-bound global bond yields climbed following the February 2026 onset of the conflict in the Middle East and as investors appeared to price in greater fiscal and monetary uncertainty. During the Iran war, global credit spreads widened modestly before stabilizing near pre-conflict levels, supported by strong demand and resilient underlying fundamentals. Similarly, US rate volatility (as measured by the Merrill Lynch Option Volatility Estimate (MOVE) Index) rose from intra-period lows before retracting back near prior levels.
-
Top contributors to performance relative to the MSCI Emerging Markets Index:
-
Security selection and an underweight position in the information technology sector contributed to the fund's relative performance.
-
Stock selection within the industrials, financials and energy sectors also supported relative results.
-
-
Top detractors from performance relative to the MSCI Emerging Markets Index:
-
Stock selection within the materials sector held back relative performance.
-
Stock selection and an overweight position in the communication services sector further weighed on the fund's relative returns.
-
FUND PERFORMANCE
The fund’s past performance is not a good predictor of the fund’s future performance. The graph and table below do not reflect the deduction of taxes that a shareholder would pay on fund distributions or the redemption of fund shares. The graph and table below assume reinvestment of dividends and capital gain distributions.
Growth of a Hypothetical $10,000 Investment
This graph shows the performance of a hypothetical $10,000 investment in Class C over a ten year period or since inception, if shorter, in comparison to a broad measure of market performance.
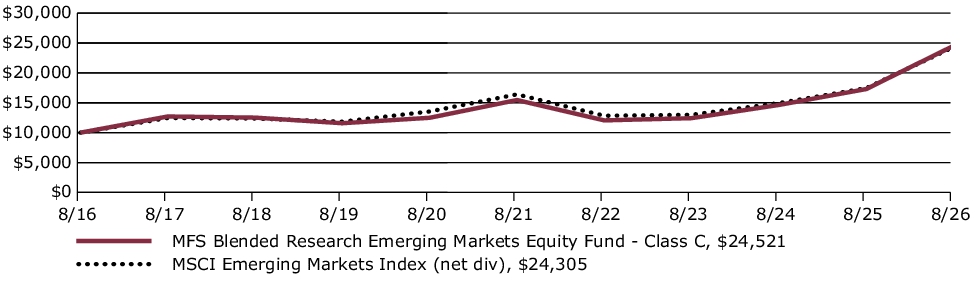
Average Annual Total Returns through 8/31/26
This table shows the average annual total returns of the class of shares noted for the periods shown, both with (if any) and without sales charges. It also shows the average annual total returns of a broad measure of market performance over the same periods.
| Share Class | 1-yr | 5-yr | 10-yr |
| C without sales charge | 41.77% | 9.67% | 9.38% |
| C with CDSC (1% for 12 months)× | 40.77% | 9.67% | 9.38% |
| Comparative Benchmark(s) | |||
| MSCI Emerging Markets Index (net div) ∆ | 39.25% | 8.18% | 9.29% |
|
∆
|
Source: FactSet Research Systems Inc.
|
|
×
|
Assuming redemption at the end of the applicable period.
|
Visit mfs.com/perf/c for more recent performance information.
FUND STATISTICS AS OF 8/31/26
| Net Assets ($): | 223,531,926 | Total Management Fee ($)#: | 934,444 | |
| Total Number of Holdings: | 140 | Portfolio Turnover Rate (%): | 80 |
# Includes the effect of any management fee waivers, if applicable.
Where the fund holds derivatives, they are not included in the total number of portfolio holdings.
PORTFOLIO COMPOSITION (BASED ON TOTAL INVESTMENTS AS OF 8/31/26)
Portfolio structure
| Equities | 99.7% |
| Money Market Funds | 0.3% |
Top ten holdings
| Taiwan Semiconductor Manufacturing Co. Ltd. | 13.9% |
| Samsung Electronics Co. Ltd. | 5.9% |
| SK hynix, Inc. | 5.1% |
| Tencent Holdings Ltd. | 3.3% |
| China Construction Bank Corp. | 2.3% |
| Hon Hai Precision Industry Co. Ltd. | 2.0% |
| Samsung Electronics Co. Ltd. | 1.9% |
| MediaTek, Inc. | 1.8% |
| KB Financial Group, Inc. | 1.8% |
| Alibaba Group Holding Ltd. | 1.8% |
Issuer country weightings
| Taiwan | 26.5% |
| South Korea | 21.4% |
| China | 21.0% |
| India | 9.7% |
| Brazil | 4.7% |
| South Africa | 2.9% |
| Mexico | 1.7% |
| Greece | 1.7% |
| United Arab Emirates | 1.6% |
| Other Countries | 8.8% |
Top ten holdings
| Taiwan Semiconductor Manufacturing Co. Ltd. | 13.9% |
| Samsung Electronics Co. Ltd. | 5.9% |
| SK hynix, Inc. | 5.1% |
| Tencent Holdings Ltd. | 3.3% |
| China Construction Bank Corp. | 2.3% |
| Hon Hai Precision Industry Co. Ltd. | 2.0% |
| Samsung Electronics Co. Ltd. | 1.9% |
| MediaTek, Inc. | 1.8% |
| KB Financial Group, Inc. | 1.8% |
| Alibaba Group Holding Ltd. | 1.8% |
MATERIAL FUND CHANGES
This is a summary of certain changes to the fund since September 1, 2025. For more complete information, you may review the fund's prospectus as amended, which is available at funds.mfs.com or upon request at 1‑800‑225‑2606.
Effective March 1, 2026, the management fee is computed daily and paid monthly at the following annual rates based on the fund’s average daily net assets: 0.45% up to $5 billion; and 0.40% in excess of $5 billion.
Effective March 1, 2026, for Class C shares, the investment adviser has agreed in writing to pay a portion of the fund’s total annual operating expenses, excluding interest, taxes, extraordinary expenses, brokerage and transaction costs, certain tax reclaim recovery expenses (including contingency fees and closing agreement expenses), and investment-related expenses, such that total operating expenses do not exceed 1.60% annually of the class’s average daily net assets. This written agreement will continue until modified by the fund’s Board of Trustees, but such agreement will continue at least until December 31, 2027.
This is a summary of certain changes to the fund since September 1, 2025. For more complete information, you may review the fund's prospectus as amended, which is available at funds.mfs.com or upon request at 1‑800‑225‑2606.
This report describes certain changes to the Fund that occurred during the reporting period.
FUND EXPENSES
What were the fund costs for the last year?
| (based on a hypothetical $10,000 investment) | ||
| Class Name | Costs of a $10,000 investment | Costs paid as a percentage of a $10,000 investment |
| I | $90 | 0.74% |
MANAGEMENT'S DISCUSSION OF FUND PERFORMANCE
-
For the twelve months ended August 31, 2026, Class I shares of the MFS Blended Research Emerging Markets Equity Fund (fund) provided a total return of 43.23%, at net asset value. This compares with a return of 39.25% for the fund’s benchmark, the MSCI Emerging Markets Index (net div).
-
Global equity markets reached record levels during the period, withstanding considerable volatility amid tariffs, geopolitical conflict and high levels of uncertainty. A new geopolitical event distressed markets as US and Israeli forces launched strikes against Iran, disrupting Mideast oil and natural gas exports. During the period, renewed focus on defense and infrastructure spending brightened the economic outlook in Europe while in Japan, the election of a pro-growth prime minister sent stocks to new highs. Optimism over artificial intelligence remained high globally.
-
While the US Supreme Court struck down part of the Trump administration’s tariff strategy, the administration began deploying other authorities to largely replace the ones that were ruled unconstitutional.
-
Higher energy prices and the lingering impact from tariffs kept inflation elevated in the US, prompting the Federal Reserve to end its easing cycle. Both the European Central Bank and the Bank of Japan raised rates toward the end of the period.
-
In fixed income markets, previously range-bound global bond yields climbed following the February 2026 onset of the conflict in the Middle East and as investors appeared to price in greater fiscal and monetary uncertainty. During the Iran war, global credit spreads widened modestly before stabilizing near pre-conflict levels, supported by strong demand and resilient underlying fundamentals. Similarly, US rate volatility (as measured by the Merrill Lynch Option Volatility Estimate (MOVE) Index) rose from intra-period lows before retracting back near prior levels.
-
Top contributors to performance relative to the MSCI Emerging Markets Index:
-
Security selection and an underweight position in the information technology sector contributed to the fund's relative performance.
-
Stock selection within the industrials, financials and energy sectors also supported relative results.
-
-
Top detractors from performance relative to the MSCI Emerging Markets Index:
-
Stock selection within the materials sector held back relative performance.
-
Stock selection and an overweight position in the communication services sector further weighed on the fund's relative returns.
-
FUND PERFORMANCE
The fund’s past performance is not a good predictor of the fund’s future performance. The graph and table below do not reflect the deduction of taxes that a shareholder would pay on fund distributions or the redemption of fund shares. The graph and table below assume reinvestment of dividends and capital gain distributions.
Growth of a Hypothetical $10,000 Investment
This graph shows the performance of a hypothetical $10,000 investment in Class I over a ten year period or since inception, if shorter, in comparison to a broad measure of market performance.
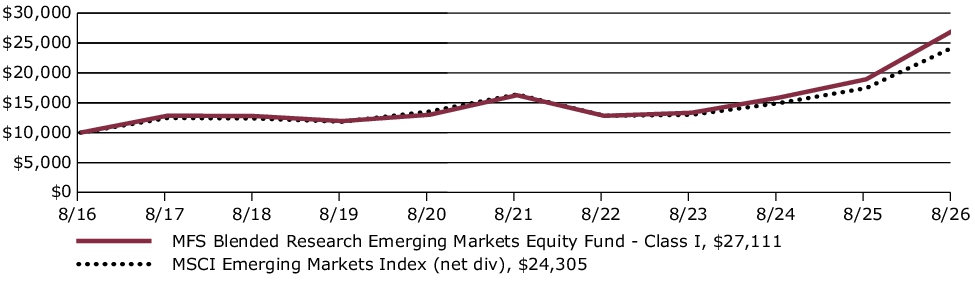
Average Annual Total Returns through 8/31/26
This table shows the average annual total returns of the class of shares noted for the periods shown, both with (if any) and without sales charges. It also shows the average annual total returns of a broad measure of market performance over the same periods.
| Share Class | 1-yr | 5-yr | 10-yr |
| I without sales charge | 43.23% | 10.77% | 10.49% |
| Comparative Benchmark(s) | |||
| MSCI Emerging Markets Index (net div) ∆ | 39.25% | 8.18% | 9.29% |
|
∆
|
Source: FactSet Research Systems Inc.
|
Visit mfs.com/perf/i for more recent performance information.
FUND STATISTICS AS OF 8/31/26
| Net Assets ($): | 223,531,926 | Total Management Fee ($)#: | 934,444 | |
| Total Number of Holdings: | 140 | Portfolio Turnover Rate (%): | 80 |
# Includes the effect of any management fee waivers, if applicable.
Where the fund holds derivatives, they are not included in the total number of portfolio holdings.
PORTFOLIO COMPOSITION (BASED ON TOTAL INVESTMENTS AS OF 8/31/26)
Portfolio structure
| Equities | 99.7% |
| Money Market Funds | 0.3% |
Top ten holdings
| Taiwan Semiconductor Manufacturing Co. Ltd. | 13.9% |
| Samsung Electronics Co. Ltd. | 5.9% |
| SK hynix, Inc. | 5.1% |
| Tencent Holdings Ltd. | 3.3% |
| China Construction Bank Corp. | 2.3% |
| Hon Hai Precision Industry Co. Ltd. | 2.0% |
| Samsung Electronics Co. Ltd. | 1.9% |
| MediaTek, Inc. | 1.8% |
| KB Financial Group, Inc. | 1.8% |
| Alibaba Group Holding Ltd. | 1.8% |
Issuer country weightings
| Taiwan | 26.5% |
| South Korea | 21.4% |
| China | 21.0% |
| India | 9.7% |
| Brazil | 4.7% |
| South Africa | 2.9% |
| Mexico | 1.7% |
| Greece | 1.7% |
| United Arab Emirates | 1.6% |
| Other Countries | 8.8% |
Top ten holdings
| Taiwan Semiconductor Manufacturing Co. Ltd. | 13.9% |
| Samsung Electronics Co. Ltd. | 5.9% |
| SK hynix, Inc. | 5.1% |
| Tencent Holdings Ltd. | 3.3% |
| China Construction Bank Corp. | 2.3% |
| Hon Hai Precision Industry Co. Ltd. | 2.0% |
| Samsung Electronics Co. Ltd. | 1.9% |
| MediaTek, Inc. | 1.8% |
| KB Financial Group, Inc. | 1.8% |
| Alibaba Group Holding Ltd. | 1.8% |
MATERIAL FUND CHANGES
This is a summary of certain changes to the fund since September 1, 2025. For more complete information, you may review the fund's prospectus as amended, which is available at funds.mfs.com or upon request at 1‑800‑225‑2606.
Effective March 1, 2026, the management fee is computed daily and paid monthly at the following annual rates based on the fund’s average daily net assets: 0.45% up to $5 billion; and 0.40% in excess of $5 billion.
Effective March 1, 2026, for Class I shares, the investment adviser has agreed in writing to pay a portion of the fund’s total annual operating expenses, excluding interest, taxes, extraordinary expenses, brokerage and transaction costs, certain tax reclaim recovery expenses (including contingency fees and closing agreement expenses), and investment-related expenses, such that total operating expenses do not exceed 0.60% annually of the class’s average daily net assets. This written agreement will continue until modified by the fund’s Board of Trustees, but such agreement will continue at least until December 31, 2027.
This is a summary of certain changes to the fund since September 1, 2025. For more complete information, you may review the fund's prospectus as amended, which is available at funds.mfs.com or upon request at 1‑800‑225‑2606.
This report describes certain changes to the Fund that occurred during the reporting period.
FUND EXPENSES
What were the fund costs for the last year?
| (based on a hypothetical $10,000 investment) | ||
| Class Name | Costs of a $10,000 investment | Costs paid as a percentage of a $10,000 investment |
| R1 | $125 | 1.03% |
MANAGEMENT'S DISCUSSION OF FUND PERFORMANCE
-
For the twelve months ended August 31, 2026, Class R1 shares of the MFS Blended Research Emerging Markets Equity Fund (fund) provided a total return of 42.90%, at net asset value. This compares with a return of 39.25% for the fund’s benchmark, the MSCI Emerging Markets Index (net div).
-
Global equity markets reached record levels during the period, withstanding considerable volatility amid tariffs, geopolitical conflict and high levels of uncertainty. A new geopolitical event distressed markets as US and Israeli forces launched strikes against Iran, disrupting Mideast oil and natural gas exports. During the period, renewed focus on defense and infrastructure spending brightened the economic outlook in Europe while in Japan, the election of a pro-growth prime minister sent stocks to new highs. Optimism over artificial intelligence remained high globally.
-
While the US Supreme Court struck down part of the Trump administration’s tariff strategy, the administration began deploying other authorities to largely replace the ones that were ruled unconstitutional.
-
Higher energy prices and the lingering impact from tariffs kept inflation elevated in the US, prompting the Federal Reserve to end its easing cycle. Both the European Central Bank and the Bank of Japan raised rates toward the end of the period.
-
In fixed income markets, previously range-bound global bond yields climbed following the February 2026 onset of the conflict in the Middle East and as investors appeared to price in greater fiscal and monetary uncertainty. During the Iran war, global credit spreads widened modestly before stabilizing near pre-conflict levels, supported by strong demand and resilient underlying fundamentals. Similarly, US rate volatility (as measured by the Merrill Lynch Option Volatility Estimate (MOVE) Index) rose from intra-period lows before retracting back near prior levels.
-
Top contributors to performance relative to the MSCI Emerging Markets Index:
-
Security selection and an underweight position in the information technology sector contributed to the fund's relative performance.
-
Stock selection within the industrials, financials and energy sectors also supported relative results.
-
-
Top detractors from performance relative to the MSCI Emerging Markets Index:
-
Stock selection within the materials sector held back relative performance.
-
Stock selection and an overweight position in the communication services sector further weighed on the fund's relative returns.
-
FUND PERFORMANCE
The fund’s past performance is not a good predictor of the fund’s future performance. The graph and table below do not reflect the deduction of taxes that a shareholder would pay on fund distributions or the redemption of fund shares. The graph and table below assume reinvestment of dividends and capital gain distributions.
Growth of a Hypothetical $10,000 Investment
This graph shows the performance of a hypothetical $10,000 investment in Class R1 over a ten year period or since inception, if shorter, in comparison to a broad measure of market performance.
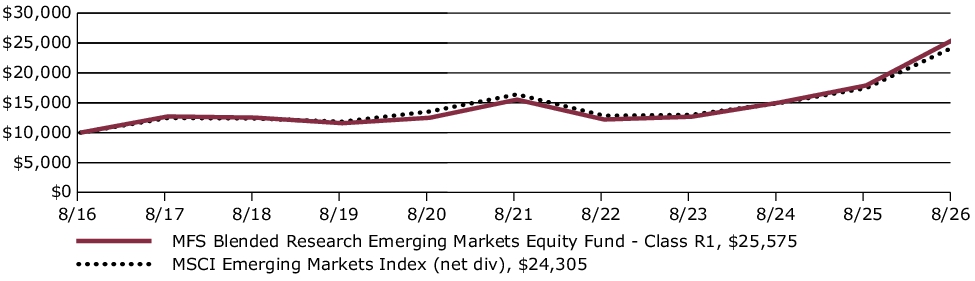
Average Annual Total Returns through 8/31/26
This table shows the average annual total returns of the class of shares noted for the periods shown, both with (if any) and without sales charges. It also shows the average annual total returns of a broad measure of market performance over the same periods.
| Share Class | 1-yr | 5-yr | 10-yr |
| R1 without sales charge | 42.90% | 10.50% | 9.85% |
| Comparative Benchmark(s) | |||
| MSCI Emerging Markets Index (net div) ∆ | 39.25% | 8.18% | 9.29% |
|
∆
|
Source: FactSet Research Systems Inc.
|
Visit mfs.com/perf/r1 for more recent performance information.
FUND STATISTICS AS OF 8/31/26
| Net Assets ($): | 223,531,926 | Total Management Fee ($)#: | 934,444 | |
| Total Number of Holdings: | 140 | Portfolio Turnover Rate (%): | 80 |
# Includes the effect of any management fee waivers, if applicable.
Where the fund holds derivatives, they are not included in the total number of portfolio holdings.
PORTFOLIO COMPOSITION (BASED ON TOTAL INVESTMENTS AS OF 8/31/26)
Portfolio structure
| Equities | 99.7% |
| Money Market Funds | 0.3% |
Top ten holdings
| Taiwan Semiconductor Manufacturing Co. Ltd. | 13.9% |
| Samsung Electronics Co. Ltd. | 5.9% |
| SK hynix, Inc. | 5.1% |
| Tencent Holdings Ltd. | 3.3% |
| China Construction Bank Corp. | 2.3% |
| Hon Hai Precision Industry Co. Ltd. | 2.0% |
| Samsung Electronics Co. Ltd. | 1.9% |
| MediaTek, Inc. | 1.8% |
| KB Financial Group, Inc. | 1.8% |
| Alibaba Group Holding Ltd. | 1.8% |
Issuer country weightings
| Taiwan | 26.5% |
| South Korea | 21.4% |
| China | 21.0% |
| India | 9.7% |
| Brazil | 4.7% |
| South Africa | 2.9% |
| Mexico | 1.7% |
| Greece | 1.7% |
| United Arab Emirates | 1.6% |
| Other Countries | 8.8% |
Top ten holdings
| Taiwan Semiconductor Manufacturing Co. Ltd. | 13.9% |
| Samsung Electronics Co. Ltd. | 5.9% |
| SK hynix, Inc. | 5.1% |
| Tencent Holdings Ltd. | 3.3% |
| China Construction Bank Corp. | 2.3% |
| Hon Hai Precision Industry Co. Ltd. | 2.0% |
| Samsung Electronics Co. Ltd. | 1.9% |
| MediaTek, Inc. | 1.8% |
| KB Financial Group, Inc. | 1.8% |
| Alibaba Group Holding Ltd. | 1.8% |
MATERIAL FUND CHANGES
This is a summary of certain changes to the fund since September 1, 2025. For more complete information, you may review the fund's prospectus as amended, which is available at funds.mfs.com or upon request at 1‑800‑225‑2606.
Effective March 1, 2026, the management fee is computed daily and paid monthly at the following annual rates based on the fund’s average daily net assets: 0.45% up to $5 billion; and 0.40% in excess of $5 billion.
Effective March 1, 2026, for Class R1 shares, the investment adviser has agreed in writing to pay a portion of the fund’s total annual operating expenses, excluding interest, taxes, extraordinary expenses, brokerage and transaction costs, certain tax reclaim recovery expenses (including contingency fees and closing agreement expenses), and investment-related expenses, such that total operating expenses do not exceed 1.60% annually of the class’s average daily net assets. This written agreement will continue until modified by the fund’s Board of Trustees, but such agreement will continue at least until December 31, 2027.
This is a summary of certain changes to the fund since September 1, 2025. For more complete information, you may review the fund's prospectus as amended, which is available at funds.mfs.com or upon request at 1‑800‑225‑2606.
This report describes certain changes to the Fund that occurred during the reporting period.
FUND EXPENSES
What were the fund costs for the last year?
| (based on a hypothetical $10,000 investment) | ||
| Class Name | Costs of a $10,000 investment | Costs paid as a percentage of a $10,000 investment |
| R2 | $155 | 1.28% |
MANAGEMENT'S DISCUSSION OF FUND PERFORMANCE
-
For the twelve months ended August 31, 2026, Class R2 shares of the MFS Blended Research Emerging Markets Equity Fund (fund) provided a total return of 42.47%, at net asset value. This compares with a return of 39.25% for the fund’s benchmark, the MSCI Emerging Markets Index (net div).
-
Global equity markets reached record levels during the period, withstanding considerable volatility amid tariffs, geopolitical conflict and high levels of uncertainty. A new geopolitical event distressed markets as US and Israeli forces launched strikes against Iran, disrupting Mideast oil and natural gas exports. During the period, renewed focus on defense and infrastructure spending brightened the economic outlook in Europe while in Japan, the election of a pro-growth prime minister sent stocks to new highs. Optimism over artificial intelligence remained high globally.
-
While the US Supreme Court struck down part of the Trump administration’s tariff strategy, the administration began deploying other authorities to largely replace the ones that were ruled unconstitutional.
-
Higher energy prices and the lingering impact from tariffs kept inflation elevated in the US, prompting the Federal Reserve to end its easing cycle. Both the European Central Bank and the Bank of Japan raised rates toward the end of the period.
-
In fixed income markets, previously range-bound global bond yields climbed following the February 2026 onset of the conflict in the Middle East and as investors appeared to price in greater fiscal and monetary uncertainty. During the Iran war, global credit spreads widened modestly before stabilizing near pre-conflict levels, supported by strong demand and resilient underlying fundamentals. Similarly, US rate volatility (as measured by the Merrill Lynch Option Volatility Estimate (MOVE) Index) rose from intra-period lows before retracting back near prior levels.
-
Top contributors to performance relative to the MSCI Emerging Markets Index:
-
Security selection and an underweight position in the information technology sector contributed to the fund's relative performance.
-
Stock selection within the industrials, financials and energy sectors also supported relative results.
-
-
Top detractors from performance relative to the MSCI Emerging Markets Index:
-
Stock selection within the materials sector held back relative performance.
-
Stock selection and an overweight position in the communication services sector further weighed on the fund's relative returns.
-
FUND PERFORMANCE
The fund’s past performance is not a good predictor of the fund’s future performance. The graph and table below do not reflect the deduction of taxes that a shareholder would pay on fund distributions or the redemption of fund shares. The graph and table below assume reinvestment of dividends and capital gain distributions.
Growth of a Hypothetical $10,000 Investment
This graph shows the performance of a hypothetical $10,000 investment in Class R2 over a ten year period or since inception, if shorter, in comparison to a broad measure of market performance.
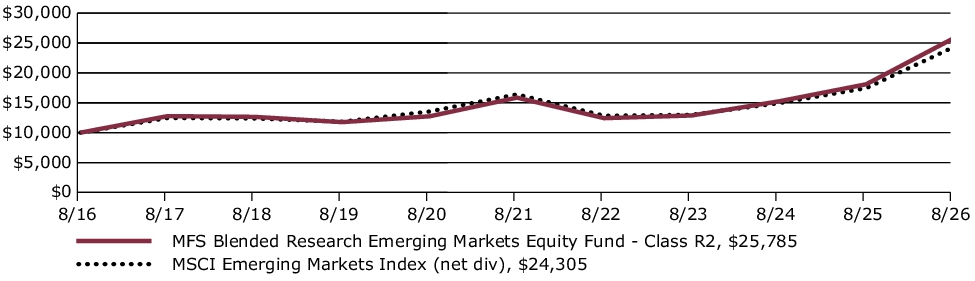
Average Annual Total Returns through 8/31/26
This table shows the average annual total returns of the class of shares noted for the periods shown, both with (if any) and without sales charges. It also shows the average annual total returns of a broad measure of market performance over the same periods.
| Share Class | 1-yr | 5-yr | 10-yr |
| R2 without sales charge | 42.47% | 10.21% | 9.94% |
| Comparative Benchmark(s) | |||
| MSCI Emerging Markets Index (net div) ∆ | 39.25% | 8.18% | 9.29% |
|
∆
|
Source: FactSet Research Systems Inc.
|
Visit mfs.com/perf/r2 for more recent performance information.
FUND STATISTICS AS OF 8/31/26
| Net Assets ($): | 223,531,926 | Total Management Fee ($)#: | 934,444 | |
| Total Number of Holdings: | 140 | Portfolio Turnover Rate (%): | 80 |
# Includes the effect of any management fee waivers, if applicable.
Where the fund holds derivatives, they are not included in the total number of portfolio holdings.
PORTFOLIO COMPOSITION (BASED ON TOTAL INVESTMENTS AS OF 8/31/26)
Portfolio structure
| Equities | 99.7% |
| Money Market Funds | 0.3% |
Top ten holdings
| Taiwan Semiconductor Manufacturing Co. Ltd. | 13.9% |
| Samsung Electronics Co. Ltd. | 5.9% |
| SK hynix, Inc. | 5.1% |
| Tencent Holdings Ltd. | 3.3% |
| China Construction Bank Corp. | 2.3% |
| Hon Hai Precision Industry Co. Ltd. | 2.0% |
| Samsung Electronics Co. Ltd. | 1.9% |
| MediaTek, Inc. | 1.8% |
| KB Financial Group, Inc. | 1.8% |
| Alibaba Group Holding Ltd. | 1.8% |
Issuer country weightings
| Taiwan | 26.5% |
| South Korea | 21.4% |
| China | 21.0% |
| India | 9.7% |
| Brazil | 4.7% |
| South Africa | 2.9% |
| Mexico | 1.7% |
| Greece | 1.7% |
| United Arab Emirates | 1.6% |
| Other Countries | 8.8% |
Top ten holdings
| Taiwan Semiconductor Manufacturing Co. Ltd. | 13.9% |
| Samsung Electronics Co. Ltd. | 5.9% |
| SK hynix, Inc. | 5.1% |
| Tencent Holdings Ltd. | 3.3% |
| China Construction Bank Corp. | 2.3% |
| Hon Hai Precision Industry Co. Ltd. | 2.0% |
| Samsung Electronics Co. Ltd. | 1.9% |
| MediaTek, Inc. | 1.8% |
| KB Financial Group, Inc. | 1.8% |
| Alibaba Group Holding Ltd. | 1.8% |
MATERIAL FUND CHANGES
This is a summary of certain changes to the fund since September 1, 2025. For more complete information, you may review the fund's prospectus as amended, which is available at funds.mfs.com or upon request at 1‑800‑225‑2606.
Effective March 1, 2026, the management fee is computed daily and paid monthly at the following annual rates based on the fund’s average daily net assets: 0.45% up to $5 billion; and 0.40% in excess of $5 billion.
Effective March 1, 2026, for Class R2 shares, the investment adviser has agreed in writing to pay a portion of the fund’s total annual operating expenses, excluding interest, taxes, extraordinary expenses, brokerage and transaction costs, certain tax reclaim recovery expenses (including contingency fees and closing agreement expenses), and investment-related expenses, such that total operating expenses do not exceed 1.10% annually of the class’s average daily net assets. This written agreement will continue until modified by the fund’s Board of Trustees, but such agreement will continue at least until December 31, 2027.
This is a summary of certain changes to the fund since September 1, 2025. For more complete information, you may review the fund's prospectus as amended, which is available at funds.mfs.com or upon request at 1‑800‑225‑2606.
This report describes certain changes to the Fund that occurred during the reporting period.
FUND EXPENSES
What were the fund costs for the last year?
| (based on a hypothetical $10,000 investment) | ||
| Class Name | Costs of a $10,000 investment | Costs paid as a percentage of a $10,000 investment |
| R3 | $120 | 0.99% |
MANAGEMENT'S DISCUSSION OF FUND PERFORMANCE
-
For the twelve months ended August 31, 2026, Class R3 shares of the MFS Blended Research Emerging Markets Equity Fund (fund) provided a total return of 42.85%, at net asset value. This compares with a return of 39.25% for the fund’s benchmark, the MSCI Emerging Markets Index (net div).
-
Global equity markets reached record levels during the period, withstanding considerable volatility amid tariffs, geopolitical conflict and high levels of uncertainty. A new geopolitical event distressed markets as US and Israeli forces launched strikes against Iran, disrupting Mideast oil and natural gas exports. During the period, renewed focus on defense and infrastructure spending brightened the economic outlook in Europe while in Japan, the election of a pro-growth prime minister sent stocks to new highs. Optimism over artificial intelligence remained high globally.
-
While the US Supreme Court struck down part of the Trump administration’s tariff strategy, the administration began deploying other authorities to largely replace the ones that were ruled unconstitutional.
-
Higher energy prices and the lingering impact from tariffs kept inflation elevated in the US, prompting the Federal Reserve to end its easing cycle. Both the European Central Bank and the Bank of Japan raised rates toward the end of the period.
-
In fixed income markets, previously range-bound global bond yields climbed following the February 2026 onset of the conflict in the Middle East and as investors appeared to price in greater fiscal and monetary uncertainty. During the Iran war, global credit spreads widened modestly before stabilizing near pre-conflict levels, supported by strong demand and resilient underlying fundamentals. Similarly, US rate volatility (as measured by the Merrill Lynch Option Volatility Estimate (MOVE) Index) rose from intra-period lows before retracting back near prior levels.
-
Top contributors to performance relative to the MSCI Emerging Markets Index:
-
Security selection and an underweight position in the information technology sector contributed to the fund's relative performance.
-
Stock selection within the industrials, financials and energy sectors also supported relative results.
-
-
Top detractors from performance relative to the MSCI Emerging Markets Index:
-
Stock selection within the materials sector held back relative performance.
-
Stock selection and an overweight position in the communication services sector further weighed on the fund's relative returns.
-
FUND PERFORMANCE
The fund’s past performance is not a good predictor of the fund’s future performance. The graph and table below do not reflect the deduction of taxes that a shareholder would pay on fund distributions or the redemption of fund shares. The graph and table below assume reinvestment of dividends and capital gain distributions.
Growth of a Hypothetical $10,000 Investment
This graph shows the performance of a hypothetical $10,000 investment in Class R3 over a ten year period or since inception, if shorter, in comparison to a broad measure of market performance.
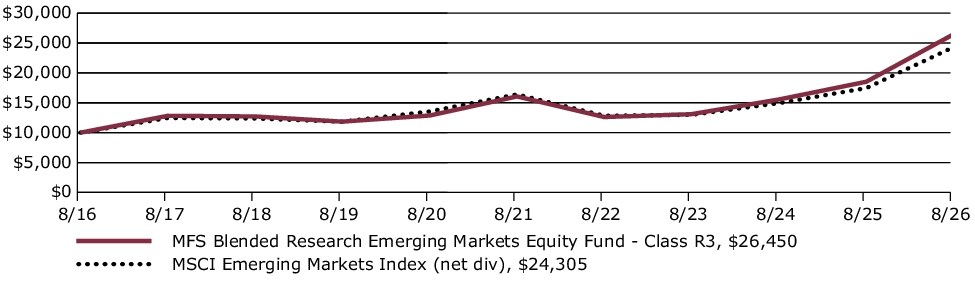
Average Annual Total Returns through 8/31/26
This table shows the average annual total returns of the class of shares noted for the periods shown, both with (if any) and without sales charges. It also shows the average annual total returns of a broad measure of market performance over the same periods.
| Share Class | 1-yr | 5-yr | 10-yr |
| R3 without sales charge | 42.85% | 10.50% | 10.22% |
| Comparative Benchmark(s) | |||
| MSCI Emerging Markets Index (net div) ∆ | 39.25% | 8.18% | 9.29% |
|
∆
|
Source: FactSet Research Systems Inc.
|
Visit mfs.com/perf/r3 for more recent performance information.
FUND STATISTICS AS OF 8/31/26
| Net Assets ($): | 223,531,926 | Total Management Fee ($)#: | 934,444 | |
| Total Number of Holdings: | 140 | Portfolio Turnover Rate (%): | 80 |
# Includes the effect of any management fee waivers, if applicable.
Where the fund holds derivatives, they are not included in the total number of portfolio holdings.
PORTFOLIO COMPOSITION (BASED ON TOTAL INVESTMENTS AS OF 8/31/26)
Portfolio structure
| Equities | 99.7% |
| Money Market Funds | 0.3% |
Top ten holdings
| Taiwan Semiconductor Manufacturing Co. Ltd. | 13.9% |
| Samsung Electronics Co. Ltd. | 5.9% |
| SK hynix, Inc. | 5.1% |
| Tencent Holdings Ltd. | 3.3% |
| China Construction Bank Corp. | 2.3% |
| Hon Hai Precision Industry Co. Ltd. | 2.0% |
| Samsung Electronics Co. Ltd. | 1.9% |
| MediaTek, Inc. | 1.8% |
| KB Financial Group, Inc. | 1.8% |
| Alibaba Group Holding Ltd. | 1.8% |
Issuer country weightings
| Taiwan | 26.5% |
| South Korea | 21.4% |
| China | 21.0% |
| India | 9.7% |
| Brazil | 4.7% |
| South Africa | 2.9% |
| Mexico | 1.7% |
| Greece | 1.7% |
| United Arab Emirates | 1.6% |
| Other Countries | 8.8% |
Top ten holdings
| Taiwan Semiconductor Manufacturing Co. Ltd. | 13.9% |
| Samsung Electronics Co. Ltd. | 5.9% |
| SK hynix, Inc. | 5.1% |
| Tencent Holdings Ltd. | 3.3% |
| China Construction Bank Corp. | 2.3% |
| Hon Hai Precision Industry Co. Ltd. | 2.0% |
| Samsung Electronics Co. Ltd. | 1.9% |
| MediaTek, Inc. | 1.8% |
| KB Financial Group, Inc. | 1.8% |
| Alibaba Group Holding Ltd. | 1.8% |
MATERIAL FUND CHANGES
This is a summary of certain changes to the fund since September 1, 2025. For more complete information, you may review the fund's prospectus as amended, which is available at funds.mfs.com or upon request at 1‑800‑225‑2606.
Effective March 1, 2026, the management fee is computed daily and paid monthly at the following annual rates based on the fund’s average daily net assets: 0.45% up to $5 billion; and 0.40% in excess of $5 billion.
Effective March 1, 2026, for Class R3 shares, the investment adviser has agreed in writing to pay a portion of the fund’s total annual operating expenses, excluding interest, taxes, extraordinary expenses, brokerage and transaction costs, certain tax reclaim recovery expenses (including contingency fees and closing agreement expenses), and investment-related expenses, such that total operating expenses do not exceed 0.85% annually of the class’s average daily net assets. This written agreement will continue until modified by the fund’s Board of Trustees, but such agreement will continue at least until December 31, 2027.
This is a summary of certain changes to the fund since September 1, 2025. For more complete information, you may review the fund's prospectus as amended, which is available at funds.mfs.com or upon request at 1‑800‑225‑2606.
This report describes certain changes to the Fund that occurred during the reporting period.
FUND EXPENSES
What were the fund costs for the last year?
| (based on a hypothetical $10,000 investment) | ||
| Class Name | Costs of a $10,000 investment | Costs paid as a percentage of a $10,000 investment |
| R4 | $95 | 0.78% |
MANAGEMENT'S DISCUSSION OF FUND PERFORMANCE
-
For the twelve months ended August 31, 2026, Class R4 shares of the MFS Blended Research Emerging Markets Equity Fund (fund) provided a total return of 43.25%, at net asset value. This compares with a return of 39.25% for the fund’s benchmark, the MSCI Emerging Markets Index (net div).
-
Global equity markets reached record levels during the period, withstanding considerable volatility amid tariffs, geopolitical conflict and high levels of uncertainty. A new geopolitical event distressed markets as US and Israeli forces launched strikes against Iran, disrupting Mideast oil and natural gas exports. During the period, renewed focus on defense and infrastructure spending brightened the economic outlook in Europe while in Japan, the election of a pro-growth prime minister sent stocks to new highs. Optimism over artificial intelligence remained high globally.
-
While the US Supreme Court struck down part of the Trump administration’s tariff strategy, the administration began deploying other authorities to largely replace the ones that were ruled unconstitutional.
-
Higher energy prices and the lingering impact from tariffs kept inflation elevated in the US, prompting the Federal Reserve to end its easing cycle. Both the European Central Bank and the Bank of Japan raised rates toward the end of the period.
-
In fixed income markets, previously range-bound global bond yields climbed following the February 2026 onset of the conflict in the Middle East and as investors appeared to price in greater fiscal and monetary uncertainty. During the Iran war, global credit spreads widened modestly before stabilizing near pre-conflict levels, supported by strong demand and resilient underlying fundamentals. Similarly, US rate volatility (as measured by the Merrill Lynch Option Volatility Estimate (MOVE) Index) rose from intra-period lows before retracting back near prior levels.
-
Top contributors to performance relative to the MSCI Emerging Markets Index:
-
Security selection and an underweight position in the information technology sector contributed to the fund's relative performance.
-
Stock selection within the industrials, financials and energy sectors also supported relative results.
-
-
Top detractors from performance relative to the MSCI Emerging Markets Index:
-
Stock selection within the materials sector held back relative performance.
-
Stock selection and an overweight position in the communication services sector further weighed on the fund's relative returns.
-
FUND PERFORMANCE
The fund’s past performance is not a good predictor of the fund’s future performance. The graph and table below do not reflect the deduction of taxes that a shareholder would pay on fund distributions or the redemption of fund shares. The graph and table below assume reinvestment of dividends and capital gain distributions.
Growth of a Hypothetical $10,000 Investment
This graph shows the performance of a hypothetical $10,000 investment in Class R4 over a ten year period or since inception, if shorter, in comparison to a broad measure of market performance.
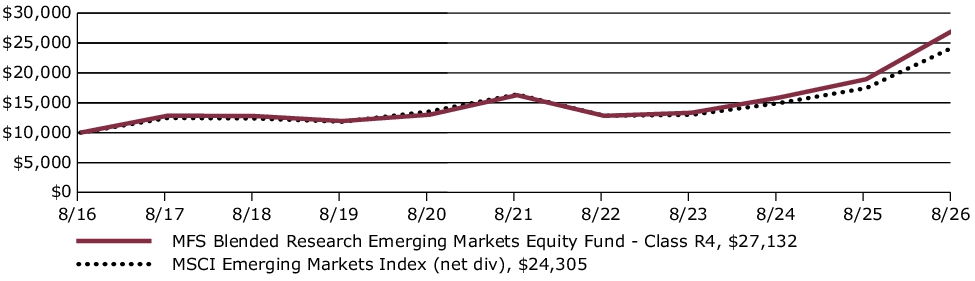
Average Annual Total Returns through 8/31/26
This table shows the average annual total returns of the class of shares noted for the periods shown, both with (if any) and without sales charges. It also shows the average annual total returns of a broad measure of market performance over the same periods.
| Share Class | 1-yr | 5-yr | 10-yr |
| R4 without sales charge | 43.25% | 10.77% | 10.50% |
| Comparative Benchmark(s) | |||
| MSCI Emerging Markets Index (net div) ∆ | 39.25% | 8.18% | 9.29% |
|
∆
|
Source: FactSet Research Systems Inc.
|
Visit mfs.com/perf/r4 for more recent performance information.
FUND STATISTICS AS OF 8/31/26
| Net Assets ($): | 223,531,926 | Total Management Fee ($)#: | 934,444 | |
| Total Number of Holdings: | 140 | Portfolio Turnover Rate (%): | 80 |
# Includes the effect of any management fee waivers, if applicable.
Where the fund holds derivatives, they are not included in the total number of portfolio holdings.
PORTFOLIO COMPOSITION (BASED ON TOTAL INVESTMENTS AS OF 8/31/26)
Portfolio structure
| Equities | 99.7% |
| Money Market Funds | 0.3% |
Top ten holdings
| Taiwan Semiconductor Manufacturing Co. Ltd. | 13.9% |
| Samsung Electronics Co. Ltd. | 5.9% |
| SK hynix, Inc. | 5.1% |
| Tencent Holdings Ltd. | 3.3% |
| China Construction Bank Corp. | 2.3% |
| Hon Hai Precision Industry Co. Ltd. | 2.0% |
| Samsung Electronics Co. Ltd. | 1.9% |
| MediaTek, Inc. | 1.8% |
| KB Financial Group, Inc. | 1.8% |
| Alibaba Group Holding Ltd. | 1.8% |
Issuer country weightings
| Taiwan | 26.5% |
| South Korea | 21.4% |
| China | 21.0% |
| India | 9.7% |
| Brazil | 4.7% |
| South Africa | 2.9% |
| Mexico | 1.7% |
| Greece | 1.7% |
| United Arab Emirates | 1.6% |
| Other Countries | 8.8% |
Top ten holdings
| Taiwan Semiconductor Manufacturing Co. Ltd. | 13.9% |
| Samsung Electronics Co. Ltd. | 5.9% |
| SK hynix, Inc. | 5.1% |
| Tencent Holdings Ltd. | 3.3% |
| China Construction Bank Corp. | 2.3% |
| Hon Hai Precision Industry Co. Ltd. | 2.0% |
| Samsung Electronics Co. Ltd. | 1.9% |
| MediaTek, Inc. | 1.8% |
| KB Financial Group, Inc. | 1.8% |
| Alibaba Group Holding Ltd. | 1.8% |
MATERIAL FUND CHANGES
This is a summary of certain changes to the fund since September 1, 2025. For more complete information, you may review the fund's prospectus as amended, which is available at funds.mfs.com or upon request at 1‑800‑225‑2606.
Effective March 1, 2026, the management fee is computed daily and paid monthly at the following annual rates based on the fund’s average daily net assets: 0.45% up to $5 billion; and 0.40% in excess of $5 billion.
Effective March 1, 2026, for Class R4 shares, the investment adviser has agreed in writing to pay a portion of the fund’s total annual operating expenses, excluding interest, taxes, extraordinary expenses, brokerage and transaction costs, certain tax reclaim recovery expenses (including contingency fees and closing agreement expenses), and investment-related expenses, such that total operating expenses do not exceed 0.60% annually of the class’s average daily net assets. This written agreement will continue until modified by the fund’s Board of Trustees, but such agreement will continue at least until December 31, 2027.
This is a summary of certain changes to the fund since September 1, 2025. For more complete information, you may review the fund's prospectus as amended, which is available at funds.mfs.com or upon request at 1‑800‑225‑2606.
This report describes certain changes to the Fund that occurred during the reporting period.
FUND EXPENSES
What were the fund costs for the last year?
| (based on a hypothetical $10,000 investment) | ||
| Class Name | Costs of a $10,000 investment | Costs paid as a percentage of a $10,000 investment |
| R6 | $89 | 0.73% |
MANAGEMENT'S DISCUSSION OF FUND PERFORMANCE
-
For the twelve months ended August 31, 2026, Class R6 shares of the MFS Blended Research Emerging Markets Equity Fund (fund) provided a total return of 43.33%, at net asset value. This compares with a return of 39.25% for the fund’s benchmark, the MSCI Emerging Markets Index (net div).
-
Global equity markets reached record levels during the period, withstanding considerable volatility amid tariffs, geopolitical conflict and high levels of uncertainty. A new geopolitical event distressed markets as US and Israeli forces launched strikes against Iran, disrupting Mideast oil and natural gas exports. During the period, renewed focus on defense and infrastructure spending brightened the economic outlook in Europe while in Japan, the election of a pro-growth prime minister sent stocks to new highs. Optimism over artificial intelligence remained high globally.
-
While the US Supreme Court struck down part of the Trump administration’s tariff strategy, the administration began deploying other authorities to largely replace the ones that were ruled unconstitutional.
-
Higher energy prices and the lingering impact from tariffs kept inflation elevated in the US, prompting the Federal Reserve to end its easing cycle. Both the European Central Bank and the Bank of Japan raised rates toward the end of the period.
-
In fixed income markets, previously range-bound global bond yields climbed following the February 2026 onset of the conflict in the Middle East and as investors appeared to price in greater fiscal and monetary uncertainty. During the Iran war, global credit spreads widened modestly before stabilizing near pre-conflict levels, supported by strong demand and resilient underlying fundamentals. Similarly, US rate volatility (as measured by the Merrill Lynch Option Volatility Estimate (MOVE) Index) rose from intra-period lows before retracting back near prior levels.
-
Top contributors to performance relative to the MSCI Emerging Markets Index:
-
Security selection and an underweight position in the information technology sector contributed to the fund's relative performance.
-
Stock selection within the industrials, financials and energy sectors also supported relative results.
-
-
Top detractors from performance relative to the MSCI Emerging Markets Index:
-
Stock selection within the materials sector held back relative performance.
-
Stock selection and an overweight position in the communication services sector further weighed on the fund's relative returns.
-
FUND PERFORMANCE
The fund’s past performance is not a good predictor of the fund’s future performance. The graph and table below do not reflect the deduction of taxes that a shareholder would pay on fund distributions or the redemption of fund shares. The graph and table below assume reinvestment of dividends and capital gain distributions.
Growth of a Hypothetical $10,000 Investment
This graph shows the performance of a hypothetical $10,000 investment in Class R6 over a ten year period or since inception, if shorter, in comparison to a broad measure of market performance.
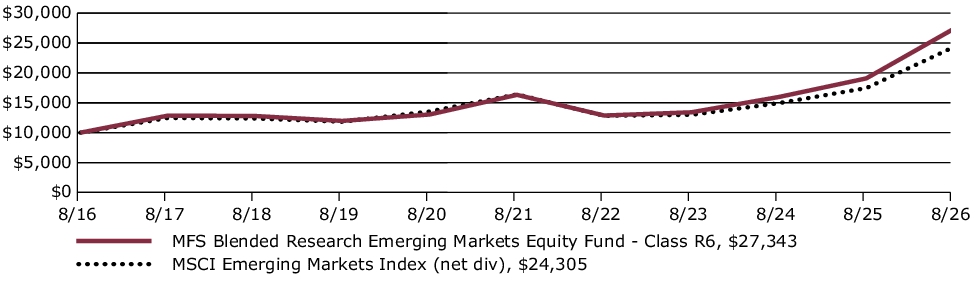
Average Annual Total Returns through 8/31/26
This table shows the average annual total returns of the class of shares noted for the periods shown, both with (if any) and without sales charges. It also shows the average annual total returns of a broad measure of market performance over the same periods.
| Share Class | 1-yr | 5-yr | 10-yr |
| R6 without sales charge | 43.33% | 10.87% | 10.58% |
| Comparative Benchmark(s) | |||
| MSCI Emerging Markets Index (net div) ∆ | 39.25% | 8.18% | 9.29% |
|
∆
|
Source: FactSet Research Systems Inc.
|
Visit mfs.com/perf/r6 for more recent performance information.
FUND STATISTICS AS OF 8/31/26
| Net Assets ($): | 223,531,926 | Total Management Fee ($)#: | 934,444 | |
| Total Number of Holdings: | 140 | Portfolio Turnover Rate (%): | 80 |
# Includes the effect of any management fee waivers, if applicable.
Where the fund holds derivatives, they are not included in the total number of portfolio holdings.
PORTFOLIO COMPOSITION (BASED ON TOTAL INVESTMENTS AS OF 8/31/26)
Portfolio structure
| Equities | 99.7% |
| Money Market Funds | 0.3% |
Top ten holdings
| Taiwan Semiconductor Manufacturing Co. Ltd. | 13.9% |
| Samsung Electronics Co. Ltd. | 5.9% |
| SK hynix, Inc. | 5.1% |
| Tencent Holdings Ltd. | 3.3% |
| China Construction Bank Corp. | 2.3% |
| Hon Hai Precision Industry Co. Ltd. | 2.0% |
| Samsung Electronics Co. Ltd. | 1.9% |
| MediaTek, Inc. | 1.8% |
| KB Financial Group, Inc. | 1.8% |
| Alibaba Group Holding Ltd. | 1.8% |
Issuer country weightings
| Taiwan | 26.5% |
| South Korea | 21.4% |
| China | 21.0% |
| India | 9.7% |
| Brazil | 4.7% |
| South Africa | 2.9% |
| Mexico | 1.7% |
| Greece | 1.7% |
| United Arab Emirates | 1.6% |
| Other Countries | 8.8% |
Top ten holdings
| Taiwan Semiconductor Manufacturing Co. Ltd. | 13.9% |
| Samsung Electronics Co. Ltd. | 5.9% |
| SK hynix, Inc. | 5.1% |
| Tencent Holdings Ltd. | 3.3% |
| China Construction Bank Corp. | 2.3% |
| Hon Hai Precision Industry Co. Ltd. | 2.0% |
| Samsung Electronics Co. Ltd. | 1.9% |
| MediaTek, Inc. | 1.8% |
| KB Financial Group, Inc. | 1.8% |
| Alibaba Group Holding Ltd. | 1.8% |
MATERIAL FUND CHANGES
This is a summary of certain changes to the fund since September 1, 2025. For more complete information, you may review the fund's prospectus as amended, which is available at funds.mfs.com or upon request at 1‑800‑225‑2606.
Effective March 1, 2026, the management fee is computed daily and paid monthly at the following annual rates based on the fund’s average daily net assets: 0.45% up to $5 billion; and 0.40% in excess of $5 billion.
Effective March 1, 2026, for Class R6 shares, the investment adviser has agreed in writing to pay a portion of the fund’s total annual operating expenses, excluding interest, taxes, extraordinary expenses, brokerage and transaction costs, certain tax reclaim recovery expenses (including contingency fees and closing agreement expenses), and investment-related expenses, such that total operating expenses do not exceed 0.54% annually of the class’s average daily net assets. This written agreement will continue until modified by the fund’s Board of Trustees, but such agreement will continue at least until December 31, 2027.
This is a summary of certain changes to the fund since September 1, 2025. For more complete information, you may review the fund's prospectus as amended, which is available at funds.mfs.com or upon request at 1‑800‑225‑2606.
This report describes certain changes to the Fund that occurred during the reporting period.
FUND EXPENSES
What were the fund costs for the last year?
| (based on a hypothetical $10,000 investment) | ||
| Class Name | Costs of a $10,000 investment | Costs paid as a percentage of a $10,000 investment |
| R6 | $49 | 0.42% |
MANAGEMENT'S DISCUSSION OF FUND PERFORMANCE
-
For the twelve months ended August 31, 2026, Class R6 shares of the MFS Blended Research International Equity Fund (fund) provided a total return of 33.07%, at net asset value. This compares with a return of 27.35% for the fund’s benchmark, the MSCI All Country World (ex-US) Index (net div).
-
Global equity markets reached record levels during the period, withstanding considerable volatility amid tariffs, geopolitical conflict and high levels of uncertainty. A new geopolitical event distressed markets as US and Israeli forces launched strikes against Iran, disrupting Mideast oil and natural gas exports. During the period, renewed focus on defense and infrastructure spending brightened the economic outlook in Europe while in Japan, the election of a pro-growth prime minister sent stocks to new highs. Optimism over artificial intelligence remained high globally.
-
While the US Supreme Court struck down part of the Trump administration’s tariff strategy, the administration began deploying other authorities to largely replace the ones that were ruled unconstitutional.
-
Higher energy prices and the lingering impact from tariffs kept inflation elevated in the US, prompting the Federal Reserve to end its easing cycle. Both the European Central Bank and the Bank of Japan raised rates toward the end of the period.
-
In fixed income markets, previously range-bound global bond yields climbed following the February 2026 onset of the conflict in the Middle East and as investors appeared to price in greater fiscal and monetary uncertainty. During the Iran war, global credit spreads widened modestly before stabilizing near pre-conflict levels, supported by strong demand and resilient underlying fundamentals. Similarly, US rate volatility (as measured by the Merrill Lynch Option Volatility Estimate (MOVE) Index) rose from intra-period lows before retracting back near prior levels.
-
Top contributors to performance relative to the MSCI All Country World (ex-US) Index:
-
Stock selection within the industrials and financials sectors benefited the fund's relative performance.
-
-
Top detractors from performance relative to the MSCI All Country World (ex-US) Index:
-
Stock selection and an overweight position in the communication services sector weakened relative performance.
-
Stock selection within the real estate sector also weighed on the fund's relative results.
-
FUND PERFORMANCE
The fund’s past performance is not a good predictor of the fund’s future performance. The graph and table below do not reflect the deduction of taxes that a shareholder would pay on fund distributions or the redemption of fund shares. The graph and table below assume reinvestment of dividends and capital gain distributions.
Growth of a Hypothetical $10,000 Investment
This graph shows the performance of a hypothetical $10,000 investment in Class R6 over a ten year period or since inception, if shorter, in comparison to a broad measure of market performance.
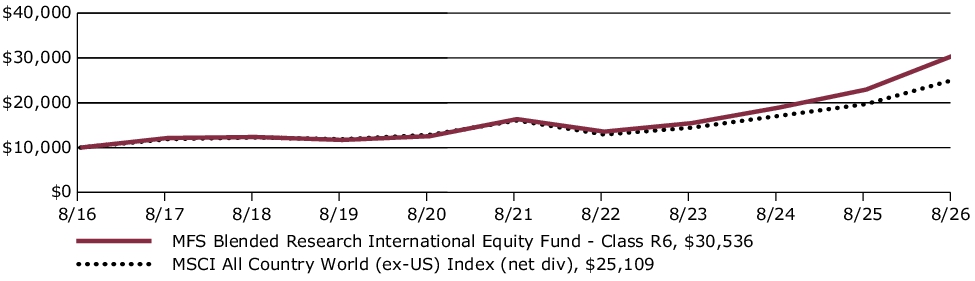
Average Annual Total Returns through 8/31/26
This table shows the average annual total returns of the class of shares noted for the periods shown, both with (if any) and without sales charges. It also shows the average annual total returns of a broad measure of market performance over the same periods.
| Share Class | 1-yr | 5-yr | 10-yr |
| R6 without sales charge | 33.07% | 13.30% | 11.81% |
| Comparative Benchmark(s) | |||
| MSCI All Country World (ex-US) Index (net div) ∆ | 27.35% | 9.37% | 9.64% |
|
∆
|
Source: FactSet Research Systems Inc.
|
Visit mfs.com/perf/r6 for more recent performance information.
FUND STATISTICS AS OF 8/31/26
| Net Assets ($): | 6,166,200,342 | Total Management Fee ($)#: | 12,017,420 | |
| Total Number of Holdings: | 159 | Portfolio Turnover Rate (%): | 38 |
# Includes the effect of any management fee waivers, if applicable.
Where the fund holds derivatives, they are not included in the total number of portfolio holdings.
PORTFOLIO COMPOSITION (BASED ON TOTAL INVESTMENTS AS OF 8/31/26)
Portfolio structure
| Equities | 98.9% |
| Money Market Funds | 1.1% |
Top ten holdings
| Taiwan Semiconductor Manufacturing Co. Ltd., ADR | 5.1% |
| ASML Holding N.V. | 2.5% |
| Samsung Electronics Co. Ltd. | 2.4% |
| SK hynix, Inc. | 2.1% |
| BNP Paribas S.A. | 1.7% |
| Novartis AG | 1.7% |
| Banco Bilbao Vizcaya Argentaria S.A. | 1.7% |
| UBS Group AG | 1.6% |
| ING Groep N.V. | 1.6% |
| Tencent Holdings Ltd. | 1.5% |
Issuer country weightings
| Japan | 13.2% |
| Canada | 9.1% |
| United Kingdom | 9.1% |
| France | 7.9% |
| South Korea | 7.7% |
| Taiwan | 7.5% |
| China | 7.3% |
| Netherlands | 6.0% |
| Switzerland | 4.6% |
| Other Countries | 27.6% |
Top ten holdings
| Taiwan Semiconductor Manufacturing Co. Ltd., ADR | 5.1% |
| ASML Holding N.V. | 2.5% |
| Samsung Electronics Co. Ltd. | 2.4% |
| SK hynix, Inc. | 2.1% |
| BNP Paribas S.A. | 1.7% |
| Novartis AG | 1.7% |
| Banco Bilbao Vizcaya Argentaria S.A. | 1.7% |
| UBS Group AG | 1.6% |
| ING Groep N.V. | 1.6% |
| Tencent Holdings Ltd. | 1.5% |
MATERIAL FUND CHANGES
This is a summary of certain changes to the fund since September 1, 2025. For more complete information, you may review the fund's prospectus as amended, which is available at funds.mfs.com or upon request at 1‑800‑225‑2606.
Effective October 1, 2025, the management fee is computed daily and paid monthly at the following annual rates based on the fund’s average daily net assets: 0.35% up to $5 billion; and 0.325% in excess of $5 billion.
Effective October 1, 2025, for Class R6 shares, the investment adviser has agreed in writing to pay a portion of the fund’s total annual operating expenses, excluding interest, taxes, extraordinary expenses, brokerage and transaction costs, certain tax reclaim recovery expenses (including contingency fees and closing agreement expenses), and investment-related expenses, such that total operating expenses do not exceed 0.43% annually of the class’s average daily net assets. This written agreement will continue until modified by the fund’s Board of Trustees, but such agreement will continue at least until December 31, 2027.
This is a summary of certain changes to the fund since September 1, 2025. For more complete information, you may review the fund's prospectus as amended, which is available at funds.mfs.com or upon request at 1‑800‑225‑2606.
This report describes certain changes to the Fund that occurred during the reporting period.
FUND EXPENSES
What were the fund costs for the last year?
| (based on a hypothetical $10,000 investment) | ||
| Class Name | Costs of a $10,000 investment | Costs paid as a percentage of a $10,000 investment |
| R4 | $58 | 0.50% |
MANAGEMENT'S DISCUSSION OF FUND PERFORMANCE
-
For the twelve months ended August 31, 2026, Class R4 shares of the MFS Blended Research International Equity Fund (fund) provided a total return of 32.93%, at net asset value. This compares with a return of 27.35% for the fund’s benchmark, the MSCI All Country World (ex-US) Index (net div).
-
Global equity markets reached record levels during the period, withstanding considerable volatility amid tariffs, geopolitical conflict and high levels of uncertainty. A new geopolitical event distressed markets as US and Israeli forces launched strikes against Iran, disrupting Mideast oil and natural gas exports. During the period, renewed focus on defense and infrastructure spending brightened the economic outlook in Europe while in Japan, the election of a pro-growth prime minister sent stocks to new highs. Optimism over artificial intelligence remained high globally.
-
While the US Supreme Court struck down part of the Trump administration’s tariff strategy, the administration began deploying other authorities to largely replace the ones that were ruled unconstitutional.
-
Higher energy prices and the lingering impact from tariffs kept inflation elevated in the US, prompting the Federal Reserve to end its easing cycle. Both the European Central Bank and the Bank of Japan raised rates toward the end of the period.
-
In fixed income markets, previously range-bound global bond yields climbed following the February 2026 onset of the conflict in the Middle East and as investors appeared to price in greater fiscal and monetary uncertainty. During the Iran war, global credit spreads widened modestly before stabilizing near pre-conflict levels, supported by strong demand and resilient underlying fundamentals. Similarly, US rate volatility (as measured by the Merrill Lynch Option Volatility Estimate (MOVE) Index) rose from intra-period lows before retracting back near prior levels.
-
Top contributors to performance relative to the MSCI All Country World (ex-US) Index:
-
Stock selection within the industrials and financials sectors benefited the fund's relative performance.
-
-
Top detractors from performance relative to the MSCI All Country World (ex-US) Index:
-
Stock selection and an overweight position in the communication services sector weakened relative performance.
-
Stock selection within the real estate sector also weighed on the fund's relative results.
-
FUND PERFORMANCE
The fund’s past performance is not a good predictor of the fund’s future performance. The graph and table below do not reflect the deduction of taxes that a shareholder would pay on fund distributions or the redemption of fund shares. The graph and table below assume reinvestment of dividends and capital gain distributions.
Growth of a Hypothetical $10,000 Investment
This graph shows the performance of a hypothetical $10,000 investment in Class R4 over a ten year period or since inception, if shorter, in comparison to a broad measure of market performance.
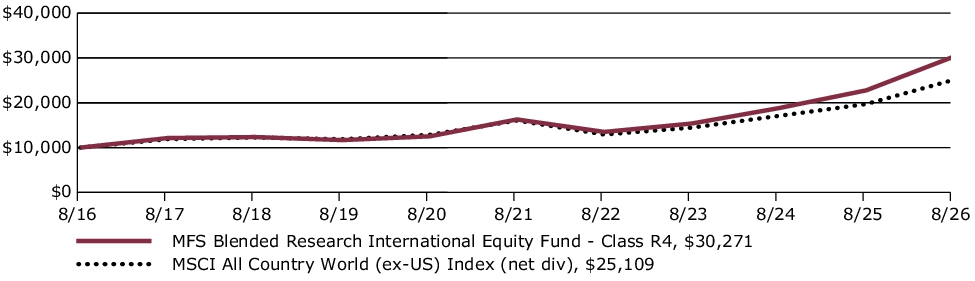
Average Annual Total Returns through 8/31/26
This table shows the average annual total returns of the class of shares noted for the periods shown, both with (if any) and without sales charges. It also shows the average annual total returns of a broad measure of market performance over the same periods.
| Share Class | 1-yr | 5-yr | 10-yr |
| R4 without sales charge | 32.93% | 13.21% | 11.71% |
| Comparative Benchmark(s) | |||
| MSCI All Country World (ex-US) Index (net div) ∆ | 27.35% | 9.37% | 9.64% |
|
∆
|
Source: FactSet Research Systems Inc.
|
Visit mfs.com/perf/r4 for more recent performance information.
FUND STATISTICS AS OF 8/31/26
| Net Assets ($): | 6,166,200,342 | Total Management Fee ($)#: | 12,017,420 | |
| Total Number of Holdings: | 159 | Portfolio Turnover Rate (%): | 38 |
# Includes the effect of any management fee waivers, if applicable.
Where the fund holds derivatives, they are not included in the total number of portfolio holdings.
PORTFOLIO COMPOSITION (BASED ON TOTAL INVESTMENTS AS OF 8/31/26)
Portfolio structure
| Equities | 98.9% |
| Money Market Funds | 1.1% |
Top ten holdings
| Taiwan Semiconductor Manufacturing Co. Ltd., ADR | 5.1% |
| ASML Holding N.V. | 2.5% |
| Samsung Electronics Co. Ltd. | 2.4% |
| SK hynix, Inc. | 2.1% |
| BNP Paribas S.A. | 1.7% |
| Novartis AG | 1.7% |
| Banco Bilbao Vizcaya Argentaria S.A. | 1.7% |
| UBS Group AG | 1.6% |
| ING Groep N.V. | 1.6% |
| Tencent Holdings Ltd. | 1.5% |
Issuer country weightings
| Japan | 13.2% |
| Canada | 9.1% |
| United Kingdom | 9.1% |
| France | 7.9% |
| South Korea | 7.7% |
| Taiwan | 7.5% |
| China | 7.3% |
| Netherlands | 6.0% |
| Switzerland | 4.6% |
| Other Countries | 27.6% |
Top ten holdings
| Taiwan Semiconductor Manufacturing Co. Ltd., ADR | 5.1% |
| ASML Holding N.V. | 2.5% |
| Samsung Electronics Co. Ltd. | 2.4% |
| SK hynix, Inc. | 2.1% |
| BNP Paribas S.A. | 1.7% |
| Novartis AG | 1.7% |
| Banco Bilbao Vizcaya Argentaria S.A. | 1.7% |
| UBS Group AG | 1.6% |
| ING Groep N.V. | 1.6% |
| Tencent Holdings Ltd. | 1.5% |
MATERIAL FUND CHANGES
This is a summary of certain changes to the fund since September 1, 2025. For more complete information, you may review the fund's prospectus as amended, which is available at funds.mfs.com or upon request at 1‑800‑225‑2606.
Effective October 1, 2025, the management fee is computed daily and paid monthly at the following annual rates based on the fund’s average daily net assets: 0.35% up to $5 billion; and 0.325% in excess of $5 billion.
Effective October 1, 2025, for Class R4 shares, the investment adviser has agreed in writing to pay a portion of the fund’s total annual operating expenses, excluding interest, taxes, extraordinary expenses, brokerage and transaction costs, certain tax reclaim recovery expenses (including contingency fees and closing agreement expenses), and investment-related expenses, such that total operating expenses do not exceed 0.52% annually of the class’s average daily net assets. This written agreement will continue until modified by the fund’s Board of Trustees, but such agreement will continue at least until December 31, 2027.
This is a summary of certain changes to the fund since September 1, 2025. For more complete information, you may review the fund's prospectus as amended, which is available at funds.mfs.com or upon request at 1‑800‑225‑2606.
This report describes certain changes to the Fund that occurred during the reporting period.
FUND EXPENSES
What were the fund costs for the last year?
| (based on a hypothetical $10,000 investment) | ||
| Class Name | Costs of a $10,000 investment | Costs paid as a percentage of a $10,000 investment |
| R3 | $88 | 0.76% |
MANAGEMENT'S DISCUSSION OF FUND PERFORMANCE
-
For the twelve months ended August 31, 2026, Class R3 shares of the MFS Blended Research International Equity Fund (fund) provided a total return of 32.63%, at net asset value. This compares with a return of 27.35% for the fund’s benchmark, the MSCI All Country World (ex-US) Index (net div).
-
Global equity markets reached record levels during the period, withstanding considerable volatility amid tariffs, geopolitical conflict and high levels of uncertainty. A new geopolitical event distressed markets as US and Israeli forces launched strikes against Iran, disrupting Mideast oil and natural gas exports. During the period, renewed focus on defense and infrastructure spending brightened the economic outlook in Europe while in Japan, the election of a pro-growth prime minister sent stocks to new highs. Optimism over artificial intelligence remained high globally.
-
While the US Supreme Court struck down part of the Trump administration’s tariff strategy, the administration began deploying other authorities to largely replace the ones that were ruled unconstitutional.
-
Higher energy prices and the lingering impact from tariffs kept inflation elevated in the US, prompting the Federal Reserve to end its easing cycle. Both the European Central Bank and the Bank of Japan raised rates toward the end of the period.
-
In fixed income markets, previously range-bound global bond yields climbed following the February 2026 onset of the conflict in the Middle East and as investors appeared to price in greater fiscal and monetary uncertainty. During the Iran war, global credit spreads widened modestly before stabilizing near pre-conflict levels, supported by strong demand and resilient underlying fundamentals. Similarly, US rate volatility (as measured by the Merrill Lynch Option Volatility Estimate (MOVE) Index) rose from intra-period lows before retracting back near prior levels.
-
Top contributors to performance relative to the MSCI All Country World (ex-US) Index:
-
Stock selection within the industrials and financials sectors benefited the fund's relative performance.
-
-
Top detractors from performance relative to the MSCI All Country World (ex-US) Index:
-
Stock selection and an overweight position in the communication services sector weakened relative performance.
-
Stock selection within the real estate sector also weighed on the fund's relative results.
-
FUND PERFORMANCE
The fund’s past performance is not a good predictor of the fund’s future performance. The graph and table below do not reflect the deduction of taxes that a shareholder would pay on fund distributions or the redemption of fund shares. The graph and table below assume reinvestment of dividends and capital gain distributions.
Growth of a Hypothetical $10,000 Investment
This graph shows the performance of a hypothetical $10,000 investment in Class R3 over a ten year period or since inception, if shorter, in comparison to a broad measure of market performance.
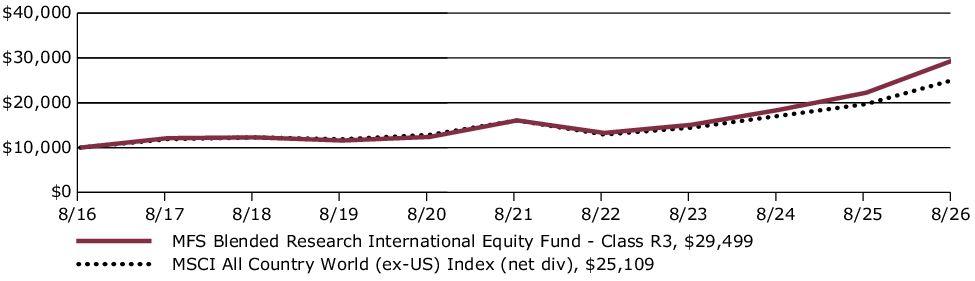
Average Annual Total Returns through 8/31/26
This table shows the average annual total returns of the class of shares noted for the periods shown, both with (if any) and without sales charges. It also shows the average annual total returns of a broad measure of market performance over the same periods.
| Share Class | 1-yr | 5-yr | 10-yr |
| R3 without sales charge | 32.63% | 12.92% | 11.42% |
| Comparative Benchmark(s) | |||
| MSCI All Country World (ex-US) Index (net div) ∆ | 27.35% | 9.37% | 9.64% |
|
∆
|
Source: FactSet Research Systems Inc.
|
Visit mfs.com/perf/r3 for more recent performance information.
FUND STATISTICS AS OF 8/31/26
| Net Assets ($): | 6,166,200,342 | Total Management Fee ($)#: | 12,017,420 | |
| Total Number of Holdings: | 159 | Portfolio Turnover Rate (%): | 38 |
# Includes the effect of any management fee waivers, if applicable.
Where the fund holds derivatives, they are not included in the total number of portfolio holdings.
PORTFOLIO COMPOSITION (BASED ON TOTAL INVESTMENTS AS OF 8/31/26)
Portfolio structure
| Equities | 98.9% |
| Money Market Funds | 1.1% |
Top ten holdings
| Taiwan Semiconductor Manufacturing Co. Ltd., ADR | 5.1% |
| ASML Holding N.V. | 2.5% |
| Samsung Electronics Co. Ltd. | 2.4% |
| SK hynix, Inc. | 2.1% |
| BNP Paribas S.A. | 1.7% |
| Novartis AG | 1.7% |
| Banco Bilbao Vizcaya Argentaria S.A. | 1.7% |
| UBS Group AG | 1.6% |
| ING Groep N.V. | 1.6% |
| Tencent Holdings Ltd. | 1.5% |
Issuer country weightings
| Japan | 13.2% |
| Canada | 9.1% |
| United Kingdom | 9.1% |
| France | 7.9% |
| South Korea | 7.7% |
| Taiwan | 7.5% |
| China | 7.3% |
| Netherlands | 6.0% |
| Switzerland | 4.6% |
| Other Countries | 27.6% |
Top ten holdings
| Taiwan Semiconductor Manufacturing Co. Ltd., ADR | 5.1% |
| ASML Holding N.V. | 2.5% |
| Samsung Electronics Co. Ltd. | 2.4% |
| SK hynix, Inc. | 2.1% |
| BNP Paribas S.A. | 1.7% |
| Novartis AG | 1.7% |
| Banco Bilbao Vizcaya Argentaria S.A. | 1.7% |
| UBS Group AG | 1.6% |
| ING Groep N.V. | 1.6% |
| Tencent Holdings Ltd. | 1.5% |
MATERIAL FUND CHANGES
This is a summary of certain changes to the fund since September 1, 2025. For more complete information, you may review the fund's prospectus as amended, which is available at funds.mfs.com or upon request at 1‑800‑225‑2606.
Effective October 1, 2025, the management fee is computed daily and paid monthly at the following annual rates based on the fund’s average daily net assets: 0.35% up to $5 billion; and 0.325% in excess of $5 billion.
Effective October 1, 2025, for Class R3 shares, the investment adviser has agreed in writing to pay a portion of the fund’s total annual operating expenses, excluding interest, taxes, extraordinary expenses, brokerage and transaction costs, certain tax reclaim recovery expenses (including contingency fees and closing agreement expenses), and investment-related expenses, such that total operating expenses do not exceed 0.77% annually of the class’s average daily net assets. This written agreement will continue until modified by the fund’s Board of Trustees, but such agreement will continue at least until December 31, 2027.
This is a summary of certain changes to the fund since September 1, 2025. For more complete information, you may review the fund's prospectus as amended, which is available at funds.mfs.com or upon request at 1‑800‑225‑2606.
This report describes certain changes to the Fund that occurred during the reporting period.
FUND EXPENSES
What were the fund costs for the last year?
| (based on a hypothetical $10,000 investment) | ||
| Class Name | Costs of a $10,000 investment | Costs paid as a percentage of a $10,000 investment |
| R2 | $116 | 1.00% |
MANAGEMENT'S DISCUSSION OF FUND PERFORMANCE
-
For the twelve months ended August 31, 2026, Class R2 shares of the MFS Blended Research International Equity Fund (fund) provided a total return of 32.25%, at net asset value. This compares with a return of 27.35% for the fund’s benchmark, the MSCI All Country World (ex-US) Index (net div).
-
Global equity markets reached record levels during the period, withstanding considerable volatility amid tariffs, geopolitical conflict and high levels of uncertainty. A new geopolitical event distressed markets as US and Israeli forces launched strikes against Iran, disrupting Mideast oil and natural gas exports. During the period, renewed focus on defense and infrastructure spending brightened the economic outlook in Europe while in Japan, the election of a pro-growth prime minister sent stocks to new highs. Optimism over artificial intelligence remained high globally.
-
While the US Supreme Court struck down part of the Trump administration’s tariff strategy, the administration began deploying other authorities to largely replace the ones that were ruled unconstitutional.
-
Higher energy prices and the lingering impact from tariffs kept inflation elevated in the US, prompting the Federal Reserve to end its easing cycle. Both the European Central Bank and the Bank of Japan raised rates toward the end of the period.
-
In fixed income markets, previously range-bound global bond yields climbed following the February 2026 onset of the conflict in the Middle East and as investors appeared to price in greater fiscal and monetary uncertainty. During the Iran war, global credit spreads widened modestly before stabilizing near pre-conflict levels, supported by strong demand and resilient underlying fundamentals. Similarly, US rate volatility (as measured by the Merrill Lynch Option Volatility Estimate (MOVE) Index) rose from intra-period lows before retracting back near prior levels.
-
Top contributors to performance relative to the MSCI All Country World (ex-US) Index:
-
Stock selection within the industrials and financials sectors benefited the fund's relative performance.
-
-
Top detractors from performance relative to the MSCI All Country World (ex-US) Index:
-
Stock selection and an overweight position in the communication services sector weakened relative performance.
-
Stock selection within the real estate sector also weighed on the fund's relative results.
-
FUND PERFORMANCE
The fund’s past performance is not a good predictor of the fund’s future performance. The graph and table below do not reflect the deduction of taxes that a shareholder would pay on fund distributions or the redemption of fund shares. The graph and table below assume reinvestment of dividends and capital gain distributions.
Growth of a Hypothetical $10,000 Investment
This graph shows the performance of a hypothetical $10,000 investment in Class R2 over a ten year period or since inception, if shorter, in comparison to a broad measure of market performance.
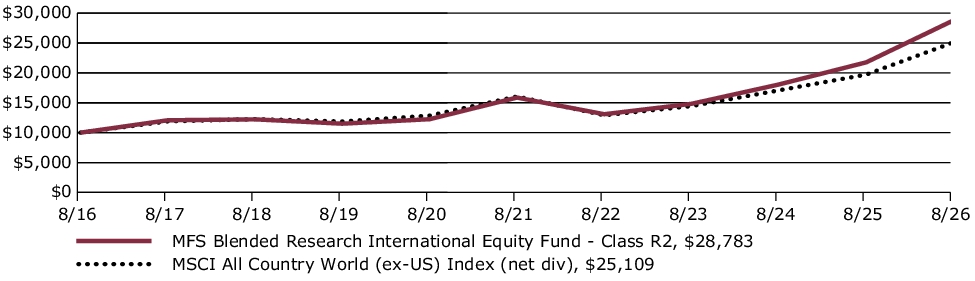
Average Annual Total Returns through 8/31/26
This table shows the average annual total returns of the class of shares noted for the periods shown, both with (if any) and without sales charges. It also shows the average annual total returns of a broad measure of market performance over the same periods.
| Share Class | 1-yr | 5-yr | 10-yr |
| R2 without sales charge | 32.25% | 12.65% | 11.15% |
| Comparative Benchmark(s) | |||
| MSCI All Country World (ex-US) Index (net div) ∆ | 27.35% | 9.37% | 9.64% |
|
∆
|
Source: FactSet Research Systems Inc.
|
Visit mfs.com/perf/r2 for more recent performance information.
FUND STATISTICS AS OF 8/31/26
| Net Assets ($): | 6,166,200,342 | Total Management Fee ($)#: | 12,017,420 | |
| Total Number of Holdings: | 159 | Portfolio Turnover Rate (%): | 38 |
# Includes the effect of any management fee waivers, if applicable.
Where the fund holds derivatives, they are not included in the total number of portfolio holdings.
PORTFOLIO COMPOSITION (BASED ON TOTAL INVESTMENTS AS OF 8/31/26)
Portfolio structure
| Equities | 98.9% |
| Money Market Funds | 1.1% |
Top ten holdings
| Taiwan Semiconductor Manufacturing Co. Ltd., ADR | 5.1% |
| ASML Holding N.V. | 2.5% |
| Samsung Electronics Co. Ltd. | 2.4% |
| SK hynix, Inc. | 2.1% |
| BNP Paribas S.A. | 1.7% |
| Novartis AG | 1.7% |
| Banco Bilbao Vizcaya Argentaria S.A. | 1.7% |
| UBS Group AG | 1.6% |
| ING Groep N.V. | 1.6% |
| Tencent Holdings Ltd. | 1.5% |
Issuer country weightings
| Japan | 13.2% |
| Canada | 9.1% |
| United Kingdom | 9.1% |
| France | 7.9% |
| South Korea | 7.7% |
| Taiwan | 7.5% |
| China | 7.3% |
| Netherlands | 6.0% |
| Switzerland | 4.6% |
| Other Countries | 27.6% |
Top ten holdings
| Taiwan Semiconductor Manufacturing Co. Ltd., ADR | 5.1% |
| ASML Holding N.V. | 2.5% |
| Samsung Electronics Co. Ltd. | 2.4% |
| SK hynix, Inc. | 2.1% |
| BNP Paribas S.A. | 1.7% |
| Novartis AG | 1.7% |
| Banco Bilbao Vizcaya Argentaria S.A. | 1.7% |
| UBS Group AG | 1.6% |
| ING Groep N.V. | 1.6% |
| Tencent Holdings Ltd. | 1.5% |
MATERIAL FUND CHANGES
This is a summary of certain changes to the fund since September 1, 2025. For more complete information, you may review the fund's prospectus as amended, which is available at funds.mfs.com or upon request at 1‑800‑225‑2606.
Effective October 1, 2025, the management fee is computed daily and paid monthly at the following annual rates based on the fund’s average daily net assets: 0.35% up to $5 billion; and 0.325% in excess of $5 billion.
Effective October 1, 2025, for Class R2 shares, the investment adviser has agreed in writing to pay a portion of the fund’s total annual operating expenses, excluding interest, taxes, extraordinary expenses, brokerage and transaction costs, certain tax reclaim recovery expenses (including contingency fees and closing agreement expenses), and investment-related expenses, such that total operating expenses do not exceed 1.02% annually of the class’s average daily net assets. This written agreement will continue until modified by the fund’s Board of Trustees, but such agreement will continue at least until December 31, 2027.
This is a summary of certain changes to the fund since September 1, 2025. For more complete information, you may review the fund's prospectus as amended, which is available at funds.mfs.com or upon request at 1‑800‑225‑2606.
This report describes certain changes to the Fund that occurred during the reporting period.
FUND EXPENSES
What were the fund costs for the last year?
| (based on a hypothetical $10,000 investment) | ||
| Class Name | Costs of a $10,000 investment | Costs paid as a percentage of a $10,000 investment |
| R1 | $174 | 1.50% |
MANAGEMENT'S DISCUSSION OF FUND PERFORMANCE
-
For the twelve months ended August 31, 2026, Class R1 shares of the MFS Blended Research International Equity Fund (fund) provided a total return of 31.68%, at net asset value. This compares with a return of 27.35% for the fund’s benchmark, the MSCI All Country World (ex-US) Index (net div).
-
Global equity markets reached record levels during the period, withstanding considerable volatility amid tariffs, geopolitical conflict and high levels of uncertainty. A new geopolitical event distressed markets as US and Israeli forces launched strikes against Iran, disrupting Mideast oil and natural gas exports. During the period, renewed focus on defense and infrastructure spending brightened the economic outlook in Europe while in Japan, the election of a pro-growth prime minister sent stocks to new highs. Optimism over artificial intelligence remained high globally.
-
While the US Supreme Court struck down part of the Trump administration’s tariff strategy, the administration began deploying other authorities to largely replace the ones that were ruled unconstitutional.
-
Higher energy prices and the lingering impact from tariffs kept inflation elevated in the US, prompting the Federal Reserve to end its easing cycle. Both the European Central Bank and the Bank of Japan raised rates toward the end of the period.
-
In fixed income markets, previously range-bound global bond yields climbed following the February 2026 onset of the conflict in the Middle East and as investors appeared to price in greater fiscal and monetary uncertainty. During the Iran war, global credit spreads widened modestly before stabilizing near pre-conflict levels, supported by strong demand and resilient underlying fundamentals. Similarly, US rate volatility (as measured by the Merrill Lynch Option Volatility Estimate (MOVE) Index) rose from intra-period lows before retracting back near prior levels.
-
Top contributors to performance relative to the MSCI All Country World (ex-US) Index:
-
Stock selection within the industrials and financials sectors benefited the fund's relative performance.
-
-
Top detractors from performance relative to the MSCI All Country World (ex-US) Index:
-
Stock selection and an overweight position in the communication services sector weakened relative performance.
-
Stock selection within the real estate sector also weighed on the fund's relative results.
-
FUND PERFORMANCE
The fund’s past performance is not a good predictor of the fund’s future performance. The graph and table below do not reflect the deduction of taxes that a shareholder would pay on fund distributions or the redemption of fund shares. The graph and table below assume reinvestment of dividends and capital gain distributions.
Growth of a Hypothetical $10,000 Investment
This graph shows the performance of a hypothetical $10,000 investment in Class R1 over a ten year period or since inception, if shorter, in comparison to a broad measure of market performance.
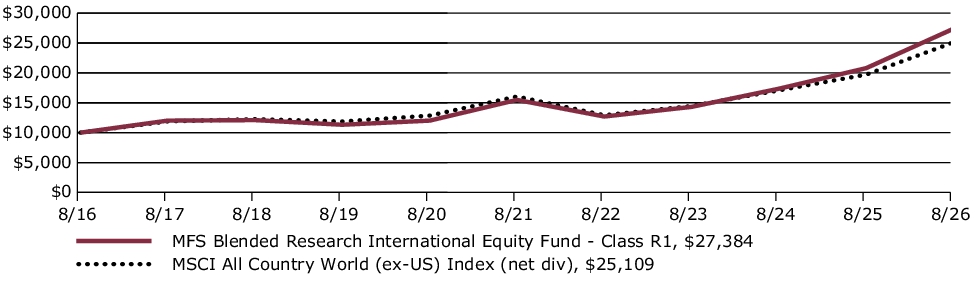
Average Annual Total Returns through 8/31/26
This table shows the average annual total returns of the class of shares noted for the periods shown, both with (if any) and without sales charges. It also shows the average annual total returns of a broad measure of market performance over the same periods.
| Share Class | 1-yr | 5-yr | 10-yr |
| R1 without sales charge | 31.68% | 12.08% | 10.60% |
| Comparative Benchmark(s) | |||
| MSCI All Country World (ex-US) Index (net div) ∆ | 27.35% | 9.37% | 9.64% |
|
∆
|
Source: FactSet Research Systems Inc.
|
Visit mfs.com/perf/r1 for more recent performance information.
FUND STATISTICS AS OF 8/31/26
| Net Assets ($): | 6,166,200,342 | Total Management Fee ($)#: | 12,017,420 | |
| Total Number of Holdings: | 159 | Portfolio Turnover Rate (%): | 38 |
# Includes the effect of any management fee waivers, if applicable.
Where the fund holds derivatives, they are not included in the total number of portfolio holdings.
PORTFOLIO COMPOSITION (BASED ON TOTAL INVESTMENTS AS OF 8/31/26)
Portfolio structure
| Equities | 98.9% |
| Money Market Funds | 1.1% |
Top ten holdings
| Taiwan Semiconductor Manufacturing Co. Ltd., ADR | 5.1% |
| ASML Holding N.V. | 2.5% |
| Samsung Electronics Co. Ltd. | 2.4% |
| SK hynix, Inc. | 2.1% |
| BNP Paribas S.A. | 1.7% |
| Novartis AG | 1.7% |
| Banco Bilbao Vizcaya Argentaria S.A. | 1.7% |
| UBS Group AG | 1.6% |
| ING Groep N.V. | 1.6% |
| Tencent Holdings Ltd. | 1.5% |
Issuer country weightings
| Japan | 13.2% |
| Canada | 9.1% |
| United Kingdom | 9.1% |
| France | 7.9% |
| South Korea | 7.7% |
| Taiwan | 7.5% |
| China | 7.3% |
| Netherlands | 6.0% |
| Switzerland | 4.6% |
| Other Countries | 27.6% |
Top ten holdings
| Taiwan Semiconductor Manufacturing Co. Ltd., ADR | 5.1% |
| ASML Holding N.V. | 2.5% |
| Samsung Electronics Co. Ltd. | 2.4% |
| SK hynix, Inc. | 2.1% |
| BNP Paribas S.A. | 1.7% |
| Novartis AG | 1.7% |
| Banco Bilbao Vizcaya Argentaria S.A. | 1.7% |
| UBS Group AG | 1.6% |
| ING Groep N.V. | 1.6% |
| Tencent Holdings Ltd. | 1.5% |
MATERIAL FUND CHANGES
This is a summary of certain changes to the fund since September 1, 2025. For more complete information, you may review the fund's prospectus as amended, which is available at funds.mfs.com or upon request at 1‑800‑225‑2606.
Effective October 1, 2025, the management fee is computed daily and paid monthly at the following annual rates based on the fund’s average daily net assets: 0.35% up to $5 billion; and 0.325% in excess of $5 billion.
Effective October 1, 2025, for Class R1 shares, the investment adviser has agreed in writing to pay a portion of the fund’s total annual operating expenses, excluding interest, taxes, extraordinary expenses, brokerage and transaction costs, certain tax reclaim recovery expenses (including contingency fees and closing agreement expenses), and investment-related expenses, such that total operating expenses do not exceed 1.52% annually of the class’s average daily net assets. This written agreement will continue until modified by the fund’s Board of Trustees, but such agreement will continue at least until December 31, 2027.
This is a summary of certain changes to the fund since September 1, 2025. For more complete information, you may review the fund's prospectus as amended, which is available at funds.mfs.com or upon request at 1‑800‑225‑2606.
This report describes certain changes to the Fund that occurred during the reporting period.
FUND EXPENSES
What were the fund costs for the last year?
| (based on a hypothetical $10,000 investment) | ||
| Class Name | Costs of a $10,000 investment | Costs paid as a percentage of a $10,000 investment |
| I | $58 | 0.50% |
MANAGEMENT'S DISCUSSION OF FUND PERFORMANCE
-
For the twelve months ended August 31, 2026, Class I shares of the MFS Blended Research International Equity Fund (fund) provided a total return of 32.97%, at net asset value. This compares with a return of 27.35% for the fund’s benchmark, the MSCI All Country World (ex-US) Index (net div).
-
Global equity markets reached record levels during the period, withstanding considerable volatility amid tariffs, geopolitical conflict and high levels of uncertainty. A new geopolitical event distressed markets as US and Israeli forces launched strikes against Iran, disrupting Mideast oil and natural gas exports. During the period, renewed focus on defense and infrastructure spending brightened the economic outlook in Europe while in Japan, the election of a pro-growth prime minister sent stocks to new highs. Optimism over artificial intelligence remained high globally.
-
While the US Supreme Court struck down part of the Trump administration’s tariff strategy, the administration began deploying other authorities to largely replace the ones that were ruled unconstitutional.
-
Higher energy prices and the lingering impact from tariffs kept inflation elevated in the US, prompting the Federal Reserve to end its easing cycle. Both the European Central Bank and the Bank of Japan raised rates toward the end of the period.
-
In fixed income markets, previously range-bound global bond yields climbed following the February 2026 onset of the conflict in the Middle East and as investors appeared to price in greater fiscal and monetary uncertainty. During the Iran war, global credit spreads widened modestly before stabilizing near pre-conflict levels, supported by strong demand and resilient underlying fundamentals. Similarly, US rate volatility (as measured by the Merrill Lynch Option Volatility Estimate (MOVE) Index) rose from intra-period lows before retracting back near prior levels.
-
Top contributors to performance relative to the MSCI All Country World (ex-US) Index:
-
Stock selection within the industrials and financials sectors benefited the fund's relative performance.
-
-
Top detractors from performance relative to the MSCI All Country World (ex-US) Index:
-
Stock selection and an overweight position in the communication services sector weakened relative performance.
-
Stock selection within the real estate sector also weighed on the fund's relative results.
-
FUND PERFORMANCE
The fund’s past performance is not a good predictor of the fund’s future performance. The graph and table below do not reflect the deduction of taxes that a shareholder would pay on fund distributions or the redemption of fund shares. The graph and table below assume reinvestment of dividends and capital gain distributions.
Growth of a Hypothetical $10,000 Investment
This graph shows the performance of a hypothetical $10,000 investment in Class I over a ten year period or since inception, if shorter, in comparison to a broad measure of market performance.
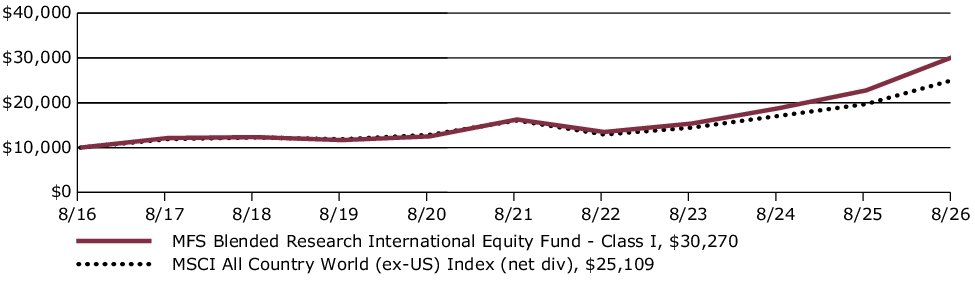
Average Annual Total Returns through 8/31/26
This table shows the average annual total returns of the class of shares noted for the periods shown, both with (if any) and without sales charges. It also shows the average annual total returns of a broad measure of market performance over the same periods.
| Share Class | 1-yr | 5-yr | 10-yr |
| I without sales charge | 32.97% | 13.22% | 11.71% |
| Comparative Benchmark(s) | |||
| MSCI All Country World (ex-US) Index (net div) ∆ | 27.35% | 9.37% | 9.64% |
|
∆
|
Source: FactSet Research Systems Inc.
|
Visit mfs.com/perf/i for more recent performance information.
FUND STATISTICS AS OF 8/31/26
| Net Assets ($): | 6,166,200,342 | Total Management Fee ($)#: | 12,017,420 | |
| Total Number of Holdings: | 159 | Portfolio Turnover Rate (%): | 38 |
# Includes the effect of any management fee waivers, if applicable.
Where the fund holds derivatives, they are not included in the total number of portfolio holdings.
PORTFOLIO COMPOSITION (BASED ON TOTAL INVESTMENTS AS OF 8/31/26)
Portfolio structure
| Equities | 98.9% |
| Money Market Funds | 1.1% |
Top ten holdings
| Taiwan Semiconductor Manufacturing Co. Ltd., ADR | 5.1% |
| ASML Holding N.V. | 2.5% |
| Samsung Electronics Co. Ltd. | 2.4% |
| SK hynix, Inc. | 2.1% |
| BNP Paribas S.A. | 1.7% |
| Novartis AG | 1.7% |
| Banco Bilbao Vizcaya Argentaria S.A. | 1.7% |
| UBS Group AG | 1.6% |
| ING Groep N.V. | 1.6% |
| Tencent Holdings Ltd. | 1.5% |
Issuer country weightings
| Japan | 13.2% |
| Canada | 9.1% |
| United Kingdom | 9.1% |
| France | 7.9% |
| South Korea | 7.7% |
| Taiwan | 7.5% |
| China | 7.3% |
| Netherlands | 6.0% |
| Switzerland | 4.6% |
| Other Countries | 27.6% |
Top ten holdings
| Taiwan Semiconductor Manufacturing Co. Ltd., ADR | 5.1% |
| ASML Holding N.V. | 2.5% |
| Samsung Electronics Co. Ltd. | 2.4% |
| SK hynix, Inc. | 2.1% |
| BNP Paribas S.A. | 1.7% |
| Novartis AG | 1.7% |
| Banco Bilbao Vizcaya Argentaria S.A. | 1.7% |
| UBS Group AG | 1.6% |
| ING Groep N.V. | 1.6% |
| Tencent Holdings Ltd. | 1.5% |
MATERIAL FUND CHANGES
This is a summary of certain changes to the fund since September 1, 2025. For more complete information, you may review the fund's prospectus as amended, which is available at funds.mfs.com or upon request at 1‑800‑225‑2606.
Effective October 1, 2025, the management fee is computed daily and paid monthly at the following annual rates based on the fund’s average daily net assets: 0.35% up to $5 billion; and 0.325% in excess of $5 billion.
Effective October 1, 2025, for Class I shares, the investment adviser has agreed in writing to pay a portion of the fund’s total annual operating expenses, excluding interest, taxes, extraordinary expenses, brokerage and transaction costs, certain tax reclaim recovery expenses (including contingency fees and closing agreement expenses), and investment-related expenses, such that total operating expenses do not exceed 0.52% annually of the class’s average daily net assets. This written agreement will continue until modified by the fund’s Board of Trustees, but such agreement will continue at least until December 31, 2027.
This is a summary of certain changes to the fund since September 1, 2025. For more complete information, you may review the fund's prospectus as amended, which is available at funds.mfs.com or upon request at 1‑800‑225‑2606.
This report describes certain changes to the Fund that occurred during the reporting period.
FUND EXPENSES
What were the fund costs for the last year?
| (based on a hypothetical $10,000 investment) | ||
| Class Name | Costs of a $10,000 investment | Costs paid as a percentage of a $10,000 investment |
| C | $174 | 1.50% |
MANAGEMENT'S DISCUSSION OF FUND PERFORMANCE
-
For the twelve months ended August 31, 2026, Class C shares of the MFS Blended Research International Equity Fund (fund) provided a total return of 31.61%, at net asset value. This compares with a return of 27.35% for the fund’s benchmark, the MSCI All Country World (ex-US) Index (net div).
-
Global equity markets reached record levels during the period, withstanding considerable volatility amid tariffs, geopolitical conflict and high levels of uncertainty. A new geopolitical event distressed markets as US and Israeli forces launched strikes against Iran, disrupting Mideast oil and natural gas exports. During the period, renewed focus on defense and infrastructure spending brightened the economic outlook in Europe while in Japan, the election of a pro-growth prime minister sent stocks to new highs. Optimism over artificial intelligence remained high globally.
-
While the US Supreme Court struck down part of the Trump administration’s tariff strategy, the administration began deploying other authorities to largely replace the ones that were ruled unconstitutional.
-
Higher energy prices and the lingering impact from tariffs kept inflation elevated in the US, prompting the Federal Reserve to end its easing cycle. Both the European Central Bank and the Bank of Japan raised rates toward the end of the period.
-
In fixed income markets, previously range-bound global bond yields climbed following the February 2026 onset of the conflict in the Middle East and as investors appeared to price in greater fiscal and monetary uncertainty. During the Iran war, global credit spreads widened modestly before stabilizing near pre-conflict levels, supported by strong demand and resilient underlying fundamentals. Similarly, US rate volatility (as measured by the Merrill Lynch Option Volatility Estimate (MOVE) Index) rose from intra-period lows before retracting back near prior levels.
-
Top contributors to performance relative to the MSCI All Country World (ex-US) Index:
-
Stock selection within the industrials and financials sectors benefited the fund's relative performance.
-
-
Top detractors from performance relative to the MSCI All Country World (ex-US) Index:
-
Stock selection and an overweight position in the communication services sector weakened relative performance.
-
Stock selection within the real estate sector also weighed on the fund's relative results.
-
FUND PERFORMANCE
The fund’s past performance is not a good predictor of the fund’s future performance. The graph and table below do not reflect the deduction of taxes that a shareholder would pay on fund distributions or the redemption of fund shares. The graph and table below assume reinvestment of dividends and capital gain distributions.
Growth of a Hypothetical $10,000 Investment
This graph shows the performance of a hypothetical $10,000 investment in Class C over a ten year period or since inception, if shorter, in comparison to a broad measure of market performance.
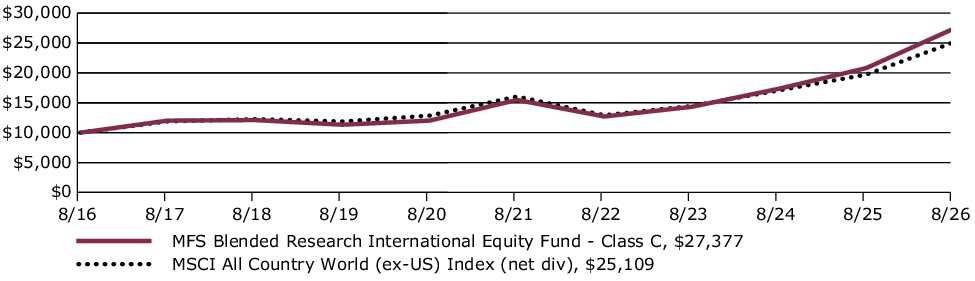
Average Annual Total Returns through 8/31/26
This table shows the average annual total returns of the class of shares noted for the periods shown, both with (if any) and without sales charges. It also shows the average annual total returns of a broad measure of market performance over the same periods.
| Share Class | 1-yr | 5-yr | 10-yr |
| C without sales charge | 31.61% | 12.09% | 10.60% |
| C with CDSC (1% for 12 months)× | 30.61% | 12.09% | 10.60% |
| Comparative Benchmark(s) | |||
| MSCI All Country World (ex-US) Index (net div) ∆ | 27.35% | 9.37% | 9.64% |
|
∆
|
Source: FactSet Research Systems Inc.
|
|
×
|
Assuming redemption at the end of the applicable period.
|
Visit mfs.com/perf/c for more recent performance information.
FUND STATISTICS AS OF 8/31/26
| Net Assets ($): | 6,166,200,342 | Total Management Fee ($)#: | 12,017,420 | |
| Total Number of Holdings: | 159 | Portfolio Turnover Rate (%): | 38 |
# Includes the effect of any management fee waivers, if applicable.
Where the fund holds derivatives, they are not included in the total number of portfolio holdings.
PORTFOLIO COMPOSITION (BASED ON TOTAL INVESTMENTS AS OF 8/31/26)
Portfolio structure
| Equities | 98.9% |
| Money Market Funds | 1.1% |
Top ten holdings
| Taiwan Semiconductor Manufacturing Co. Ltd., ADR | 5.1% |
| ASML Holding N.V. | 2.5% |
| Samsung Electronics Co. Ltd. | 2.4% |
| SK hynix, Inc. | 2.1% |
| BNP Paribas S.A. | 1.7% |
| Novartis AG | 1.7% |
| Banco Bilbao Vizcaya Argentaria S.A. | 1.7% |
| UBS Group AG | 1.6% |
| ING Groep N.V. | 1.6% |
| Tencent Holdings Ltd. | 1.5% |
Issuer country weightings
| Japan | 13.2% |
| Canada | 9.1% |
| United Kingdom | 9.1% |
| France | 7.9% |
| South Korea | 7.7% |
| Taiwan | 7.5% |
| China | 7.3% |
| Netherlands | 6.0% |
| Switzerland | 4.6% |
| Other Countries | 27.6% |
Top ten holdings
| Taiwan Semiconductor Manufacturing Co. Ltd., ADR | 5.1% |
| ASML Holding N.V. | 2.5% |
| Samsung Electronics Co. Ltd. | 2.4% |
| SK hynix, Inc. | 2.1% |
| BNP Paribas S.A. | 1.7% |
| Novartis AG | 1.7% |
| Banco Bilbao Vizcaya Argentaria S.A. | 1.7% |
| UBS Group AG | 1.6% |
| ING Groep N.V. | 1.6% |
| Tencent Holdings Ltd. | 1.5% |
MATERIAL FUND CHANGES
This is a summary of certain changes to the fund since September 1, 2025. For more complete information, you may review the fund's prospectus as amended, which is available at funds.mfs.com or upon request at 1‑800‑225‑2606.
Effective October 1, 2025, the management fee is computed daily and paid monthly at the following annual rates based on the fund’s average daily net assets: 0.35% up to $5 billion; and 0.325% in excess of $5 billion.
Effective October 1, 2025, for Class C shares, the investment adviser has agreed in writing to pay a portion of the fund’s total annual operating expenses, excluding interest, taxes, extraordinary expenses, brokerage and transaction costs, certain tax reclaim recovery expenses (including contingency fees and closing agreement expenses), and investment-related expenses, such that total operating expenses do not exceed 1.52% annually of the class’s average daily net assets. This written agreement will continue until modified by the fund’s Board of Trustees, but such agreement will continue at least until December 31, 2027.
This is a summary of certain changes to the fund since September 1, 2025. For more complete information, you may review the fund's prospectus as amended, which is available at funds.mfs.com or upon request at 1‑800‑225‑2606.
This report describes certain changes to the Fund that occurred during the reporting period.
FUND EXPENSES
What were the fund costs for the last year?
| (based on a hypothetical $10,000 investment) | ||
| Class Name | Costs of a $10,000 investment | Costs paid as a percentage of a $10,000 investment |
| B | $174 | 1.50% |
MANAGEMENT'S DISCUSSION OF FUND PERFORMANCE
-
For the twelve months ended August 31, 2026, Class B shares of the MFS Blended Research International Equity Fund (fund) provided a total return of 31.57%, at net asset value. This compares with a return of 27.35% for the fund’s benchmark, the MSCI All Country World (ex-US) Index (net div).
-
Global equity markets reached record levels during the period, withstanding considerable volatility amid tariffs, geopolitical conflict and high levels of uncertainty. A new geopolitical event distressed markets as US and Israeli forces launched strikes against Iran, disrupting Mideast oil and natural gas exports. During the period, renewed focus on defense and infrastructure spending brightened the economic outlook in Europe while in Japan, the election of a pro-growth prime minister sent stocks to new highs. Optimism over artificial intelligence remained high globally.
-
While the US Supreme Court struck down part of the Trump administration’s tariff strategy, the administration began deploying other authorities to largely replace the ones that were ruled unconstitutional.
-
Higher energy prices and the lingering impact from tariffs kept inflation elevated in the US, prompting the Federal Reserve to end its easing cycle. Both the European Central Bank and the Bank of Japan raised rates toward the end of the period.
-
In fixed income markets, previously range-bound global bond yields climbed following the February 2026 onset of the conflict in the Middle East and as investors appeared to price in greater fiscal and monetary uncertainty. During the Iran war, global credit spreads widened modestly before stabilizing near pre-conflict levels, supported by strong demand and resilient underlying fundamentals. Similarly, US rate volatility (as measured by the Merrill Lynch Option Volatility Estimate (MOVE) Index) rose from intra-period lows before retracting back near prior levels.
-
Top contributors to performance relative to the MSCI All Country World (ex-US) Index:
-
Stock selection within the industrials and financials sectors benefited the fund's relative performance.
-
-
Top detractors from performance relative to the MSCI All Country World (ex-US) Index:
-
Stock selection and an overweight position in the communication services sector weakened relative performance.
-
Stock selection within the real estate sector also weighed on the fund's relative results.
-
FUND PERFORMANCE
The fund’s past performance is not a good predictor of the fund’s future performance. The graph and table below do not reflect the deduction of taxes that a shareholder would pay on fund distributions or the redemption of fund shares. The graph and table below assume reinvestment of dividends and capital gain distributions.
Growth of a Hypothetical $10,000 Investment
This graph shows the performance of a hypothetical $10,000 investment in Class B over a ten year period or since inception, if shorter, in comparison to a broad measure of market performance.
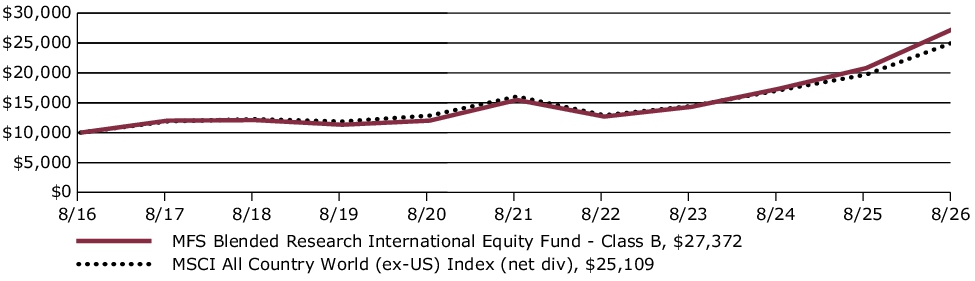
Average Annual Total Returns through 8/31/26
This table shows the average annual total returns of the class of shares noted for the periods shown, both with (if any) and without sales charges. It also shows the average annual total returns of a broad measure of market performance over the same periods.
| Share Class | 1-yr | 5-yr | 10-yr |
| B without sales charge | 31.57% | 12.08% | 10.59% |
| B with CDSC (declining over six years from 4% to 0%)× | 27.57% | 11.83% | 10.59% |
| Comparative Benchmark(s) | |||
| MSCI All Country World (ex-US) Index (net div) ∆ | 27.35% | 9.37% | 9.64% |
|
∆
|
Source: FactSet Research Systems Inc.
|
|
×
|
Assuming redemption at the end of the applicable period.
|
Visit mfs.com/perf/b for more recent performance information.
FUND STATISTICS AS OF 8/31/26
| Net Assets ($): | 6,166,200,342 | Total Management Fee ($)#: | 12,017,420 | |
| Total Number of Holdings: | 159 | Portfolio Turnover Rate (%): | 38 |
# Includes the effect of any management fee waivers, if applicable.
Where the fund holds derivatives, they are not included in the total number of portfolio holdings.
PORTFOLIO COMPOSITION (BASED ON TOTAL INVESTMENTS AS OF 8/31/26)
Portfolio structure
| Equities | 98.9% |
| Money Market Funds | 1.1% |
Top ten holdings
| Taiwan Semiconductor Manufacturing Co. Ltd., ADR | 5.1% |
| ASML Holding N.V. | 2.5% |
| Samsung Electronics Co. Ltd. | 2.4% |
| SK hynix, Inc. | 2.1% |
| BNP Paribas S.A. | 1.7% |
| Novartis AG | 1.7% |
| Banco Bilbao Vizcaya Argentaria S.A. | 1.7% |
| UBS Group AG | 1.6% |
| ING Groep N.V. | 1.6% |
| Tencent Holdings Ltd. | 1.5% |
Issuer country weightings
| Japan | 13.2% |
| Canada | 9.1% |
| United Kingdom | 9.1% |
| France | 7.9% |
| South Korea | 7.7% |
| Taiwan | 7.5% |
| China | 7.3% |
| Netherlands | 6.0% |
| Switzerland | 4.6% |
| Other Countries | 27.6% |
Top ten holdings
| Taiwan Semiconductor Manufacturing Co. Ltd., ADR | 5.1% |
| ASML Holding N.V. | 2.5% |
| Samsung Electronics Co. Ltd. | 2.4% |
| SK hynix, Inc. | 2.1% |
| BNP Paribas S.A. | 1.7% |
| Novartis AG | 1.7% |
| Banco Bilbao Vizcaya Argentaria S.A. | 1.7% |
| UBS Group AG | 1.6% |
| ING Groep N.V. | 1.6% |
| Tencent Holdings Ltd. | 1.5% |
MATERIAL FUND CHANGES
This is a summary of certain changes to the fund since September 1, 2025. For more complete information, you may review the fund's prospectus as amended, which is available at funds.mfs.com or upon request at 1‑800‑225‑2606.
Effective October 1, 2025, the management fee is computed daily and paid monthly at the following annual rates based on the fund’s average daily net assets: 0.35% up to $5 billion; and 0.325% in excess of $5 billion.
Effective October 1, 2025, for Class B shares, the investment adviser has agreed in writing to pay a portion of the fund’s total annual operating expenses, excluding interest, taxes, extraordinary expenses, brokerage and transaction costs, certain tax reclaim recovery expenses (including contingency fees and closing agreement expenses), and investment-related expenses, such that total operating expenses do not exceed 1.52% annually of the class’s average daily net assets. This written agreement will continue until modified by the fund’s Board of Trustees, but such agreement will continue at least until December 31, 2027.
This is a summary of certain changes to the fund since September 1, 2025. For more complete information, you may review the fund's prospectus as amended, which is available at funds.mfs.com or upon request at 1‑800‑225‑2606.
This report describes certain changes to the Fund that occurred during the reporting period.
FUND EXPENSES
What were the fund costs for the last year?
| (based on a hypothetical $10,000 investment) | ||
| Class Name | Costs of a $10,000 investment | Costs paid as a percentage of a $10,000 investment |
| A | $87 | 0.75% |
MANAGEMENT'S DISCUSSION OF FUND PERFORMANCE
-
For the twelve months ended August 31, 2026, Class A shares of the MFS Blended Research International Equity Fund (fund) provided a total return of 32.58%, at net asset value. This compares with a return of 27.35% for the fund’s benchmark, the MSCI All Country World (ex-US) Index (net div).
-
Global equity markets reached record levels during the period, withstanding considerable volatility amid tariffs, geopolitical conflict and high levels of uncertainty. A new geopolitical event distressed markets as US and Israeli forces launched strikes against Iran, disrupting Mideast oil and natural gas exports. During the period, renewed focus on defense and infrastructure spending brightened the economic outlook in Europe while in Japan, the election of a pro-growth prime minister sent stocks to new highs. Optimism over artificial intelligence remained high globally.
-
While the US Supreme Court struck down part of the Trump administration’s tariff strategy, the administration began deploying other authorities to largely replace the ones that were ruled unconstitutional.
-
Higher energy prices and the lingering impact from tariffs kept inflation elevated in the US, prompting the Federal Reserve to end its easing cycle. Both the European Central Bank and the Bank of Japan raised rates toward the end of the period.
-
In fixed income markets, previously range-bound global bond yields climbed following the February 2026 onset of the conflict in the Middle East and as investors appeared to price in greater fiscal and monetary uncertainty. During the Iran war, global credit spreads widened modestly before stabilizing near pre-conflict levels, supported by strong demand and resilient underlying fundamentals. Similarly, US rate volatility (as measured by the Merrill Lynch Option Volatility Estimate (MOVE) Index) rose from intra-period lows before retracting back near prior levels.
-
Top contributors to performance relative to the MSCI All Country World (ex-US) Index:
-
Stock selection within the industrials and financials sectors benefited the fund's relative performance.
-
-
Top detractors from performance relative to the MSCI All Country World (ex-US) Index:
-
Stock selection and an overweight position in the communication services sector weakened relative performance.
-
Stock selection within the real estate sector also weighed on the fund's relative results.
-
FUND PERFORMANCE
The fund’s past performance is not a good predictor of the fund’s future performance. The graph and table below do not reflect the deduction of taxes that a shareholder would pay on fund distributions or the redemption of fund shares. The graph and table below assume reinvestment of dividends and capital gain distributions.
Growth of a Hypothetical $10,000 Investment
This graph shows the performance of a hypothetical $10,000 investment in Class A over a ten year period or since inception, if shorter, in comparison to a broad measure of market performance. This graph includes the deduction of the maximum applicable sales charge.
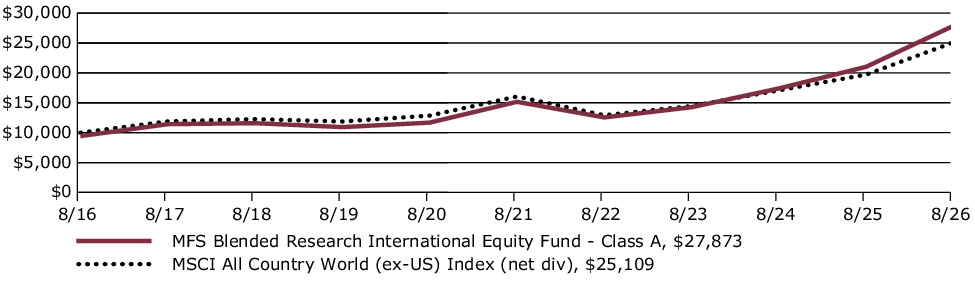
Average Annual Total Returns through 8/31/26
This table shows the average annual total returns of the class of shares noted for the periods shown, both with (if any) and without sales charges. It also shows the average annual total returns of a broad measure of market performance over the same periods.
| Share Class | 1-yr | 5-yr | 10-yr |
| A without sales charge | 32.58% | 12.95% | 11.45% |
| A with initial sales charge (5.75%) | 24.95% | 11.62% | 10.79% |
| Comparative Benchmark(s) | |||
| MSCI All Country World (ex-US) Index (net div) ∆ | 27.35% | 9.37% | 9.64% |
|
∆
|
Source: FactSet Research Systems Inc.
|
Visit mfs.com/perf/a for more recent performance information.
FUND STATISTICS AS OF 8/31/26
| Net Assets ($): | 6,166,200,342 | Total Management Fee ($)#: | 12,017,420 | |
| Total Number of Holdings: | 159 | Portfolio Turnover Rate (%): | 38 |
# Includes the effect of any management fee waivers, if applicable.
Where the fund holds derivatives, they are not included in the total number of portfolio holdings.
PORTFOLIO COMPOSITION (BASED ON TOTAL INVESTMENTS AS OF 8/31/26)
Portfolio structure
| Equities | 98.9% |
| Money Market Funds | 1.1% |
Top ten holdings
| Taiwan Semiconductor Manufacturing Co. Ltd., ADR | 5.1% |
| ASML Holding N.V. | 2.5% |
| Samsung Electronics Co. Ltd. | 2.4% |
| SK hynix, Inc. | 2.1% |
| BNP Paribas S.A. | 1.7% |
| Novartis AG | 1.7% |
| Banco Bilbao Vizcaya Argentaria S.A. | 1.7% |
| UBS Group AG | 1.6% |
| ING Groep N.V. | 1.6% |
| Tencent Holdings Ltd. | 1.5% |
Issuer country weightings
| Japan | 13.2% |
| Canada | 9.1% |
| United Kingdom | 9.1% |
| France | 7.9% |
| South Korea | 7.7% |
| Taiwan | 7.5% |
| China | 7.3% |
| Netherlands | 6.0% |
| Switzerland | 4.6% |
| Other Countries | 27.6% |
Top ten holdings
| Taiwan Semiconductor Manufacturing Co. Ltd., ADR | 5.1% |
| ASML Holding N.V. | 2.5% |
| Samsung Electronics Co. Ltd. | 2.4% |
| SK hynix, Inc. | 2.1% |
| BNP Paribas S.A. | 1.7% |
| Novartis AG | 1.7% |
| Banco Bilbao Vizcaya Argentaria S.A. | 1.7% |
| UBS Group AG | 1.6% |
| ING Groep N.V. | 1.6% |
| Tencent Holdings Ltd. | 1.5% |
MATERIAL FUND CHANGES
This is a summary of certain changes to the fund since September 1, 2025. For more complete information, you may review the fund's prospectus as amended, which is available at funds.mfs.com or upon request at 1‑800‑225‑2606.
Effective October 1, 2025, the management fee is computed daily and paid monthly at the following annual rates based on the fund’s average daily net assets: 0.35% up to $5 billion; and 0.325% in excess of $5 billion.
Effective October 1, 2025, for Class A shares, the investment adviser has agreed in writing to pay a portion of the fund’s total annual operating expenses, excluding interest, taxes, extraordinary expenses, brokerage and transaction costs, certain tax reclaim recovery expenses (including contingency fees and closing agreement expenses), and investment-related expenses, such that total operating expenses do not exceed 0.77% annually of the class’s average daily net assets. This written agreement will continue until modified by the fund’s Board of Trustees, but such agreement will continue at least until December 31, 2027.
This is a summary of certain changes to the fund since September 1, 2025. For more complete information, you may review the fund's prospectus as amended, which is available at funds.mfs.com or upon request at 1‑800‑225‑2606.
| [1] | Includes the effect of any management fee waivers, if applicable. |
| [2] | Includes the effect of any management fee waivers, if applicable. |
| [3] | Includes the effect of any management fee waivers, if applicable. |
| [4] | Includes the effect of any management fee waivers, if applicable. |
| [5] | Includes the effect of any management fee waivers, if applicable. |
| [6] | Includes the effect of any management fee waivers, if applicable. |
| [7] | Includes the effect of any management fee waivers, if applicable. |
| [8] | Includes the effect of any management fee waivers, if applicable. |
| [9] | Includes the effect of any management fee waivers, if applicable. |
| [10] | Includes the effect of any management fee waivers, if applicable. |
| [11] | Includes the effect of any management fee waivers, if applicable. |
| [12] | Includes the effect of any management fee waivers, if applicable. |
| [13] | Includes the effect of any management fee waivers, if applicable. |
| [14] | Includes the effect of any management fee waivers, if applicable. |
| [15] | Includes the effect of any management fee waivers, if applicable. |
| [16] | Includes the effect of any management fee waivers, if applicable. |
| [17] | Includes the effect of any management fee waivers, if applicable. |
| [18] | Includes the effect of any management fee waivers, if applicable. |
| [19] | Includes the effect of any management fee waivers, if applicable. |
| [20] | Includes the effect of any management fee waivers, if applicable. |
| [21] | Includes the effect of any management fee waivers, if applicable. |
| [22] | Includes the effect of any management fee waivers, if applicable. |
| [23] | Includes the effect of any management fee waivers, if applicable. |
| [24] | Includes the effect of any management fee waivers, if applicable. |
| [25] | Includes the effect of any management fee waivers, if applicable. |
| [26] | Includes the effect of any management fee waivers, if applicable. |
| [27] | Includes the effect of any management fee waivers, if applicable. |
| [28] | Includes the effect of any management fee waivers, if applicable. |
| [29] | Includes the effect of any management fee waivers, if applicable. |
| [30] | Includes the effect of any management fee waivers, if applicable. |
| [31] | Includes the effect of any management fee waivers, if applicable. |
| [32] | Includes the effect of any management fee waivers, if applicable. |
| [33] | Includes the effect of any management fee waivers, if applicable. |
| [34] | Includes the effect of any management fee waivers, if applicable. |
| [35] | Includes the effect of any management fee waivers, if applicable. |
| [36] | Includes the effect of any management fee waivers, if applicable. |
| [37] | Includes the effect of any management fee waivers, if applicable. |