Shareholder Report
Aug. 31, 2026
USD ($)
$ / shares
This report describes changes to the Fund that occurred during the reporting period.
WHAT WERE THE FUND COSTS FOR THE LAST YEAR? (based on a hypothetical $10,000 investment)
|
Class Name
|
Costs of a $10,000 investment
|
Costs paid as a percentage of a $10,000 investment*
|
|
Class A
|
$121
|
1.10%
|
HOW DID THE FUND PERFORM LAST YEAR AND WHAT AFFECTED ITS PERFORMANCE?
For the twelve months ended August 31, 2026, Class A shares of Templeton Foreign Fund returned 20.18%. The Fund compares its performance to the MSCI All Country World ex U.S. Index-NR, which returned 27.35% for the same period.
PERFORMANCE HIGHLIGHTS
|
Top contributors to performance:
|
|
|
↑
|
The strongest positive contribution theme was in artificial intelligence (AI) infrastructure and semiconductors. The top two contributors at the stock level were Samsung Electronics and STMicroelectronics, supported by memory demand, high-bandwidth memory and AI-related supply tightness. ASM International was another key contributor benefiting from these dynamics.
|
|
↑
|
Elsewhere, SSE, a U.K. network and renewables utility, was a significant contributor during the year, having raised substantial equity funding alongside its Q3 2025 results, confirming 2030 guidance and highlighting significant opportunities in transmission infrastructure over the next decade.
|
|
↑
|
Information technology was the best performing sector in relative terms followed by communication services. Within the latter sector, no single stock made an especially significant contribution to relative performance, but the Fund benefited from an underweight allocation to a sector which was the worst performing GICS sector for the core benchmark during the period.
|
|
Top detractors from performance:
|
|
|
↓
|
Stock selection in industrials was the principal source of detraction. Within the sector, Verisure, the Swedish home security company was the largest detractor from performance. The company’s post IPO life has been challenging, as it has so far been unable to strike a satisfactory balance of free-cash-flow generation and subscription growth. Adecco Group and CNH Industrial also detracted due to stock specific reasons.
|
|
↓
|
Health care detracted during the period owing to adverse stock selection effects. Ireland-based ICON plc was the biggest detractor from the sector as the stock fell sharply after accounting irregularities were disclosed during the first quarter of 2026. Pharmaceuticals group Sanofi was also amongst the top ten detractors at the stock level.
|
|
↓
|
The single largest detractor at the stock level was India-based HDFC Bank which detracted after the unexpected chairman resignation raised governance concerns.
|
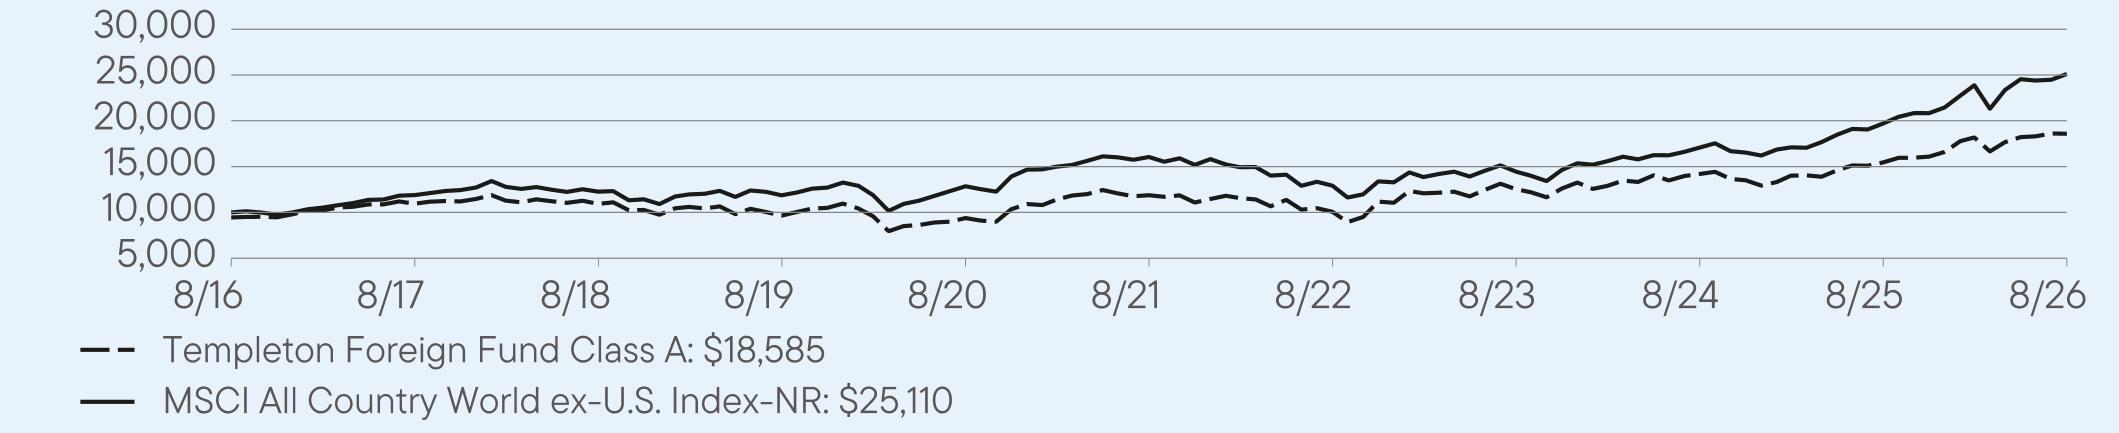
AVERAGE ANNUAL TOTAL RETURNS (%) Period Ended August 31, 2026
|
|
1 Year
|
5 Year
|
10 Year
|
|
Class A
|
20.18
|
9.38
|
7.00
|
|
Class A (with sales charge)
|
13.60
|
8.15
|
6.39
|
|
MSCI All Country World ex-U.S. Index-NR
|
27.35
|
9.37
|
9.65
|
For current month-end performance, please call Franklin Templeton at (800) DIAL BEN/342-5236 or visit
https://www.franklintempleton.com/investments/options/mutual-funds.
https://www.franklintempleton.com/investments/options/mutual-funds.
Important data provider notices and terms available at www.franklintempletondatasources.com.
KEY FUND STATISTICS (as of August 31, 2026)
|
Total Net Assets
|
$2,443,792,095
|
|
Total Number of Portfolio Holdings
|
47
|
|
Total Management Fee Paid
|
$16,846,479
|
|
Portfolio Turnover Rate
|
47.28%
|
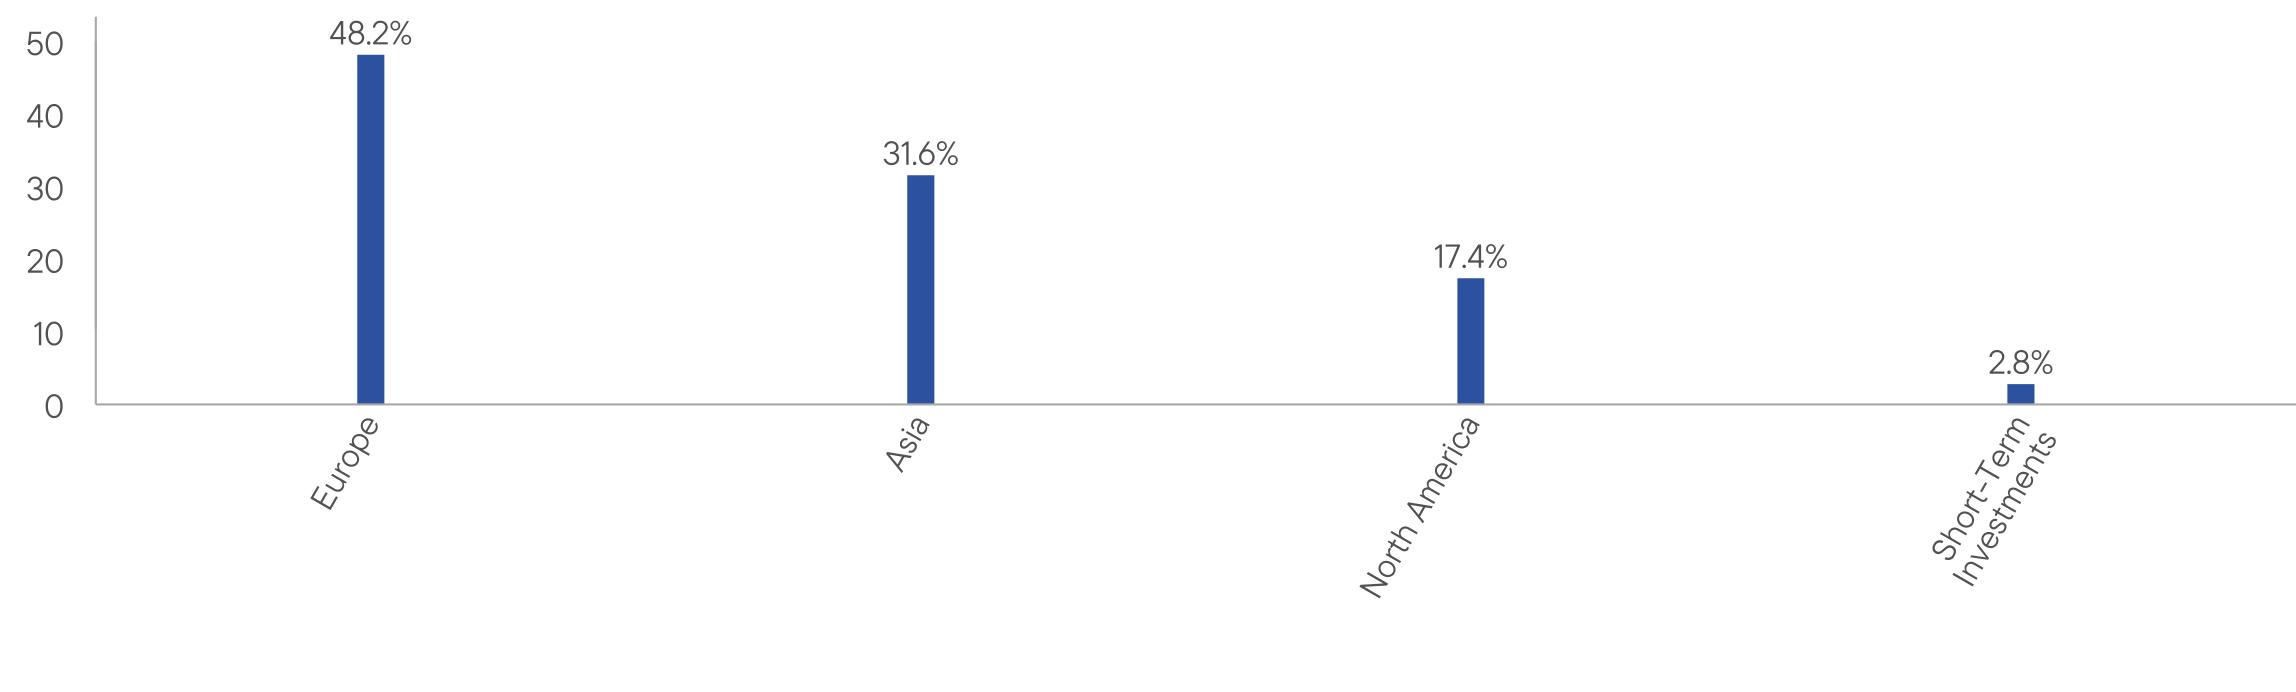
WHAT DID THE FUND INVEST IN? (as of August 31, 2026)
Portfolio Composition* (% of Total Investments)
HOW HAS THE FUND CHANGED?
On January 1, 2026, the Fund’s principal investment strategies were revised to reflect reduced exposure to investments in derivative instruments and equity-linked notes.
In connection with these changes, principal risk disclosure regarding derivative instruments and equity-linked notes was removed from the principal risks section of the prospectus.
Effective September 30, 2025, Peter D. Sartori became a portfolio manager of the Fund.
This is a summary of certain changes to the Fund since September 1, 2025. For more complete information, you may review the Fund’s current prospectus and any applicable supplements and the Fund’s next prospectus, which we expect to be available by January 1, 2027, at https://www.franklintempleton.com/regulatory-fund-documents or upon request at (800) DIAL BEN/342-5236 or prospectus.us.franklintempleton@fisglobal.com.
This report describes changes to the Fund that occurred during the reporting period.
WHAT WERE THE FUND COSTS FOR THE LAST YEAR? (based on a hypothetical $10,000 investment)
|
Class Name
|
Costs of a $10,000 investment
|
Costs paid as a percentage of a $10,000 investment*
|
|
Class C
|
$203
|
1.85%
|
HOW DID THE FUND PERFORM LAST YEAR AND WHAT AFFECTED ITS PERFORMANCE?
For the twelve months ended August 31, 2026, Class C shares of Templeton Foreign Fund returned 19.30%. The Fund compares its performance to the MSCI All Country World ex U.S. Index-NR, which returned 27.35% for the same period.
PERFORMANCE HIGHLIGHTS
|
Top contributors to performance:
|
|
|
↑
|
The strongest positive contribution theme was in artificial intelligence (AI) infrastructure and semiconductors. The top two contributors at the stock level were Samsung Electronics and STMicroelectronics, supported by memory demand, high-bandwidth memory and AI-related supply tightness. ASM International was another key contributor benefiting from these dynamics.
|
|
↑
|
Elsewhere, SSE, a U.K. network and renewables utility, was a significant contributor during the year, having raised substantial equity funding alongside its Q3 2025 results, confirming 2030 guidance and highlighting significant opportunities in transmission infrastructure over the next decade.
|
|
↑
|
Information technology was the best performing sector in relative terms followed by communication services. Within the latter sector, no single stock made an especially significant contribution to relative performance, but the Fund benefited from an underweight allocation to a sector which was the worst performing GICS sector for the core benchmark during the period.
|
|
Top detractors from performance:
|
|
|
↓
|
Stock selection in industrials was the principal source of detraction. Within the sector, Verisure, the Swedish home security company was the largest detractor from performance. The company’s post IPO life has been challenging, as it has so far been unable to strike a satisfactory balance of free-cash-flow generation and subscription growth. Adecco Group and CNH Industrial also detracted due to stock specific reasons.
|
|
↓
|
Health care detracted during the period owing to adverse stock selection effects. Ireland-based ICON plc was the biggest detractor from the sector as the stock fell sharply after accounting irregularities were disclosed during the first quarter of 2026. Pharmaceuticals group Sanofi was also amongst the top ten detractors at the stock level.
|
|
↓
|
The single largest detractor at the stock level was India-based HDFC Bank which detracted after the unexpected chairman resignation raised governance concerns.
|
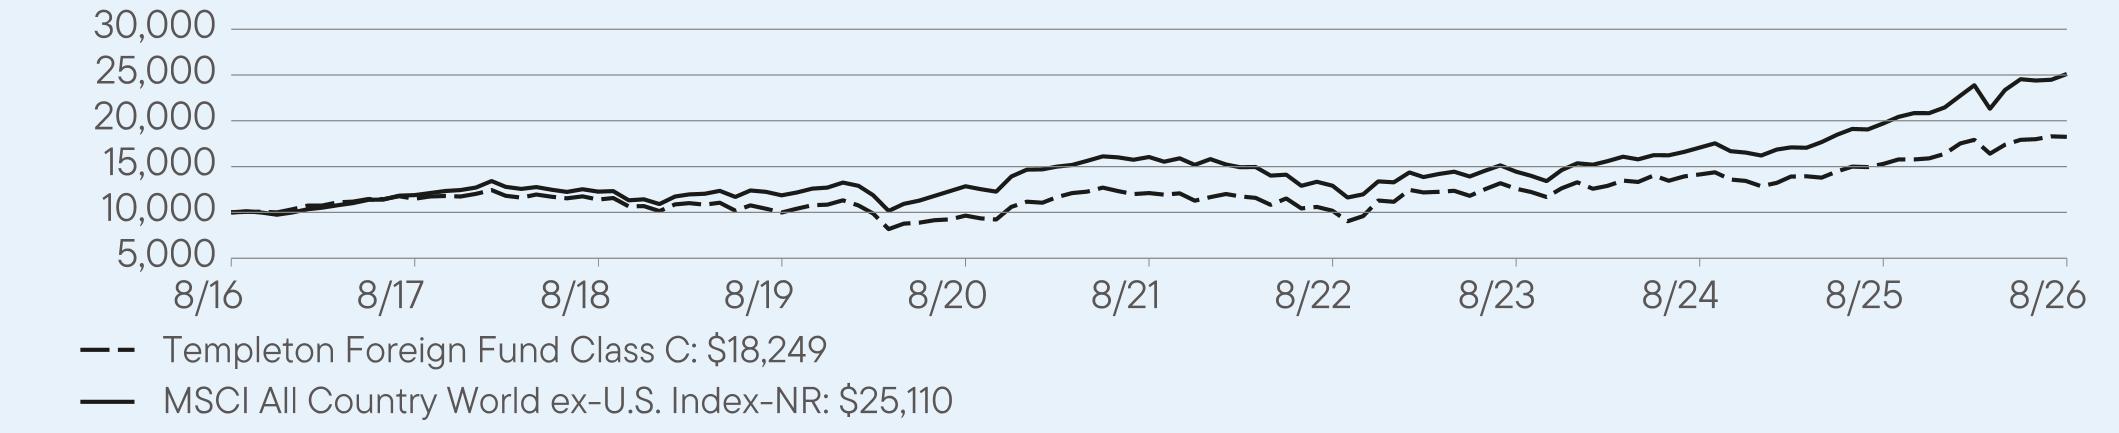
AVERAGE ANNUAL TOTAL RETURNS (%) Period Ended August 31, 2026
|
|
1 Year
|
5 Year
|
10 Year
|
|
Class C
|
19.30
|
8.55
|
6.20
|
|
Class C (with sales charge)
|
18.30
|
8.55
|
6.20
|
|
MSCI All Country World ex-U.S. Index-NR
|
27.35
|
9.37
|
9.65
|
For current month-end performance, please call Franklin Templeton at (800) DIAL BEN/342-5236 or visit
https://www.franklintempleton.com/investments/options/mutual-funds.
https://www.franklintempleton.com/investments/options/mutual-funds.
Important data provider notices and terms available at www.franklintempletondatasources.com.
KEY FUND STATISTICS (as of August 31, 2026)
|
Total Net Assets
|
$2,443,792,095
|
|
Total Number of Portfolio Holdings
|
47
|
|
Total Management Fee Paid
|
$16,846,479
|
|
Portfolio Turnover Rate
|
47.28%
|
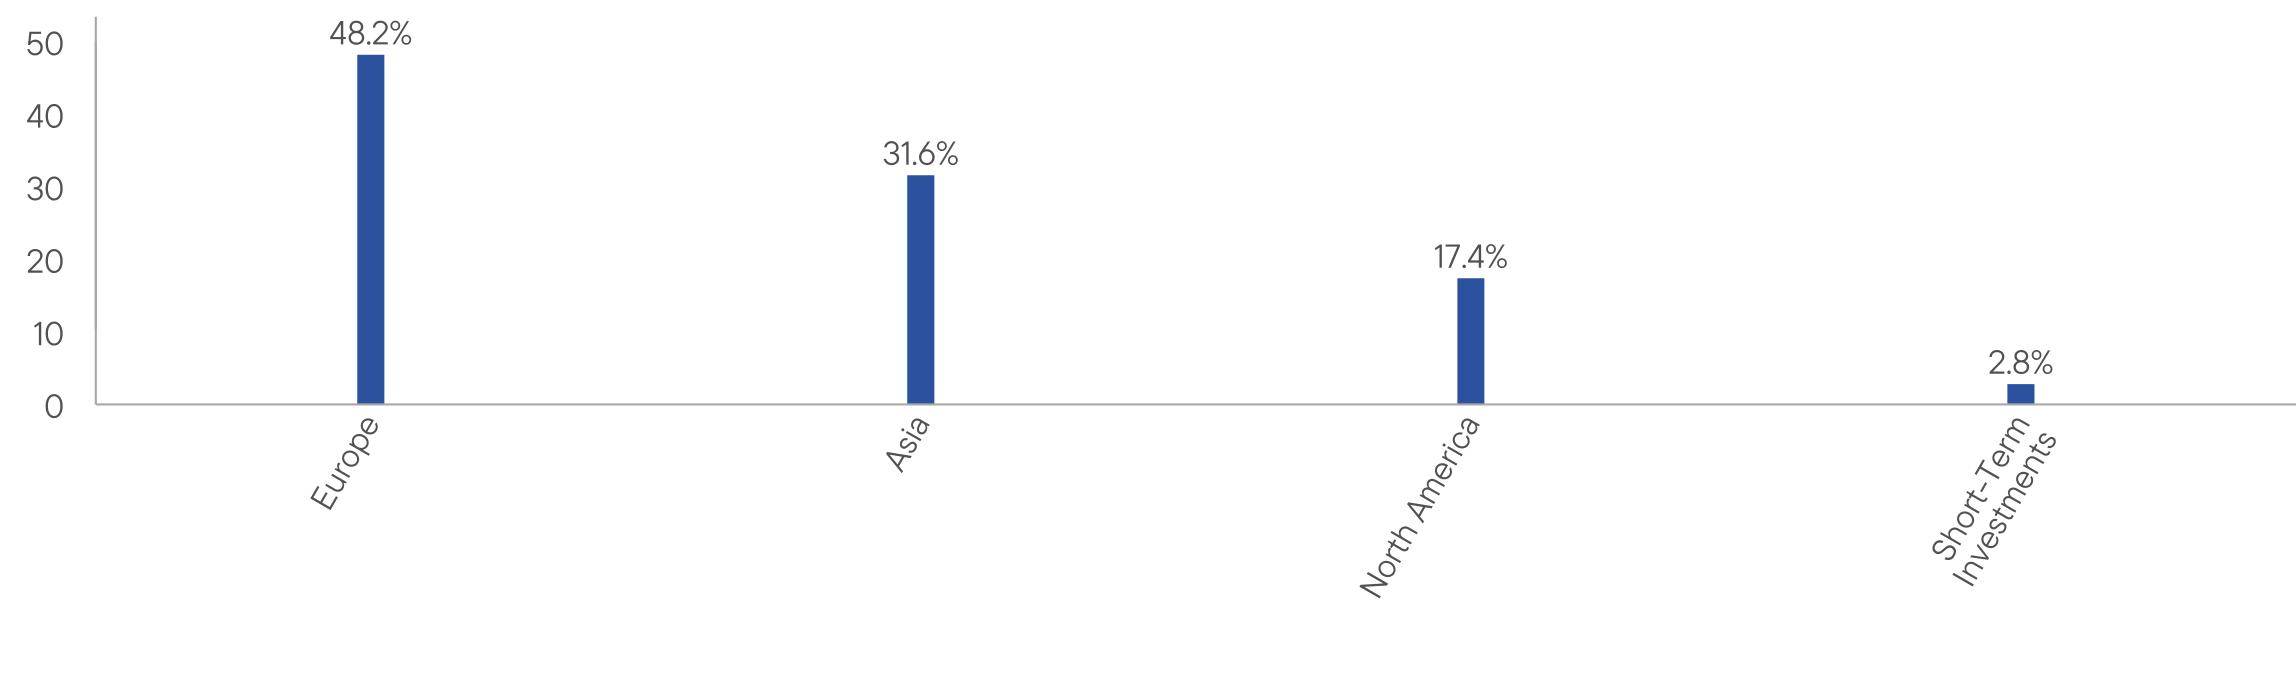
WHAT DID THE FUND INVEST IN? (as of August 31, 2026)
Portfolio Composition* (% of Total Investments)
HOW HAS THE FUND CHANGED?
On January 1, 2026, the Fund’s principal investment strategies were revised to reflect reduced exposure to investments in derivative instruments and equity-linked notes.
In connection with these changes, principal risk disclosure regarding derivative instruments and equity-linked notes was removed from the principal risks section of the prospectus.
Effective September 30, 2025, Peter D. Sartori became a portfolio manager of the Fund.
This is a summary of certain changes to the Fund since September 1, 2025. For more complete information, you may review the Fund’s current prospectus and any applicable supplements and the Fund’s next prospectus, which we expect to be available by January 1, 2027, at https://www.franklintempleton.com/regulatory-fund-documents or upon request at (800) DIAL BEN/342-5236 or prospectus.us.franklintempleton@fisglobal.com.
This report describes changes to the Fund that occurred during the reporting period.
WHAT WERE THE FUND COSTS FOR THE LAST YEAR? (based on a hypothetical $10,000 investment)
|
Class Name
|
Costs of a $10,000 investment
|
Costs paid as a percentage of a $10,000 investment*
|
|
Class R
|
$148
|
1.35%
|
HOW DID THE FUND PERFORM LAST YEAR AND WHAT AFFECTED ITS PERFORMANCE?
For the twelve months ended August 31, 2026, Class R shares of Templeton Foreign Fund returned 19.86%. The Fund compares its performance to the MSCI All Country World ex U.S. Index-NR, which returned 27.35% for the same period.
PERFORMANCE HIGHLIGHTS
|
Top contributors to performance:
|
|
|
↑
|
The strongest positive contribution theme was in artificial intelligence (AI) infrastructure and semiconductors. The top two contributors at the stock level were Samsung Electronics and STMicroelectronics, supported by memory demand, high-bandwidth memory and AI-related supply tightness. ASM International was another key contributor benefiting from these dynamics.
|
|
↑
|
Elsewhere, SSE, a U.K. network and renewables utility, was a significant contributor during the year, having raised substantial equity funding alongside its Q3 2025 results, confirming 2030 guidance and highlighting significant opportunities in transmission infrastructure over the next decade.
|
|
↑
|
Information technology was the best performing sector in relative terms followed by communication services. Within the latter sector, no single stock made an especially significant contribution to relative performance, but the Fund benefited from an underweight allocation to a sector which was the worst performing GICS sector for the core benchmark during the period.
|
|
Top detractors from performance:
|
|
|
↓
|
Stock selection in industrials was the principal source of detraction. Within the sector, Verisure, the Swedish home security company was the largest detractor from performance. The company’s post IPO life has been challenging, as it has so far been unable to strike a satisfactory balance of free-cash-flow generation and subscription growth. Adecco Group and CNH Industrial also detracted due to stock specific reasons.
|
|
↓
|
Health care detracted during the period owing to adverse stock selection effects. Ireland-based ICON plc was the biggest detractor from the sector as the stock fell sharply after accounting irregularities were disclosed during the first quarter of 2026. Pharmaceuticals group Sanofi was also amongst the top ten detractors at the stock level.
|
|
↓
|
The single largest detractor at the stock level was India-based HDFC Bank which detracted after the unexpected chairman resignation raised governance concerns.
|
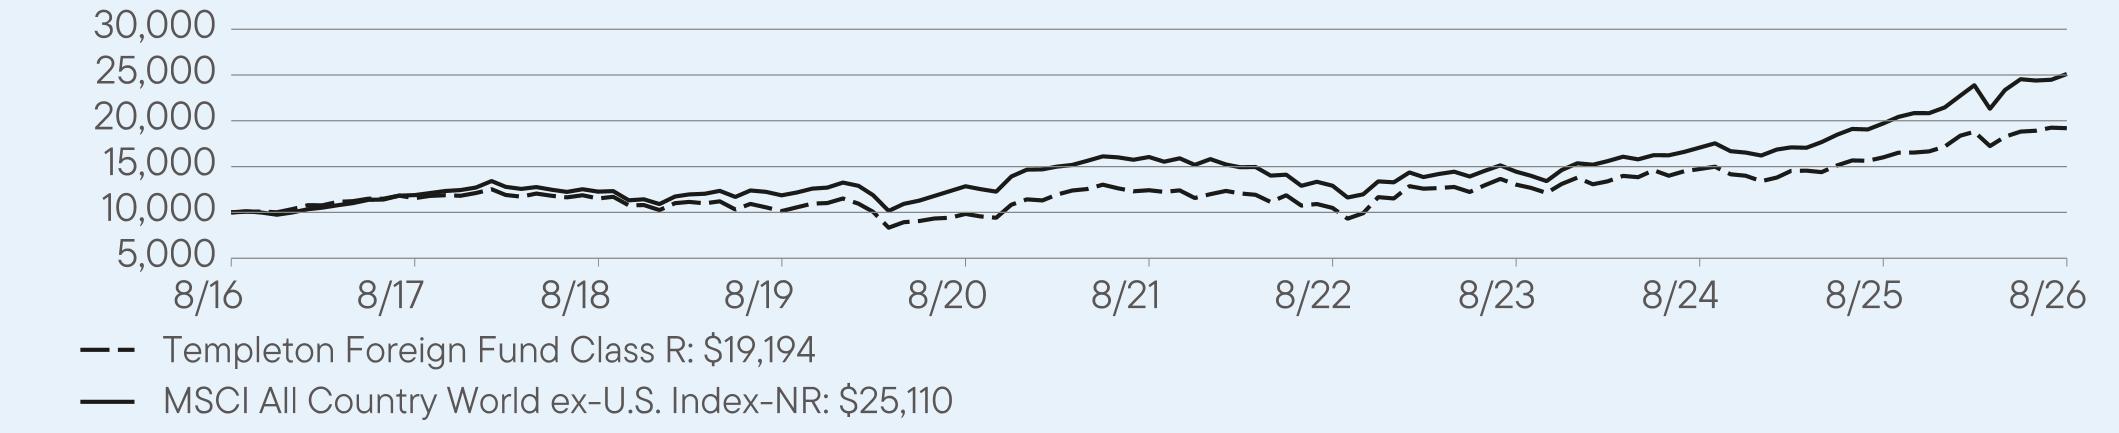
AVERAGE ANNUAL TOTAL RETURNS (%) Period Ended August 31, 2026
|
|
1 Year
|
5 Year
|
10 Year
|
|
Class R
|
19.86
|
9.10
|
6.74
|
|
MSCI All Country World ex-U.S. Index-NR
|
27.35
|
9.37
|
9.65
|
For current month-end performance, please call Franklin Templeton at (800) DIAL BEN/342-5236 or visit
https://www.franklintempleton.com/investments/options/mutual-funds.
https://www.franklintempleton.com/investments/options/mutual-funds.
Important data provider notices and terms available at www.franklintempletondatasources.com.
KEY FUND STATISTICS (as of August 31, 2026)
|
Total Net Assets
|
$2,443,792,095
|
|
Total Number of Portfolio Holdings
|
47
|
|
Total Management Fee Paid
|
$16,846,479
|
|
Portfolio Turnover Rate
|
47.28%
|
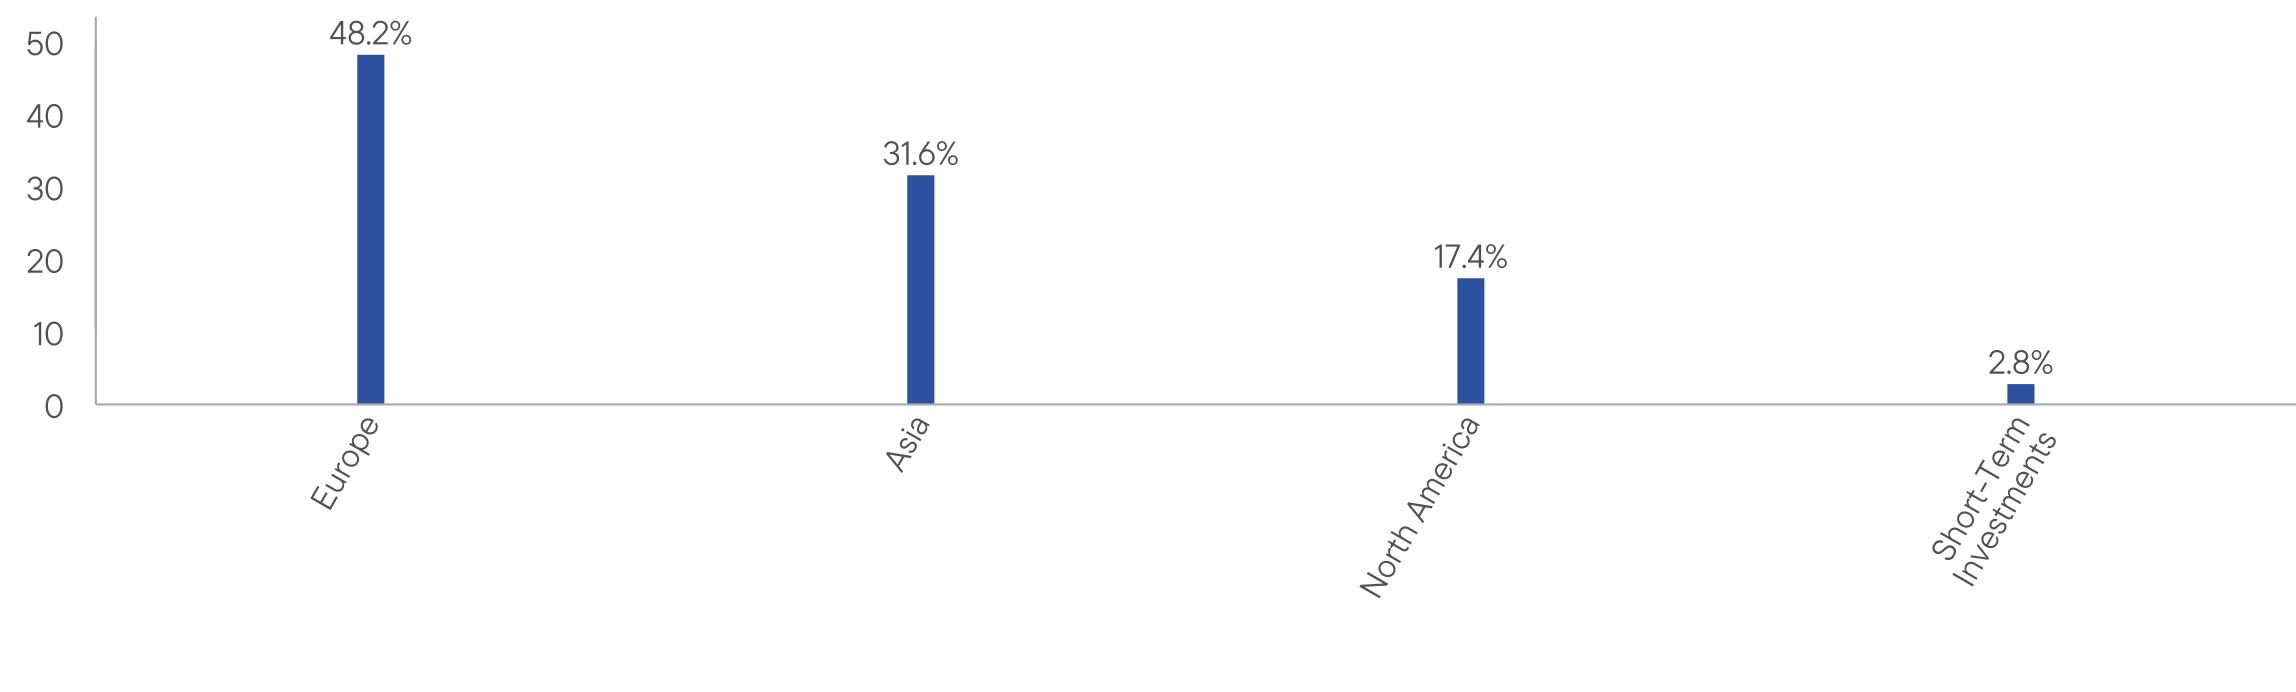
WHAT DID THE FUND INVEST IN? (as of August 31, 2026)
Portfolio Composition* (% of Total Investments)
HOW HAS THE FUND CHANGED?
On January 1, 2026, the Fund’s principal investment strategies were revised to reflect reduced exposure to investments in derivative instruments and equity-linked notes.
In connection with these changes, principal risk disclosure regarding derivative instruments and equity-linked notes was removed from the principal risks section of the prospectus.
Effective September 30, 2025, Peter D. Sartori became a portfolio manager of the Fund.
This is a summary of certain changes to the Fund since September 1, 2025. For more complete information, you may review the Fund’s current prospectus and any applicable supplements and the Fund’s next prospectus, which we expect to be available by January 1, 2027, at https://www.franklintempleton.com/regulatory-fund-documents or upon request at (800) DIAL BEN/342-5236 or prospectus.us.franklintempleton@fisglobal.com.
This report describes changes to the Fund that occurred during the reporting period.
WHAT WERE THE FUND COSTS FOR THE LAST YEAR? (based on a hypothetical $10,000 investment)
|
Class Name
|
Costs of a $10,000 investment
|
Costs paid as a percentage of a $10,000 investment*
|
|
Class R6
|
$82
|
0.74%
|
HOW DID THE FUND PERFORM LAST YEAR AND WHAT AFFECTED ITS PERFORMANCE?
For the twelve months ended August 31, 2026, Class R6 shares of Templeton Foreign Fund returned 20.56%. The Fund compares its performance to the MSCI All Country World ex U.S. Index-NR, which returned 27.35% for the same period.
PERFORMANCE HIGHLIGHTS
|
Top contributors to performance:
|
|
|
↑
|
The strongest positive contribution theme was in artificial intelligence (AI) infrastructure and semiconductors. The top two contributors at the stock level were Samsung Electronics and STMicroelectronics, supported by memory demand, high-bandwidth memory and AI-related supply tightness. ASM International was another key contributor benefiting from these dynamics.
|
|
↑
|
Elsewhere, SSE, a U.K. network and renewables utility, was a significant contributor during the year, having raised substantial equity funding alongside its Q3 2025 results, confirming 2030 guidance and highlighting significant opportunities in transmission infrastructure over the next decade.
|
|
↑
|
Information technology was the best performing sector in relative terms followed by communication services. Within the latter sector, no single stock made an especially significant contribution to relative performance, but the Fund benefited from an underweight allocation to a sector which was the worst performing GICS sector for the core benchmark during the period.
|
|
Top detractors from performance:
|
|
|
↓
|
Stock selection in industrials was the principal source of detraction. Within the sector, Verisure, the Swedish home security company was the largest detractor from performance. The company’s post IPO life has been challenging, as it has so far been unable to strike a satisfactory balance of free-cash-flow generation and subscription growth. Adecco Group and CNH Industrial also detracted due to stock specific reasons.
|
|
↓
|
Health care detracted during the period owing to adverse stock selection effects. Ireland-based ICON plc was the biggest detractor from the sector as the stock fell sharply after accounting irregularities were disclosed during the first quarter of 2026. Pharmaceuticals group Sanofi was also amongst the top ten detractors at the stock level.
|
|
↓
|
The single largest detractor at the stock level was India-based HDFC Bank which detracted after the unexpected chairman resignation raised governance concerns.
|
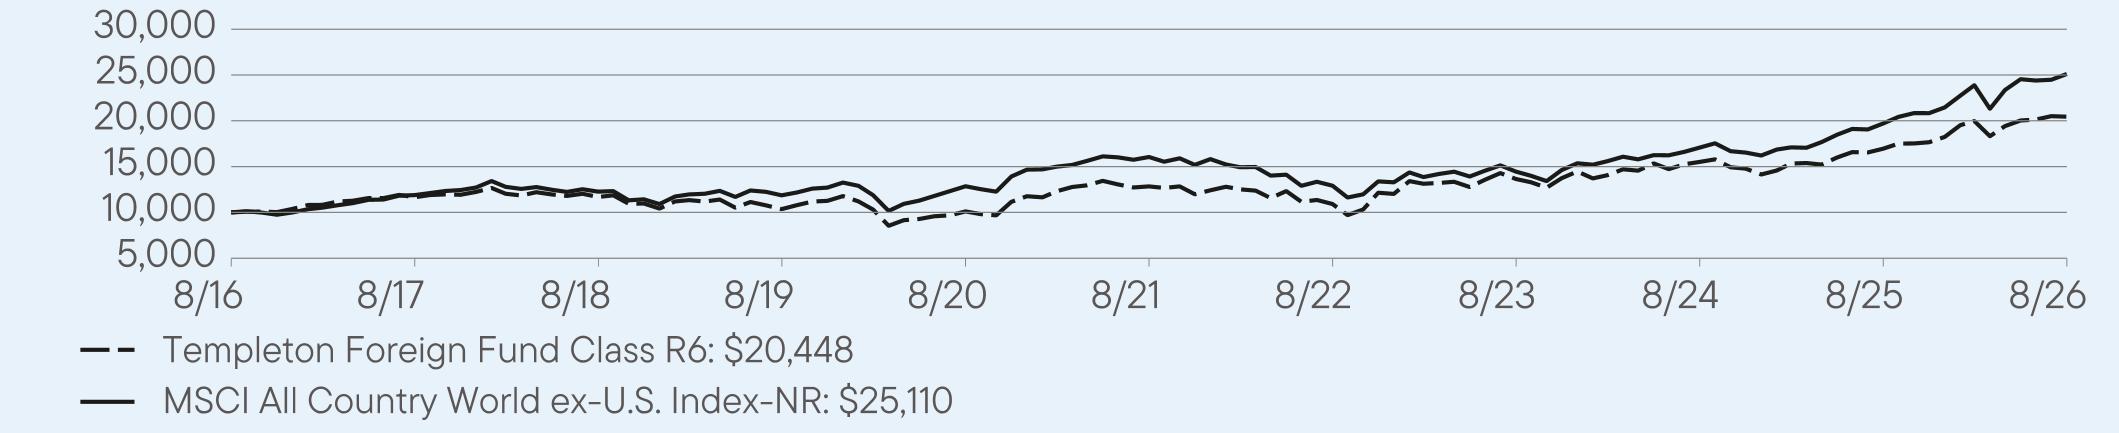
AVERAGE ANNUAL TOTAL RETURNS (%) Period Ended August 31, 2026
|
|
1 Year
|
5 Year
|
10 Year
|
|
Class R6
|
20.56
|
9.75
|
7.41
|
|
MSCI All Country World ex-U.S. Index-NR
|
27.35
|
9.37
|
9.65
|
For current month-end performance, please call Franklin Templeton at (800) DIAL BEN/342-5236 or visit
https://www.franklintempleton.com/investments/options/mutual-funds.
https://www.franklintempleton.com/investments/options/mutual-funds.
Important data provider notices and terms available at www.franklintempletondatasources.com.
KEY FUND STATISTICS (as of August 31, 2026)
|
Total Net Assets
|
$2,443,792,095
|
|
Total Number of Portfolio Holdings
|
47
|
|
Total Management Fee Paid
|
$16,846,479
|
|
Portfolio Turnover Rate
|
47.28%
|
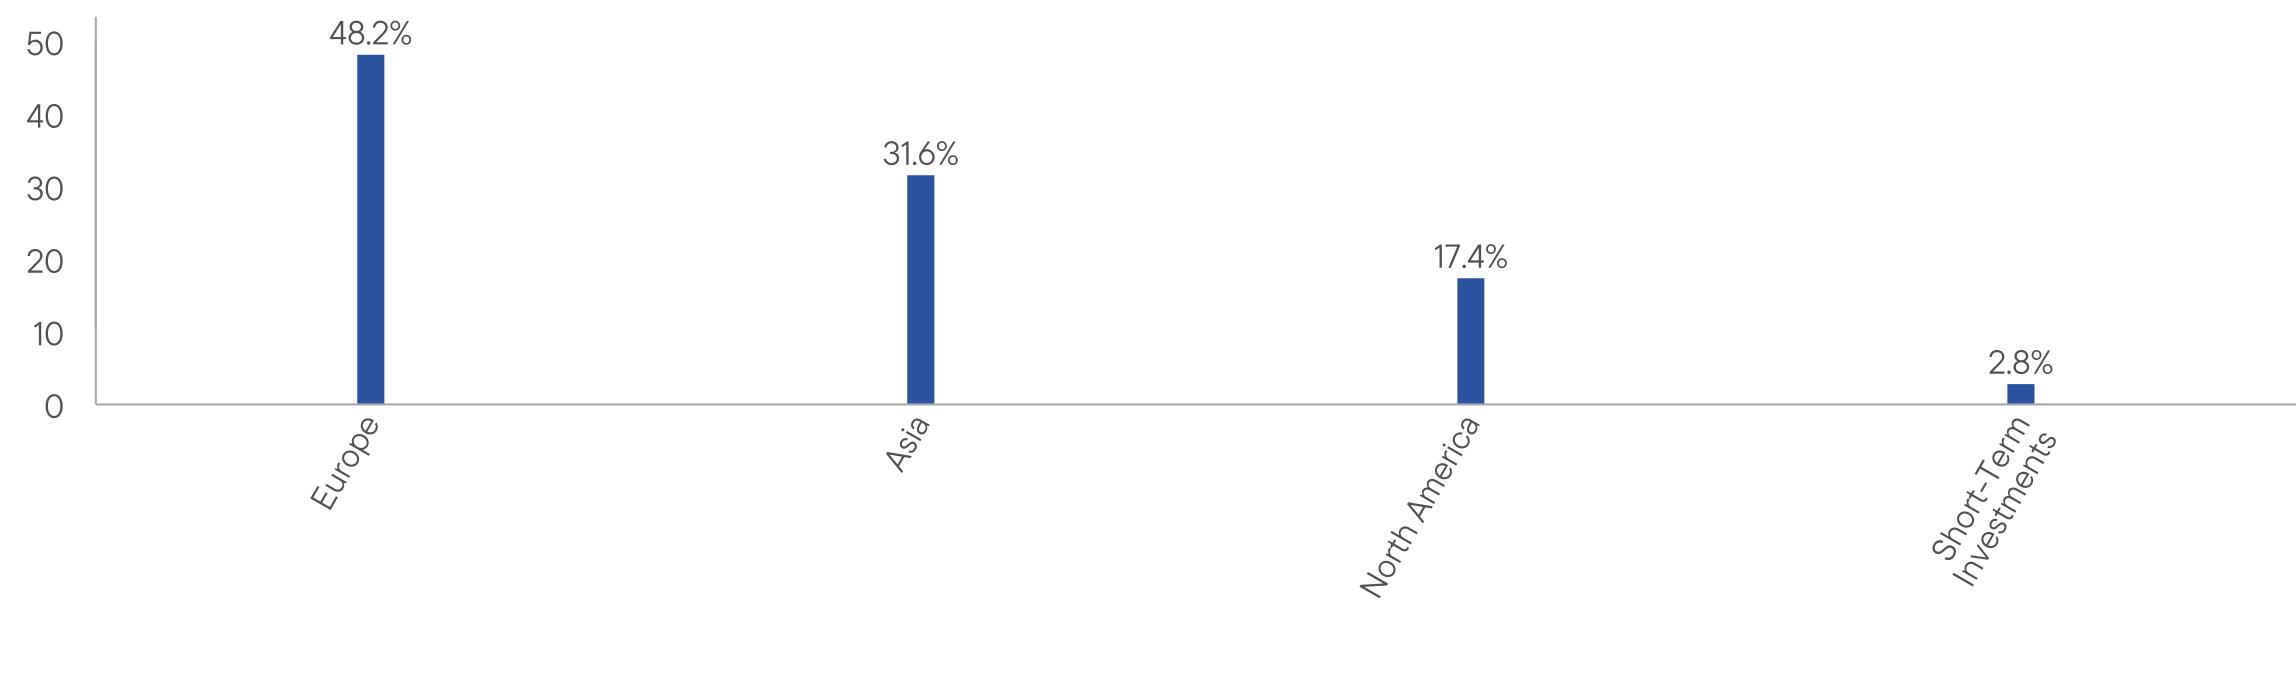
WHAT DID THE FUND INVEST IN? (as of August 31, 2026)
Portfolio Composition* (% of Total Investments)
HOW HAS THE FUND CHANGED?
On January 1, 2026, the Fund’s principal investment strategies were revised to reflect reduced exposure to investments in derivative instruments and equity-linked notes.
In connection with these changes, principal risk disclosure regarding derivative instruments and equity-linked notes was removed from the principal risks section of the prospectus.
Effective September 30, 2025, Peter D. Sartori became a portfolio manager of the Fund.
This is a summary of certain changes to the Fund since September 1, 2025. For more complete information, you may review the Fund’s current prospectus and any applicable supplements and the Fund’s next prospectus, which we expect to be available by January 1, 2027, at https://www.franklintempleton.com/regulatory-fund-documents or upon request at (800) DIAL BEN/342-5236 or prospectus.us.franklintempleton@fisglobal.com.
This report describes changes to the Fund that occurred during the reporting period.
WHAT WERE THE FUND COSTS FOR THE LAST YEAR? (based on a hypothetical $10,000 investment)
|
Class Name
|
Costs of a $10,000 investment
|
Costs paid as a percentage of a $10,000 investment*
|
|
Advisor Class
|
$94
|
0.85%
|
HOW DID THE FUND PERFORM LAST YEAR AND WHAT AFFECTED ITS PERFORMANCE?
For the twelve months ended August 31, 2026, Advisor Class shares of Templeton Foreign Fund returned 20.51%. The Fund compares its performance to the MSCI All Country World ex U.S. Index-NR, which returned 27.35% for the same period.
PERFORMANCE HIGHLIGHTS
|
Top contributors to performance:
|
|
|
↑
|
The strongest positive contribution theme was in artificial intelligence (AI) infrastructure and semiconductors. The top two contributors at the stock level were Samsung Electronics and STMicroelectronics, supported by memory demand, high-bandwidth memory and AI-related supply tightness. ASM International was another key contributor benefiting from these dynamics.
|
|
↑
|
Elsewhere, SSE, a U.K. network and renewables utility, was a significant contributor during the year, having raised substantial equity funding alongside its Q3 2025 results, confirming 2030 guidance and highlighting significant opportunities in transmission infrastructure over the next decade.
|
|
↑
|
Information technology was the best performing sector in relative terms followed by communication services. Within the latter sector, no single stock made an especially significant contribution to relative performance, but the Fund benefited from an underweight allocation to a sector which was the worst performing GICS sector for the core benchmark during the period.
|
|
Top detractors from performance:
|
|
|
↓
|
Stock selection in industrials was the principal source of detraction. Within the sector, Verisure, the Swedish home security company was the largest detractor from performance. The company’s post IPO life has been challenging, as it has so far been unable to strike a satisfactory balance of free-cash-flow generation and subscription growth. Adecco Group and CNH Industrial also detracted due to stock specific reasons.
|
|
↓
|
Health care detracted during the period owing to adverse stock selection effects. Ireland-based ICON plc was the biggest detractor from the sector as the stock fell sharply after accounting irregularities were disclosed during the first quarter of 2026. Pharmaceuticals group Sanofi was also amongst the top ten detractors at the stock level.
|
|
↓
|
The single largest detractor at the stock level was India-based HDFC Bank which detracted after the unexpected chairman resignation raised governance concerns.
|
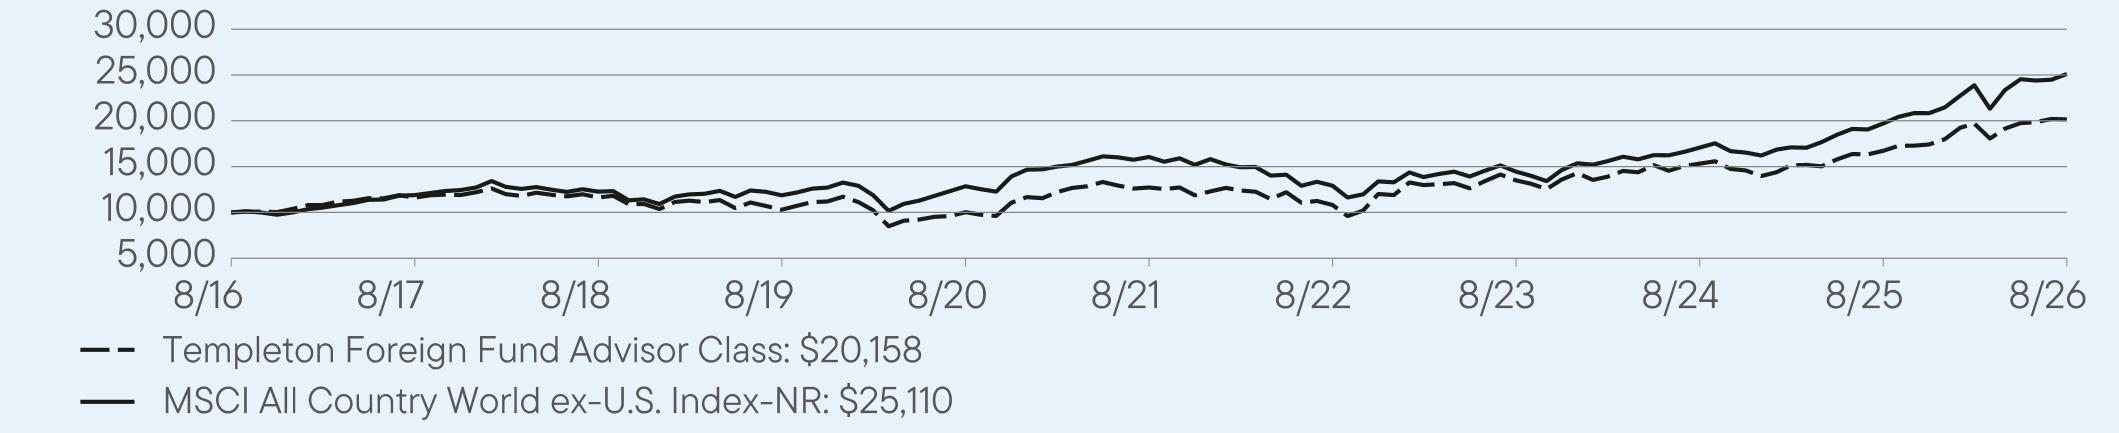
AVERAGE ANNUAL TOTAL RETURNS (%) Period Ended August 31, 2026
|
|
1 Year
|
5 Year
|
10 Year
|
|
Advisor Class
|
20.51
|
9.65
|
7.26
|
|
MSCI All Country World ex-U.S. Index-NR
|
27.35
|
9.37
|
9.65
|
For current month-end performance, please call Franklin Templeton at (800) DIAL BEN/342-5236 or visit
https://www.franklintempleton.com/investments/options/mutual-funds.
https://www.franklintempleton.com/investments/options/mutual-funds.
Important data provider notices and terms available at www.franklintempletondatasources.com.
KEY FUND STATISTICS (as of August 31, 2026)
|
Total Net Assets
|
$2,443,792,095
|
|
Total Number of Portfolio Holdings
|
47
|
|
Total Management Fee Paid
|
$16,846,479
|
|
Portfolio Turnover Rate
|
47.28%
|
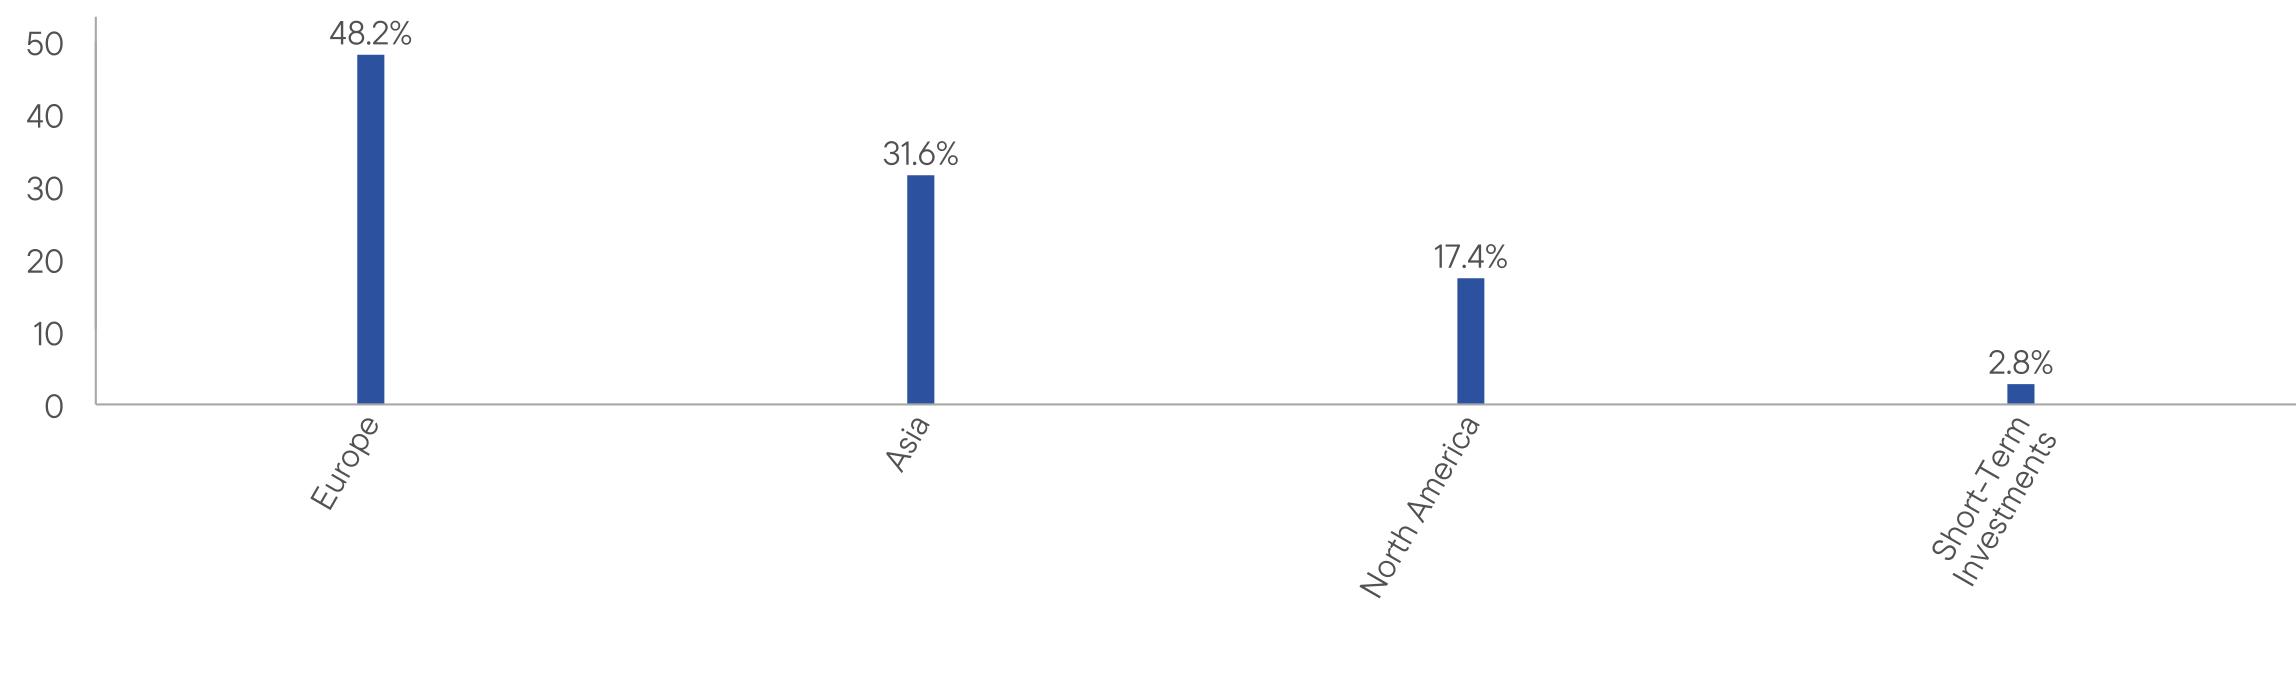
WHAT DID THE FUND INVEST IN? (as of August 31, 2026)
Portfolio Composition* (% of Total Investments)
HOW HAS THE FUND CHANGED?
On January 1, 2026, the Fund’s principal investment strategies were revised to reflect reduced exposure to investments in derivative instruments and equity-linked notes.
In connection with these changes, principal risk disclosure regarding derivative instruments and equity-linked notes was removed from the principal risks section of the prospectus.
Effective September 30, 2025, Peter D. Sartori became a portfolio manager of the Fund.
This is a summary of certain changes to the Fund since September 1, 2025. For more complete information, you may review the Fund’s current prospectus and any applicable supplements and the Fund’s next prospectus, which we expect to be available by January 1, 2027, at https://www.franklintempleton.com/regulatory-fund-documents or upon request at (800) DIAL BEN/342-5236 or prospectus.us.franklintempleton@fisglobal.com.
This report describes changes to the Fund that occurred during the reporting period.
WHAT WERE THE FUND COSTS FOR THE LAST YEAR? (based on a hypothetical $10,000 investment)
|
Class Name
|
Costs of a $10,000 investment
|
Costs paid as a percentage of a $10,000 investment*
|
|
Class A
|
$111
|
1.04%
|
HOW DID THE FUND PERFORM LAST YEAR AND WHAT AFFECTED ITS PERFORMANCE?
For the twelve months ended August 31, 2026, Class A shares of Templeton World Fund returned 13.89%. The Fund compares its performance to the MSCI All Country World Index-NR, which returned 22.35% for the same period.
PERFORMANCE HIGHLIGHTS
|
Top contributors to performance:
|
|
|
↑
|
The strongest positive contribution at the sector level was from utilities, primarily due to stock selection. Within this sector, SSE, a U.K. networks and renewables utility, was a significant contributor during the year, having raised substantial equity funding alongside its Q3 2025 results, confirming 2030 guidance and highlighting significant opportunities in transmission infrastructure over the next decade.
|
|
↑
|
Stock selection in industrials also helped with relative performance with Rolls-Royce Holdings, a leading contributor. The shares benefited from continued improvements in profitability and cash generation, supported by stronger civil aerospace aftermarket earnings and robust growth across its defense and power systems businesses.
|
|
↑
|
The largest stock-level contributor was Samsung Electronics, whose shares benefited from strong memory demand, improving high-bandwidth memory prospects and artificial intelligence (AI)-related supply tightness.
|
|
Top detractors from performance:
|
|
|
↓
|
Stock selection and an overweight allocation in materials was the principal source of detraction. Within the sector, construction materials group CRH was the largest detractor from relative performance. Its shares were held back by subdued residential construction demand and, later in the period, investor concerns over the cost and execution risks associated with its proposed acquisition of Arcosa. Containers and packing company Smurfit Westrock was another major detractor within the sector.
|
|
↓
|
Information technology also detracted owing to adverse stock selection, with five of the ten largest relative detractors drawn from the sector. SAP and Microsoft were the two largest detractors, as software shares were de-rated amid concerns over AI-led disruption, elevated capital spending and uncertain near-term returns. SAP also faced weaker-than-expected cloud guidance, while Microsoft was pressured by concerns over AI investment and free cash flow.
|
|
↓
|
The single largest detractor at the stock level was Ireland-based healthcare group ICON plc as the stock fell sharply after accounting irregularities were disclosed during the first quarter of 2026.
|
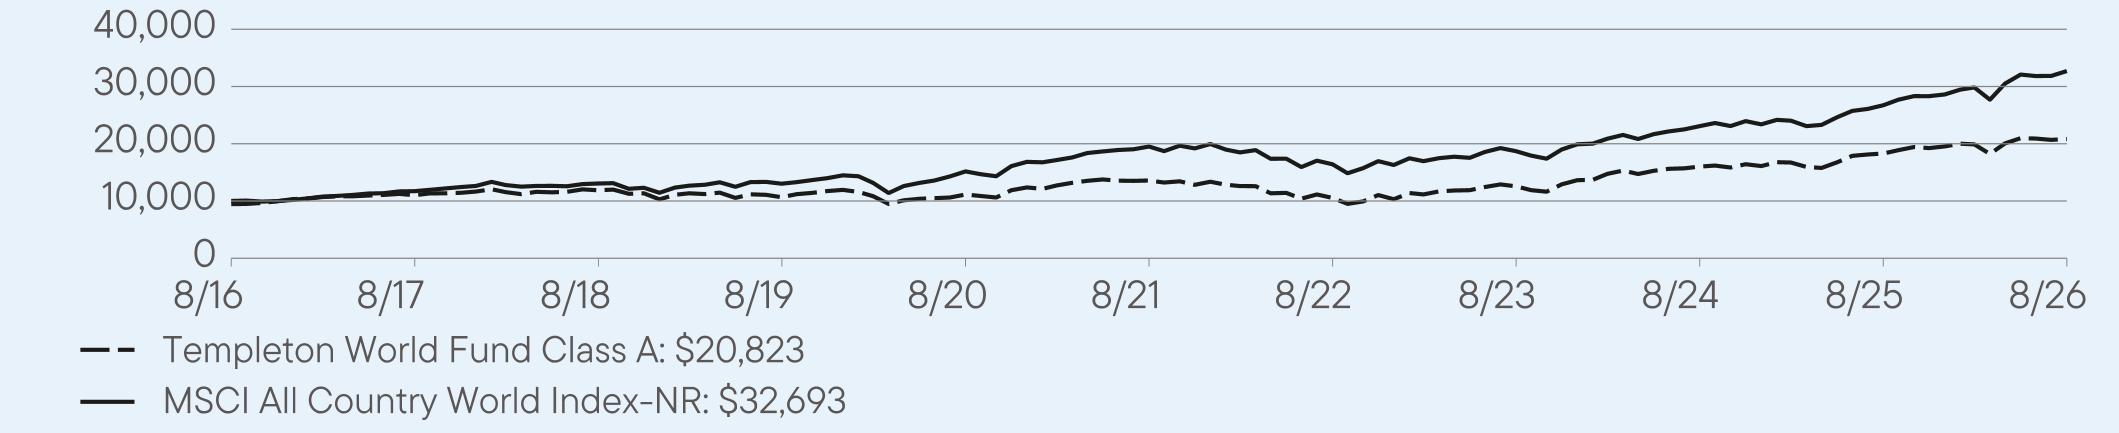
AVERAGE ANNUAL TOTAL RETURNS (%) Period Ended August 31, 2026
|
|
1 Year
|
5 Year
|
10 Year
|
|
Class A
|
13.89
|
8.94
|
8.22
|
|
Class A (with sales charge)
|
7.62
|
7.72
|
7.61
|
|
MSCI All Country World Index-NR
|
22.35
|
10.89
|
12.58
|
For current month-end performance, please call Franklin Templeton at (800) DIAL BEN/342-5236 or visit
https://www.franklintempleton.com/investments/options/mutual-funds.
https://www.franklintempleton.com/investments/options/mutual-funds.
Important data provider notices and terms available at www.franklintempletondatasources.com.
KEY FUND STATISTICS (as of August 31, 2026)
|
Total Net Assets
|
$2,939,046,127
|
|
Total Number of Portfolio Holdings
|
47
|
|
Total Management Fee Paid
|
$19,825,255
|
|
Portfolio Turnover Rate
|
107.93%
|
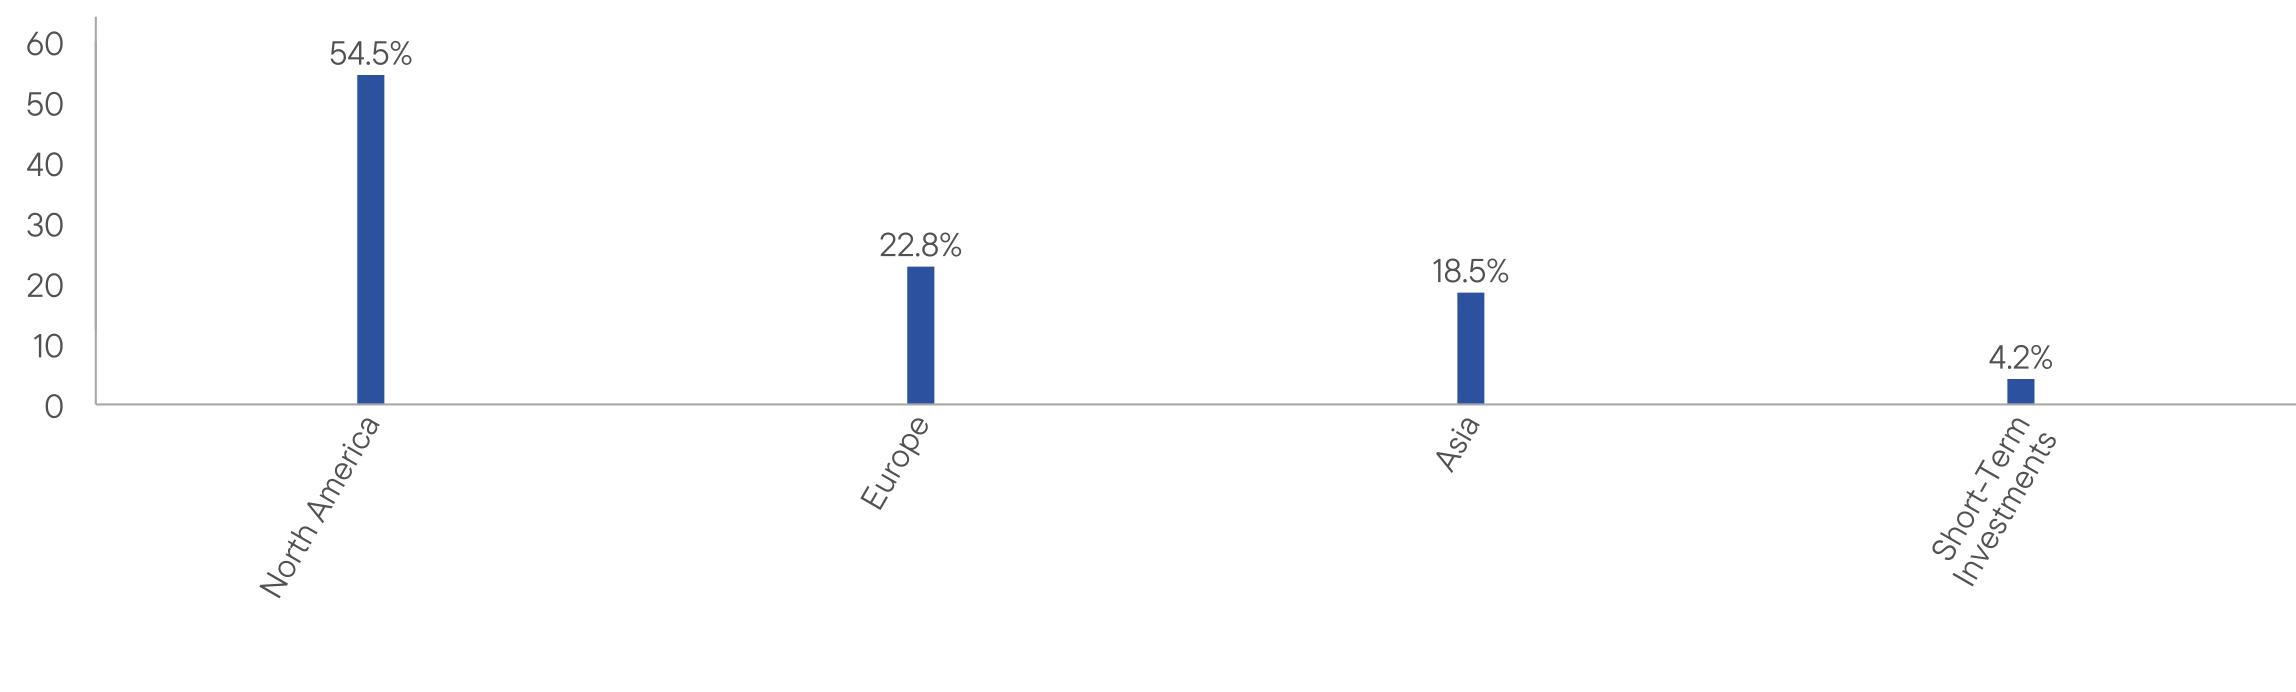
WHAT DID THE FUND INVEST IN? (as of August 31, 2026)
Portfolio Composition* (% of Total Investments)
HOW HAS THE FUND CHANGED?
On January 1, 2026, the Fund’s principal investment strategies were revised to reflect reduced exposure to investments in derivative instruments and equity-linked notes.
In connection with these changes, principal risk disclosure regarding derivative instruments and equity-linked notes was removed from the principal risks section of the prospectus.
This is a summary of certain changes to the Fund since September 1, 2025. For more complete information, you may review the Fund’s current prospectus and any applicable supplements and the Fund’s next prospectus, which we expect to be available by January 1, 2027, at https://www.franklintempleton.com/regulatory-fund-documents or upon request at (800) DIAL BEN/342-5236 or
prospectus.us.franklintempleton@fisglobal.com.
prospectus.us.franklintempleton@fisglobal.com.
This report describes changes to the Fund that occurred during the reporting period.
WHAT WERE THE FUND COSTS FOR THE LAST YEAR? (based on a hypothetical $10,000 investment)
|
Class Name
|
Costs of a $10,000 investment
|
Costs paid as a percentage of a $10,000 investment*
|
|
Class C
|
$191
|
1.79%
|
HOW DID THE FUND PERFORM LAST YEAR AND WHAT AFFECTED ITS PERFORMANCE?
For the twelve months ended August 31, 2026, Class C shares of Templeton World Fund returned 12.98%. The Fund compares its performance to the MSCI All Country World Index-NR, which returned 22.35% for the same period.
PERFORMANCE HIGHLIGHTS
|
Top contributors to performance:
|
|
|
↑
|
The strongest positive contribution at the sector level was from utilities, primarily due to stock selection. Within this sector, SSE, a U.K. networks and renewables utility, was a significant contributor during the year, having raised substantial equity funding alongside its Q3 2025 results, confirming 2030 guidance and highlighting significant opportunities in transmission infrastructure over the next decade.
|
|
↑
|
Stock selection in industrials also helped with relative performance with Rolls-Royce Holdings, a leading contributor. The shares benefited from continued improvements in profitability and cash generation, supported by stronger civil aerospace aftermarket earnings and robust growth across its defense and power systems businesses.
|
|
↑
|
The largest stock-level contributor was Samsung Electronics, whose shares benefited from strong memory demand, improving high-bandwidth memory prospects and artificial intelligence (AI)-related supply tightness.
|
|
Top detractors from performance:
|
|
|
↓
|
Stock selection and an overweight allocation in materials was the principal source of detraction. Within the sector, construction materials group CRH was the largest detractor from relative performance. Its shares were held back by subdued residential construction demand and, later in the period, investor concerns over the cost and execution risks associated with its proposed acquisition of Arcosa. Containers and packing company Smurfit Westrock was another major detractor within the sector.
|
|
↓
|
Information technology also detracted owing to adverse stock selection, with five of the ten largest relative detractors drawn from the sector. SAP and Microsoft were the two largest detractors, as software shares were de-rated amid concerns over AI-led disruption, elevated capital spending and uncertain near-term returns. SAP also faced weaker-than-expected cloud guidance, while Microsoft was pressured by concerns over AI investment and free cash flow.
|
|
↓
|
The single largest detractor at the stock level was Ireland-based healthcare group ICON plc as the stock fell sharply after accounting irregularities were disclosed during the first quarter of 2026.
|
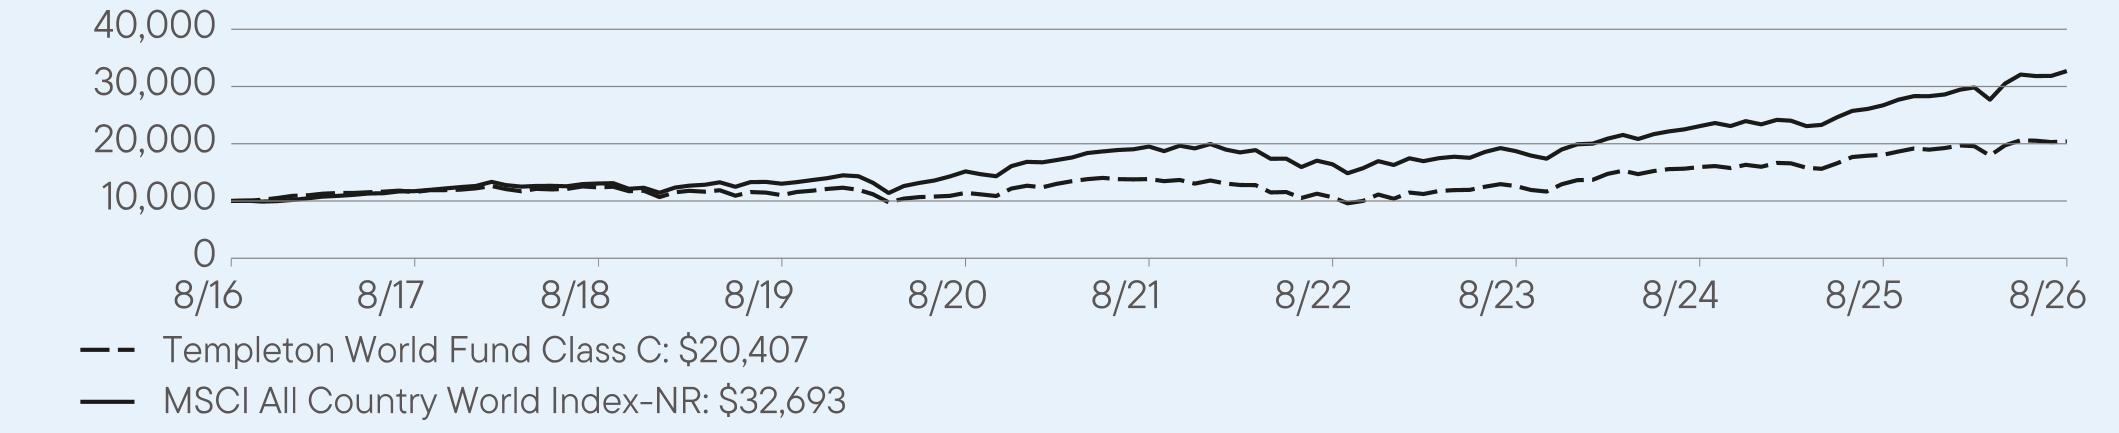
AVERAGE ANNUAL TOTAL RETURNS (%) Period Ended August 31, 2026
|
|
1 Year
|
5 Year
|
10 Year
|
|
Class C
|
12.98
|
8.10
|
7.39
|
|
Class C (with sales charge)
|
11.99
|
8.10
|
7.39
|
|
MSCI All Country World Index-NR
|
22.35
|
10.89
|
12.58
|
For current month-end performance, please call Franklin Templeton at (800) DIAL BEN/342-5236 or visit
https://www.franklintempleton.com/investments/options/mutual-funds.
https://www.franklintempleton.com/investments/options/mutual-funds.
Important data provider notices and terms available at www.franklintempletondatasources.com.
KEY FUND STATISTICS (as of August 31, 2026)
|
Total Net Assets
|
$2,939,046,127
|
|
Total Number of Portfolio Holdings
|
47
|
|
Total Management Fee Paid
|
$19,825,255
|
|
Portfolio Turnover Rate
|
107.93%
|
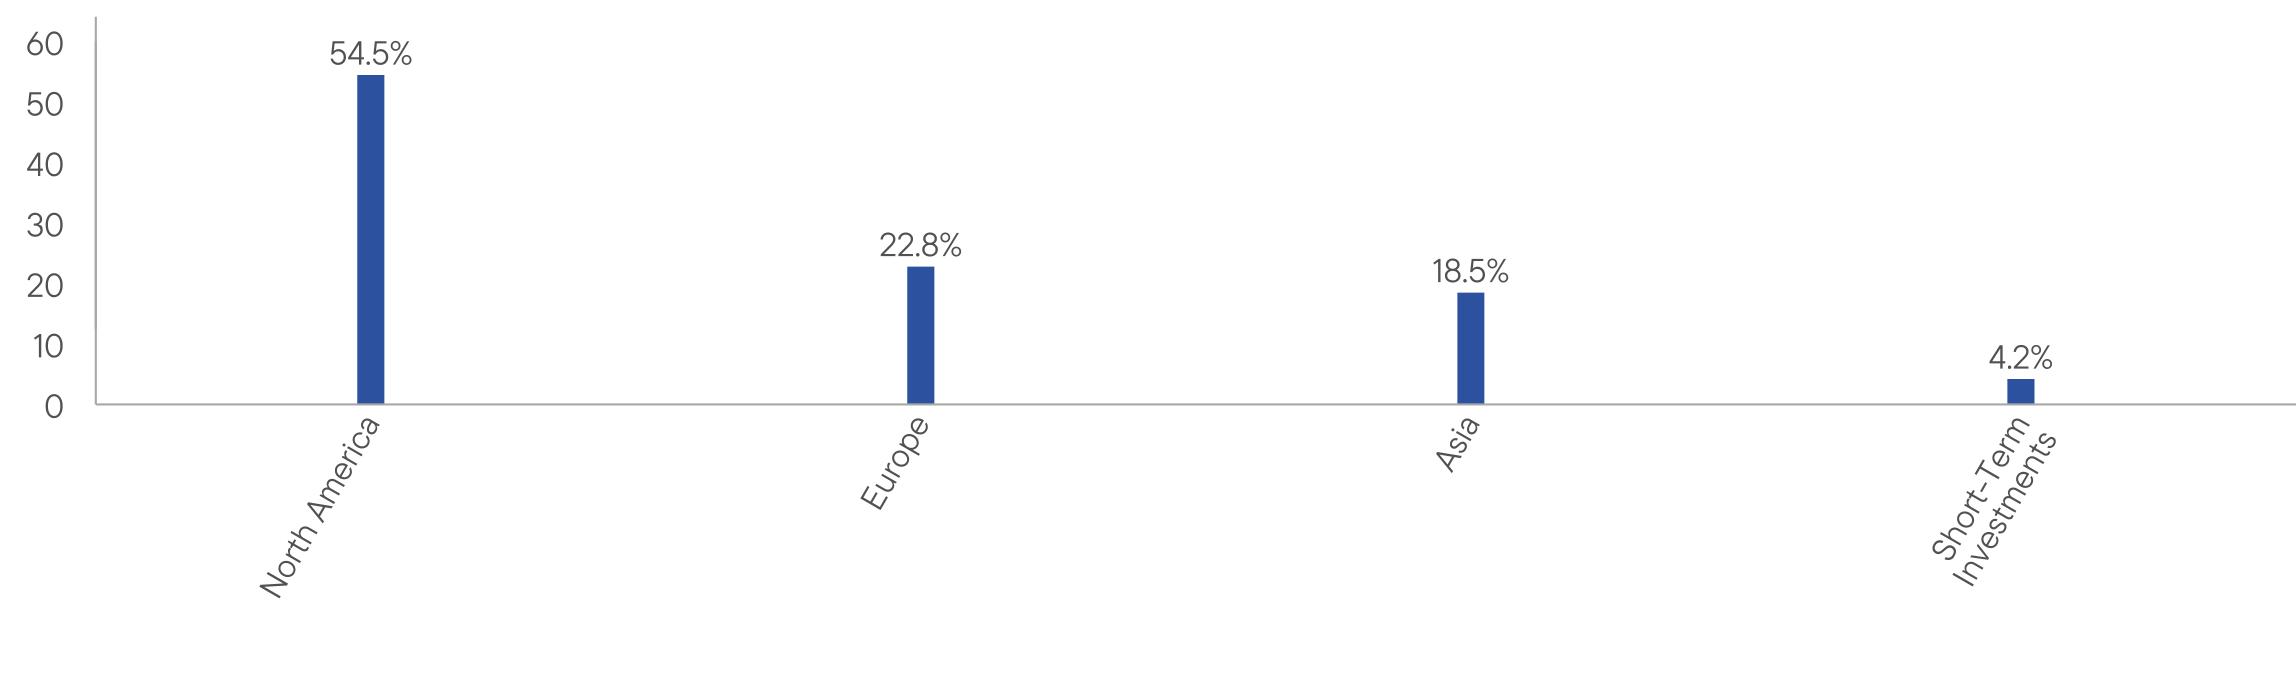
WHAT DID THE FUND INVEST IN? (as of August 31, 2026)
Portfolio Composition* (% of Total Investments)
HOW HAS THE FUND CHANGED?
On January 1, 2026, the Fund’s principal investment strategies were revised to reflect reduced exposure to investments in derivative instruments and equity-linked notes.
In connection with these changes, principal risk disclosure regarding derivative instruments and equity-linked notes was removed from the principal risks section of the prospectus.
This is a summary of certain changes to the Fund since September 1, 2025. For more complete information, you may review the Fund’s current prospectus and any applicable supplements and the Fund’s next prospectus, which we expect to be available by January 1, 2027, at https://www.franklintempleton.com/regulatory-fund-documents or upon request at (800) DIAL BEN/342-5236 or
prospectus.us.franklintempleton@fisglobal.com.
prospectus.us.franklintempleton@fisglobal.com.
This report describes changes to the Fund that occurred during the reporting period.
WHAT WERE THE FUND COSTS FOR THE LAST YEAR? (based on a hypothetical $10,000 investment)
|
Class Name
|
Costs of a $10,000 investment
|
Costs paid as a percentage of a $10,000 investment*
|
|
Class R6
|
$81
|
0.76%
|
HOW DID THE FUND PERFORM LAST YEAR AND WHAT AFFECTED ITS PERFORMANCE?
For the twelve months ended August 31, 2026, Class R6 shares of Templeton World Fund returned 14.16%. The Fund compares its performance to the MSCI All Country World Index-NR, which returned 22.35% for the same period.
PERFORMANCE HIGHLIGHTS
|
Top contributors to performance:
|
|
|
↑
|
The strongest positive contribution at the sector level was from utilities, primarily due to stock selection. Within this sector, SSE, a U.K. networks and renewables utility, was a significant contributor during the year, having raised substantial equity funding alongside its Q3 2025 results, confirming 2030 guidance and highlighting significant opportunities in transmission infrastructure over the next decade.
|
|
↑
|
Stock selection in industrials also helped with relative performance with Rolls-Royce Holdings, a leading contributor. The shares benefited from continued improvements in profitability and cash generation, supported by stronger civil aerospace aftermarket earnings and robust growth across its defense and power systems businesses.
|
|
↑
|
The largest stock-level contributor was Samsung Electronics, whose shares benefited from strong memory demand, improving high-bandwidth memory prospects and artificial intelligence (AI)-related supply tightness.
|
|
Top detractors from performance:
|
|
|
↓
|
Stock selection and an overweight allocation in materials was the principal source of detraction. Within the sector, construction materials group CRH was the largest detractor from relative performance. Its shares were held back by subdued residential construction demand and, later in the period, investor concerns over the cost and execution risks associated with its proposed acquisition of Arcosa. Containers and packing company Smurfit Westrock was another major detractor within the sector.
|
|
↓
|
Information technology also detracted owing to adverse stock selection, with five of the ten largest relative detractors drawn from the sector. SAP and Microsoft were the two largest detractors, as software shares were de-rated amid concerns over AI-led disruption, elevated capital spending and uncertain near-term returns. SAP also faced weaker-than-expected cloud guidance, while Microsoft was pressured by concerns over AI investment and free cash flow.
|
|
↓
|
The single largest detractor at the stock level was Ireland-based healthcare group ICON plc as the stock fell sharply after accounting irregularities were disclosed during the first quarter of 2026.
|
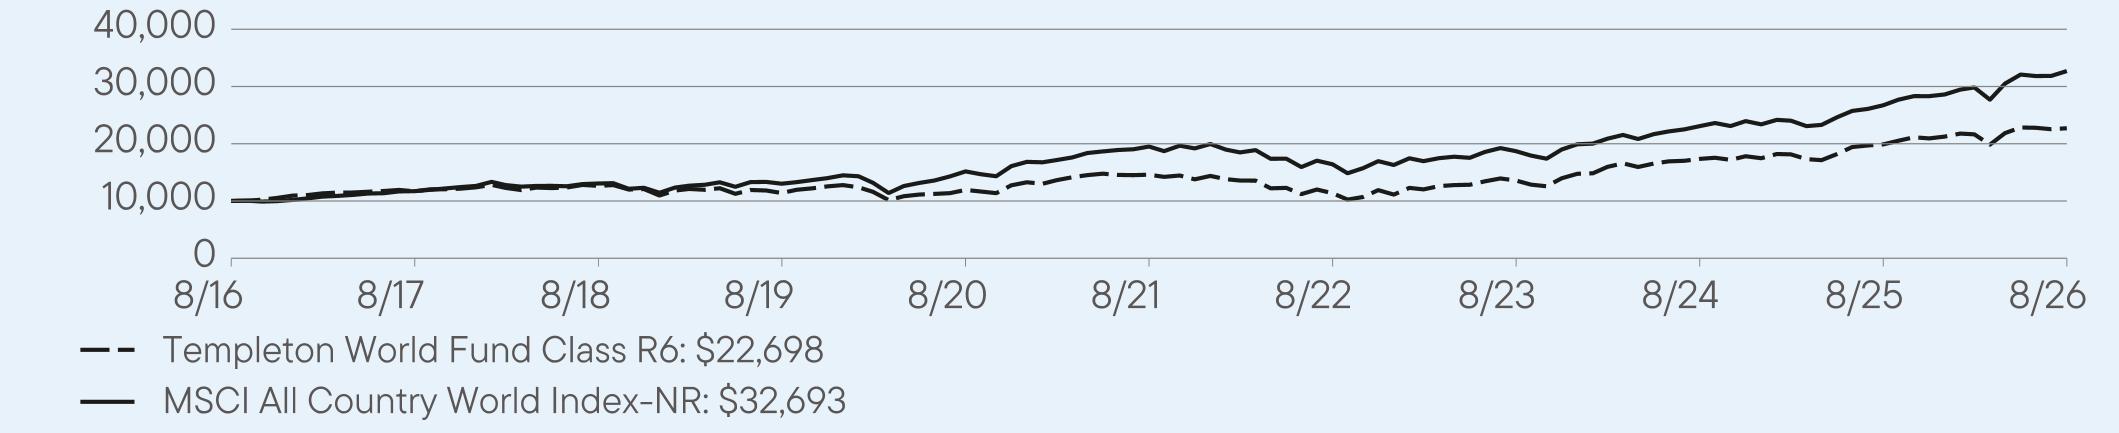
AVERAGE ANNUAL TOTAL RETURNS (%) Period Ended August 31, 2026
|
|
1 Year
|
5 Year
|
10 Year
|
|
Class R6
|
14.16
|
9.25
|
8.54
|
|
MSCI All Country World Index-NR
|
22.35
|
10.89
|
12.58
|
For current month-end performance, please call Franklin Templeton at (800) DIAL BEN/342-5236 or visit
https://www.franklintempleton.com/investments/options/mutual-funds.
https://www.franklintempleton.com/investments/options/mutual-funds.
Important data provider notices and terms available at www.franklintempletondatasources.com.
KEY FUND STATISTICS (as of August 31, 2026)
|
Total Net Assets
|
$2,939,046,127
|
|
Total Number of Portfolio Holdings
|
47
|
|
Total Management Fee Paid
|
$19,825,255
|
|
Portfolio Turnover Rate
|
107.93%
|
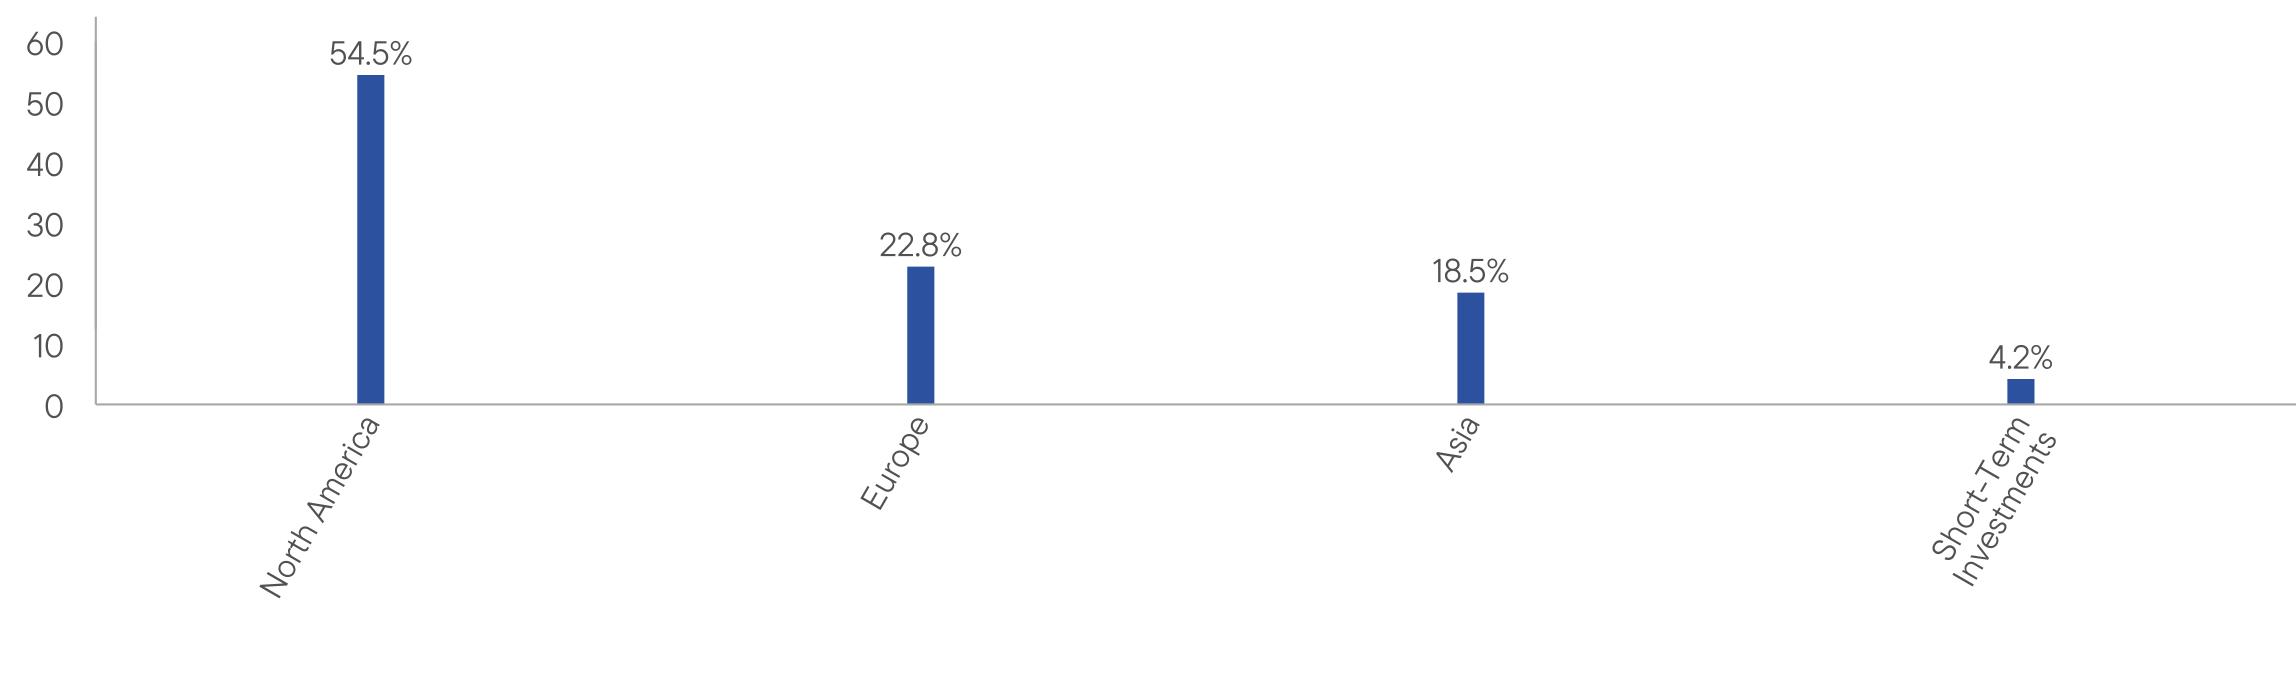
WHAT DID THE FUND INVEST IN? (as of August 31, 2026)
Portfolio Composition* (% of Total Investments)
HOW HAS THE FUND CHANGED?
On January 1, 2026, the Fund’s principal investment strategies were revised to reflect reduced exposure to investments in derivative instruments and equity-linked notes.
In connection with these changes, principal risk disclosure regarding derivative instruments and equity-linked notes was removed from the principal risks section of the prospectus.
This is a summary of certain changes to the Fund since September 1, 2025. For more complete information, you may review the Fund’s current prospectus and any applicable supplements and the Fund’s next prospectus, which we expect to be available by January 1, 2027, at https://www.franklintempleton.com/regulatory-fund-documents or upon request at (800) DIAL BEN/342-5236 or
prospectus.us.franklintempleton@fisglobal.com.
prospectus.us.franklintempleton@fisglobal.com.
This report describes changes to the Fund that occurred during the reporting period.
WHAT WERE THE FUND COSTS FOR THE LAST YEAR? (based on a hypothetical $10,000 investment)
|
Class Name
|
Costs of a $10,000 investment
|
Costs paid as a percentage of a $10,000 investment*
|
|
Advisor Class
|
$85
|
0.79%
|
HOW DID THE FUND PERFORM LAST YEAR AND WHAT AFFECTED ITS PERFORMANCE?
For the twelve months ended August 31, 2026, Advisor Class shares of Templeton World Fund returned 14.09%. The Fund compares its performance to the MSCI All Country World Index-NR, which returned 22.35% for the same period.
PERFORMANCE HIGHLIGHTS
|
Top contributors to performance:
|
|
|
↑
|
The strongest positive contribution at the sector level was from utilities, primarily due to stock selection. Within this sector, SSE, a U.K. networks and renewables utility, was a significant contributor during the year, having raised substantial equity funding alongside its Q3 2025 results, confirming 2030 guidance and highlighting significant opportunities in transmission infrastructure over the next decade.
|
|
↑
|
Stock selection in industrials also helped with relative performance with Rolls-Royce Holdings, a leading contributor. The shares benefited from continued improvements in profitability and cash generation, supported by stronger civil aerospace aftermarket earnings and robust growth across its defense and power systems businesses.
|
|
↑
|
The largest stock-level contributor was Samsung Electronics, whose shares benefited from strong memory demand, improving high-bandwidth memory prospects and artificial intelligence (AI)-related supply tightness.
|
|
Top detractors from performance:
|
|
|
↓
|
Stock selection and an overweight allocation in materials was the principal source of detraction. Within the sector, construction materials group CRH was the largest detractor from relative performance. Its shares were held back by subdued residential construction demand and, later in the period, investor concerns over the cost and execution risks associated with its proposed acquisition of Arcosa. Containers and packing company Smurfit Westrock was another major detractor within the sector.
|
|
↓
|
Information technology also detracted owing to adverse stock selection, with five of the ten largest relative detractors drawn from the sector. SAP and Microsoft were the two largest detractors, as software shares were de-rated amid concerns over AI-led disruption, elevated capital spending and uncertain near-term returns. SAP also faced weaker-than-expected cloud guidance, while Microsoft was pressured by concerns over AI investment and free cash flow.
|
|
↓
|
The single largest detractor at the stock level was Ireland-based healthcare group ICON plc as the stock fell sharply after accounting irregularities were disclosed during the first quarter of 2026.
|
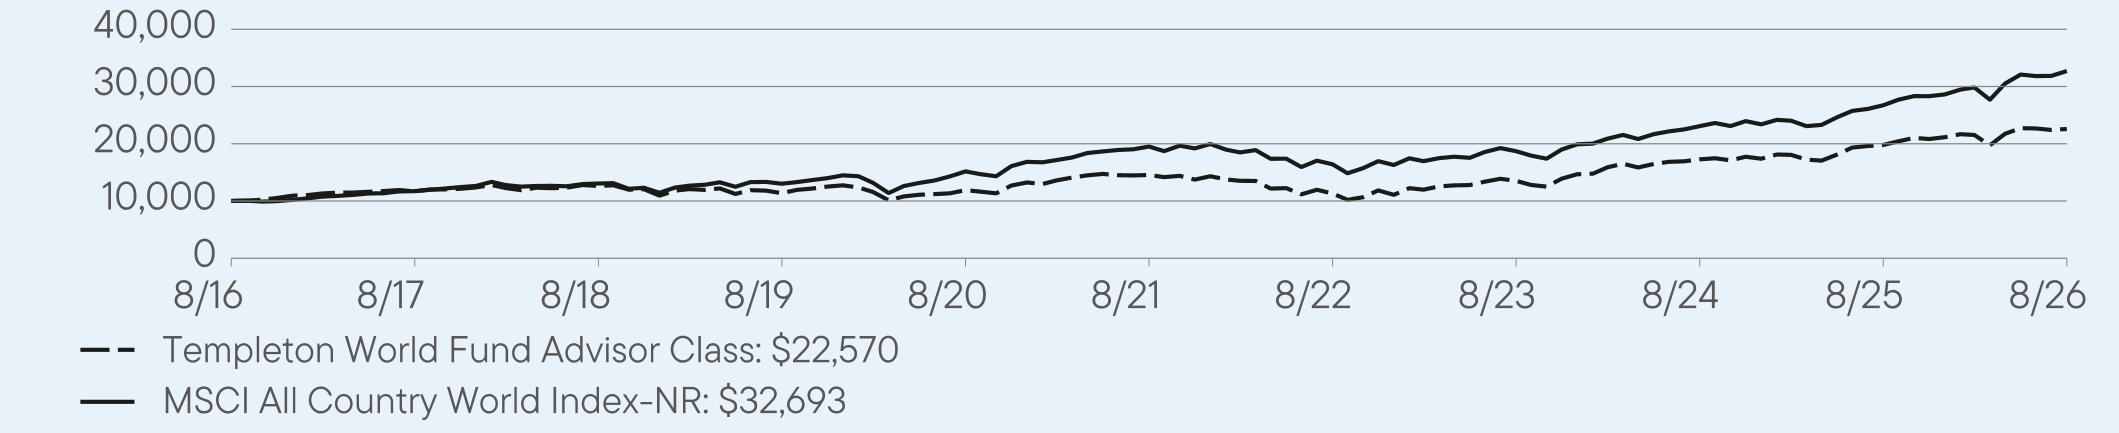
AVERAGE ANNUAL TOTAL RETURNS (%) Period Ended August 31, 2026
|
|
1 Year
|
5 Year
|
10 Year
|
|
Advisor Class
|
14.09
|
9.20
|
8.48
|
|
MSCI All Country World Index-NR
|
22.35
|
10.89
|
12.58
|
For current month-end performance, please call Franklin Templeton at (800) DIAL BEN/342-5236 or visit
https://www.franklintempleton.com/investments/options/mutual-funds.
https://www.franklintempleton.com/investments/options/mutual-funds.
Important data provider notices and terms available at www.franklintempletondatasources.com.
KEY FUND STATISTICS (as of August 31, 2026)
|
Total Net Assets
|
$2,939,046,127
|
|
Total Number of Portfolio Holdings
|
47
|
|
Total Management Fee Paid
|
$19,825,255
|
|
Portfolio Turnover Rate
|
107.93%
|
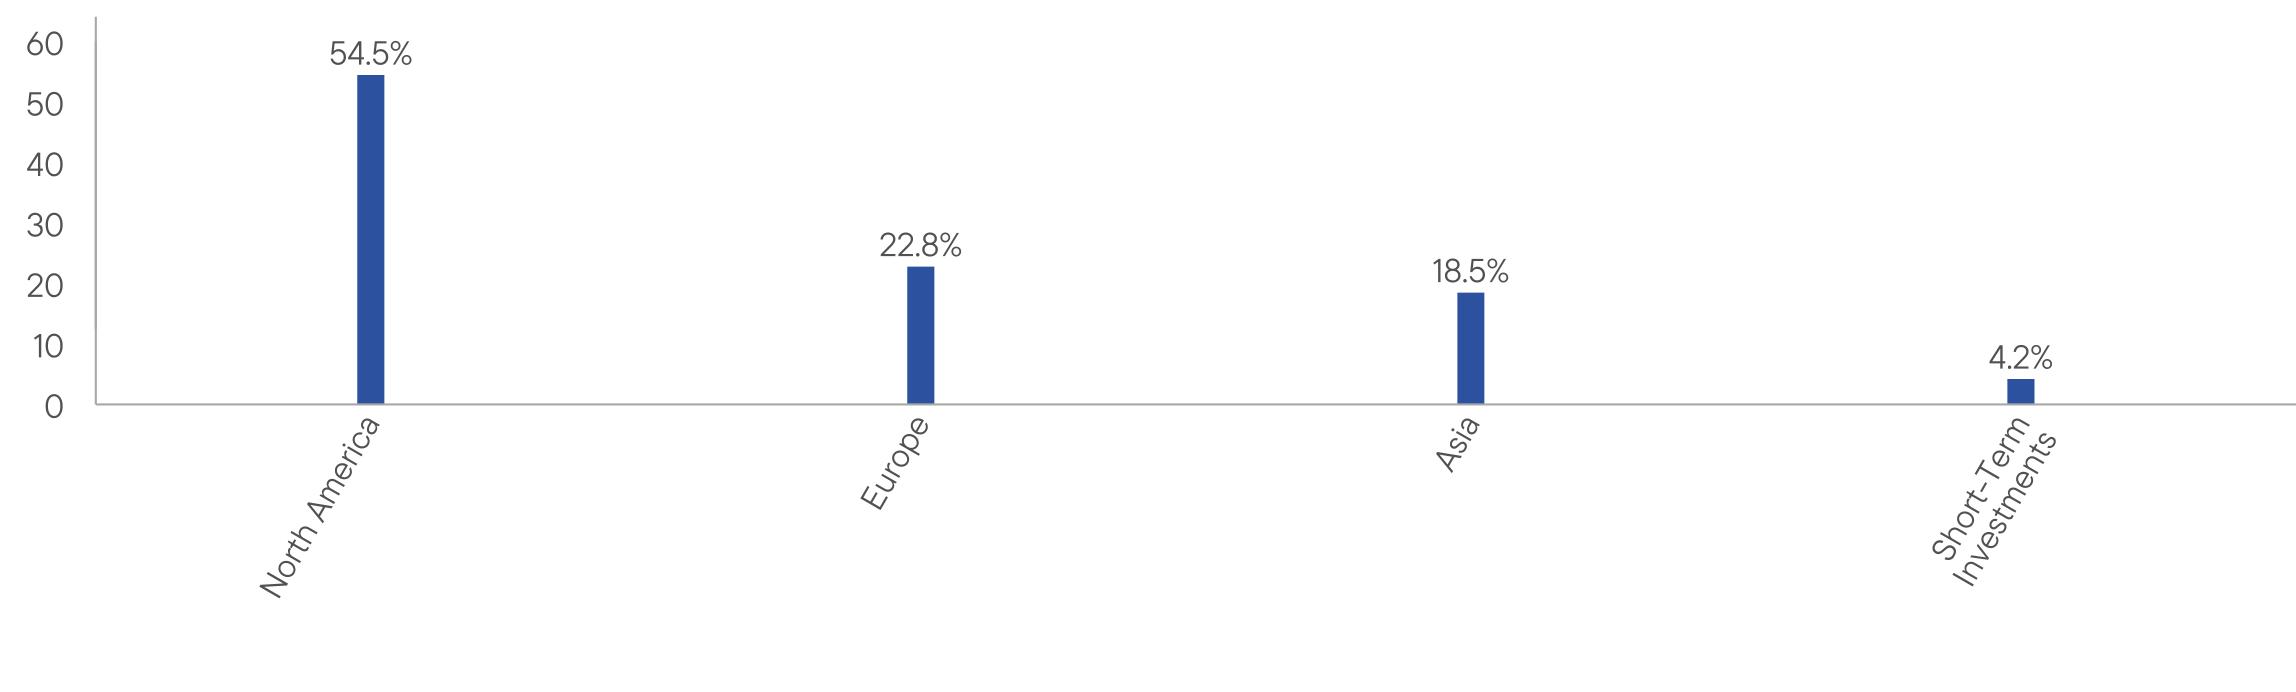
WHAT DID THE FUND INVEST IN? (as of August 31, 2026)
Portfolio Composition* (% of Total Investments)
HOW HAS THE FUND CHANGED?
On January 1, 2026, the Fund’s principal investment strategies were revised to reflect reduced exposure to investments in derivative instruments and equity-linked notes.
In connection with these changes, principal risk disclosure regarding derivative instruments and equity-linked notes was removed from the principal risks section of the prospectus.
This is a summary of certain changes to the Fund since September 1, 2025. For more complete information, you may review the Fund’s current prospectus and any applicable supplements and the Fund’s next prospectus, which we expect to be available by January 1, 2027, at https://www.franklintempleton.com/regulatory-fund-documents or upon request at (800) DIAL BEN/342-5236 or
prospectus.us.franklintempleton@fisglobal.com.
prospectus.us.franklintempleton@fisglobal.com.
| [1] |
|
||
| [2] |
|
||
| [3] |
|
||
| [4] |
|
||
| [5] |
|
||
| [6] |
|
||
| [7] |
|
||
| [8] |
|
||
| [9] |
|
||
| [10] |
|
||
| [11] |
|
||
| [12] |
|
||
| [13] |
|
||
| [14] |
|
||
| [15] |
|
||
| [16] |
|
||
| [17] |
|
||
| [18] |
|