Performance Management
|
Oct. 28, 2026 |
| Simplify Aggregate Bond ETF |
|
| Prospectus [Line Items] |
|
| Performance Narrative [Text Block] |
Performance: The following performance information provides some indication of the risks of investing in the Fund. The bar chart shows changes in the Fund’s performance from year to year. The table shows how the Fund’s average annual total returns compare to those of a broad-based securities market index. The Fund’s past performance (before and after taxes) is not necessarily an indication of how the Fund will perform in the future. Updated performance information is available at no cost by visiting www.simplify.us/etfs or by calling 1 (855) 772-8488.
|
| Performance Past Does Not Indicate Future [Text] |
The Fund’s past performance (before and after taxes) is not necessarily an indication of how the Fund will perform in the future.
|
| Performance Information Illustrates Variability of Returns [Text] |
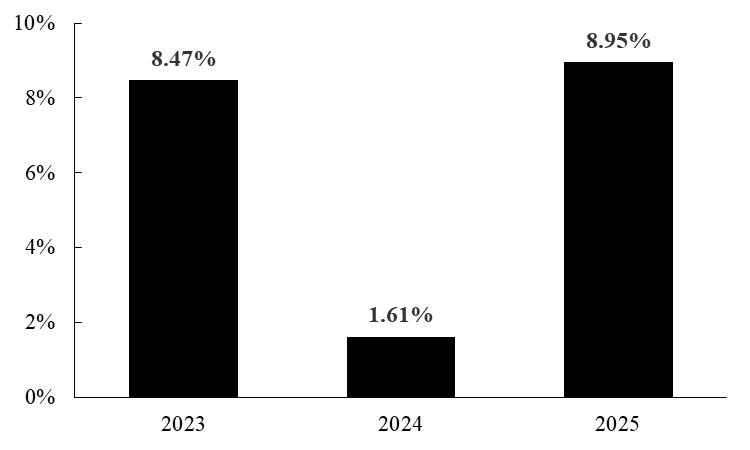
The following performance information provides some indication of the risks of investing in the Fund. The bar chart shows changes in the Fund’s performance from year to year. The table shows how the Fund’s average annual total returns compare to those of a broad-based securities market index.
|
| Bar Chart [Table] |
| Years |
Returns |
| 2023 |
8.47% |
| 2024 |
1.61% |
| 2025 |
8.95% |
|
| Bar Chart Closing [Text Block] |
During the periods shown in the bar chart above, the Fund’s highest quarterly return was 6.29% (quarter ended September 30, 2024) and the Fund’s lowest quarterly return was -3.40% (quarter ended December 31, 2024). The calendar year-to-date total return of the Fund as of September 30, 2026 was (3.73)%.
|
| Year to Date Return, Label [Optional Text] |
year-to-date total return
|
| Bar Chart, Year to Date Return |
(3.73%)
|
| Bar Chart, Year to Date Return, Date |
Sep. 30, 2026
|
| Highest Quarterly Return, Label [Optional Text] |
highest quarterly return
|
| Highest Quarterly Return |
6.29%
|
| Highest Quarterly Return, Date |
Sep. 30, 2024
|
| Lowest Quarterly Return, Label [Optional Text] |
lowest quarterly return
|
| Lowest Quarterly Return |
(3.40%)
|
| Lowest Quarterly Return, Date |
Dec. 31, 2024
|
| Performance Table Heading |
Average Annual Total Returns for the Periods Ended December 31, 2025
|
| Performance Table Uses Highest Federal Rate |
After-tax returns are calculated using the historical highest individual federal marginal income tax rates during the period covered by the table above and do not reflect the impact of state and local taxes.
|
| Performance Table Not Relevant to Tax Deferred |
Actual after-tax returns depend on an investor’s tax situation and may differ from those shown. After-tax returns shown are not relevant to investors who hold shares through tax-advantaged arrangements, such as 401(k) plans or individual retirement accounts.
|
| Performance [Table] |
| |
|
1 Year |
|
|
Since
Inception
(2/14/22) |
|
| Return Before Taxes |
|
|
8.95 |
% |
|
|
2.39 |
% |
| Return After Taxes on Distributions |
|
|
5.65 |
% |
|
|
-0.57 |
% |
| Return After Taxes on Distributions and Sale of Fund Shares |
|
|
5.22 |
% |
|
|
0.51 |
% |
| Bloomberg U.S. Aggregate Bond Index (reflects no deduction for fees, expenses or taxes) |
|
|
7.30 |
% |
|
|
0.98 |
% |
|
| Index No Deduction for Fees, Expenses, or Taxes [Text] |
reflects no deduction for fees, expenses or taxes
|
| Performance Table Closing [Text Block] |
After-tax returns are calculated using the historical highest individual federal marginal income tax rates during the period covered by the table above and do not reflect the impact of state and local taxes. Actual after-tax returns depend on an investor’s tax situation and may differ from those shown. After-tax returns shown are not relevant to investors who hold shares through tax-advantaged arrangements, such as 401(k) plans or individual retirement accounts.
|
| Performance Availability Website Address [Text] |
www.simplify.us/etfs
|
| Performance Availability Phone [Text] |
1 (855) 772-8488.
|
| Simplify Barrier Income ETF |
|
| Prospectus [Line Items] |
|
| Performance Narrative [Text Block] |
Performance: Performance information will be available in the prospectus after the Fund has been in operation for one full calendar year. Past performance is not necessarily an indication of how the Fund will perform in the future. Updated performance information will be available at no cost by visiting www.simplify.us or by calling 1 (855) 772-8488.
|
| Performance Past Does Not Indicate Future [Text] |
Past performance is not necessarily an indication of how the Fund will perform in the future.
|
| Performance One Year or Less [Text] |
Performance information will be available in the prospectus after the Fund has been in operation for one full calendar year.
|
| Performance Availability Website Address [Text] |
www.simplify.us
|
| Performance Availability Phone [Text] |
1 (855) 772-8488
|
| Simplify Bitcoin Strategy ETF |
|
| Prospectus [Line Items] |
|
| Performance Narrative [Text Block] |
Performance: The following performance information provides some indication of the risks of investing in the Fund. The bar chart shows changes in the Fund’s performance from year to year. The table shows how the Fund’s average annual total returns compare to those of a broad-based securities market index. The Fund’s past performance (before and after taxes) is not necessarily an indication of how the Fund will perform in the future. Updated performance information is available at no cost by visiting www.simplify.us/etfs or by calling 1 (855) 772-8488.
|
| Performance Past Does Not Indicate Future [Text] |
The Fund’s past performance (before and after taxes) is not necessarily an indication of how the Fund will perform in the future.
|
| Performance Information Illustrates Variability of Returns [Text] |
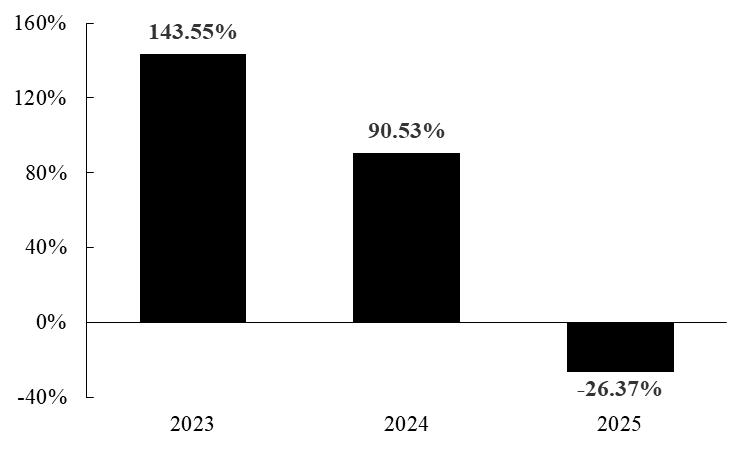
The following performance information provides some indication of the risks of investing in the Fund. The bar chart shows changes in the Fund’s performance from year to year. The table shows how the Fund’s average annual total returns compare to those of a broad-based securities market index.
|
| Bar Chart [Table] |
| Years |
Returns |
| 2023 |
143.55% |
| 2024 |
90.53% |
| 2025 |
-26.37% |
|
| Bar Chart Closing [Text Block] |
During the periods shown in the bar chart above, the Fund’s highest quarterly return was 69.81% (quarter ended March 31, 2023) and the Fund’s lowest quarterly return was -40.82% (quarter ended December 31, 2025). The calendar year-to-date total return of the Fund as of September 30, 2026 was 9.57%.
|
| Year to Date Return, Label [Optional Text] |
year-to-date total return
|
| Bar Chart, Year to Date Return |
9.57%
|
| Bar Chart, Year to Date Return, Date |
Sep. 30, 2026
|
| Highest Quarterly Return, Label [Optional Text] |
highest quarterly return
|
| Highest Quarterly Return |
69.81%
|
| Highest Quarterly Return, Date |
Mar. 31, 2023
|
| Lowest Quarterly Return, Label [Optional Text] |
lowest quarterly return
|
| Lowest Quarterly Return |
(40.82%)
|
| Lowest Quarterly Return, Date |
Dec. 31, 2025
|
| Performance Table Heading |
Average Annual Total Returns for the Periods Ended December 31, 2025
|
| Performance Table Uses Highest Federal Rate |
After-tax returns are calculated using the historical highest individual federal marginal income tax rates during the period covered by the table above and do not reflect the impact of state and local taxes.
|
| Performance Table Not Relevant to Tax Deferred |
Actual after-tax returns depend on an investor’s tax situation and may differ from those shown. After-tax returns shown are not relevant to investors who hold shares through tax-advantaged arrangements, such as 401(k) plans or individual retirement accounts.
|
| Performance [Table] |
| |
|
1 Year |
|
|
Since
Inception
(9/29/22) |
|
| Return Before Taxes |
|
|
-26.37 |
% |
|
|
39.72 |
% |
| Return After Taxes on Distributions |
|
|
-34.51 |
% |
|
|
24.42 |
% |
| Return After Taxes on Distributions and Sale of Fund Shares |
|
|
-13.49 |
% |
|
|
26.60 |
% |
| S&P 500 Index (reflects no deduction for fees, expenses or taxes) |
|
|
17.88 |
% |
|
|
23.19 |
% |
|
| Index No Deduction for Fees, Expenses, or Taxes [Text] |
reflects no deduction for fees, expenses or taxes
|
| Performance Table Closing [Text Block] |
After-tax returns are calculated using the historical highest individual federal marginal income tax rates during the period covered by the table above and do not reflect the impact of state and local taxes. Actual after-tax returns depend on an investor’s tax situation and may differ from those shown. After-tax returns shown are not relevant to investors who hold shares through tax-advantaged arrangements, such as 401(k) plans or individual retirement accounts.
|
| Performance Availability Website Address [Text] |
www.simplify.us/etfs
|
| Performance Availability Phone [Text] |
1 (855) 772-8488
|
| Simplify Bond Bull ETF |
|
| Prospectus [Line Items] |
|
| Performance Narrative [Text Block] |
Performance: The following performance information provides some indication of the risks of investing in the Fund. The bar chart shows changes in the Fund’s performance from year to year. The table shows how the Fund’s average annual total returns compare to those of a broad-based securities market index and an additional index. The additional index tracks the performance of long-maturity principal-only STRIPS (Separate Trading of Registered Interest and Principal
of Securities) issued by the U.S. Treasury. The Fund’s past performance (before and after taxes) is not necessarily an indication of how the Fund will perform in the future. Updated performance information is available at no cost by visiting www.simplify.us/etfs or by calling 1 (855) 772-8488.
|
| Performance Past Does Not Indicate Future [Text] |
The table shows how the Fund’s average annual total returns compare to those of a broad-based securities market index and an additional index. The additional index tracks the performance of long-maturity principal-only STRIPS (Separate Trading of Registered Interest and Principal
of Securities) issued by the U.S. Treasury. The Fund’s past performance (before and after taxes) is not necessarily an indication of how the Fund will perform in the future.
|
| Performance One Year or Less [Text] |
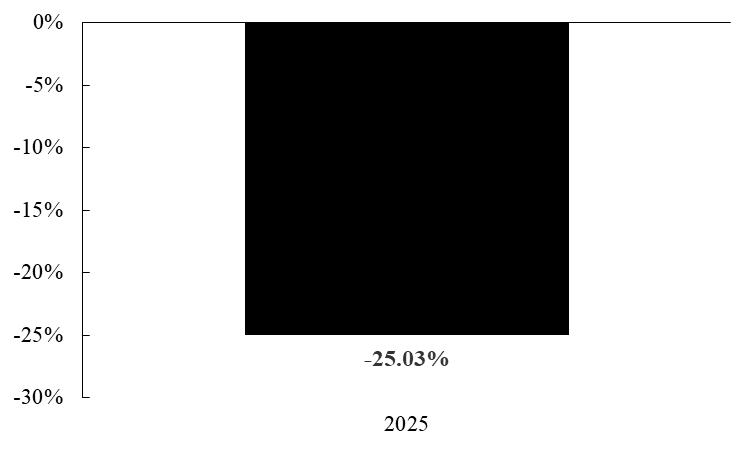
The following performance information provides some indication of the risks of investing in the Fund. The bar chart shows changes in the Fund’s performance from year to year.
|
| Bar Chart [Table] |
| Years |
Returns |
| 2025 |
-25.03% |
|
| Bar Chart Closing [Text Block] |
During the periods shown in the bar chart above, the Fund’s highest quarterly return was 1.47% (quarter ended March 31, 2025) and the Fund’s lowest quarterly return was -11.29% (quarter ended December 31, 2025). The calendar year-to-date total return of the Fund as of September 30, 2026 was (2.38)%.
|
| Year to Date Return, Label [Optional Text] |
year-to-date total return
|
| Bar Chart, Year to Date Return |
(2.38%)
|
| Bar Chart, Year to Date Return, Date |
Sep. 30, 2026
|
| Highest Quarterly Return, Label [Optional Text] |
highest quarterly return
|
| Highest Quarterly Return |
1.47%
|
| Highest Quarterly Return, Date |
Mar. 31, 2025
|
| Lowest Quarterly Return, Label [Optional Text] |
lowest quarterly return
|
| Lowest Quarterly Return |
(11.29%)
|
| Lowest Quarterly Return, Date |
Dec. 31, 2025
|
| Performance Table Heading |
Average Annual Total Returns for the Periods Ended December 31, 2025
|
| Performance Table Uses Highest Federal Rate |
After-tax returns are calculated using the historical highest individual federal marginal income tax rates during the period covered by the table above and do not reflect the impact of state and local taxes.
|
| Performance Table Not Relevant to Tax Deferred |
Actual after-tax returns depend on an investor’s tax situation and may differ from those shown. After-tax returns shown are not relevant to investors who hold shares through tax-advantaged arrangements, such as 401(k) plans or individual retirement accounts.
|
| Performance [Table] |
| |
|
1 Year |
|
|
Since
Inception
(12/9/24) |
|
| Return Before Taxes |
|
|
-25.03 |
% |
|
|
-33.28 |
% |
| Return After Taxes on Distributions |
|
|
-26.28 |
% |
|
|
-34.33 |
% |
| Return After Taxes on Distributions and Sale of Fund Shares |
|
|
-14.70 |
% |
|
|
-25.61 |
% |
| Bloomberg U.S. Aggregate Bond Index (reflects no deduction for fees, expenses or taxes) |
|
|
7.30 |
% |
|
|
5.02 |
% |
| ICE BofA Long US Treasury Principal STRIPS Index (reflects no deduction for fees, expenses or taxes) |
|
|
-1.92 |
% |
|
|
-11.20 |
% |
|
| Performance Table Closing [Text Block] |
After-tax returns are calculated using the historical highest individual federal marginal income tax rates during the period covered by the table above and do not reflect the impact of state and local taxes. Actual after-tax returns depend on an investor’s tax situation and may differ from those shown. After-tax returns shown are not relevant to investors who hold shares through tax-advantaged arrangements, such as 401(k) plans or individual retirement accounts.
|
| Performance Availability Website Address [Text] |
www.simplify.us/etfs
|
| Performance Availability Phone [Text] |
1 (855) 772-8488
|
| Simplify China A Shares PLUS Income ETF |
|
| Prospectus [Line Items] |
|
| Performance Narrative [Text Block] |
Performance: Performance information will be available in the prospectus after the Fund has been in operation for one full calendar year. Past performance is not necessarily an indication of how the Fund will perform in the future. Updated performance information will be available at no cost by visiting www.simplify.us or by calling 1 (855) 772-8488.
|
| Performance Past Does Not Indicate Future [Text] |
Past performance is not necessarily an indication of how the Fund will perform in the future.
|
| Performance One Year or Less [Text] |
Performance information will be available in the prospectus after the Fund has been in operation for one full calendar year.
|
| Performance Availability Website Address [Text] |
www.simplify.us
|
| Performance Availability Phone [Text] |
1 (855) 772-8488
|
| Simplify Chinese Commodities Strategy No K-1 ETF |
|
| Prospectus [Line Items] |
|
| Performance Narrative [Text Block] |
Performance: Performance information will be available in the prospectus after the Fund has been in operation for one full calendar year. Past performance is not necessarily an indication of how the Fund will perform in the future. Updated performance information will be available at no cost by visiting www.simplify.us or by calling 1 (855) 772-8488.
|
| Performance Past Does Not Indicate Future [Text] |
Past performance is not necessarily an indication of how the Fund will perform in the future.
|
| Performance One Year or Less [Text] |
Performance information will be available in the prospectus after the Fund has been in operation for one full calendar year.
|
| Performance Availability Website Address [Text] |
www.simplify.us
|
| Performance Availability Phone [Text] |
1 (855) 772-8488
|
| Simplify Commodities Strategy No K-1 ETF |
|
| Prospectus [Line Items] |
|
| Performance Narrative [Text Block] |
Performance: The following performance information provides some indication of the risks of investing in the Fund. The bar chart shows changes in the Fund’s performance from year to year. The table shows how the Fund’s average annual total returns compare to those of a broad-based securities market index and an additional index. The additional index tracks a diversified basket of commodity futures and is included as a performance benchmark that reflects the Fund’s core commodity market exposure. The Fund’s past performance (before and after taxes) is not necessarily an indication of how the Fund will perform in the future. Updated performance information is available at no cost by visiting www.simplify.us/etfs or by calling 1 (855) 772-8488.
|
| Performance Past Does Not Indicate Future [Text] |
The Fund’s past performance (before and after taxes) is not necessarily an indication of how the Fund will perform in the future.
|
| Performance Information Illustrates Variability of Returns [Text] |
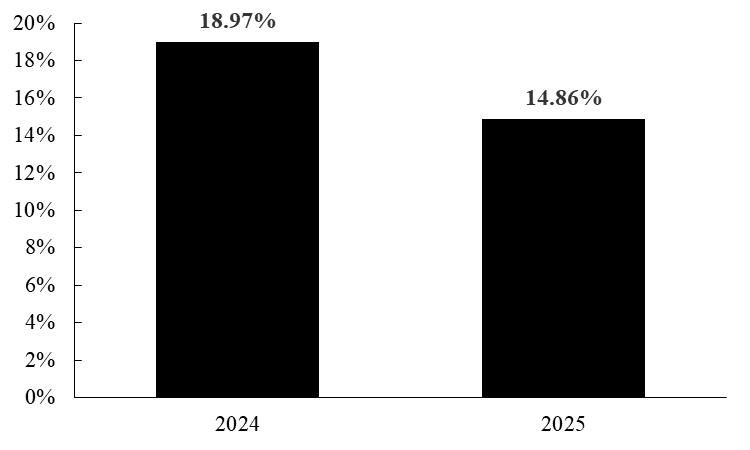
The following performance information provides some indication of the risks of investing in the Fund. The bar chart shows changes in the Fund’s performance from year to year. The table shows how the Fund’s average annual total returns compare to those of a broad-based securities market index and an additional index.
|
| Bar Chart [Table] |
| Years |
Returns |
| 2024 |
18.97% |
| 2025 |
14.86% |
|
| Bar Chart Closing [Text Block] |
During the periods shown in the bar chart above, the Fund’s highest quarterly return was 16.14% (quarter ended March 31, 2025) and the Fund’s lowest quarterly return was -8.36% (quarter ended June 30, 2025). The calendar year-to-date total return of the Fund as of September 30, 2025 was 16.85%.
|
| Year to Date Return, Label [Optional Text] |
year-to-date total return
|
| Bar Chart, Year to Date Return |
16.85%
|
| Bar Chart, Year to Date Return, Date |
Sep. 30, 2025
|
| Highest Quarterly Return, Label [Optional Text] |
highest quarterly return
|
| Highest Quarterly Return |
16.14%
|
| Highest Quarterly Return, Date |
Mar. 31, 2025
|
| Lowest Quarterly Return, Label [Optional Text] |
lowest quarterly return
|
| Lowest Quarterly Return |
(8.36%)
|
| Lowest Quarterly Return, Date |
Jun. 30, 2025
|
| Performance Table Heading |
Average Annual Total Returns for the Periods Ended December 31, 2025
|
| Performance Table Uses Highest Federal Rate |
After-tax returns are calculated using the historical highest individual federal marginal income tax rates during the period covered by the table above and do not reflect the impact of state and local taxes.
|
| Performance Table Not Relevant to Tax Deferred |
Actual after-tax returns depend on an investor’s tax situation and may differ from those shown. After-tax returns shown are not relevant to investors who hold shares through tax-advantaged arrangements, such as 401(k) plans or individual retirement accounts.
|
| Performance [Table] |
| |
|
1 Year |
|
|
Since
Inception
(3/27/23) |
|
| Return Before Taxes |
|
|
14.86 |
% |
|
|
9.88 |
% |
| Return After Taxes on Distributions |
|
|
13.34 |
% |
|
|
8.48 |
% |
| Return After Taxes on Distributions and Sale of Fund Shares |
|
|
8.78 |
% |
|
|
7.01 |
% |
| Bloomberg U.S. Aggregate Bond Index (reflects no deduction for fees, expenses or taxes) |
|
|
7.30 |
% |
|
|
4.16 |
% |
| Bloomberg Commodity Index (reflects no deduction for fees, expenses or taxes) |
|
|
15.77 |
% |
|
|
7.07 |
% |
|
| Index No Deduction for Fees, Expenses, or Taxes [Text] |
reflects no deduction for fees, expenses or taxes
|
| Performance Table Closing [Text Block] |
After-tax returns are calculated using the historical highest individual federal marginal income tax rates during the period covered by the table above and do not reflect the impact of state and local taxes. Actual after-tax returns depend on an investor’s tax situation and may differ from those shown. After-tax returns shown are not relevant to investors who hold shares through tax-advantaged arrangements, such as 401(k) plans or individual retirement accounts.
|
| Performance Availability Website Address [Text] |
www.simplify.us/etfs
|
| Performance Availability Phone [Text] |
1 (855) 772-8488
|
| Simplify Currency Strategy ETF |
|
| Prospectus [Line Items] |
|
| Performance Narrative [Text Block] |
Performance: Performance information will be available in the prospectus after the Fund has been in operation for one full calendar year. Past performance is not necessarily an indication of how the Fund will perform in the future. Updated performance information will be available at no cost by visiting www.simplify.us or by calling 1 (855) 772-8488.
|
| Performance Past Does Not Indicate Future [Text] |
Past performance is not necessarily an indication of how the Fund will perform in the future.
|
| Performance One Year or Less [Text] |
Performance information will be available in the prospectus after the Fund has been in operation for one full calendar year.
|
| Performance Availability Website Address [Text] |
www.simplify.us
|
| Performance Availability Phone [Text] |
1 (855) 772-8488
|
| Simplify DBi CTA Managed Futures Index ETF |
|
| Prospectus [Line Items] |
|
| Performance Narrative [Text Block] |
Performance: Performance information will be available in the prospectus after the Fund has been in operation for one full calendar year. Past performance is not necessarily an indication of how the Fund will perform in the future. Updated performance information will be available at no cost by visiting www.simplify.us or by calling 1 (855) 772-8488.
|
| Performance One Year or Less [Text] |
Performance information will be available in the prospectus after the Fund has been in operation for one full calendar year. Past performance is not necessarily an indication of how the Fund will perform in the future.
|
| Performance Availability Website Address [Text] |
www.simplify.us
|
| Performance Availability Phone [Text] |
1 (855) 772-8488
|
| Simplify Enhanced Income ETF |
|
| Prospectus [Line Items] |
|
| Performance Narrative [Text Block] |
Performance: The following performance information provides some indication of the risks of investing in the Fund. The bar chart shows changes in the Fund’s performance from year to year. The table shows how the Fund’s average annual total returns compare to those of a broad-based securities market index and two additional indices. The Capital U.S. Corporate High Yield Index tracks U.S. high-yield corporate bonds and is included as a performance benchmark that reflects higher-income credit characteristics relevant to the Fund’s enhanced income strategy. The ICE BofA 3 Month US Treasury Bill Index represents short-duration Treasury bills and is included as a performance benchmark reflecting the cash-equivalent baseline for the Fund’s income generation approach. The Fund’s past performance (before and after taxes) is not necessarily an indication of how the Fund will perform in the future. Updated performance information is available at no cost by visiting www.simplify.us/etfs or by calling 1 (855) 772-8488.
|
| Performance Past Does Not Indicate Future [Text] |
The Fund’s past performance (before and after taxes) is not necessarily an indication of how the Fund will perform in the future.
|
| Performance Information Illustrates Variability of Returns [Text] |
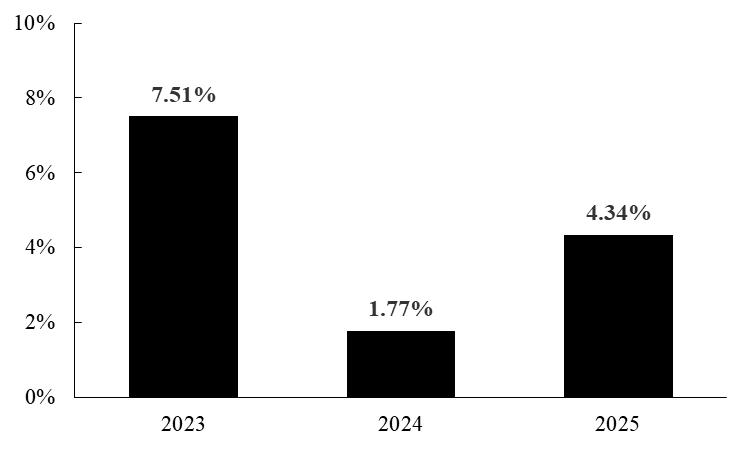
The following performance information provides some indication of the risks of investing in the Fund. The bar chart shows changes in the Fund’s performance from year to year. The table shows how the Fund’s average annual total returns compare to those of a broad-based securities market index and two additional indices.
|
| Bar Chart [Table] |
|
| Bar Chart Closing [Text Block] |
During the periods shown in the bar chart above, the Fund’s highest quarterly return was 12.40% (quarter ended June 30, 2025) and the Fund’s lowest quarterly return was -3.38% (quarter ended March 31, 2025). The calendar year-to-date total return of the Fund as of September 30, 2026 was (0.94)%.
| Years |
Returns |
| 2023 |
7.51% |
| 2024 |
1.77% |
| 2025 |
4.34% |
|
| Year to Date Return, Label [Optional Text] |
year-to-date total return
|
| Bar Chart, Year to Date Return |
(0.94%)
|
| Bar Chart, Year to Date Return, Date |
Sep. 30, 2026
|
| Highest Quarterly Return, Label [Optional Text] |
highest quarterly return
|
| Highest Quarterly Return |
12.40%
|
| Highest Quarterly Return, Date |
Jun. 30, 2025
|
| Lowest Quarterly Return, Label [Optional Text] |
lowest quarterly return
|
| Lowest Quarterly Return |
(3.38%)
|
| Lowest Quarterly Return, Date |
Mar. 31, 2025
|
| Performance Table Heading |
Average Annual Total Returns for the Periods Ended December 31, 2025
|
| Performance Table Uses Highest Federal Rate |
After-tax returns are calculated using the historical highest individual federal marginal income tax rates during the period covered by the table above and do not reflect the impact of state and local taxes.
|
| Performance Table Not Relevant to Tax Deferred |
Actual after-tax returns depend on an investor’s tax situation and may differ from those shown. After-tax returns shown are not relevant to investors who hold shares through tax-advantaged arrangements, such as 401(k) plans or individual retirement accounts.
|
| Performance [Table] |
| |
|
1 Year |
|
|
Since
Inception
(10/27/22) |
|
| Return Before Taxes |
|
|
4.34 |
% |
|
|
4.49 |
% |
| Return After Taxes on Distributions |
|
|
1.25 |
% |
|
|
1.18 |
% |
| Return After Taxes on Distributions and Sale of Fund Shares |
|
|
2.58 |
% |
|
|
2.04 |
% |
| Bloomberg U.S. Aggregate Bond Index (reflects no deduction for fees, expenses or taxes) |
|
|
7.30 |
% |
|
|
5.22 |
% |
| Capital U.S. Corporate High Yield Index (reflects no deduction for fees, expenses or taxes) |
|
|
8.62 |
% |
|
|
10.02 |
% |
| ICE BofA 3 Month US Treasury Bill Index (reflects no deduction for fees, expenses or taxes) |
|
|
4.18 |
% |
|
|
4.77 |
% |
|
| Index No Deduction for Fees, Expenses, or Taxes [Text] |
reflects no deduction for fees, expenses or taxes
|
| Performance Table Closing [Text Block] |
After-tax returns are calculated using the historical highest individual federal marginal income tax rates during the period covered by the table above and do not reflect the impact of state and local taxes. Actual after-tax returns depend on an investor’s tax situation and may differ from those shown. After-tax returns shown are not relevant to investors who hold shares through tax-advantaged arrangements, such as 401(k) plans or individual retirement accounts.
|
| Performance Availability Website Address [Text] |
www.simplify.us/etfs
|
| Performance Availability Phone [Text] |
1 (855) 772-8488
|
| Simplify Gold Strategy ETF |
|
| Prospectus [Line Items] |
|
| Performance Narrative [Text Block] |
Performance: The
following performance information provides some indication of the risks of investing in the Fund. The bar chart shows changes in the
Fund’s performance from year to year. The
table shows how the Fund’s average annual total returns compare to those of a broad-based securities market index and an additional index. The additional index, Solactive Gold Spot Index, tracks the U.S. dollar price of gold and is included as a performance benchmark that
reflects the Fund’s core gold exposure component. The
Fund’s past performance (before and after taxes) is not necessarily an indication of how the Fund will perform in the
future. Updated performance information is available at no cost by visiting www.simplify.us/etfs
or by calling 1
(855) 772-8488.
|
| Performance Past Does Not Indicate Future [Text] |
The
table shows how the Fund’s average annual total returns compare to those of a broad-based securities market index and an additional index. The additional index, Solactive Gold Spot Index, tracks the U.S. dollar price of gold and is included as a performance benchmark that
reflects the Fund’s core gold exposure component. The
Fund’s past performance (before and after taxes) is not necessarily an indication of how the Fund will perform in the
future.
|
| Performance One Year or Less [Text] |
The
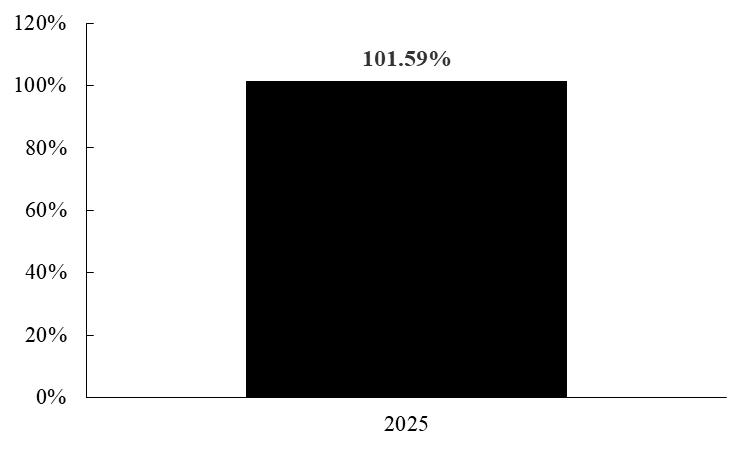
following performance information provides some indication of the risks of investing in the Fund. The bar chart shows changes in the
Fund’s performance from year to year.
|
| Bar Chart [Table] |
| Years |
Returns |
| 2025 |
101.59% |
|
| Bar Chart Closing [Text Block] |
During the periods shown in the bar chart above, the Fund’s highest quarterly return was 21.44% (quarter ended March 31, 2025) and the Fund’s lowest quarterly return was 14.72% (quarter ended December 31, 2025). The calendar year-to-date total return of the Fund as of September 30, 2026 was (20.38)%.
|
| Year to Date Return, Label [Optional Text] |
year-to-date total return
|
| Bar Chart, Year to Date Return |
(20.38%)
|
| Bar Chart, Year to Date Return, Date |
Sep. 30, 2026
|
| Highest Quarterly Return, Label [Optional Text] |
highest quarterly return
|
| Highest Quarterly Return |
21.44%
|
| Highest Quarterly Return, Date |
Mar. 31, 2025
|
| Lowest Quarterly Return, Label [Optional Text] |
lowest quarterly return
|
| Lowest Quarterly Return |
14.72%
|
| Lowest Quarterly Return, Date |
Dec. 31, 2025
|
| Performance Table Heading |
Average Annual Total Returns for the Periods Ended December 31, 2025
|
| Performance Table Uses Highest Federal Rate |
After-tax returns are calculated using the historical highest individual federal marginal income tax rates during the period covered by the table above and do not reflect the impact of state and local taxes.
|
| Performance Table Not Relevant to Tax Deferred |
Actual after-tax returns depend on an investor’s tax situation and may differ from those shown. After-tax returns shown are not relevant to investors who hold shares through tax-advantaged arrangements, such as 401(k) plans or individual retirement accounts.
|
| Performance [Table] |
| |
|
1 Year |
|
|
Since
Inception
(12/2/24) |
|
| Return Before Taxes |
|
|
101.59 |
% |
|
|
84.09 |
% |
| Return After Taxes on Distributions |
|
|
90.65 |
% |
|
|
74.81 |
% |
| Return After Taxes on Distributions and Sale of Fund Shares |
|
|
59.95 |
% |
|
|
60.36 |
% |
| Bloomberg
U.S. Aggregate Bond Index (reflects no deduction for fees, expenses or taxes) |
|
|
7.30 |
% |
|
|
5.06 |
% |
| Solactive Gold Spot Index ER USD Index (reflects no deduction for fees, expenses or taxes) |
|
|
64.41 |
% |
|
|
57.71 |
% |
|
| Index No Deduction for Fees, Expenses, or Taxes [Text] |
reflects no deduction for fees, expenses or taxes
|
| Performance Table Closing [Text Block] |
After-tax returns are calculated using the historical highest individual federal marginal income tax rates during the period covered by the table above and do not reflect the impact of state and local taxes. Actual after-tax returns depend on an investor’s tax situation and may differ from those shown. After-tax returns shown are not relevant to investors who hold shares through tax-advantaged arrangements, such as 401(k) plans or individual retirement accounts.
|
| Performance Availability Website Address [Text] |
www.simplify.us/etfs
|
| Performance Availability Phone [Text] |
1
(855) 772-8488
|
| Simplify Government Money Market ETF |
|
| Prospectus [Line Items] |
|
| Performance Narrative [Text Block] |
Performance: Performance information will be available in the prospectus after the Fund has been in operation for one full calendar year. Past performance is not necessarily an indication of how the Fund will perform in the future. Updated performance information will be available at no cost by visiting www.simplify.us or by calling 1 (855) 772-8488.
|
| Performance Past Does Not Indicate Future [Text] |
Past performance is not necessarily an indication of how the Fund will perform in the future.
|
| Performance One Year or Less [Text] |
Performance information will be available in the prospectus after the Fund has been in operation for one full calendar year.
|
| Performance Availability Website Address [Text] |
www.simplify.us
|
| Performance Availability Phone [Text] |
1 (855) 772-8488
|
| Simplify Health Care ETF |
|
| Prospectus [Line Items] |
|
| Performance Narrative [Text Block] |
Performance: The following performance information provides some indication of the risks of investing in the Fund. The bar chart shows changes in the Fund’s performance from year to year. The table shows how the Fund’s average annual total returns compare to those of a broad-based securities market index and an additional index. The additional index tracks U.S. health care stocks across all market capitalizations and is included as a performance benchmark that is relevant to the Fund’s health care sector investment focus. The Fund’s past performance (before and after taxes) is not necessarily an indication of how the Fund will perform in the future. Updated performance information is available at no cost by visiting www.simplify.us/etfs or by calling 1 (855) 772-8488.
|
| Performance Past Does Not Indicate Future [Text] |
The Fund’s past performance (before and after taxes) is not necessarily an indication of how the Fund will perform in the future.
|
| Performance Information Illustrates Variability of Returns [Text] |
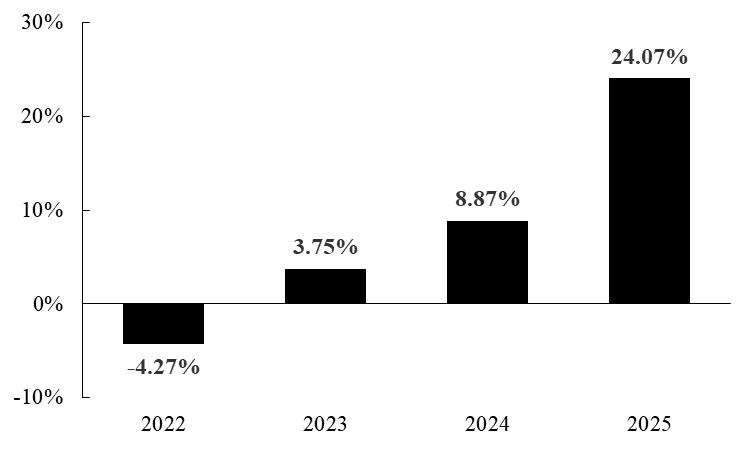
The following performance information provides some indication of the risks of investing in the Fund. The bar chart shows changes in the Fund’s performance from year to year. The table shows how the Fund’s average annual total returns compare to those of a broad-based securities market index and an additional index.
|
| Bar Chart [Table] |
| Years |
Returns |
| 2022 |
-4.27% |
| 2023 |
3.75% |
| 2024 |
8.87% |
| 2025 |
24.07% |
|
| Bar Chart Closing [Text Block] |
During the periods shown in the bar chart above, the Fund’s highest quarterly return was 15.59% (quarter ended December 31, 2025) and the Fund’s lowest quarterly return was -9.47% (quarter ended December 31, 2024). The calendar year-to-date total return of the Fund as of September 30, 2026 was 6.36%.
|
| Year to Date Return, Label [Optional Text] |
year-to-date total return
|
| Bar Chart, Year to Date Return |
6.36%
|
| Bar Chart, Year to Date Return, Date |
Sep. 30, 2026
|
| Highest Quarterly Return, Label [Optional Text] |
highest quarterly return
|
| Highest Quarterly Return |
15.59%
|
| Highest Quarterly Return, Date |
Dec. 31, 2025
|
| Lowest Quarterly Return, Label [Optional Text] |
lowest quarterly return
|
| Lowest Quarterly Return |
(9.47%)
|
| Lowest Quarterly Return, Date |
Dec. 31, 2024
|
| Performance Table Heading |
Average Annual Total Returns for the Periods Ended December 31, 2025
|
| Performance Table Uses Highest Federal Rate |
After-tax returns are calculated using the historical highest individual federal marginal income tax rates during the period covered by the table above and do not reflect the impact of state and local taxes.
|
| Performance Table Not Relevant to Tax Deferred |
Actual after-tax returns depend on an investor’s tax situation and may differ from those shown. After-tax returns shown are not relevant to investors who hold shares through tax-advantaged arrangements, such as 401(k) plans or individual retirement accounts.
|
| Performance [Table] |
| |
|
1 Year |
|
|
Since
Inception
(10/8/21) |
|
| Return Before Taxes |
|
|
24.07 |
% |
|
|
10.05 |
% |
| Return After Taxes on Distributions |
|
|
23.68 |
% |
|
|
9.80 |
% |
| Return After Taxes on Distributions and Sale of Fund Shares |
|
|
14.22 |
% |
|
|
7.80 |
% |
| S&P 500 Index (reflects no deduction for fees, expenses or taxes) |
|
|
17.88 |
% |
|
|
12.66 |
% |
| MSCI USA IMI/Health Care Net (USD) Index (reflects no deduction for fees, expenses or taxes) |
|
|
14.91 |
% |
|
|
4.76 |
% |
|
| Index No Deduction for Fees, Expenses, or Taxes [Text] |
reflects no deduction for fees, expenses or taxes
|
| Performance Table Closing [Text Block] |
After-tax returns are calculated using the historical highest individual federal marginal income tax rates during the period covered by the table above and do not reflect the impact of state and local taxes. Actual after-tax returns depend on an investor’s tax situation and may differ from those shown. After-tax returns shown are not relevant to investors who hold shares through tax-advantaged arrangements, such as 401(k) plans or individual retirement accounts.
|
| Performance Availability Website Address [Text] |
www.simplify.us/etfs
|
| Performance Availability Phone [Text] |
1 (855) 772-8488
|
| Simplify Hedged Equity ETF |
|
| Prospectus [Line Items] |
|
| Performance Narrative [Text Block] |
Performance: The following performance information provides some indication of the risks of investing in the Fund. The bar chart shows changes in the Fund’s performance from year to year. The table shows how the Fund’s average annual total returns compare to those of a broad-based securities market index and an additional index. The additional index represents a 60% equity and 40% fixed income allocation and is included as a performance benchmark that reflects a balanced risk-adjusted approach comparable to the Fund’s hedged equity strategy. The Fund’s past performance (before and after taxes) is not necessarily an indication of how the Fund will perform in the future. Updated performance information is available at no cost by visiting www.simplify.us/etfs or by calling 1 (855) 772-8488.
|
| Performance Past Does Not Indicate Future [Text] |
The Fund’s past performance (before and after taxes) is not necessarily an indication of how the Fund will perform in the future.
|
| Performance Information Illustrates Variability of Returns [Text] |
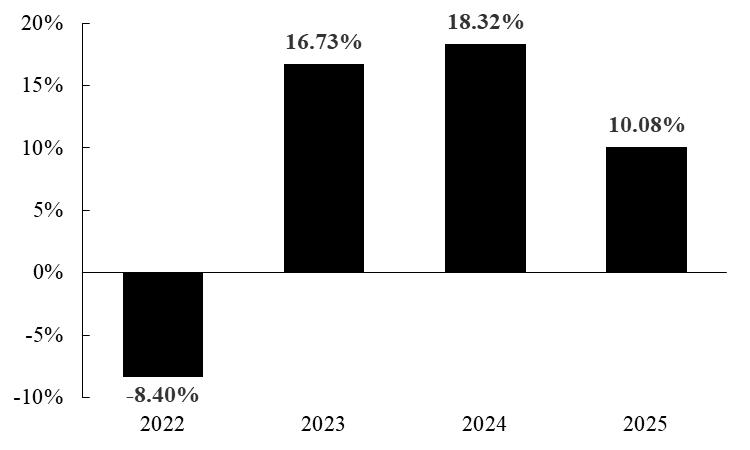
The following performance information provides some indication of the risks of investing in the Fund. The bar chart shows changes in the Fund’s performance from year to year. The table shows how the Fund’s average annual total returns compare to those of a broad-based securities market index and an additional index.
|
| Bar Chart [Table] |
| Years |
Returns |
| 2022 |
-8.40% |
| 2023 |
16.73% |
| 2024 |
18.32% |
| 2025 |
10.08% |
|
| Bar Chart Closing [Text Block] |
During the periods shown in the bar chart above, the Fund’s highest quarterly return was 6.85% (quarter ended December 31, 2023) and the Fund’s lowest quarterly return was -5.67% (quarter ended June 30, 2022). The calendar year-to-date total return of the Fund as of September 30, 2026 was 7.96%.
|
| Year to Date Return, Label [Optional Text] |
year-to-date total return
|
| Bar Chart, Year to Date Return |
7.96%
|
| Bar Chart, Year to Date Return, Date |
Sep. 30, 2026
|
| Highest Quarterly Return, Label [Optional Text] |
highest quarterly return
|
| Highest Quarterly Return |
6.85%
|
| Highest Quarterly Return, Date |
Dec. 31, 2023
|
| Lowest Quarterly Return, Label [Optional Text] |
lowest quarterly return
|
| Lowest Quarterly Return |
(5.67%)
|
| Lowest Quarterly Return, Date |
Jun. 30, 2022
|
| Performance Table Heading |
Average Annual Total Returns for the Periods Ended December 31, 2025
|
| Performance Table Uses Highest Federal Rate |
After-tax returns are calculated using the historical highest individual federal marginal income tax rates during the period covered by the table above and do not reflect the impact of state and local taxes.
|
| Performance Table Not Relevant to Tax Deferred |
Actual after-tax returns depend on an investor’s tax situation and may differ from those shown. After-tax returns shown are not relevant to investors who hold shares through tax-advantaged arrangements, such as 401(k) plans or individual retirement accounts.
|
| Performance [Table] |
| |
|
1 Year |
|
|
Since
Inception
(11/1/21) |
|
| Return Before Taxes |
|
|
10.08 |
% |
|
|
8.92 |
% |
| Return After Taxes on Distributions |
|
|
9.52 |
% |
|
|
8.03 |
% |
| Return After Taxes on Distributions and Sale of Fund Shares |
|
|
5.95 |
% |
|
|
6.64 |
% |
| S&P 500 Index (reflects no deduction for fees, expenses or taxes) |
|
|
17.88 |
% |
|
|
11.58 |
% |
| Bloomberg US EQ:FI 60:40 Index (BMA) (reflects no deduction for fees, expenses or taxes) |
|
|
13.81 |
% |
|
|
6.74 |
% |
|
| Index No Deduction for Fees, Expenses, or Taxes [Text] |
reflects no deduction for fees, expenses or taxes
|
| Performance Table Closing [Text Block] |
After-tax returns are calculated using the historical highest individual federal marginal income tax rates during the period covered by the table above and do not reflect the impact of state and local taxes. Actual after-tax returns depend on an investor’s tax situation and may differ from those shown. After-tax returns shown are not relevant to investors who hold shares through tax-advantaged arrangements, such as 401(k) plans or individual retirement accounts.
|
| Performance Availability Website Address [Text] |
www.simplify.us/etfs
|
| Performance Availability Phone [Text] |
1 (855) 772-8488
|
| Simplify High Yield ETF |
|
| Prospectus [Line Items] |
|
| Performance Narrative [Text Block] |
Performance: The following performance information provides some indication of the risks of investing in the Fund. The bar chart shows changes in the Fund’s performance from year to year. The table shows how the Fund’s average annual total returns compare to those of a broad-based securities market index and an additional index. The additional index tracks U.S. high-yield corporate bonds and is included as a performance benchmark relevant to the Fund’s high-yield fixed income investment strategy. The Fund’s past performance (before and after taxes) is not necessarily an indication of how the Fund will perform in the future. Updated performance information is available at no cost by visiting www.simplify.us/etfs or by calling 1 (855) 772-8488.
|
| Performance Past Does Not Indicate Future [Text] |
The Fund’s past performance (before and after taxes) is not necessarily an indication of how the Fund will perform in the future.
|
| Performance Information Illustrates Variability of Returns [Text] |
The following performance information provides some indication of the risks of investing in the Fund. The bar chart shows changes in the Fund’s performance from year to year. The table shows how the Fund’s average annual total returns compare to those of a broad-based securities market index and an additional index.
|
| Bar Chart [Table] |
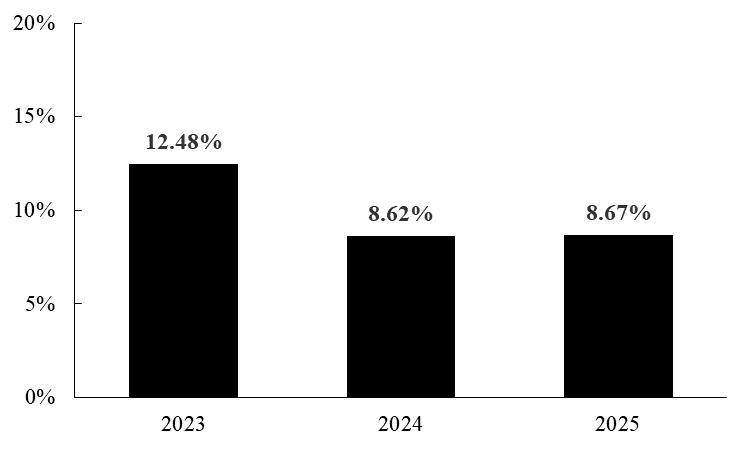
| Years |
Returns |
| 2023 |
12.48% |
| 2024 |
8.62% |
| 2025 |
8.67% |
|
| Bar Chart Closing [Text Block] |
During the periods shown in the bar chart above, the Fund’s highest quarterly return was 6.58% (quarter ended December 31, 2023) and the Fund’s lowest quarterly return was -1.55% (quarter ended December 31, 2024). The calendar year-to-date total return of the Fund as of September 30, 2026 was (3.91)%.
|
| Year to Date Return, Label [Optional Text] |
year-to-date total return
|
| Bar Chart, Year to Date Return |
(3.91%)
|
| Bar Chart, Year to Date Return, Date |
Sep. 30, 2026
|
| Highest Quarterly Return, Label [Optional Text] |
highest quarterly return
|
| Highest Quarterly Return |
6.58%
|
| Highest Quarterly Return, Date |
Dec. 31, 2023
|
| Lowest Quarterly Return, Label [Optional Text] |
lowest quarterly return
|
| Lowest Quarterly Return |
(1.55%)
|
| Lowest Quarterly Return, Date |
Dec. 31, 2024
|
| Performance Table Heading |
Average Annual Total Returns for the Periods Ended December 31, 2025
|
| Performance Table Uses Highest Federal Rate |
After-tax returns are calculated using the historical highest individual federal marginal income tax rates during the period covered by the table above and do not reflect the impact of state and local taxes.
|
| Performance Table Not Relevant to Tax Deferred |
Actual after-tax returns depend on an investor’s tax situation and may differ from those shown. After-tax returns shown are not relevant to investors who hold shares through tax-advantaged arrangements, such as 401(k) plans or individual retirement accounts.
|
| Performance [Table] |
| |
|
1 Year |
|
|
Since
Inception
(2/14/22) |
|
| Return Before Taxes |
|
|
8.67 |
% |
|
|
5.32 |
% |
| Return After Taxes on Distributions |
|
|
5.70 |
% |
|
|
1.93 |
% |
| Return After Taxes on Distributions and Sale of Fund Shares |
|
|
5.17 |
% |
|
|
2.55 |
% |
| Bloomberg U.S. Aggregate Bond Index (reflects no deduction for fees, expenses or taxes) |
|
|
7.30 |
% |
|
|
0.98 |
% |
| ICE BofA US High Yield Index (reflects no deduction for fees, expenses or taxes) |
|
|
8.50 |
% |
|
|
5.67 |
% |
|
| Index No Deduction for Fees, Expenses, or Taxes [Text] |
reflects no deduction for fees, expenses or taxes
|
| Performance Table Closing [Text Block] |
After-tax returns are calculated using the historical highest individual federal marginal income tax rates during the period covered by the table above and do not reflect the impact of state and local taxes. Actual after-tax returns depend on an investor’s tax situation and may differ from those shown. After-tax returns shown are not relevant to investors who hold shares through tax-advantaged arrangements, such as 401(k) plans or individual retirement accounts.
|
| Performance Availability Website Address [Text] |
www.simplify.us/etfs
|
| Performance Availability Phone [Text] |
1 (855) 772-8488
|
| Simplify Interest Rate Hedge ETF |
|
| Prospectus [Line Items] |
|
| Performance Narrative [Text Block] |
Performance: The following performance information provides some indication of the risks of investing in the Fund. The bar chart shows changes in the Fund’s performance from year to year. The table shows how the Fund’s average annual total returns compare to those of a broad-based securities market index and an additional index. The additional index tracks long-duration U.S. Treasury bonds and is included as a performance benchmark that reflects the interest rate sensitivity the Fund seeks to hedge against. The Fund’s past performance (before and after taxes) is not necessarily an indication of how the Fund will perform in the future. Updated performance information is available at no cost by visiting www.simplify.us/etfs or by calling 1 (855) 772-8488.
|
| Performance Past Does Not Indicate Future [Text] |
The Fund’s past performance (before and after taxes) is not necessarily an indication of how the Fund will perform in the future.
|
| Performance Information Illustrates Variability of Returns [Text] |
The following performance information provides some indication of the risks of investing in the Fund. The bar chart shows changes in the Fund’s performance from year to year. The table shows how the Fund’s average annual total returns compare to those of a broad-based securities market index and an additional index. The additional index tracks long-duration U.S. Treasury bonds and is included as a performance benchmark that reflects the interest rate sensitivity the Fund seeks to hedge against.
|
| Bar Chart [Table] |
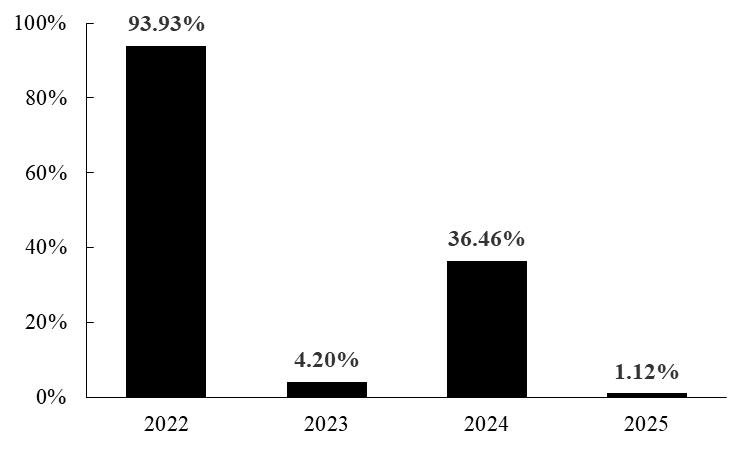
| Years |
Returns |
| 2022 |
93.93% |
| 2023 |
4.20% |
| 2024 |
36.46% |
| 2025 |
1.12% |
|
| Bar Chart Closing [Text Block] |
During the periods shown in the bar chart above, the Fund’s highest quarterly return was 48.64% (quarter ended September 30, 2023) and the Fund’s lowest quarterly return was -21.57% (quarter ended December 31, 2023). The calendar year-to-date total return of the Fund as of September 30, 2026 was 33.45%.
|
| Year to Date Return, Label [Optional Text] |
year-to-date total return
|
| Bar Chart, Year to Date Return |
33.45%
|
| Bar Chart, Year to Date Return, Date |
Sep. 30, 2026
|
| Highest Quarterly Return, Label [Optional Text] |
highest quarterly return
|
| Highest Quarterly Return |
48.64%
|
| Highest Quarterly Return, Date |
Sep. 30, 2023
|
| Lowest Quarterly Return, Label [Optional Text] |
lowest quarterly return
|
| Lowest Quarterly Return |
(21.57%)
|
| Lowest Quarterly Return, Date |
Dec. 31, 2023
|
| Performance Table Heading |
Average Annual Total Returns for the Periods Ended December 31, 2025
|
| Performance Table Uses Highest Federal Rate |
After-tax returns are calculated using the historical highest individual federal marginal income tax rates during the period covered by the table above and do not reflect the impact of state and local taxes.
|
| Performance Table Not Relevant to Tax Deferred |
Actual after-tax returns depend on an investor’s tax situation and may differ from those shown. After-tax returns shown are not relevant to investors who hold shares through tax-advantaged arrangements, such as 401(k) plans or individual retirement accounts.
|
| Performance [Table] |
| |
|
1 Year |
|
|
Since
Inception
(5/10/21) |
|
| Return Before Taxes |
|
|
1.12 |
% |
|
|
17.19 |
% |
| Return After Taxes on Distributions |
|
|
-1.92 |
% |
|
|
12.78 |
% |
| Return After Taxes on Distributions and Sale of Fund Shares |
|
|
1.46 |
% |
|
|
12.56 |
% |
| Bloomberg U.S. Aggregate Bond Index (reflects no deduction for fees, expenses or taxes) |
|
|
7.30 |
% |
|
|
0.16 |
% |
| ICE US Treasury 20+ Year Bond Index (reflects no deduction for fees, expenses or taxes) |
|
|
4.29 |
% |
|
|
-6.33 |
% |
|
| Index No Deduction for Fees, Expenses, or Taxes [Text] |
reflects no deduction for fees, expenses or taxes
|
| Performance Table Closing [Text Block] |
After-tax returns are calculated using the historical highest individual federal marginal income tax rates during the period covered by the table above and do not reflect the impact of state and local taxes. Actual after-tax returns depend on an investor’s tax situation and may differ from those shown. After-tax returns shown are not relevant to investors who hold shares through tax-advantaged arrangements, such as 401(k) plans or individual retirement accounts.
|
| Performance Availability Website Address [Text] |
www.simplify.us/etfs
|
| Performance Availability Phone [Text] |
1 (855) 772-8488
|
| Simplify Intermediate Term Treasury Futures Strategy ETF |
|
| Prospectus [Line Items] |
|
| Performance Narrative [Text Block] |
Performance: The following performance information provides some indication of the risks of investing in the Fund. The bar chart shows changes in the Fund’s performance from year to year. The table shows how the Fund’s average annual total returns compare to those of a broad-based securities market index and an additional index. The additional index tracks long-duration U.S. Treasury bonds and is included as a performance benchmark that provides context for the broader Treasury market relative to the Fund’s intermediate-term futures positioning. The Fund’s past performance (before and after taxes) is not necessarily an indication of how the Fund will perform in the future. Updated performance information is available at no cost by visiting www.simplify.us/etfs or by calling 1 (855) 772-8488.
|
| Performance Past Does Not Indicate Future [Text] |
The Fund’s past performance (before and after taxes) is not necessarily an indication of how the Fund will perform in the future.
|
| Performance Information Illustrates Variability of Returns [Text] |
The following performance information provides some indication of the risks of investing in the Fund. The bar chart shows changes in the Fund’s performance from year to year. The table shows how the Fund’s average annual total returns compare to those of a broad-based securities market index and an additional index.
|
| Bar Chart [Table] |
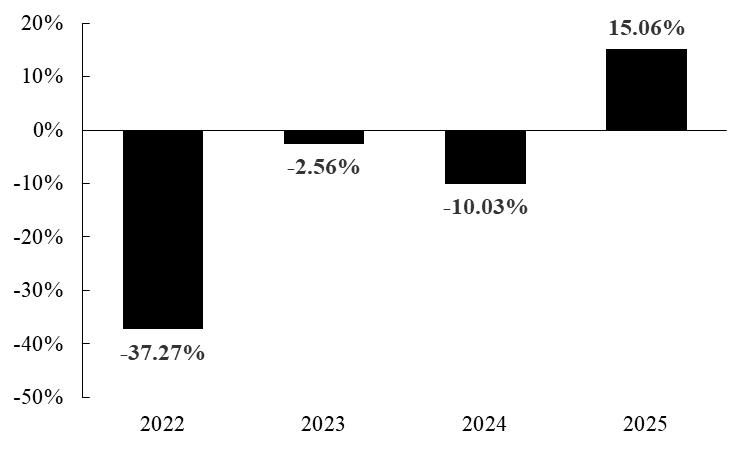
| Years |
Returns |
| 2022 |
-37.27% |
| 2023 |
-2.56% |
| 2024 |
-10.03% |
| 2025 |
15.06% |
|
| Bar Chart Closing [Text Block] |
During the periods shown in the bar chart above, the Fund’s highest quarterly return was 13.71% (quarter ended December 31, 2023) and the Fund’s lowest quarterly return was -18.22% (quarter ended March 31, 2022). The calendar year-to-date total return of the Fund as of September 30, 2026 was (17.70)%.
|
| Year to Date Return, Label [Optional Text] |
year-to-date total return
|
| Bar Chart, Year to Date Return |
(17.70%)
|
| Bar Chart, Year to Date Return, Date |
Sep. 30, 2026
|
| Highest Quarterly Return, Label [Optional Text] |
highest quarterly return
|
| Highest Quarterly Return |
13.71%
|
| Highest Quarterly Return, Date |
Dec. 31, 2023
|
| Lowest Quarterly Return, Label [Optional Text] |
lowest quarterly return
|
| Lowest Quarterly Return |
(18.22%)
|
| Lowest Quarterly Return, Date |
Mar. 31, 2022
|
| Performance Table Heading |
Average Annual Total Returns for the Periods Ended December 31, 2025
|
| Performance Table Uses Highest Federal Rate |
After-tax returns are calculated using the historical highest individual federal marginal income tax rates during the period covered by the table above and do not reflect the impact of state and local taxes.
|
| Performance Table Not Relevant to Tax Deferred |
Actual after-tax returns depend on an investor’s tax situation and may differ from those shown. After-tax returns shown are not relevant to investors who hold shares through tax-advantaged arrangements, such as 401(k) plans or individual retirement accounts.
|
| Performance [Table] |
| |
|
1 Year |
|
|
Since
Inception
(9/27/21) |
|
| Return Before Taxes |
|
|
15.06 |
% |
|
|
-10.31 |
% |
| Return After Taxes on Distributions |
|
|
13.23 |
% |
|
|
-11.57 |
% |
| Return After Taxes on Distributions and Sale of Fund Shares |
|
|
8.87 |
% |
|
|
-7.98 |
% |
| Bloomberg U.S. Aggregate Bond Index (reflects no deduction for fees, expenses or taxes) |
|
|
7.30 |
% |
|
|
-0.12 |
% |
| ICE US Treasury 20+ Year Bond Index (reflects no deduction for fees, expenses or taxes) |
|
|
4.29 |
% |
|
|
-8.32 |
% |
|
| Index No Deduction for Fees, Expenses, or Taxes [Text] |
reflects no deduction for fees, expenses or taxes
|
| Performance Table Closing [Text Block] |
After-tax returns are calculated using the historical highest individual federal marginal income tax rates during the period covered by the table above and do not reflect the impact of state and local taxes. Actual after-tax returns depend on an investor’s tax situation and may differ from those shown. After-tax returns shown are not relevant to investors who hold shares through tax-advantaged arrangements, such as 401(k) plans or individual retirement accounts.
|
| Performance Availability Website Address [Text] |
www.simplify.us/etfs
|
| Performance Availability Phone [Text] |
1 (855) 772-8488
|
| Simplify Managed Futures Strategy ETF |
|
| Prospectus [Line Items] |
|
| Performance Narrative [Text Block] |
Performance: The following performance information provides some indication of the risks of investing in the Fund. The bar chart shows changes in the Fund’s performance from year to year. The table shows how the Fund’s average annual total returns compare to those of a broad-based securities market index and an additional index. The additional index tracks systematic trend-following and managed futures strategies and is included as a performance benchmark that reflects the Fund’s CTA-based investment approach. The Fund’s past performance (before and after taxes) is not necessarily an indication of how the Fund will perform in the future. Updated performance information is available at no cost by visiting www.simplify.us/etfs or by calling 1 (855) 772-8488.
|
| Performance Past Does Not Indicate Future [Text] |
The Fund’s past performance (before and after taxes) is not necessarily an indication of how the Fund will perform in the future.
|
| Performance Information Illustrates Variability of Returns [Text] |
The following performance information provides some indication of the risks of investing in the Fund. The bar chart shows changes in the Fund’s performance from year to year. The table shows how the Fund’s average annual total returns compare to those of a broad-based securities market index and an additional index.
|
| Bar Chart [Table] |
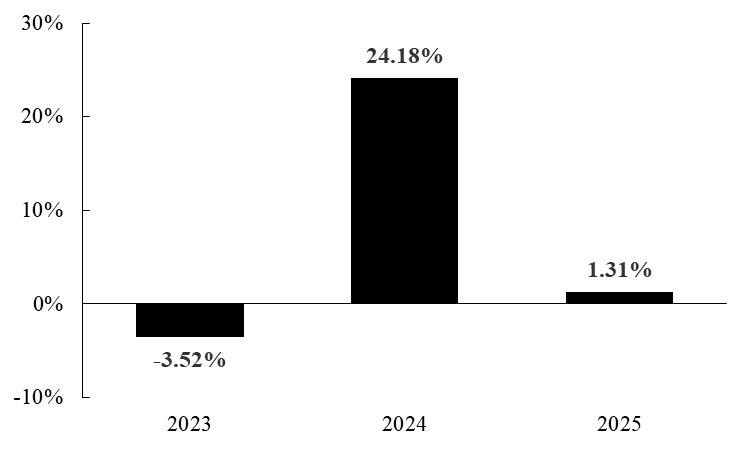
| Years |
Returns |
| 2023 |
-3.52% |
| 2024 |
24.18% |
| 2025 |
1.31% |
|
| Bar Chart Closing [Text Block] |
During the periods shown in the bar chart above, the Fund’s highest quarterly return was 10.11% (quarter ended December 31, 2024) and the Fund’s lowest quarterly return was -10.90% (quarter ended March 31, 2023). The calendar year-to-date total return of the Fund as of September 30, 2026 was 10.19%.
|
| Year to Date Return, Label [Optional Text] |
year-to-date total return
|
| Bar Chart, Year to Date Return |
10.19%
|
| Bar Chart, Year to Date Return, Date |
Sep. 30, 2026
|
| Highest Quarterly Return, Label [Optional Text] |
highest quarterly return
|
| Highest Quarterly Return |
10.11%
|
| Highest Quarterly Return, Date |
Dec. 31, 2024
|
| Lowest Quarterly Return, Label [Optional Text] |
lowest quarterly return
|
| Lowest Quarterly Return |
(10.90%)
|
| Lowest Quarterly Return, Date |
Mar. 31, 2023
|
| Performance Table Heading |
Average Annual Total Returns for the Periods Ended December 31, 2025
|
| Performance Table Uses Highest Federal Rate |
After-tax returns are calculated using the historical highest individual federal marginal income tax rates during the period covered by the table above and do not reflect the impact of state and local taxes.
|
| Performance Table Not Relevant to Tax Deferred |
Actual after-tax returns depend on an investor’s tax situation and may differ from those shown. After-tax returns shown are not relevant to investors who hold shares through tax-advantaged arrangements, such as 401(k) plans or individual retirement accounts.
|
| Performance [Table] |
| |
|
1 Year |
|
|
Since
Inception
(3/7/22) |
|
| Return Before Taxes |
|
|
1.31 |
% |
|
|
8.33 |
% |
| Return After Taxes on Distributions |
|
|
0.01 |
% |
|
|
6.14 |
% |
| Return After Taxes on Distributions and Sale of Fund Shares |
|
|
0.77 |
% |
|
|
5.61 |
% |
| Bloomberg U.S. Aggregate Bond Index (reflects no deduction for fees, expenses or taxes) |
|
|
7.30 |
% |
|
|
0.87 |
% |
| SG CTA Index (reflects no deduction for fees, expenses or taxes) |
|
|
-0.16 |
% |
|
|
1.51 |
% |
|
| Index No Deduction for Fees, Expenses, or Taxes [Text] |
reflects no deduction for fees, expenses or taxes
|
| Performance Table Closing [Text Block] |
After-tax returns are calculated using the historical highest individual federal marginal income tax rates during the period covered by the table above and do not reflect the impact of state and local taxes. Actual after-tax returns depend on an investor’s tax situation and may differ from those shown. After-tax returns shown are not relevant to investors who hold shares through tax-advantaged arrangements, such as 401(k) plans or individual retirement accounts.
|
| Performance Availability Website Address [Text] |
www.simplify.us/etfs
|
| Performance Availability Phone [Text] |
1 (855) 772-8488
|
| Simplify MBS ETF |
|
| Prospectus [Line Items] |
|
| Performance Narrative [Text Block] |
Performance: The following performance information provides some indication of the risks of investing in the Fund. The bar chart shows the Fund’s performance from year to year. The table shows how the Fund’s average annual total returns compare with those of a broad-based securities market index and an additional index. The additional index tracks U.S. agency mortgage-backed securities and is included as a performance benchmark relevant to the Fund’s MBS investment strategy. The Fund’s past performance (before and after taxes) is not necessarily an indication of how the Fund will perform in the future. Updated performance information is available at no cost by visiting www.simplify.us/etfs or by calling 1 (855) 772-8488.
|
| Performance Past Does Not Indicate Future [Text] |
The Fund’s past performance (before and after taxes) is not necessarily an indication of how the Fund will perform in the future.
|
| Performance Information Illustrates Variability of Returns [Text] |
The following performance information provides some indication of the risks of investing in the Fund. The bar chart shows the Fund’s performance from year to year. The table shows how the Fund’s average annual total returns compare with those of a broad-based securities market index and an additional index. The additional index tracks U.S. agency mortgage-backed securities and is included as a performance benchmark relevant to the Fund’s MBS investment strategy.
|
| Bar Chart [Table] |
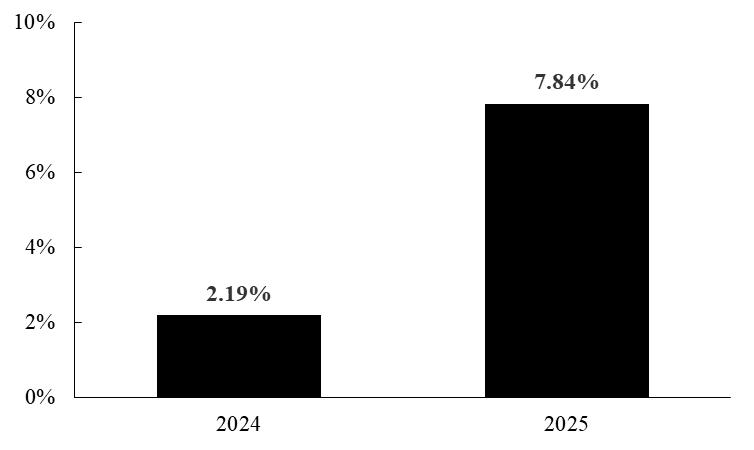
| Years |
Returns |
| 2024 |
2.19% |
| 2025 |
7.84% |
|
| Bar Chart Closing [Text Block] |
During the periods shown in the bar chart above, the Fund’s highest quarterly return was 3.64% (quarter ended September 30, 2024) and the Fund’s lowest quarterly return was -1.94% (quarter ended December 31, 2024). The calendar year-to-date total return of the Fund as of September 30, 2026 was (3.27)%.
|
| Year to Date Return, Label [Optional Text] |
year-to-date total return
|
| Bar Chart, Year to Date Return |
(3.27%)
|
| Bar Chart, Year to Date Return, Date |
Sep. 30, 2026
|
| Highest Quarterly Return, Label [Optional Text] |
highest quarterly return
|
| Highest Quarterly Return |
3.64%
|
| Highest Quarterly Return, Date |
Sep. 30, 2024
|
| Lowest Quarterly Return, Label [Optional Text] |
lowest quarterly return
|
| Lowest Quarterly Return |
(1.94%)
|
| Lowest Quarterly Return, Date |
Dec. 31, 2024
|
| Performance Table Heading |
Average Annual Total Returns for the Periods Ended December 31, 2025
|
| Performance Table Uses Highest Federal Rate |
After-tax returns are calculated using the historical highest individual federal marginal income tax rates during the period covered by the table above and do not reflect the impact of state and local taxes.
|
| Performance Table Not Relevant to Tax Deferred |
Actual after-tax returns depend on an investor’s tax situation and may differ from those shown. After-tax returns shown are not relevant to investors who hold shares through tax-advantaged arrangements, such as 401(k) plans or individual retirement accounts.
|
| Performance [Table] |
| |
|
1 Year |
|
|
Since
Inception
(11/06/23) |
|
| Return Before Taxes |
|
|
7.84 |
% |
|
|
6.39 |
% |
| Return After Taxes on Distributions |
|
|
5.22 |
% |
|
|
3.91 |
% |
| Return After Taxes on Distributions and Sale of Fund Shares |
|
|
4.59 |
% |
|
|
3.82 |
% |
| Bloomberg U.S. Aggregate Bond Index (reflects no deduction for fees, expenses or taxes) |
|
|
7.30 |
% |
|
|
7.05 |
% |
| Bloomberg U.S. Mortgage Backed Securities Index (reflects no deduction for fees, expenses or taxes) |
|
|
8.58 |
% |
|
|
7.88 |
% |
|
| Index No Deduction for Fees, Expenses, or Taxes [Text] |
reflects no deduction for fees, expenses or taxes
|
| Performance Table Closing [Text Block] |
After-tax returns are calculated using the historical highest individual federal marginal income tax rates during the period covered by the table above and do not reflect the impact of state and local taxes. Actual after-tax returns depend on an investor’s tax situation and may differ from those shown. After-tax returns shown are not relevant to investors who hold shares through tax-advantaged arrangements, such as 401(k) plans or individual retirement accounts.
|
| Performance Availability Website Address [Text] |
www.simplify.us/etfs
|
| Performance Availability Phone [Text] |
1 (855) 772-8488
|
| Simplify Multi-QIS Alternative ETF |
|
| Prospectus [Line Items] |
|
| Performance Narrative [Text Block] |
Performance: The following performance information provides some indication of the risks of investing in the Fund. The bar chart shows the Fund’s performance from year to year. The table shows how the Fund’s average annual total returns compare with those of a broad-based securities market index and an additional index. The additional index represents short-term Treasury bills and is included as a performance benchmark reflecting the cash-equivalent baseline that aligns with the Fund’s quantitative investment strategy. The Fund’s past performance (before and after taxes) is not necessarily an indication of how the Fund will perform in the future. Updated performance information is available at no cost by visiting www.simplify.us/etfs or by calling 1 (855) 772-8488.
|
| Performance Past Does Not Indicate Future [Text] |
The Fund’s past performance (before and after taxes) is not necessarily an indication of how the Fund will perform in the future.
|
| Performance Information Illustrates Variability of Returns [Text] |
The following performance information provides some indication of the risks of investing in the Fund. The bar chart shows the Fund’s performance from year to year. The table shows how the Fund’s average annual total returns compare with those of a broad-based securities market index and an additional index. The additional index represents short-term Treasury bills and is included as a performance benchmark reflecting the cash-equivalent baseline that aligns with the Fund’s quantitative investment strategy.
|
| Bar Chart [Table] |
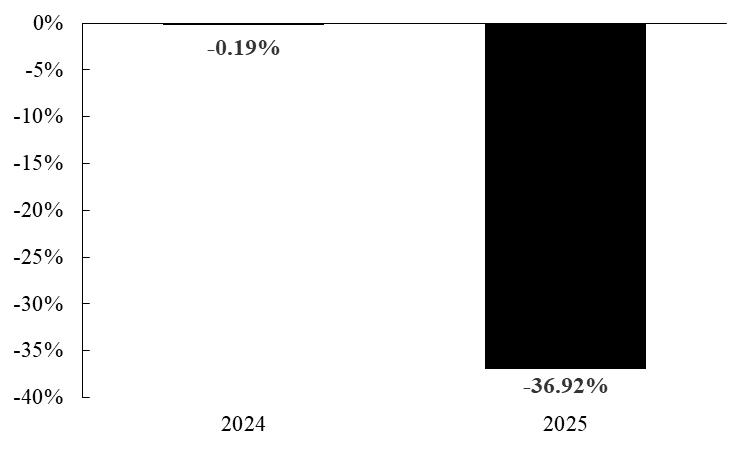
| Years |
Returns |
| 2024 |
-0.19% |
| 2025 |
-36.92% |
|
| Bar Chart Closing [Text Block] |
During the periods shown in the bar chart above, the Fund’s highest quarterly return was 2.04% (quarter ended March 31, 2024) and the Fund’s lowest quarterly return was -21.45% (quarter ended December 31, 2025). The calendar year-to-date total return of the Fund as of September 30, 2026 was (24.70)%.
|
| Year to Date Return, Label [Optional Text] |
year-to-date total return
|
| Bar Chart, Year to Date Return |
(24.70%)
|
| Bar Chart, Year to Date Return, Date |
Sep. 30, 2026
|
| Highest Quarterly Return, Label [Optional Text] |
highest quarterly return
|
| Highest Quarterly Return |
2.04%
|
| Highest Quarterly Return, Date |
Mar. 31, 2024
|
| Lowest Quarterly Return, Label [Optional Text] |
lowest quarterly return
|
| Lowest Quarterly Return |
(21.45%)
|
| Lowest Quarterly Return, Date |
Dec. 31, 2025
|
| Performance Table Heading |
Average Annual Total Returns for the Periods Ended December 31, 2025
|
| Performance Table Uses Highest Federal Rate |
After-tax returns are calculated using the historical highest individual federal marginal income tax rates during the period covered by the table above and do not reflect the impact of state and local taxes.
|
| Performance Table Not Relevant to Tax Deferred |
Actual after-tax returns depend on an investor’s tax situation and may differ from those shown. After-tax returns shown are not relevant to investors who hold shares through tax-advantaged arrangements, such as 401(k) plans or individual retirement accounts.
|
| Performance [Table] |
| |
|
1 Year |
|
|
Since
Inception
(7/10/23) |
|
| Return Before Taxes |
|
|
-36.92 |
% |
|
|
-16.25 |
% |
| Return After Taxes on Distributions |
|
|
-37.50 |
% |
|
|
-17.15 |
% |
| Return After Taxes on Distributions and Sale of Fund Shares |
|
|
-21.70 |
% |
|
|
-12.13 |
% |
| Bloomberg U.S. Aggregate Bond Index (reflects no deduction for fees, expenses or taxes) |
|
|
7.30 |
% |
|
|
5.20 |
% |
| ICE BofA 3 Month US Treasury Bill Index (reflects no deduction for fees, expenses or taxes) |
|
|
4.18 |
% |
|
|
4.86 |
% |
|
| Index No Deduction for Fees, Expenses, or Taxes [Text] |
reflects no deduction for fees, expenses or taxes
|
| Performance Table Closing [Text Block] |
After-tax returns are calculated using the historical highest individual federal marginal income tax rates during the period covered by the table above and do not reflect the impact of state and local taxes. Actual after-tax returns depend on an investor’s tax situation and may differ from those shown. After-tax returns shown are not relevant to investors who hold shares through tax-advantaged arrangements, such as 401(k) plans or individual retirement accounts.
|
| Performance Availability Website Address [Text] |
www.simplify.us/etfs
|
| Performance Availability Phone [Text] |
1 (855) 772-8488
|
| Simplify Short Term Treasury Futures Strategy ETF |
|
| Prospectus [Line Items] |
|
| Performance Narrative [Text Block] |
Performance: The following performance information provides some indication of the risks of investing in the Fund. The bar chart shows changes in the Fund’s performance from year to year. The table shows how the Fund’s average annual total returns compare to those of a broad-based securities market index and an additional index. The additional index tracks intermediate-maturity U.S. Treasury bonds and is included as a performance benchmark that provides yield curve context for the Fund’s short-term Treasury futures strategy. The Fund’s past performance (before and after taxes) is not necessarily an indication of how the Fund will perform in the future. Updated performance information is available at no cost by visiting www.simplify.us/etfs or by calling 1 (855) 772-8488.
|
| Performance Past Does Not Indicate Future [Text] |
The Fund’s past performance (before and after taxes) is not necessarily an indication of how the Fund will perform in the future.
|
| Performance Information Illustrates Variability of Returns [Text] |
The following performance information provides some indication of the risks of investing in the Fund. The bar chart shows changes in the Fund’s performance from year to year. The table shows how the Fund’s average annual total returns compare to those of a broad-based securities market index and an additional index.
|
| Bar Chart [Table] |
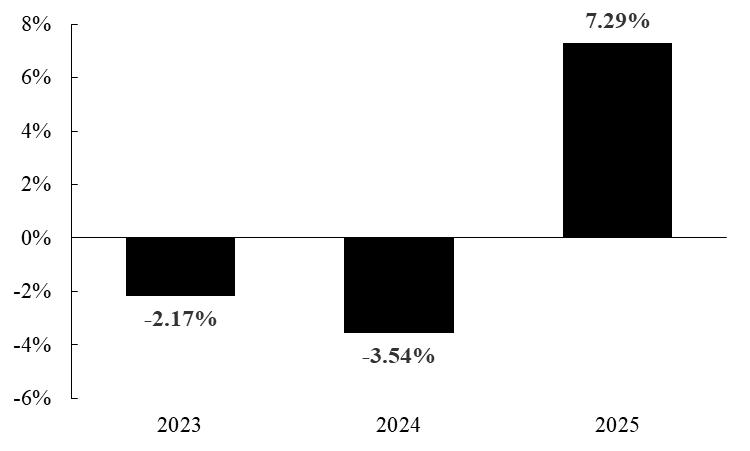
| Years |
Returns |
| 2023 |
-2.17% |
| 2024 |
-3.54% |
| 2025 |
7.29% |
|
| Bar Chart Closing [Text Block] |
During the periods shown in the bar chart above, the Fund’s highest quarterly return was 9.10% (quarter ended September 30, 2024) and the Fund’s lowest quarterly return was -9.39% (quarter ended June 30, 2023). The calendar year-to-date total return of the Fund as of September 30, 2026 was (11.34)%.
|
| Year to Date Return, Label [Optional Text] |
year-to-date total return
|
| Bar Chart, Year to Date Return |
(11.34%)
|
| Bar Chart, Year to Date Return, Date |
Sep. 30, 2026
|
| Highest Quarterly Return, Label [Optional Text] |
highest quarterly return
|
| Highest Quarterly Return |
9.10%
|
| Highest Quarterly Return, Date |
Sep. 30, 2024
|
| Lowest Quarterly Return, Label [Optional Text] |
lowest quarterly return
|
| Lowest Quarterly Return |
(9.39%)
|
| Lowest Quarterly Return, Date |
Jun. 30, 2023
|
| Performance Table Heading |
Average Annual Total Returns for the Periods Ended December 31, 2025
|
| Performance Table Uses Highest Federal Rate |
After-tax returns are calculated using the historical highest individual federal marginal income tax rates during the period covered by the table above and do not reflect the impact of state and local taxes.
|
| Performance Table Not Relevant to Tax Deferred |
Actual after-tax returns depend on an investor’s tax situation and may differ from those shown. After-tax returns shown are not relevant to investors who hold shares through tax-advantaged arrangements, such as 401(k) plans or individual retirement accounts.
|
| Performance [Table] |
| |
|
1 Year |
|
|
Since
Inception
(11/14/22) |
|
| Return Before Taxes |
|
|
7.29 |
% |
|
|
0.20 |
% |
| Return After Taxes on Distributions |
|
|
5.62 |
% |
|
|
-1.58 |
% |
| Return After Taxes on Distributions and Sale of Fund Shares |
|
|
4.29 |
% |
|
|
-0.61 |
% |
| Bloomberg U.S. Aggregate Bond Index (reflects no deduction for fees, expenses or taxes) |
|
|
7.30 |
% |
|
|
4.95 |
% |
| ICE US Treasury 7-10 Year Bond Index (reflects no deduction for fees, expenses or taxes) |
|
|
8.20 |
% |
|
|
3.73 |
% |
|
| Index No Deduction for Fees, Expenses, or Taxes [Text] |
reflects no deduction for fees, expenses or taxes
|
| Performance Table Closing [Text Block] |
After-tax returns are calculated using the historical highest individual federal marginal income tax rates during the period covered by the table above and do not reflect the impact of state and local taxes. Actual after-tax returns depend on an investor’s tax situation and may differ from those shown. After-tax returns shown are not relevant to investors who hold shares through tax-advantaged arrangements, such as 401(k) plans or individual retirement accounts.
|
| Performance Availability Website Address [Text] |
www.simplify.us/etfs
|
| Performance Availability Phone [Text] |
1 (855) 772-8488
|
| Simplify Target 15 Distribution ETF |
|
| Prospectus [Line Items] |
|
| Performance Narrative [Text Block] |
Performance: Performance information will be available in the prospectus after the Fund has been in operation for one full calendar year. Past performance is not necessarily an indication of how the Fund will perform in the future. Updated performance information will be available at no cost by visiting www.simplify.us or by calling 1 (855) 772-8488.
|
| Performance Past Does Not Indicate Future [Text] |
Past performance is not necessarily an indication of how the Fund will perform in the future.
|
| Performance One Year or Less [Text] |
Performance information will be available in the prospectus after the Fund has been in operation for one full calendar year.
|
| Performance Availability Website Address [Text] |
www.simplify.us
|
| Performance Availability Phone [Text] |
1 (855) 772-8488
|
| Simplify Treasury Option Income ETF |
|
| Prospectus [Line Items] |
|
| Performance Narrative [Text Block] |
Performance: The following performance information provides some indication of the risks of investing in the Fund. The bar chart shows changes in the Fund’s performance from year to year. The table shows how the Fund’s average annual total returns compare to those of a broad-based securities market index and two additional indices. The Bloomberg 1-3 Month U.S. Treasury Bill Index represents short-duration Treasury bills and is included as a performance benchmark that reflects the cash-like baseline aligned with the Fund’s option-income profile. The ICE BofA 3 Month US Treasury Bill Index tracks short-term Treasury bills and is included as a performance benchmark providing a risk-free reference point for the Fund’s Treasury option income strategy. The Fund’s past performance (before and after taxes) is not necessarily an indication of how the Fund will perform in the future. Updated performance information is available at no cost by visiting www.simplify.us/etfs or by calling 1 (855) 772-8488.
|
| Performance Past Does Not Indicate Future [Text] |
The Fund’s past performance (before and after taxes) is not necessarily an indication of how the Fund will perform in the future.
|
| Performance Information Illustrates Variability of Returns [Text] |
The following performance information provides some indication of the risks of investing in the Fund. The bar chart shows changes in the Fund’s performance from year to year. The table shows how the Fund’s average annual total returns compare to those of a broad-based securities market index and two additional indices.
|
| Bar Chart [Table] |
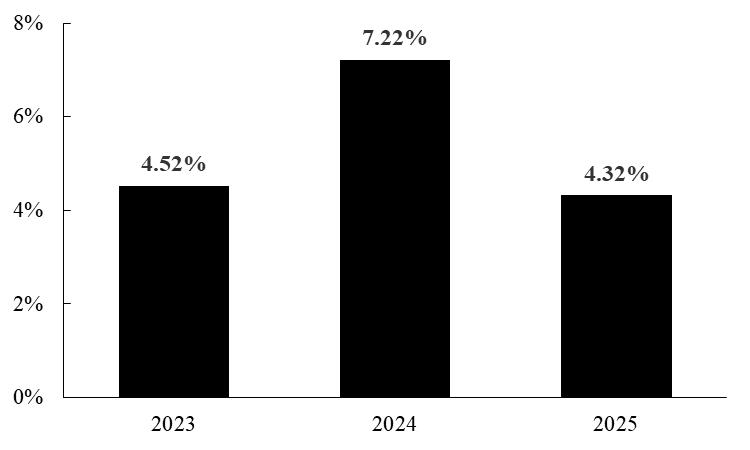
| Years |
Returns |
| 2023 |
4.52% |
| 2024 |
7.22% |
| 2025 |
4.32% |
|
| Bar Chart Closing [Text Block] |
During the periods shown in the bar chart above, the Fund’s highest quarterly return was 3.31% (quarter ended March 31, 2024) and the Fund’s lowest quarterly return was -2.11% (quarter ended June 30, 2025). The calendar year-to-date total return of the Fund as of September 30, 2026 was 2.37%.
|
| Year to Date Return, Label [Optional Text] |
year-to-date total return
|
| Bar Chart, Year to Date Return |
2.37%
|
| Bar Chart, Year to Date Return, Date |
Sep. 30, 2026
|
| Highest Quarterly Return, Label [Optional Text] |
highest quarterly return
|
| Highest Quarterly Return |
3.31%
|
| Highest Quarterly Return, Date |
Mar. 31, 2024
|
| Lowest Quarterly Return, Label [Optional Text] |
lowest quarterly return
|
| Lowest Quarterly Return |
(2.11%)
|
| Lowest Quarterly Return, Date |
Jun. 30, 2025
|
| Performance Table Heading |
Average Annual Total Returns for the Periods Ended December 31, 2025
|
| Performance Table Uses Highest Federal Rate |
After-tax returns are calculated using the historical highest individual federal marginal income tax rates during the period covered by the table above and do not reflect the impact of state and local taxes.
|
| Performance Table Not Relevant to Tax Deferred |
Actual after-tax returns depend on an investor’s tax situation and may differ from those shown. After-tax returns shown are not relevant to investors who hold shares through tax-advantaged arrangements, such as 401(k) plans or individual retirement accounts.
|
| Performance [Table] |
| |
|
1 Year |
|
|
Since
Inception
(10/27/22) |
|
| Return Before Taxes |
|
|
4.32 |
% |
|
|
5.29 |
% |
| Return After Taxes on Distributions |
|
|
1.17 |
% |
|
|
2.43 |
% |
| Return After Taxes on Distributions and Sale of Fund Shares |
|
|
2.51 |
% |
|
|
2.83 |
% |
| Bloomberg U.S. Aggregate Bond Index (reflects no deduction for fees, expenses or taxes) |
|
|
7.30 |
% |
|
|
5.22 |
% |
| Bloomberg 1-3 Month U.S. Treasury Bill Index (reflects no deduction for fees, expenses or taxes) |
|
|
4.20 |
% |
|
|
4.86 |
% |
| ICE BofA 3 Month US Treasury Bill Index (reflects no deduction for fees, expenses or taxes) |
|
|
4.18 |
% |
|
|
4.77 |
% |
|
| Index No Deduction for Fees, Expenses, or Taxes [Text] |
reflects no deduction for fees, expenses or taxes
|
| Performance Table Closing [Text Block] |
After-tax returns are calculated using the historical highest individual federal marginal income tax rates during the period covered by the table above and do not reflect the impact of state and local taxes. Actual after-tax returns depend on an investor’s tax situation and may differ from those shown. After-tax returns shown are not relevant to investors who hold shares through tax-advantaged arrangements, such as 401(k) plans or individual retirement accounts.
|
| Performance Availability Website Address [Text] |
www.simplify.us/etfs
|
| Performance Availability Phone [Text] |
1 (855) 772-8488
|
| Simplify US Equity Plus Bitcoin Strategy ETF |
|
| Prospectus [Line Items] |
|
| Performance Narrative [Text Block] |
Performance: The following performance information provides some indication of the risks of investing in the Fund. The bar chart shows changes in the Fund’s performance from year to year. The table shows how the Fund’s average annual total returns compare to those of a broad-based securities market index. The Fund’s past performance (before and after taxes) is not necessarily an indication of how the Fund will perform in the future. Updated performance information is available at no cost by visiting www.simplify.us/etfs or by calling 1 (855) 772-8488.
|
| Performance Past Does Not Indicate Future [Text] |
The Fund’s past performance (before and after taxes) is not necessarily an indication of how the Fund will perform in the future.
|
| Performance Information Illustrates Variability of Returns [Text] |
The following performance information provides some indication of the risks of investing in the Fund. The bar chart shows changes in the Fund’s performance from year to year. The table shows how the Fund’s average annual total returns compare to those of a broad-based securities market index.
|
| Bar Chart [Table] |
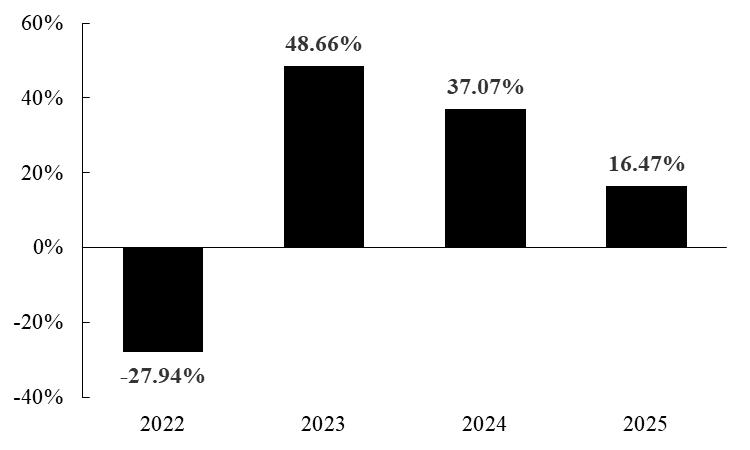
| Years |
Returns |
| 2022 |
-27.94% |
| 2023 |
48.66% |
| 2024 |
37.07% |
| 2025 |
16.47% |
|
| Bar Chart Closing [Text Block] |
During the periods shown in the bar chart above, the Fund’s highest quarterly return was 19.38% (quarter ended December 31, 2023) and the Fund’s lowest quarterly return was -22.63% (quarter ended June 30, 2022). The calendar year-to-date total return of the Fund as of September 30, 2026 was 12.68%.
|
| Year to Date Return, Label [Optional Text] |
year-to-date total return
|
| Bar Chart, Year to Date Return |
12.68%
|
| Bar Chart, Year to Date Return, Date |
Sep. 30, 2026
|
| Highest Quarterly Return, Label [Optional Text] |
highest quarterly return
|
| Highest Quarterly Return |
19.38%
|
| Highest Quarterly Return, Date |
Dec. 31, 2023
|
| Lowest Quarterly Return, Label [Optional Text] |
lowest quarterly return
|
| Lowest Quarterly Return |
(22.63%)
|
| Lowest Quarterly Return, Date |
Jun. 30, 2022
|
| Performance Table Heading |
Average Annual Total Returns for the Periods Ended December 31, 2025
|
| Performance Table Uses Highest Federal Rate |
After-tax returns are calculated using the historical highest individual federal marginal income tax rates during the period covered by the table above and do not reflect the impact of state and local taxes.
|
| Performance Table Not Relevant to Tax Deferred |
Actual after-tax returns depend on an investor’s tax situation and may differ from those shown. After-tax returns shown are not relevant to investors who hold shares through tax-advantaged arrangements, such as 401(k) plans or individual retirement accounts.
|
| Performance [Table] |
| |
|
1 Year |
|
|
Since
Inception
(5/24/21) |
|
| Return Before Taxes |
|
|
16.47 |
% |
|
|
15.70 |
% |
| Return After Taxes on Distributions |
|
|
16.04 |
% |
|
|
14.85 |
% |
| Return After Taxes on Distributions and Sale of Fund Shares |
|
|
9.73 |
% |
|
|
12.13 |
% |
| S&P 500 Index (reflects no deduction for fees, expenses or taxes) |
|
|
17.88 |
% |
|
|
12.85 |
% |
|
| Index No Deduction for Fees, Expenses, or Taxes [Text] |
reflects no deduction for fees, expenses or taxes
|
| Performance Table Closing [Text Block] |
After-tax returns are calculated using the historical highest individual federal marginal income tax rates during the period covered by the table above and do not reflect the impact of state and local taxes. Actual after-tax returns depend on an investor’s tax situation and may differ from those shown. After-tax returns shown are not relevant to investors who hold shares through tax-advantaged arrangements, such as 401(k) plans or individual retirement accounts.
|
| Performance Availability Website Address [Text] |
www.simplify.us/etfs
|
| Performance Availability Phone [Text] |
1 (855) 772-8488
|
| Simplify US Equity PLUS Convexity ETF |
|
| Prospectus [Line Items] |
|
| Performance Narrative [Text Block] |
Performance: The following performance information provides some indication of the risks of investing in the Fund. The bar chart shows changes in the Fund’s performance from year to year. The table shows how the Fund’s average annual total returns compare to those of a broad-based securities market index. The Fund’s past performance (before and after taxes) is not necessarily an indication of how the Fund will perform in the future. Updated performance information is available at no cost by visiting www.simplify.us/etfs or by calling 1 (855) 772-8488.
|
| Performance Past Does Not Indicate Future [Text] |
The Fund’s past performance (before and after taxes) is not necessarily an indication of how the Fund will perform in the future.
|
| Performance Information Illustrates Variability of Returns [Text] |
The following performance information provides some indication of the risks of investing in the Fund. The bar chart shows changes in the Fund’s performance from year to year. The table shows how the Fund’s average annual total returns compare to those of a broad-based securities market index.
|
| Bar Chart [Table] |
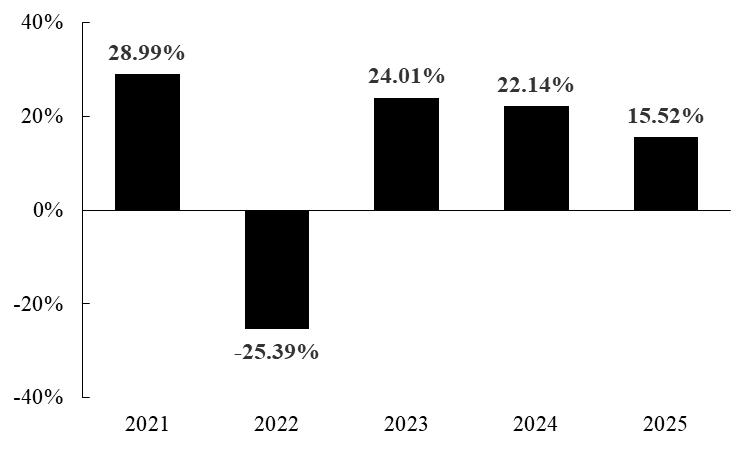
| Years |
Returns |
| 2021 |
28.99% |
| 2022 |
-25.39% |
| 2023 |
24.01% |
| 2024 |
22.14% |
| 2025 |
15.52% |
|
| Bar Chart Closing [Text Block] |
During the periods shown in the bar chart above, the Fund’s highest quarterly return was 19.80% (quarter ended June 30, 2025) and the Fund’s lowest quarterly return was -16.24% (quarter ended June 30, 2022). The calendar year-to-date total return of the Fund as of September 30, 2026 was 7.43%.
|
| Year to Date Return, Label [Optional Text] |
year-to-date
|
| Bar Chart, Year to Date Return |
7.43%
|
| Bar Chart, Year to Date Return, Date |
Sep. 30, 2026
|
| Highest Quarterly Return, Label [Optional Text] |
highest quarterly return
|
| Highest Quarterly Return |
19.80%
|
| Highest Quarterly Return, Date |
Jun. 30, 2025
|
| Lowest Quarterly Return, Label [Optional Text] |
lowest quarterly return
|
| Lowest Quarterly Return |
(16.24%)
|
| Lowest Quarterly Return, Date |
Jun. 30, 2022
|
| Performance Table Heading |
Average Annual Total Returns for the Periods Ended December 31, 2025
|
| Performance Table Uses Highest Federal Rate |
After-tax returns are calculated using the historical highest individual federal marginal income tax rates during the period covered by the table above and do not reflect the impact of state and local taxes.
|
| Performance Table Not Relevant to Tax Deferred |
Actual after-tax returns depend on an investor’s tax situation and may differ from those shown. After-tax returns shown are not relevant to investors who hold shares through tax-advantaged arrangements, such as 401(k) plans or individual retirement accounts.
|
| Performance [Table] |
| |
|
1 Year |
|
|
5 Years |
|
|
Since
Inception
(9/3/20) |
|
| Return Before Taxes |
|
|
15.52 |
% |
|
|
13.65 |
% |
|
|
11.95 |
% |
| Return After Taxes on Distributions |
|
|
15.07 |
% |
|
|
10.73 |
% |
|
|
11.48 |
% |
| Return After Taxes on Distributions and Sale of Fund Shares |
|
|
9.17 |
% |
|
|
9.87 |
% |
|
|
9.36 |
% |
| S&P 500 Index (reflects no deduction for fees, expenses or taxes) |
|
|
17.88 |
% |
|
|
14.42 |
% |
|
|
15.39 |
% |
|
| Index No Deduction for Fees, Expenses, or Taxes [Text] |
reflects no deduction for fees, expenses or taxes
|
| Performance Table Closing [Text Block] |
After-tax returns are calculated using the historical highest individual federal marginal income tax rates during the period covered by the table above and do not reflect the impact of state and local taxes. Actual after-tax returns depend on an investor’s tax situation and may differ from those shown. After-tax returns shown are not relevant to investors who hold shares through tax-advantaged arrangements, such as 401(k) plans or individual retirement accounts.
|
| Performance Availability Website Address [Text] |
www.simplify.us/etfs
|
| Performance Availability Phone [Text] |
1 (855) 772-8488
|
| Simplify US Equity PLUS Downside Convexity ETF |
|
| Prospectus [Line Items] |
|
| Performance Narrative [Text Block] |
Performance: The following performance information provides some indication of the risks of investing in the Fund. The bar chart shows changes in the Fund’s performance from year to year. The table shows how the Fund’s average annual total returns compare to those of a broad-based securities market index. The Fund’s past performance (before and after taxes) is not necessarily an indication of how the Fund will perform in the future. Updated performance information is available at no cost by visiting www.simplify.us/etfs or by calling 1 (855) 772-8488.
|
| Performance Past Does Not Indicate Future [Text] |
The Fund’s past performance (before and after taxes) is not necessarily an indication of how the Fund will perform in the future.
|
| Performance Information Illustrates Variability of Returns [Text] |
The following performance information provides some indication of the risks of investing in the Fund. The bar chart shows changes in the Fund’s performance from year to year. The table shows how the Fund’s average annual total returns compare to those of a broad-based securities market index.
|
| Bar Chart [Table] |
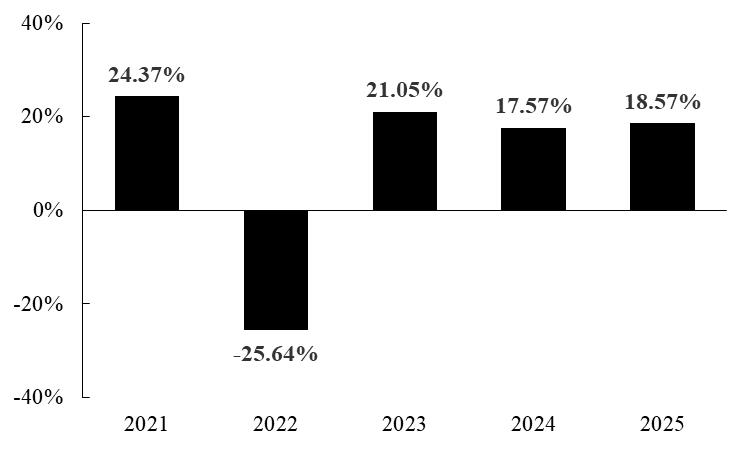
| Years |
Returns |
| 2021 |
24.37% |
| 2022 |
-25.64% |
| 2023 |
21.05% |
| 2024 |
17.57% |
| 2025 |
18.57% |
|
| Bar Chart Closing [Text Block] |
During the periods shown in the bar chart above, the Fund’s highest quarterly return was 19.80% (quarter ended June 30, 2025) and the Fund’s lowest quarterly return was -14.61% (quarter ended June 30, 2022). The calendar year-to-date total return of the Fund as of September 30, 2026 was 6.92%.
|
| Year to Date Return, Label [Optional Text] |
year-to-date total return
|
| Bar Chart, Year to Date Return |
6.92%
|
| Bar Chart, Year to Date Return, Date |
Sep. 30, 2026
|
| Highest Quarterly Return, Label [Optional Text] |
highest quarterly return
|
| Highest Quarterly Return |
19.80%
|
| Highest Quarterly Return, Date |
Jun. 30, 2025
|
| Lowest Quarterly Return, Label [Optional Text] |
lowest quarterly return
|
| Lowest Quarterly Return |
(14.61%)
|
| Lowest Quarterly Return, Date |
Jun. 30, 2022
|
| Performance Table Heading |
Average Annual Total Returns for the Periods Ended December 31, 2025
|
| Performance Table Uses Highest Federal Rate |
After-tax returns are calculated using the historical highest individual federal marginal income tax rates during the period covered by the table above and do not reflect the impact of state and local taxes.
|
| Performance Table Not Relevant to Tax Deferred |
Actual after-tax returns depend on an investor’s tax situation and may differ from those shown. After-tax returns shown are not relevant to investors who hold shares through tax-advantaged arrangements, such as 401(k) plans or individual retirement accounts.
|
| Performance [Table] |
| |
|
1 Year |
|
|
5 Years |
|
|
Since
Inception
(9/3/20) |
|
| Return Before Taxes |
|
|
18.57 |
% |
|
|
9.31 |
% |
|
|
10.29 |
% |
| Return After Taxes on Distributions |
|
|
18.07 |
% |
|
|
8.81 |
% |
|
|
9.79 |
% |
| Return After Taxes on Distributions and Sale of Fund Shares |
|
|
10.97 |
% |
|
|
7.14 |
% |
|
|
7.97 |
% |
| S&P 500 Index (reflects no deduction for fees, expenses or taxes) |
|
|
17.88 |
% |
|
|
14.42 |
% |
|
|
15.39 |
% |
|
| Index No Deduction for Fees, Expenses, or Taxes [Text] |
reflects no deduction for fees, expenses or taxes
|
| Performance Table Closing [Text Block] |
After-tax returns are calculated using the historical highest individual federal marginal income tax rates during the period covered by the table above and do not reflect the impact of state and local taxes. Actual after-tax returns depend on an investor’s tax situation and may differ from those shown. After-tax returns shown are not relevant to investors who hold shares through tax-advantaged arrangements, such as 401(k) plans or individual retirement accounts.
|
| Performance Availability Website Address [Text] |
www.simplify.us/etfs
|
| Performance Availability Phone [Text] |
1 (855) 772-8488
|
| Simplify US Equity PLUS Managed Futures Strategy ETF |
|
| Prospectus [Line Items] |
|
| Bar Chart and Performance Table [Heading] |
Performance: Performance information will be available in the prospectus after the Fund has been in operation for one full calendar year. Past performance is not necessarily an indication of how the Fund will perform in the future. Updated performance information will be available at no cost by visiting www.simplify.us or by calling 1 (855) 772-8488.
|
| Performance Past Does Not Indicate Future [Text] |
Past performance is not necessarily an indication of how the Fund will perform in the future.
|
| Performance One Year or Less [Text] |
Performance information will be available in the prospectus after the Fund has been in operation for one full calendar year.
|
| Performance Availability Website Address [Text] |
www.simplify.us
|
| Performance Availability Phone [Text] |
1 (855) 772-8488
|
| Simplify US Equity Income ETF |
|
| Prospectus [Line Items] |
|
| Performance Narrative [Text Block] |
Performance: The following performance information provides some indication of the risks of investing in the Fund. The bar chart shows changes in the Fund’s performance from year to year. The table shows how the Fund’s average annual total returns compare to those of a broad-based securities market index. The Fund’s past performance (before and after taxes) is not necessarily an indication of how the Fund will perform in the future. Updated performance information is available at no cost by visiting www.simplify.us/etfs or by calling 1 (855) 772-8488.
|
| Performance Past Does Not Indicate Future [Text] |
The Fund’s past performance (before and after taxes) is not necessarily an indication of how the Fund will perform in the future.
|
| Performance Information Illustrates Variability of Returns [Text] |
The following performance information provides some indication of the risks of investing in the Fund. The bar chart shows changes in the Fund’s performance from year to year. The table shows how the Fund’s average annual total returns compare to those of a broad-based securities market index.
|
| Bar Chart [Table] |
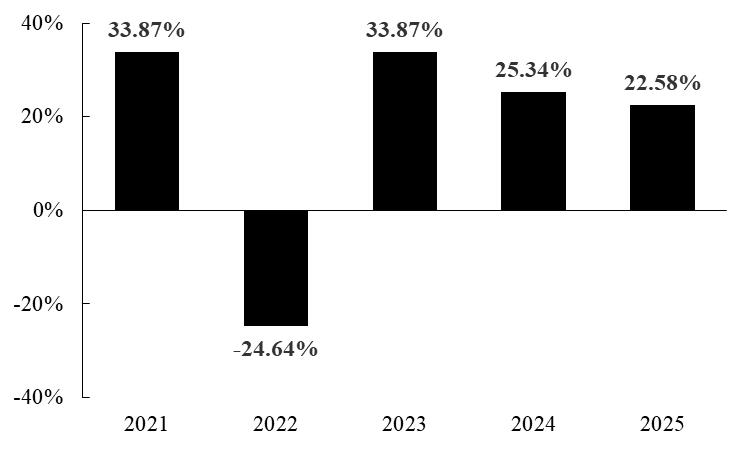
| Years |
Returns |
| 2021 |
33.87% |
| 2022 |
-24.64% |
| 2023 |
27.46% |
| 2024 |
25.34% |
| 2025 |
22.58% |
|
| Bar Chart Closing [Text Block] |
During the periods shown in the bar chart above, the Fund’s highest quarterly return was 18.68% (quarter ended March 31, 2024) and the Fund’s lowest quarterly return was -17.79% (quarter ended June 30, 2022). The calendar year-to-date total return of the Fund as of September 30, 2026 was 11.50%.
|
| Year to Date Return, Label [Optional Text] |
year-to-date total return
|
| Bar Chart, Year to Date Return |
11.50%
|
| Bar Chart, Year to Date Return, Date |
Sep. 30, 2026
|
| Highest Quarterly Return, Label [Optional Text] |
highest quarterly return
|
| Highest Quarterly Return |
18.68%
|
| Highest Quarterly Return, Date |
Mar. 31, 2024
|
| Lowest Quarterly Return, Label [Optional Text] |
lowest quarterly return
|
| Lowest Quarterly Return |
(17.79%)
|
| Lowest Quarterly Return, Date |
Jun. 30, 2022
|
| Performance Table Heading |
Average Annual Total Returns for the Periods Ended December 31, 2025
|
| Performance Table Uses Highest Federal Rate |
After-tax returns are calculated using the historical highest individual federal marginal income tax rates during the period covered by the table above and do not reflect the impact of state and local taxes.
|
| Performance Table Not Relevant to Tax Deferred |
Actual after-tax returns depend on an investor’s tax situation and may differ from those shown. After-tax returns shown are not relevant to investors who hold shares through tax-advantaged arrangements, such as 401(k) plans or individual retirement accounts.
|
| Performance [Table] |
| |
|
1 Year |
|
|
5 Years |
|
|
Since
Inception
(9/3/20) |
|
| Return Before Taxes |
|
|
22.58 |
% |
|
|
14.58 |
% |
|
|
15.44 |
% |
| Return After Taxes on Distributions |
|
|
19.47 |
% |
|
|
13.57 |
% |
|
|
14.41 |
% |
| Return After Taxes on Distributions and Sale of Fund Shares |
|
|
14.00 |
% |
|
|
11.36 |
% |
|
|
12.10 |
% |
| S&P 500 Index (reflects no deduction for fees, expenses or taxes) |
|
|
17.88 |
% |
|
|
14.42 |
% |
|
|
15.39 |
% |
|
| Index No Deduction for Fees, Expenses, or Taxes [Text] |
reflects no deduction for fees, expenses or taxes
|
| Performance Table Closing [Text Block] |
After-tax returns are calculated using the historical highest individual federal marginal income tax rates during the period covered by the table above and do not reflect the impact of state and local taxes. Actual after-tax returns depend on an investor’s tax situation and may differ from those shown. After-tax returns shown are not relevant to investors who hold shares through tax-advantaged arrangements, such as 401(k) plans or individual retirement accounts.
|
| Performance Availability Website Address [Text] |
www.simplify.us/etfs
|
| Performance Availability Phone [Text] |
1 (855) 772-8488
|
| Simplify Volatility Premium ETF |
|
| Prospectus [Line Items] |
|
| Performance Narrative [Text Block] |
Performance: The following performance information provides some indication of the risks of investing in the Fund. The bar chart shows changes in the Fund’s performance from year to year. The table shows how the Fund’s average annual total returns compare to those of a broad-based securities market index. The Fund’s past performance (before and after taxes) is not necessarily an indication of how the Fund will perform in the future. Updated performance information is available at no cost by visiting www.simplify.us/etfs or by calling 1 (855) 772-8488.
|
| Performance Past Does Not Indicate Future [Text] |
The Fund’s past performance (before and after taxes) is not necessarily an indication of how the Fund will perform in the future.
|
| Performance Information Illustrates Variability of Returns [Text] |
The following performance information provides some indication of the risks of investing in the Fund. The bar chart shows changes in the Fund’s performance from year to year. The table shows how the Fund’s average annual total returns compare to those of a broad-based securities market index.
|
| Bar Chart [Table] |
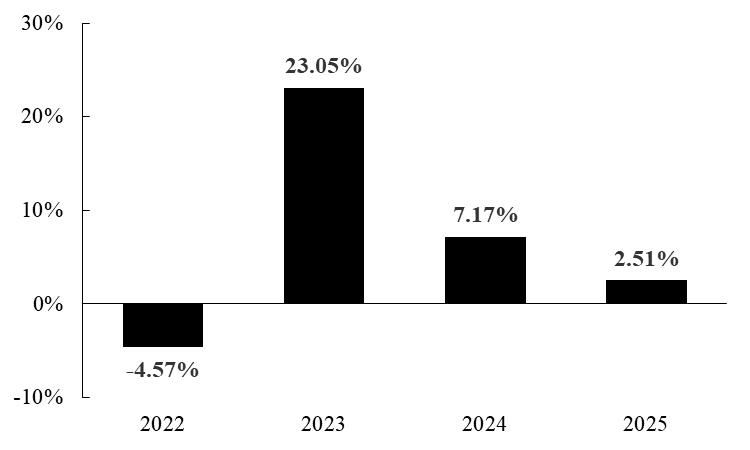
| Years |
Returns |
| 2022 |
-4.57% |
| 2023 |
23.05% |
| 2024 |
7.17% |
| 2025 |
2.51% |
|
| Bar Chart Closing [Text Block] |
During the periods shown in the bar chart above, the Fund’s highest quarterly return was 10.09% (quarter ended June 30, 2023) and the Fund’s lowest quarterly return was -9.21% (quarter ended March 31, 2025). The calendar year-to-date total return of the Fund as of September 30, 2026 was 8.04%.
|
| Year to Date Return, Label [Optional Text] |
year-to-date total return
|
| Bar Chart, Year to Date Return |
8.04%
|
| Bar Chart, Year to Date Return, Date |
Sep. 30, 2026
|
| Highest Quarterly Return, Label [Optional Text] |
highest quarterly return
|
| Highest Quarterly Return |
10.09%
|
| Highest Quarterly Return, Date |
Jun. 30, 2023
|
| Lowest Quarterly Return, Label [Optional Text] |
lowest quarterly return
|
| Lowest Quarterly Return |
(9.21%)
|
| Lowest Quarterly Return, Date |
Mar. 31, 2025
|
| Performance Table Heading |
Average Annual Total Returns for the Periods Ended December 31, 2025
|
| Performance Table Uses Highest Federal Rate |
After-tax returns are calculated using the historical highest individual federal marginal income tax rates during the period covered by the table above and do not reflect the impact of state and local taxes.
|
| Performance Table Not Relevant to Tax Deferred |
Actual after-tax returns depend on an investor’s tax situation and may differ from those shown. After-tax returns shown are not relevant to investors who hold shares through tax-advantaged arrangements, such as 401(k) plans or individual retirement accounts.
|
| Performance [Table] |
| |
|
1 Year |
|
|
Since
Inception
(5/12/21) |
|
| Return Before Taxes |
|
|
2.51 |
% |
|
|
8.74 |
% |
| Return After Taxes on Distributions |
|
|
-5.17 |
% |
|
|
2.72 |
% |
| Return After Taxes on Distributions and Sale of Fund Shares |
|
|
1.18 |
% |
|
|
4.08 |
% |
| S&P 500 TR Index (reflects no deduction for fees, expenses or taxes) |
|
|
17.88 |
% |
|
|
13.56 |
% |
|
| Index No Deduction for Fees, Expenses, or Taxes [Text] |
reflects no deduction for fees, expenses or taxes
|
| Performance Table Closing [Text Block] |
After-tax returns are calculated using the historical highest individual federal marginal income tax rates during the period covered by the table above and do not reflect the impact of state and local taxes. Actual after-tax returns depend on an investor’s tax situation and may differ from those shown. After-tax returns shown are not relevant to investors who hold shares through tax-advantaged arrangements, such as 401(k) plans or individual retirement accounts.
|
| Performance Availability Website Address [Text] |
www.simplify.us/etfs
|
| Performance Availability Phone [Text] |
1 (855) 772-8488
|
| Simplify Gamma Emerging Market Bond ETF |
|
| Prospectus [Line Items] |
|
| Performance Narrative [Text Block] |
Performance: The following performance information provides some indication of the risks of investing in the Fund. The bar chart shows changes in the Fund’s performance from year to year. The table shows how the Fund’s average annual total returns compare to those of a broad-based securities market index and an additional index. The additional index, J.P. Morgan EMBI Global Diversified Composite Index tracks liquid, US dollar emerging market fixed and floating-rate debt instruments issued by sovereign and quasi-sovereign entities. The Fund’s past performance (before and after taxes) is not necessarily an indication of how the Fund will perform in the future. Updated performance information is available at no cost by visiting www.simplify.us/etfs or by calling 1 (855) 772-8488.
|
| Performance Past Does Not Indicate Future [Text] |
The table shows how the Fund’s average annual total returns compare to those of a broad-based securities market index and an additional index. The additional index, J.P. Morgan EMBI Global Diversified Composite Index tracks liquid, US dollar emerging market fixed and floating-rate debt instruments issued by sovereign and quasi-sovereign entities.
|
| Performance One Year or Less [Text] |
The following performance information provides some indication of the risks of investing in the Fund. The bar chart shows changes in the Fund’s performance from year to year.
|
| Bar Chart [Table] |
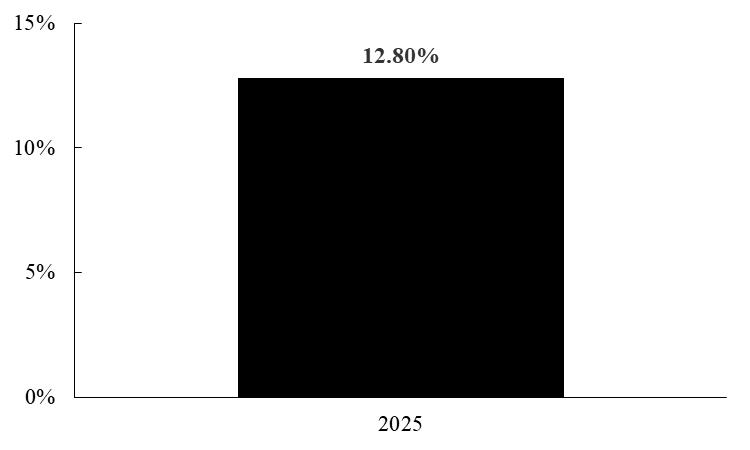
| Years |
Returns |
| 2025 |
12.80% |
|
| Bar Chart Closing [Text Block] |
During the periods shown in the bar chart above, the Fund’s highest quarterly return was 4.71% (quarter ended September 30, 2025) and the Fund’s lowest quarterly return was 1.84% (quarter ended March 31, 2025). The calendar year-to-date total return of the Fund as of September 30, 2026 was 0.89%.
|
| Year to Date Return, Label [Optional Text] |
year-to-date total return
|
| Bar Chart, Year to Date Return |
0.89%
|
| Bar Chart, Year to Date Return, Date |
Sep. 30, 2026
|
| Highest Quarterly Return, Label [Optional Text] |
highest quarterly return
|
| Highest Quarterly Return |
4.71%
|
| Highest Quarterly Return, Date |
Sep. 30, 2025
|
| Lowest Quarterly Return, Label [Optional Text] |
lowest quarterly return
|
| Lowest Quarterly Return |
1.84%
|
| Lowest Quarterly Return, Date |
Mar. 31, 2025
|
| Performance Table Heading |
Average Annual Total Returns for the Periods Ended December 31, 2025
|
| Performance Table Uses Highest Federal Rate |
After-tax returns are calculated using the historical highest individual federal marginal income tax rates during the period covered by the table above and do not reflect the impact of state and local taxes.
|
| Performance Table Not Relevant to Tax Deferred |
Actual after-tax returns depend on an investor’s tax situation and may differ from those shown. After-tax returns shown are not relevant to investors who hold shares through tax-advantaged arrangements, such as 401(k) plans or individual retirement accounts.
|
| Performance [Table] |
| |
|
1 Year |
|
|
Since
Inception
(8/12/24) |
|
| Return Before Taxes |
|
|
12.80 |
% |
|
|
12.17 |
% |
| Return After Taxes on Distributions |
|
|
10.14 |
% |
|
|
9.07 |
% |
| Return After Taxes on Distributions and Sale of Fund Shares |
|
|
7.50 |
% |
|
|
7.92 |
% |
| J.P. Morgan EMBI Global Core Index (USD) (reflects no deduction for fees, expenses or taxes) |
|
|
13.90 |
% |
|
|
10.93 |
% |
| J.P. Morgan EMBI Global Diversified Composite Index – 081224 (reflects no deduction for fees, expenses or taxes) |
|
|
14.35 |
% |
|
|
11.36 |
% |
|
| Index No Deduction for Fees, Expenses, or Taxes [Text] |
reflects no deduction for fees, expenses or taxes)
|
| Performance Table Closing [Text Block] |
After-tax returns are calculated using the historical highest individual federal marginal income tax rates during the period covered by the table above and do not reflect the impact of state and local taxes. Actual after-tax returns depend on an investor’s tax situation and may differ from those shown. After-tax returns shown are not relevant to investors who hold shares through tax-advantaged arrangements, such as 401(k) plans or individual retirement accounts.
|
| Performance Availability Website Address [Text] |
www.simplify.us/etfs
|
| Performance Availability Phone [Text] |
1 (855) 772-8488
|
| Simplify Kayne Anderson Energy and Infrastructure Credit ETF |
|
| Prospectus [Line Items] |
|
| Performance Narrative [Text Block] |
Performance: Performance information will be available in the prospectus after the Fund has been in operation for one full calendar year. Past performance is not necessarily an indication of how the Fund will perform in the future. Updated performance information will be available at no cost by visiting www.simplify.us or by calling 1 (855) 772-8488.
|
| Performance Past Does Not Indicate Future [Text] |
Past performance is not necessarily an indication of how the Fund will perform in the future.
|
| Performance One Year or Less [Text] |
Performance information will be available in the prospectus after the Fund has been in operation for one full calendar year.
|
| Performance Availability Website Address [Text] |
www.simplify.us
|
| Performance Availability Phone [Text] |
1 (855) 772-8488
|
| Simplify National Muni Bond ETF |
|
| Prospectus [Line Items] |
|
| Performance Narrative [Text Block] |
Performance: The following performance information provides some indication of the risks of investing in the Fund. The bar chart shows changes in the Fund’s performance from year to year. The table shows how the Fund’s average annual total returns compare to those of a broad-based securities market index and an additional index. The additional index represents the broad U.S. equity market and is included as a performance benchmark that provides equity exposure context for the Fund’s diversified income approach. The Fund’s past performance (before and after taxes) is not necessarily an indication of how the Fund will perform in the future. Updated performance information is available at no cost by visiting www.simplify.us/etfs or by calling 1 (855) 772-8488.
|
| Performance Past Does Not Indicate Future [Text] |
The Fund’s past performance (before and after taxes) is not necessarily an indication of how the Fund will perform in the future.
|
| Performance Information Illustrates Variability of Returns [Text] |
The following performance information provides some indication of the risks of investing in the Fund. The bar chart shows changes in the Fund’s performance from year to year. The table shows how the Fund’s average annual total returns compare to those of a broad-based securities market index and an additional index.
|
| Bar Chart [Table] |
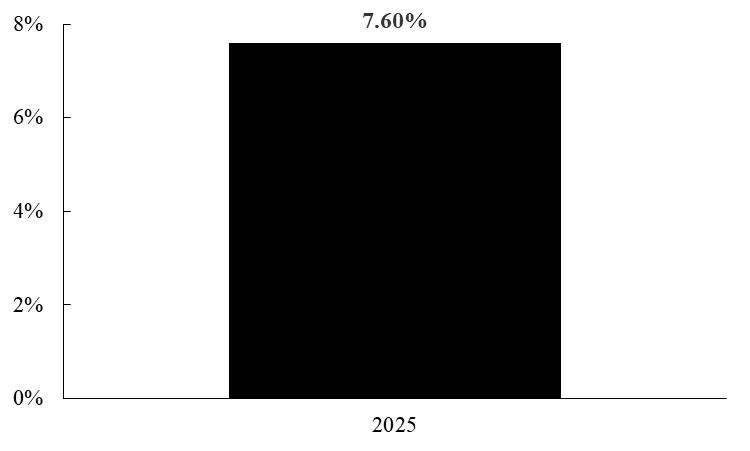
|
| Bar Chart Closing [Text Block] |
During the periods shown in the bar chart above, the Fund’s highest quarterly return was 10.66% (quarter ended June 30, 2025) and the Fund’s lowest quarterly return was -5.62% (quarter ended March 31, 2025). The calendar year-to-date total return of the Fund as of September 30, 2026 was -4.53%.
|
| Year to Date Return, Label [Optional Text] |
year-to-date total return
|
| Bar Chart, Year to Date Return |
(4.53%)
|
| Bar Chart, Year to Date Return, Date |
Sep. 30, 2026
|
| Highest Quarterly Return, Label [Optional Text] |
highest quarterly return
|
| Highest Quarterly Return |
10.66%
|
| Highest Quarterly Return, Date |
Jun. 30, 2025
|
| Lowest Quarterly Return, Label [Optional Text] |
lowest quarterly return
|
| Lowest Quarterly Return |
(5.62%)
|
| Lowest Quarterly Return, Date |
Mar. 31, 2025
|
| Performance Table Heading |
Average Annual Total Returns for the Periods Ended December 31, 2025
|
| Performance Table Uses Highest Federal Rate |
After-tax returns are calculated using the historical highest individual federal marginal income tax rates during the period covered by the table above and do not reflect the impact of state and local taxes.
|
| Performance Table Not Relevant to Tax Deferred |
Actual after-tax returns depend on an investor’s tax situation and may differ from those shown. After-tax returns shown are not relevant to investors who hold shares through tax-advantaged arrangements, such as 401(k) plans or individual retirement accounts.
|
| Performance [Table] |
| |
|
1 Year |
|
|
Since
Inception
(9/9/24) |
|
| Return Before Taxes |
|
|
7.60 |
% |
|
|
4.48 |
% |
| Return After Taxes on Distributions |
|
|
5.61 |
% |
|
|
2.65 |
% |
| Return After Taxes on Distributions and Sale of Fund Shares |
|
|
4.45 |
% |
|
|
2.61 |
% |
| S&P 500 TR Index (reflects no deductions for fees, expenses or taxes) |
|
|
17.88 |
% |
|
|
20.20 |
% |
| Bloomberg Municipal Bond Index (reflects no deductions for fees, expenses or taxes) |
|
|
4.25 |
% |
|
|
2.59 |
% |
|
| Index No Deduction for Fees, Expenses, or Taxes [Text] |
reflects no deductions for fees, expenses or taxes
|
| Performance Table Closing [Text Block] |
After-tax returns are calculated using the historical highest individual federal marginal income tax rates during the period covered by the table above and do not reflect the impact of state and local taxes. Actual after-tax returns depend on an investor’s tax situation and may differ from those shown. After-tax returns shown are not relevant to investors who hold shares through tax-advantaged arrangements, such as 401(k) plans or individual retirement accounts.
|
| Performance Availability Website Address [Text] |
www.simplify.us/etfs
|
| Performance Availability Phone [Text] |
1 (855) 772-8488
|
| Simplify Opportunistic Income ETF |
|
| Prospectus [Line Items] |
|
| Performance Narrative [Text Block] |
Performance: The following performance information provides some indication of the risks of investing in the Fund. The bar chart shows changes in the Fund’s performance from year to year. The table shows how the Fund’s average annual total returns compare to those of a broad-based securities market index and two additional indices. The Bloomberg U.S. Universal Total Return Index represents a broader U.S. bond market including investment-grade and high-yield corporate bonds, and is included as a performance benchmark relevant to the Fund’s opportunistic fixed-income approach. The ICE BofA US High Yield Index tracks U.S. high-yield corporate bonds and is included as a performance benchmark that reflects a key sector the Fund may emphasize within its credit strategy. The Fund’s past performance (before and after taxes) is not necessarily an indication of how the Fund will perform in the future. Updated performance information is available at no cost by visiting www.simplify.us/etfs or by calling 1 (855) 772-8488.
|
| Performance Past Does Not Indicate Future [Text] |
The Fund’s past performance (before and after taxes) is not necessarily an indication of how the Fund will perform in the future.
|
| Performance Information Illustrates Variability of Returns [Text] |
The following performance information provides some indication of the risks of investing in the Fund. The bar chart shows changes in the Fund’s performance from year to year. The table shows how the Fund’s average annual total returns compare to those of a broad-based securities market index and two additional indices.
|
| Bar Chart [Table] |
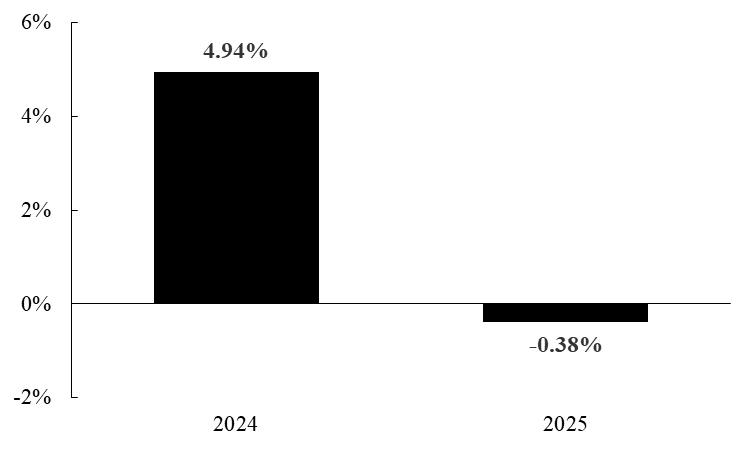
| Years |
Returns |
| 2024 |
4.94% |
| 2025 |
-0.38% |
|
| Bar Chart Closing [Text Block] |
During the periods shown in the bar chart above, the Fund’s highest quarterly return was 4.28% (quarter ended September 30, 2024) and the Fund’s lowest quarterly return was -4.94% (quarter ended June 30, 2025). The calendar year-to-date total return of the Fund as of September 30, 2026 was -7.11%.
|
| Year to Date Return, Label [Optional Text] |
year-to-date total return
|
| Bar Chart, Year to Date Return |
(7.11%)
|
| Bar Chart, Year to Date Return, Date |
Sep. 30, 2026
|
| Highest Quarterly Return, Label [Optional Text] |
highest quarterly return
|
| Highest Quarterly Return |
4.28%
|
| Highest Quarterly Return, Date |
Sep. 30, 2024
|
| Lowest Quarterly Return, Label [Optional Text] |
lowest quarterly return
|
| Lowest Quarterly Return |
(4.94%)
|
| Lowest Quarterly Return, Date |
Jun. 30, 2025
|
| Performance Table Heading |
Average Annual Total Returns for the Periods Ended December 31, 2025
|
| Performance Table Uses Highest Federal Rate |
After-tax returns are calculated using the historical highest individual federal marginal income tax rates during the period covered by the table above and do not reflect the impact of state and local taxes.
|
| Performance Table Not Relevant to Tax Deferred |
Actual after-tax returns depend on an investor’s tax situation and may differ from those shown. After-tax returns shown are not relevant to investors who hold shares through tax-advantaged arrangements, such as 401(k) plans or individual retirement accounts.
|
| Performance [Table] |
| |
|
1 Year |
|
|
Since
Inception
(3/27/23) |
|
| Return Before Taxes |
|
|
-0.38 |
% |
|
|
3.87 |
% |
| Return After Taxes on Distributions |
|
|
-3.07 |
% |
|
|
1.11 |
% |
| Return After Taxes on Distributions and Sale of Fund Shares |
|
|
-0.20 |
% |
|
|
1.81 |
% |
| Bloomberg U.S. Aggregate Bond Index (reflects no deduction for fees, expenses or taxes) |
|
|
7.30 |
% |
|
|
4.54 |
% |
| Bloomberg U.S. Universal Total Return Index (reflects no deduction for fees, expenses or taxes) |
|
|
7.56 |
% |
|
|
5.17 |
% |
| ICE BofA US High Yield Index (reflects no deduction for fees, expenses or taxes) |
|
|
8.50 |
% |
|
|
10.08 |
% |
|
| Index No Deduction for Fees, Expenses, or Taxes [Text] |
reflects no deduction for fees, expenses or taxes
|
| Performance Table Closing [Text Block] |
After-tax returns are calculated using the historical highest individual federal marginal income tax rates during the period covered by the table above and do not reflect the impact of state and local taxes. Actual after-tax returns depend on an investor’s tax situation and may differ from those shown. After-tax returns shown are not relevant to investors who hold shares through tax-advantaged arrangements, such as 401(k) plans or individual retirement accounts.
|
| Performance Availability Website Address [Text] |
www.simplify.us/etfs
|
| Performance Availability Phone [Text] |
1 (855) 772-8488
|
| Simplify Piper Sandler US Small-Cap PLUS Income ETF |
|
| Prospectus [Line Items] |
|
| Performance Narrative [Text Block] |
Performance: Performance information will be available in the prospectus after the Fund has been in operation for one full calendar year. Past performance is not necessarily an indication of how the Fund will perform in the future. Updated performance information will be available at no cost by visiting www.simplify.us or by calling 1 (855) 772-8488.
|
| Performance Past Does Not Indicate Future [Text] |
Past performance is not necessarily an indication of how the Fund will perform in the future.
|
| Performance One Year or Less [Text] |
Performance information will be available in the prospectus after the Fund has been in operation for one full calendar year.
|
| Performance Availability Website Address [Text] |
www.simplify.us
|
| Performance Availability Phone [Text] |
1 (855) 772-8488
|
| Simplify Propel Opportunities ETF |
|
| Prospectus [Line Items] |
|
| Performance Narrative [Text Block] |
Performance: The following performance information provides some indication of the risks of investing in the Fund. The bar chart shows changes in the Fund’s performance from year to year. The table shows how the Fund’s average annual total returns compare to those of a broad-based securities market index and an additional index. The additional index represents the broad U.S. equity market and is included as a performance benchmark that provides equity exposure context for the Fund’s diversified income approach. The Fund’s past performance (before and after taxes) is not necessarily an indication of how the Fund will perform in the future. Updated performance information is available at no cost by visiting www.simplify.us/etfs or by calling 1 (855) 772-8488.
|
| Performance Past Does Not Indicate Future [Text] |
The Fund’s past performance (before and after taxes) is not necessarily an indication of how the Fund will perform in the future.
|
| Performance Information Illustrates Variability of Returns [Text] |
The following performance information provides some indication of the risks of investing in the Fund. The bar chart shows changes in the Fund’s performance from year to year. The table shows how the Fund’s average annual total returns compare to those of a broad-based securities market index and an additional index.
|
| Bar Chart [Table] |
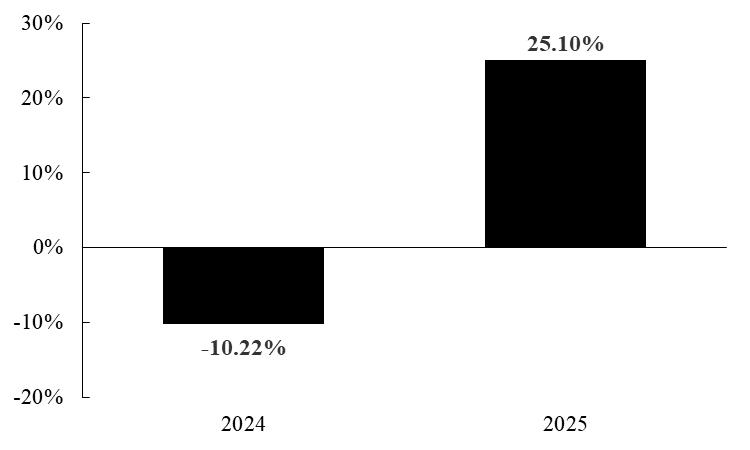
| Years |
Returns |
| 2024 |
-10.22% |
| 2025 |
25.10% |
|
| Bar Chart Closing [Text Block] |
During the periods shown in the bar chart above, the Fund’s highest quarterly return was 26.47% (quarter ended March 31, 2024) and the Fund’s lowest quarterly return was -29.82% (quarter ended December 31, 2024). The calendar year-to-date total return of the Fund as of September 30, 2026 was 17.77%.
|
| Year to Date Return, Label [Optional Text] |
year-to-date total return
|
| Bar Chart, Year to Date Return |
17.77%
|
| Bar Chart, Year to Date Return, Date |
Sep. 30, 2026
|
| Highest Quarterly Return, Label [Optional Text] |
highest quarterly return
|
| Highest Quarterly Return |
26.47%
|
| Highest Quarterly Return, Date |
Mar. 31, 2024
|
| Lowest Quarterly Return, Label [Optional Text] |
lowest quarterly return
|
| Lowest Quarterly Return |
(29.82%)
|
| Lowest Quarterly Return, Date |
Dec. 31, 2024
|
| Performance Table Heading |
Average Annual Total Returns for the Periods Ended December 31, 2025
|
| Performance Table Uses Highest Federal Rate |
After-tax returns are calculated using the historical highest individual federal marginal income tax rates during the period covered by the table above and do not reflect the impact of state and local taxes.
|
| Performance Table Not Relevant to Tax Deferred |
Actual after-tax returns depend on an investor’s tax situation and may differ from those shown. After-tax returns shown are not relevant to investors who hold shares through tax-advantaged arrangements, such as 401(k) plans or individual retirement accounts.
|
| Performance [Table] |
| |
|
1 Year |
|
|
Since
Inception
(3/27/23) |
|
| Return Before Taxes |
|
|
25.10 |
% |
|
|
2.51 |
% |
| Return After Taxes on Distributions |
|
|
16.88 |
% |
|
|
-3.98 |
% |
| Return After Taxes on Distributions and Sale of Fund Shares |
|
|
14.29 |
% |
|
|
-0.93 |
% |
| S&P 500 Index (reflects no deduction for fees, expenses or taxes) |
|
|
17.88 |
% |
|
|
20.45 |
% |
| MSCI USA IMI Health Care Net Total Return USD Index (reflects no deduction for fees, expenses or taxes) |
|
|
14.91 |
% |
|
|
6.88 |
% |
|
| Index No Deduction for Fees, Expenses, or Taxes [Text] |
reflects no deduction for fees, expenses or taxes
|
| Performance Table Closing [Text Block] |
After-tax returns are calculated using the historical highest individual federal marginal income tax rates during the period covered by the table above and do not reflect the impact of state and local taxes. Actual after-tax returns depend on an investor’s tax situation and may differ from those shown. After-tax returns shown are not relevant to investors who hold shares through tax-advantaged arrangements, such as 401(k) plans or individual retirement accounts.
|
| Performance Availability Website Address [Text] |
www.simplify.us/etfs
|
| Performance Availability Phone [Text] |
1 (855) 772-8488
|
| Simplify Tara India Opportunities ETF |
|
| Prospectus [Line Items] |
|
| Performance Narrative [Text Block] |
Performance: The following performance information provides some indication of the risks of investing in the Fund. The bar chart shows changes in the Fund’s performance from year to year. The table shows how the Fund’s average annual total returns compare to those of a broad-based securities market index. The Fund’s past performance (before and after taxes) is not necessarily an indication of how the Fund will perform in the future. Updated performance information is available at no cost by visiting www.simplify.us/etfs or by calling 1 (855) 772-8488.
|
| Performance Past Does Not Indicate Future [Text] |
The Fund’s past performance (before and after taxes) is not necessarily an indication of how the Fund will perform in the future.
|
| Performance Information Illustrates Variability of Returns [Text] |
The following performance information provides some indication of the risks of investing in the Fund. The bar chart shows changes in the Fund’s performance from year to year. The table shows how the Fund’s average annual total returns compare to those of a broad-based securities market index.
|
| Bar Chart [Table] |
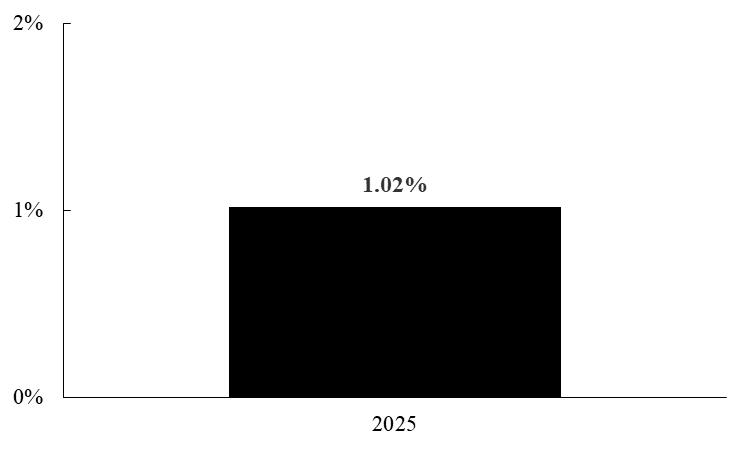
|
| Bar Chart Closing [Text Block] |
During the periods shown in the bar chart above, the Fund’s highest quarterly return was 9.34% (quarter ended June 30, 2025) and the Fund’s lowest quarterly return was -6.41% (quarter ended March 31, 2025). The calendar year-to-date total return of the Fund as of September 30, 2026 was -5.57%.
|
| Year to Date Return, Label [Optional Text] |
year-to-date total return
|
| Bar Chart, Year to Date Return |
(5.57%)
|
| Bar Chart, Year to Date Return, Date |
Sep. 30, 2026
|
| Highest Quarterly Return, Label [Optional Text] |
highest quarterly return
|
| Highest Quarterly Return |
9.34%
|
| Highest Quarterly Return, Date |
Jun. 30, 2025
|
| Lowest Quarterly Return, Label [Optional Text] |
lowest quarterly return
|
| Lowest Quarterly Return |
(6.41%)
|
| Lowest Quarterly Return, Date |
Mar. 31, 2025
|
| Performance Table Heading |
Average Annual Total Returns for the Periods Ended December 31, 2025
|
| Performance Table Uses Highest Federal Rate |
After-tax returns are calculated using the historical highest individual federal marginal income tax rates during the period covered by the table above and do not reflect the impact of state and local taxes.
|
| Performance Table Not Relevant to Tax Deferred |
Actual after-tax returns depend on an investor’s tax situation and may differ from those shown. After-tax returns shown are not relevant to investors who hold shares through tax-advantaged arrangements, such as 401(k) plans or individual retirement accounts.
|
| Performance [Table] |
|
|
1 Year |
|
|
Since
Inception
(3/5/24) |
|
| Return Before Taxes |
|
|
1.02 |
% |
|
|
8.62 |
% |
| Return After Taxes on Distributions |
|
|
0.89 |
% |
|
|
6.97 |
% |
| Return After Taxes on Distributions and Sale of Fund Shares |
|
|
0.60 |
% |
|
|
5.92 |
% |
| MSCI India Index (reflects no deduction for fees, expenses or taxes) |
|
|
2.62 |
% |
|
|
3.54 |
% |
|
| Index No Deduction for Fees, Expenses, or Taxes [Text] |
reflects no deduction for fees, expenses or taxes
|
| Performance Table Closing [Text Block] |
After-tax returns are calculated using the historical highest individual federal marginal income tax rates during the period covered by the table above and do not reflect the impact of state and local taxes. Actual after-tax returns depend on an investor’s tax situation and may differ from those shown. After-tax returns shown are not relevant to investors who hold shares through tax-advantaged arrangements, such as 401(k) plans or individual retirement accounts.
|
| Performance Availability Website Address [Text] |
www.simplify.us/etfs
|
| Performance Availability Phone [Text] |
1 (855) 772-8488
|
| Simplify Ancorato Target 25 Distribution ETF |
|
| Prospectus [Line Items] |
|
| Performance Narrative [Text Block] |
Performance: Performance information will be available in the prospectus after the Fund has been in operation for one full calendar year. Past performance is not necessarily an indication of how the Fund will perform in the future. Updated performance information will be available at no cost by visiting www.simplify.us or by calling 1 (855) 772-8488.
|
| Performance Past Does Not Indicate Future [Text] |
Past performance is not necessarily an indication of how the Fund will perform in the future.
|
| Performance One Year or Less [Text] |
Performance information will be available in the prospectus after the Fund has been in operation for one full calendar year.
|
| Performance Availability Website Address [Text] |
www.simplify.us
|
| Performance Availability Phone [Text] |
1 (855) 772-8488
|