PAY VERSUS PERFORMANCE
The following table shows the relationship between executive compensation actually paid (“CAP”) to our Principal Executive Officer (“PEO”) and other named executive officers, including the Chief Legal Officer, Secretary & Senior Advisor and the Chief Strategy Officer and President of Cineverse Corp. (“Non-PEO NEOs”), and certain financial performance of the Company during the last three fiscal years ended March 31, 2026, 2025 and 2024. The data
included in the CAP columns does not reflect the actual amount of compensation earned or paid to our executive officers during the applicable fiscal year on a cash or under US Generally Accepted Accounting Principles (“US GAAP”), and it is reported solely pursuant to SEC rules. The CAP amount also does not represent amounts that have actually been earned or realized under US GAAP, including with respect to PSUs and SARs. Performance conditions for these equity awards have not yet been satisfied. To this end, information in the following table may not reflect whether compensation actually realized is aligned with performance.
For a more fulsome discussion of our pay-for-performance compensation philosophy and performance measures, see “Executive Officer and Director Compensation.”
Pay Versus Performance |
|
||||||||||||||||||||||
Year |
Summary Compensation Table Total for PEO (1) |
|
|
Compensation Actually Paid to PEO (2) |
|
|
Average Summary Compensation Table Total for Non-PEO NEOs (3) |
|
|
Average Compensation Actually Paid to Non-PEO NEOs (3) |
|
|
Value of Initial Fixed $100 Investment Based On Total Shareholder Return (4) |
|
|
Net (loss) income (5) |
|
||||||
2026 |
|
993,721 |
|
|
|
1,444,935 |
|
|
|
766,748 |
|
|
|
899,473 |
|
|
|
28.57 |
|
|
|
(8,657 |
) |
2025 |
|
939,182 |
|
|
|
1,388,346 |
|
|
|
721,663 |
|
|
|
1,349,519 |
|
|
|
37.62 |
|
|
|
3,764 |
|
2024 |
|
1,014,286 |
|
|
|
466,732 |
|
|
|
945,743 |
|
|
|
647,671 |
|
|
|
16.55 |
|
|
|
(21,265 |
) |
Footnotes:
(1) The dollar amounts reported in column (1) are the amounts of total compensation reported for Christopher J. McGurk, Chief Executive Officer (our Principal Executive Officer, or PEO), for each corresponding year in the “Total” column of the Summary Compensation Table.
(2) The dollar amounts reported in column (2) represent the amount of CAP and have been computed following relevant SEC rules, as outlined below. The dollar amounts do not reflect the actual amount of compensation earned or paid during the applicable year. The fiscal 2025 and 2024 amounts presented above have been revised from the amounts previously reported as a result of an updated method of calculation.
PEO Equity Adjustments |
|
|||||||||||||||||||||||||
Year |
Reported Summary Compensation Table Total for PEO (1) |
|
|
Reported Value of Equity Awards (1) |
|
|
The year-end fair value of awards granted during the respective fiscal year that are outstanding and unvested as of year end (ii) |
|
|
Change in fair value of outstanding and unvested awards granted in prior years as of the end of the current fiscal year (iii) |
|
|
Change in the fair value of prior year awards from the end of the prior fiscal year to current year vesting date (iv) |
|
|
Total Equity Award Adjustments (i) |
|
Compensation Actually Paid to PEO (2) |
|
|||||||
2026 |
|
993,721 |
|
|
|
300,000 |
|
|
|
919,214 |
|
|
|
(152,000 |
) |
|
|
(16,000 |
) |
|
|
751,214 |
|
|
1,444,935 |
|
2025 |
|
939,182 |
|
|
|
249,270 |
|
|
|
948,000 |
|
|
|
57,938 |
|
|
|
(307,504 |
) |
|
|
698,434 |
|
|
1,388,346 |
|
2024 |
|
1,014,286 |
|
|
|
- |
|
|
|
- |
|
|
|
(534,538 |
) |
|
|
(13,016 |
) |
|
|
(547,554 |
) |
|
466,732 |
|
(3) The dollar amounts reported for the Company’s NEOs as a group (excluding the Company’s PEO) in the “Total” column of the Summary Compensation Table in each applicable year. For 2024, 2025 and 2026, the names of each of the NEOs (excluding the Company’s PEO) included for purposes of calculating the average amounts in each applicable year are as follows: Gary S. Loffredo, Chief Legal Officer, Secretary & Senior Advisor; and Erick Opeka, President & Chief Strategy Officer. In accordance with the SEC rules, average total compensation for the NEOs was computed as a group (excluding the Company’s PEO) for each year to determine the CAP, using the same methodology described above in Footnote 2 (i).
Non-PEO NEO Equity Adjustments |
|
|||||||||||||||||||||||||
Year |
Reported Summary Compensation Table Total for non-PEO NEOs (1) |
|
|
Reported Value of Equity Awards (1) |
|
|
The year-end fair value of awards granted during the respective fiscal year that are outstanding and unvested as of year end (ii) |
|
|
Change in fair value of outstanding and unvested awards granted in prior years as of the end of the current fiscal year (iii) |
|
|
Change in the fair value of prior year awards from the end of the prior fiscal year to current year vesting date (iv) |
|
|
Total Equity Award Adjustments (i) |
|
Average Compensation Actually Paid to Non-PEO NEOs (2)(3) |
|
|||||||
2026 |
|
766,748 |
|
|
|
237,498 |
|
|
|
534,967 |
|
|
|
(142,032 |
) |
|
|
(22,712 |
) |
|
|
370,223 |
|
|
899,473 |
|
2025 |
|
721,663 |
|
|
|
197,339 |
|
|
|
750,500 |
|
|
|
95,663 |
|
|
|
(20,969 |
) |
|
|
825,195 |
|
|
1,349,519 |
|
2024 |
|
945,743 |
|
|
|
282,215 |
|
|
|
55,087 |
|
|
|
(13,144 |
) |
|
|
(57,802 |
) |
|
|
(15,858 |
) |
|
647,671 |
|
(4) The cumulative total shareholder return (“TSR”) amounts reported in column (4) are calculated in the same manner as required under Item 201(e) of Regulation S-K, measuring the total shareholder return from the market close on the last trading day before the earliest fiscal year in the table, or March 31, 2023, through to and including the end of the fiscal year for which total shareholder return is calculated, or March 31, 2026.
(5) The dollar amounts reported in column (5) are the Company’s net income reflected in the Company’s audited financial statements for the applicable year.
(1) The dollar amounts reported in column (1) are the amounts of total compensation reported for Christopher J. McGurk, Chief Executive Officer (our Principal Executive Officer, or PEO), for each corresponding year in the “Total” column of the Summary Compensation Table.
The dollar amounts reported for the Company’s NEOs as a group (excluding the Company’s PEO) in the “Total” column of the Summary Compensation Table in each applicable year. For 2024, 2025 and 2026, the names of each of the NEOs (excluding the Company’s PEO) included for purposes of calculating the average amounts in each applicable year are as follows: Gary S. Loffredo, Chief Legal Officer, Secretary & Senior Advisor; and Erick Opeka, President & Chief Strategy Officer.(2) The dollar amounts reported in column (2) represent the amount of CAP and have been computed following relevant SEC rules, as outlined below. The dollar amounts do not reflect the actual amount of compensation earned or paid during the applicable year. The fiscal 2025 and 2024 amounts presented above have been revised from the amounts previously reported as a result of an updated method of calculation.
PEO Equity Adjustments |
|
|||||||||||||||||||||||||
Year |
Reported Summary Compensation Table Total for PEO (1) |
|
|
Reported Value of Equity Awards (1) |
|
|
The year-end fair value of awards granted during the respective fiscal year that are outstanding and unvested as of year end (ii) |
|
|
Change in fair value of outstanding and unvested awards granted in prior years as of the end of the current fiscal year (iii) |
|
|
Change in the fair value of prior year awards from the end of the prior fiscal year to current year vesting date (iv) |
|
|
Total Equity Award Adjustments (i) |
|
Compensation Actually Paid to PEO (2) |
|
|||||||
2026 |
|
993,721 |
|
|
|
300,000 |
|
|
|
919,214 |
|
|
|
(152,000 |
) |
|
|
(16,000 |
) |
|
|
751,214 |
|
|
1,444,935 |
|
2025 |
|
939,182 |
|
|
|
249,270 |
|
|
|
948,000 |
|
|
|
57,938 |
|
|
|
(307,504 |
) |
|
|
698,434 |
|
|
1,388,346 |
|
2024 |
|
1,014,286 |
|
|
|
- |
|
|
|
- |
|
|
|
(534,538 |
) |
|
|
(13,016 |
) |
|
|
(547,554 |
) |
|
466,732 |
|
(3) The dollar amounts reported for the Company’s NEOs as a group (excluding the Company’s PEO) in the “Total” column of the Summary Compensation Table in each applicable year. For 2024, 2025 and 2026, the names of each of the NEOs (excluding the Company’s PEO) included for purposes of calculating the average amounts in each applicable year are as follows: Gary S. Loffredo, Chief Legal Officer, Secretary & Senior Advisor; and Erick Opeka, President & Chief Strategy Officer. In accordance with the SEC rules, average total compensation for the NEOs was computed as a group (excluding the Company’s PEO) for each year to determine the CAP, using the same methodology described above in Footnote 2 (i).
Non-PEO NEO Equity Adjustments |
|
|||||||||||||||||||||||||
Year |
Reported Summary Compensation Table Total for non-PEO NEOs (1) |
|
|
Reported Value of Equity Awards (1) |
|
|
The year-end fair value of awards granted during the respective fiscal year that are outstanding and unvested as of year end (ii) |
|
|
Change in fair value of outstanding and unvested awards granted in prior years as of the end of the current fiscal year (iii) |
|
|
Change in the fair value of prior year awards from the end of the prior fiscal year to current year vesting date (iv) |
|
|
Total Equity Award Adjustments (i) |
|
Average Compensation Actually Paid to Non-PEO NEOs (2)(3) |
|
|||||||
2026 |
|
766,748 |
|
|
|
237,498 |
|
|
|
534,967 |
|
|
|
(142,032 |
) |
|
|
(22,712 |
) |
|
|
370,223 |
|
|
899,473 |
|
2025 |
|
721,663 |
|
|
|
197,339 |
|
|
|
750,500 |
|
|
|
95,663 |
|
|
|
(20,969 |
) |
|
|
825,195 |
|
|
1,349,519 |
|
2024 |
|
945,743 |
|
|
|
282,215 |
|
|
|
55,087 |
|
|
|
(13,144 |
) |
|
|
(57,802 |
) |
|
|
(15,858 |
) |
|
647,671 |
|
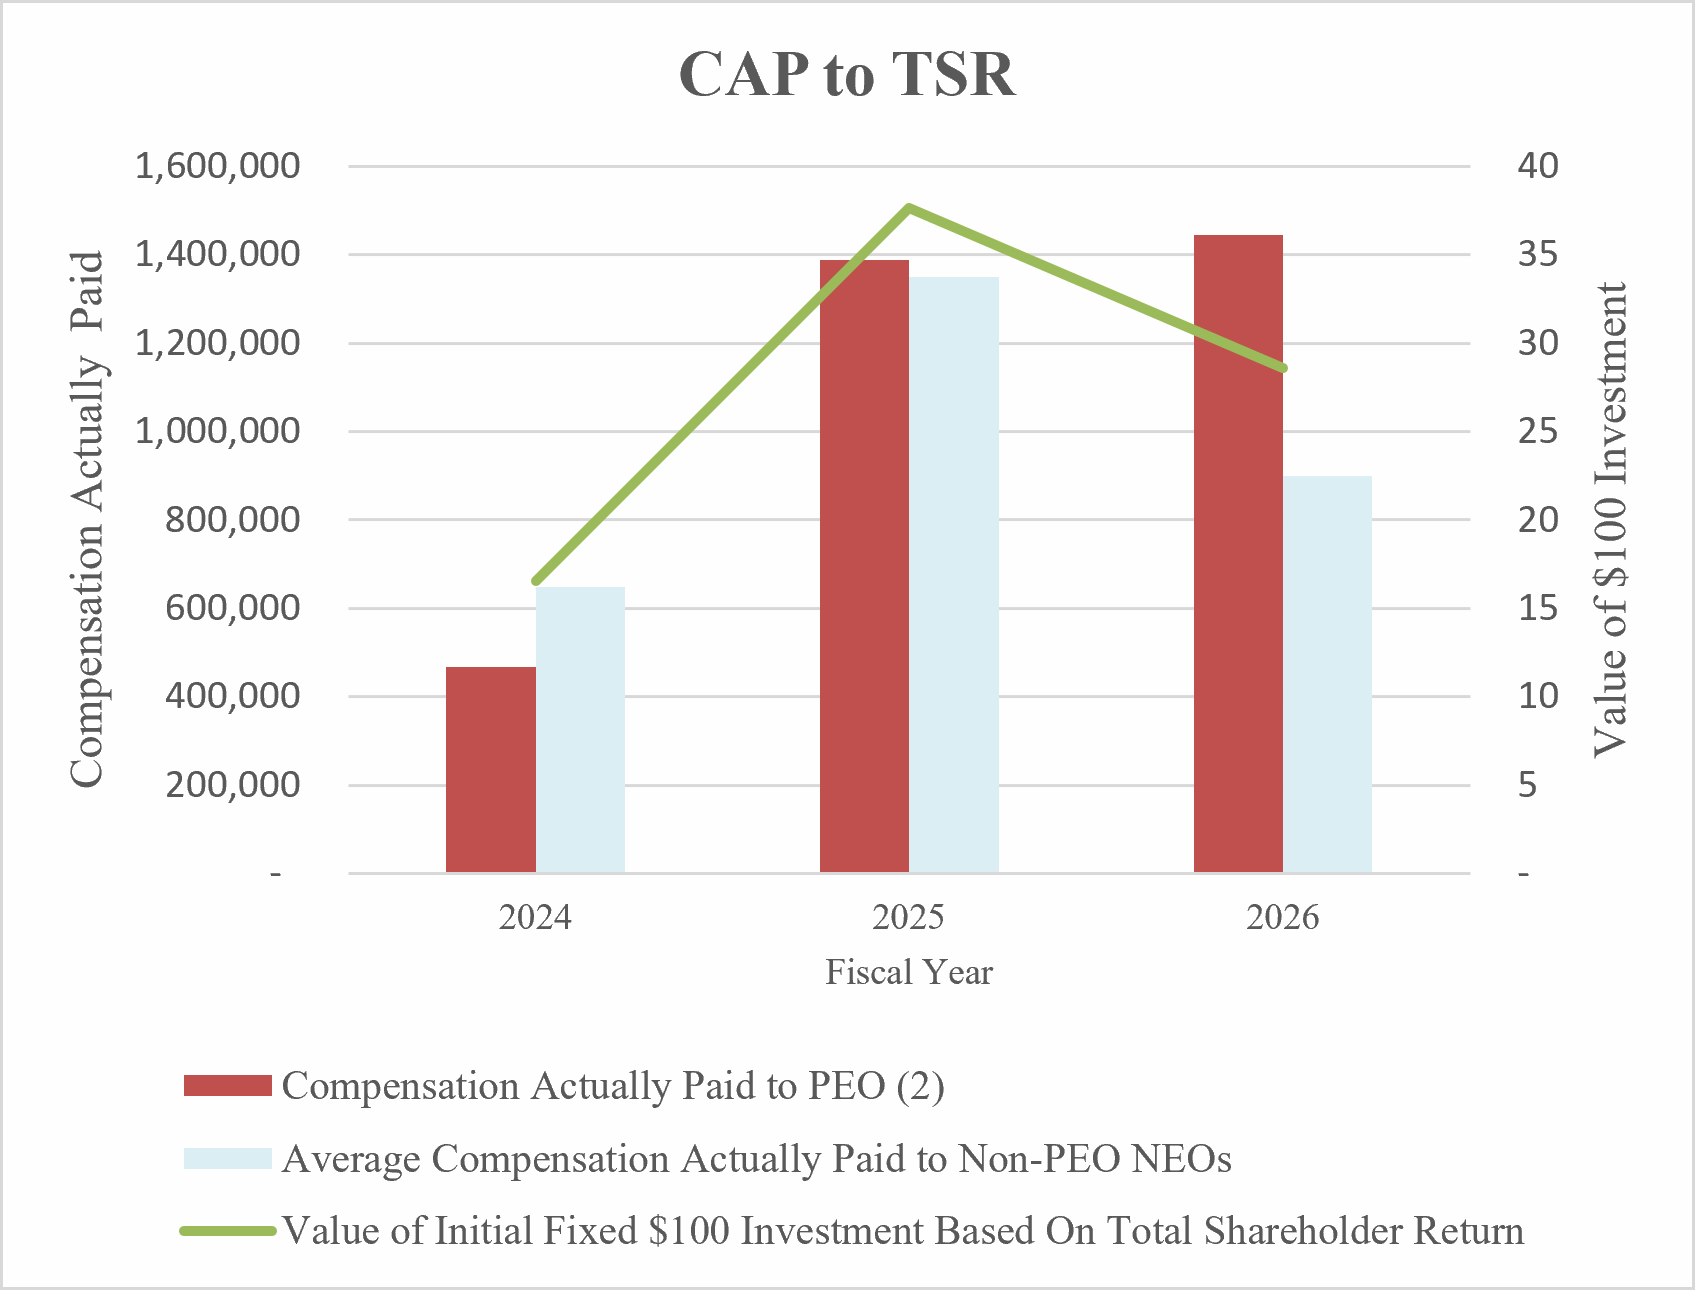
The following chart compares CAP versus Company TSR:
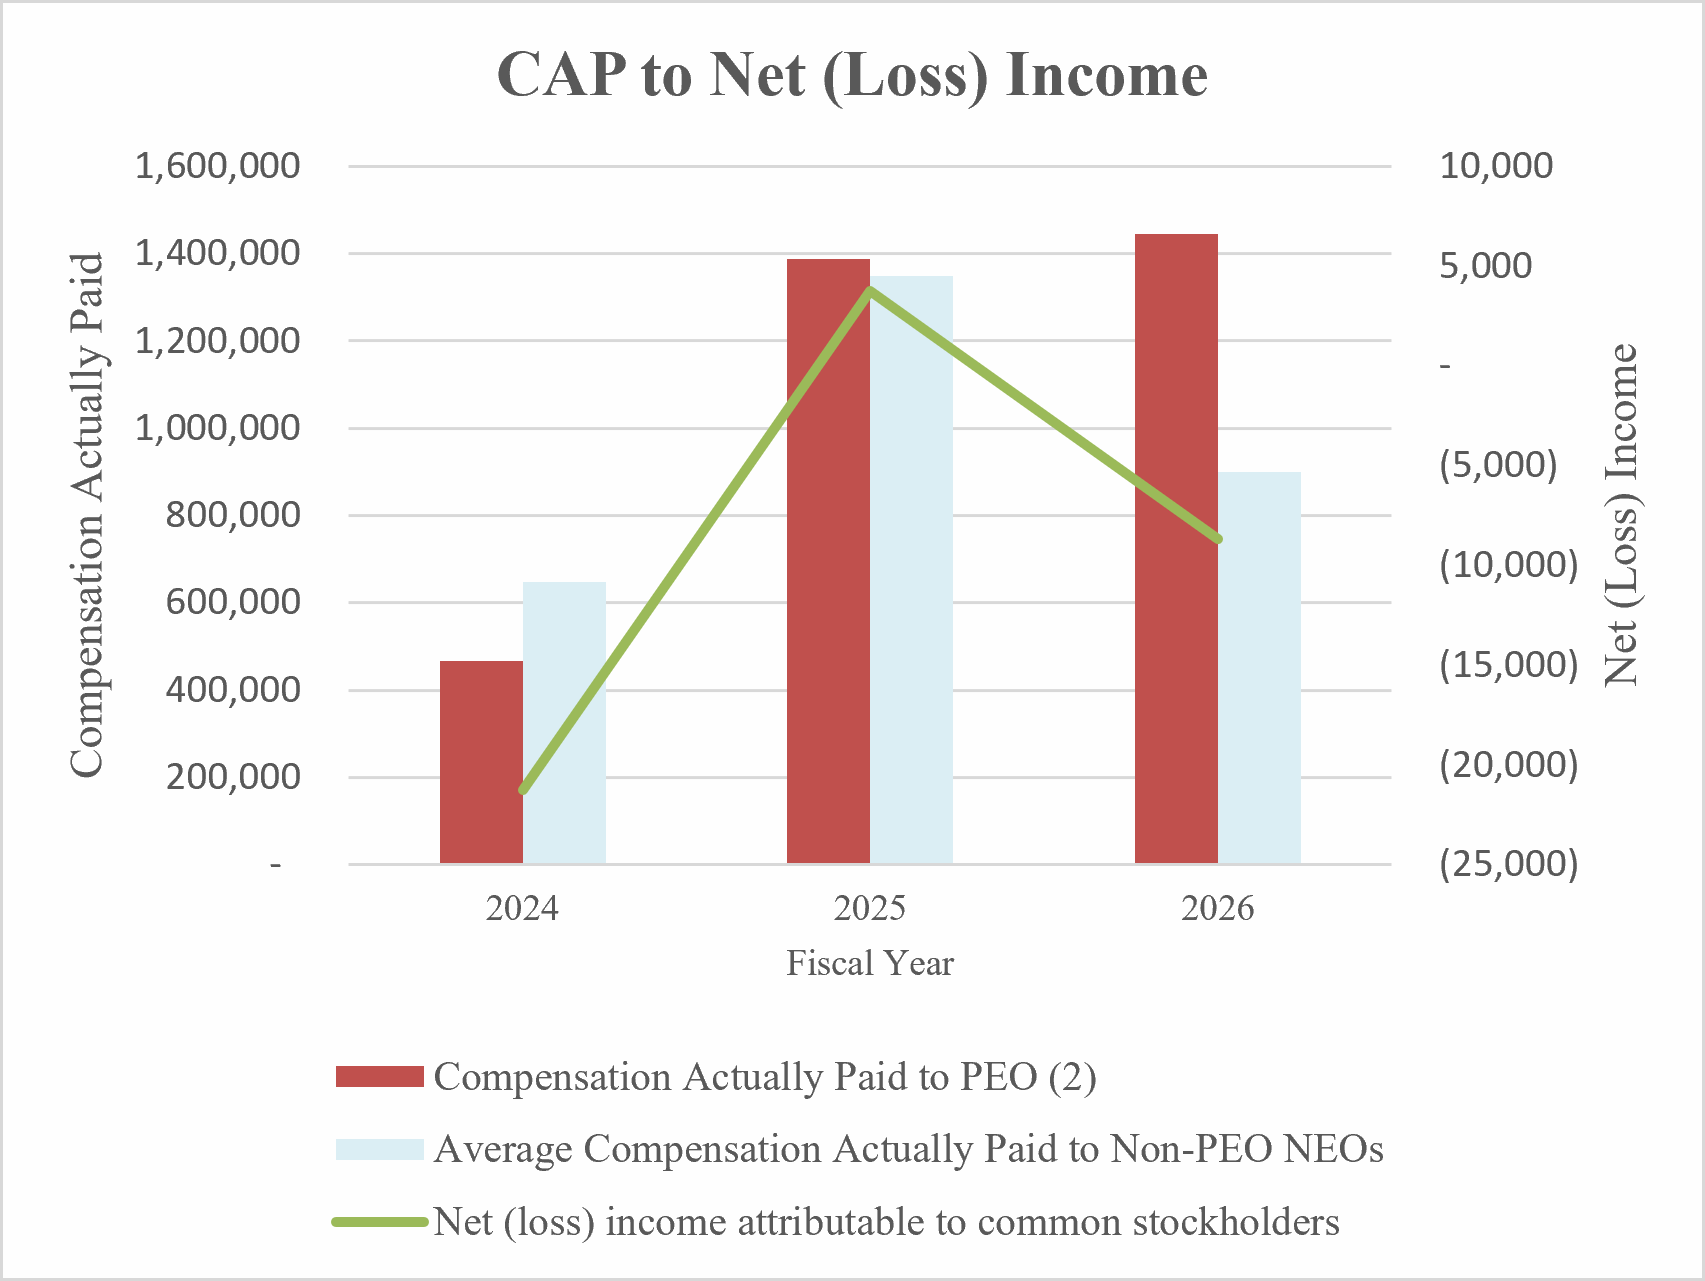
The following chart compares CAP versus Company Net (Loss) Income: