The following performance information indicates some of the risks of investing in the shares of the High Dividend Fund by showing the variability of the Retail Class’s returns (the class with the longest period of annual returns). The bar chart shows the total return of the High Dividend Fund by showing the changes in the High Dividend Fund’s performance from year to year (on a calendar year basis). The table shows the High Dividend Fund’s average annual total return over time compared to one or more broad measures of market performance. Both the bar chart and table assume that all dividends and distributions are reinvested in the High Dividend Fund. Remember, the High Dividend Fund’s past performance, before and after taxes, is not necessarily an indication of how the High Dividend Fund will perform in the future.
Updated performance information, including its current net asset value, is available at www.cullenfunds.com or by calling 1-877-485-8586.
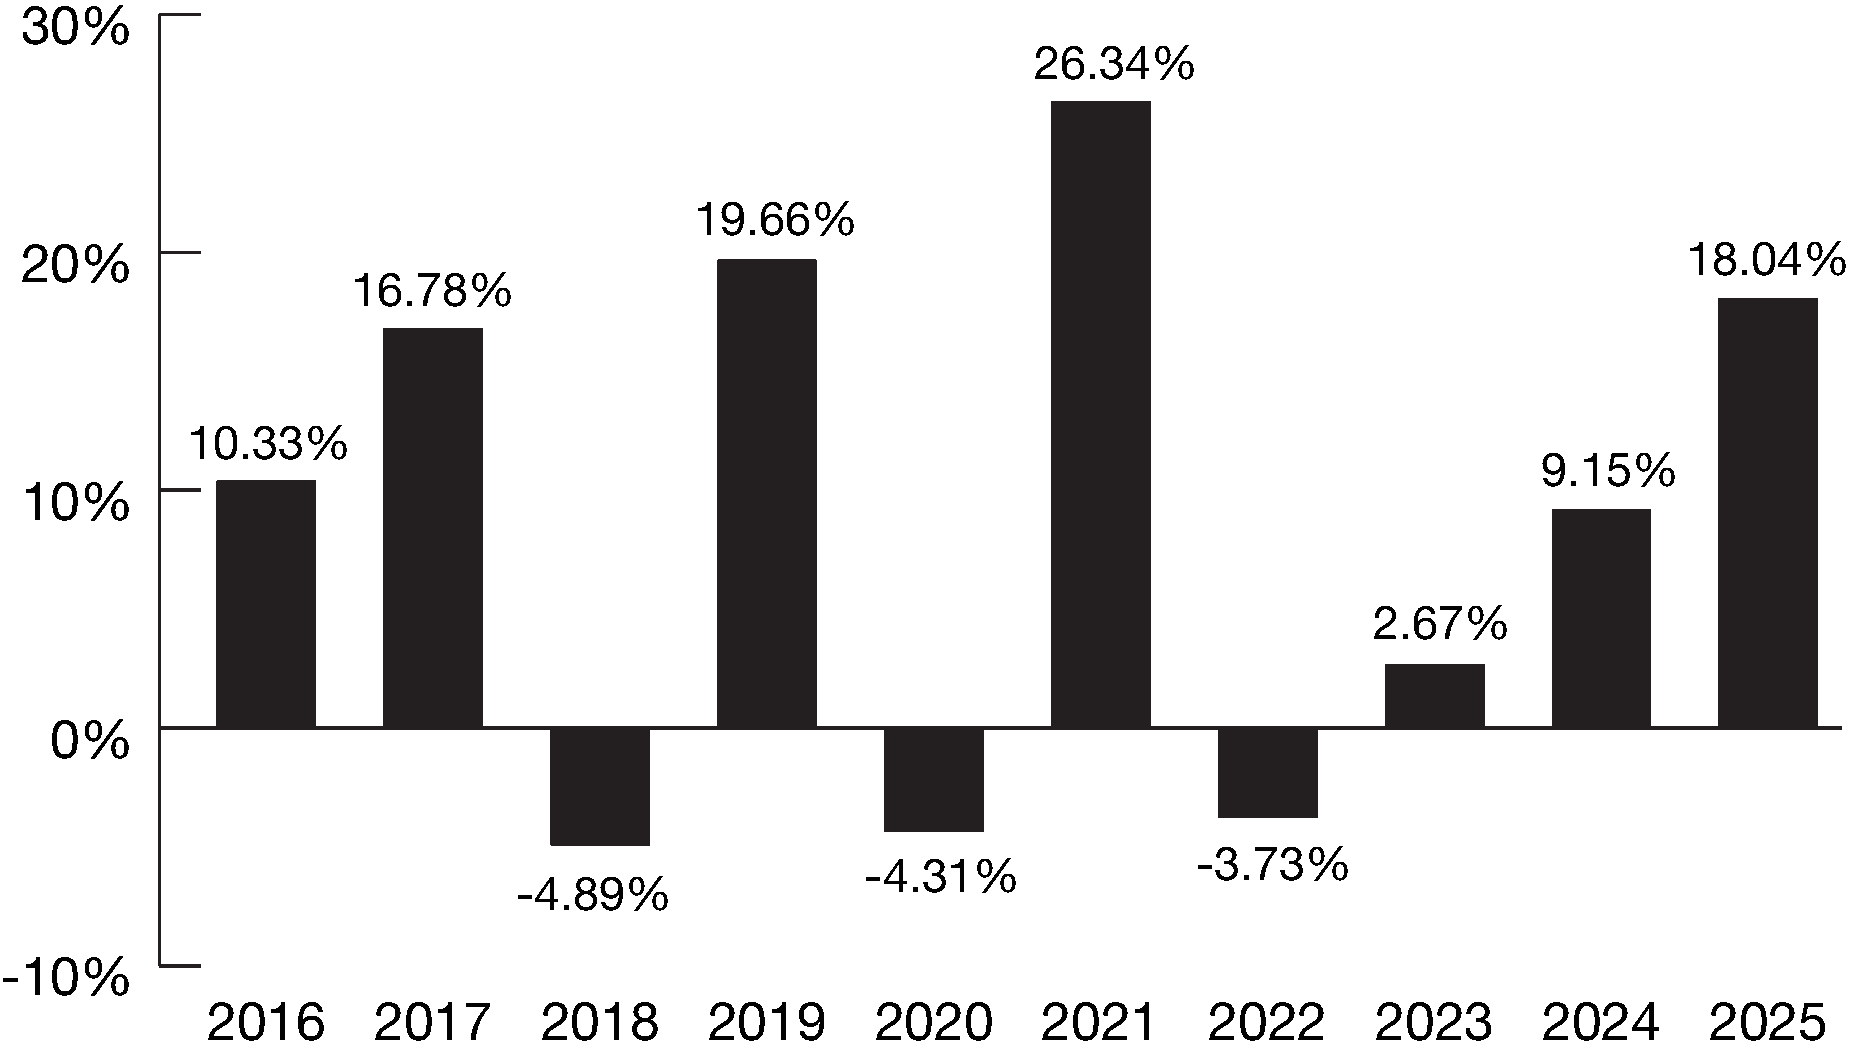
The High Dividend Fund’s 2026 year-to-date total return through September 30, 2026 was 9.97%.
|
Best and Worst Quarter Returns (for the period reflected in the bar chart above) |
|
|
|
|
Return |
Quarter/Year |
|
Highest Return |
14.98% |
|
|
Lowest Return |
-26.42% |
|
|
High Dividend Fund, Retail Class |
1 Year |
5 Year |
10 Year |
|
Returns before taxes |
18.04% |
9.98% |
8.48% |
|
Returns after taxes on distributions1 |
14.24% |
6.71% |
5.73% |
|
Returns after taxes on distributions and sale of Fund shares |
13.31% |
7.21% |
6.18% |
|
|
|
|
|
|
High Dividend Fund, Class I |
|
|
|
|
Returns before taxes |
18.34% |
10.27% |
8.76% |
|
High Dividend Fund, Class C |
|
|
|
|
Returns before taxes |
17.14% |
9.17% |
7.68% |
|
|
|
|
|
|
S&P 500® Index (reflects no deduction for fees, expenses or taxes) |
17.88% |
14.42% |
14.82% |
| 1 | After-tax returns are shown for only Retail Class shares. After-tax returns for Class I and Class C shares will differ. After-tax returns are calculated using the historical highest individual federal marginal income tax rates and do not reflect the impact of state and local taxes. Actual after-tax returns depend on your tax situation and may differ from those shown. Furthermore, the after-tax returns shown are not relevant to those who hold their shares through tax-deferred or tax-exempt arrangements such as 401(k) plans or individual retirement accounts (“IRAs”). |
The S&P 500® Index is an unmanaged index that covers 500 leading companies and captures approximately 80% coverage of available market capitalization.
The following performance information indicates some of the risks of investing in the shares of the International High Dividend Fund by showing the variability of the Retail Class’s returns (the class with the longest period of annual returns). The bar chart shows the total return of the International High Dividend Fund by showing the changes in the Fund’s performance from year to year (on a calendar year basis). The table shows the International High Dividend Fund’s average annual total return over time compared to one or more broad measures of market performance. Both the bar chart and table assume that all dividends and distributions are reinvested in the International High Dividend Fund. Remember, the International High Dividend Fund’s past performance, before and after taxes, is not necessarily an indication of how the Fund will perform in the future.
Updated performance information is available at www.cullenfunds.com or by calling 1-877-485-8586.
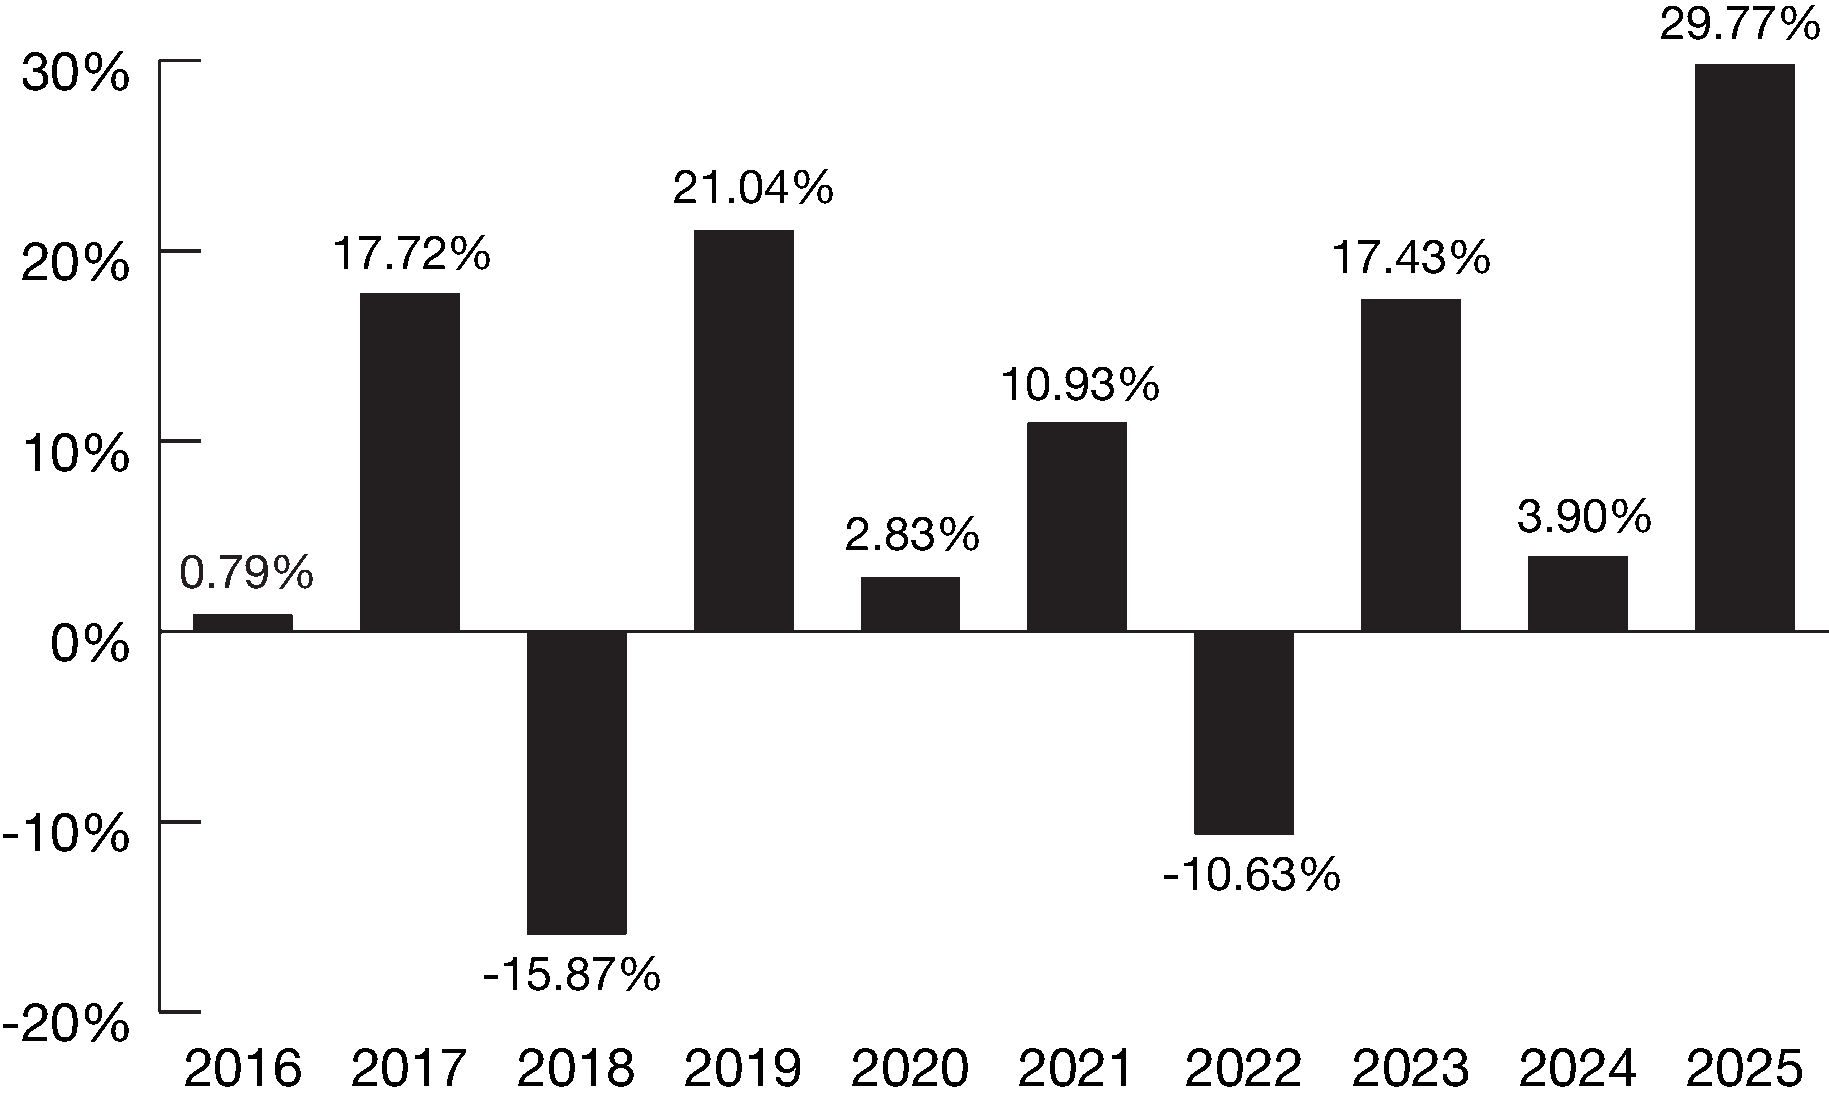
The International High Dividend Fund’s 2026 year-to-date total return through September 30, 2026 was 10.91%.
|
Best and Worst Quarter Returns (for the period reflected in the bar chart above) |
|
|
|
|
Return |
Quarter/Year |
|
Highest Return |
16.40% |
|
|
Lowest Return |
-21.69% |
|
|
International High Dividend Fund, Retail Class |
1 Year |
5 Year |
10 Year |
|
Returns before taxes |
29.77% |
9.44% |
6.91% |
|
Returns after taxes on distributions1 |
29.09% |
8.43% |
6.03% |
|
Returns after taxes on distributions and sale of Fund shares |
18.65% |
7.21% |
5.30% |
|
|
|
|
|
|
International High Dividend Fund, Class I |
|
|
|
|
Returns before taxes |
30.10% |
9.73% |
7.19% |
|
International High Dividend Fund, Class C |
1 Year |
5 Year |
10 Year |
|
Returns before taxes |
28.71% |
8.62% |
6.11% |
|
|
|
|
|
|
MSCI EAFE Index (reflects no deduction for fees, expenses or taxes) |
31.22% |
8.92% |
8.18% |
| 1 | After-tax returns are shown for only Retail Class shares. After-tax returns for Class I and Class C shares will differ. After-tax returns are calculated using the historical highest individual federal marginal income tax rates and do not reflect the impact of state and local taxes. Actual after-tax returns depend on your tax situation and may differ from those shown. Furthermore, the after-tax returns shown are not relevant to those who hold their shares through tax-deferred or tax-exempt arrangements such as 401(k) plans or individual retirement accounts (“IRAs”). |
The following performance information shows the variability of the Retail Class’s returns (the class with the longest period of annual returns) and demonstrates some of the risks of investing in the shares of the Small Cap Value Fund. The bar chart shows the total return of the Small Cap Value Fund and shows the changes in the Small Cap Value Fund’s performance from year to year (on a calendar year basis). The table shows the Small Cap Value Fund’s average annual total return over time compared to one or more broad measures of market performance. The Russell 1000 Index serves as the Fund’s regulatory broad-based securities market index. Both the bar chart and table assume that all dividends and distributions are reinvested in the Small Cap Value Fund. The Small Cap Value Fund’s past performance, before and after taxes, is not necessarily an indication of how the Fund will perform in the future.
Updated performance information is available at www.cullenfunds.com or by calling 1-877-485-8586.
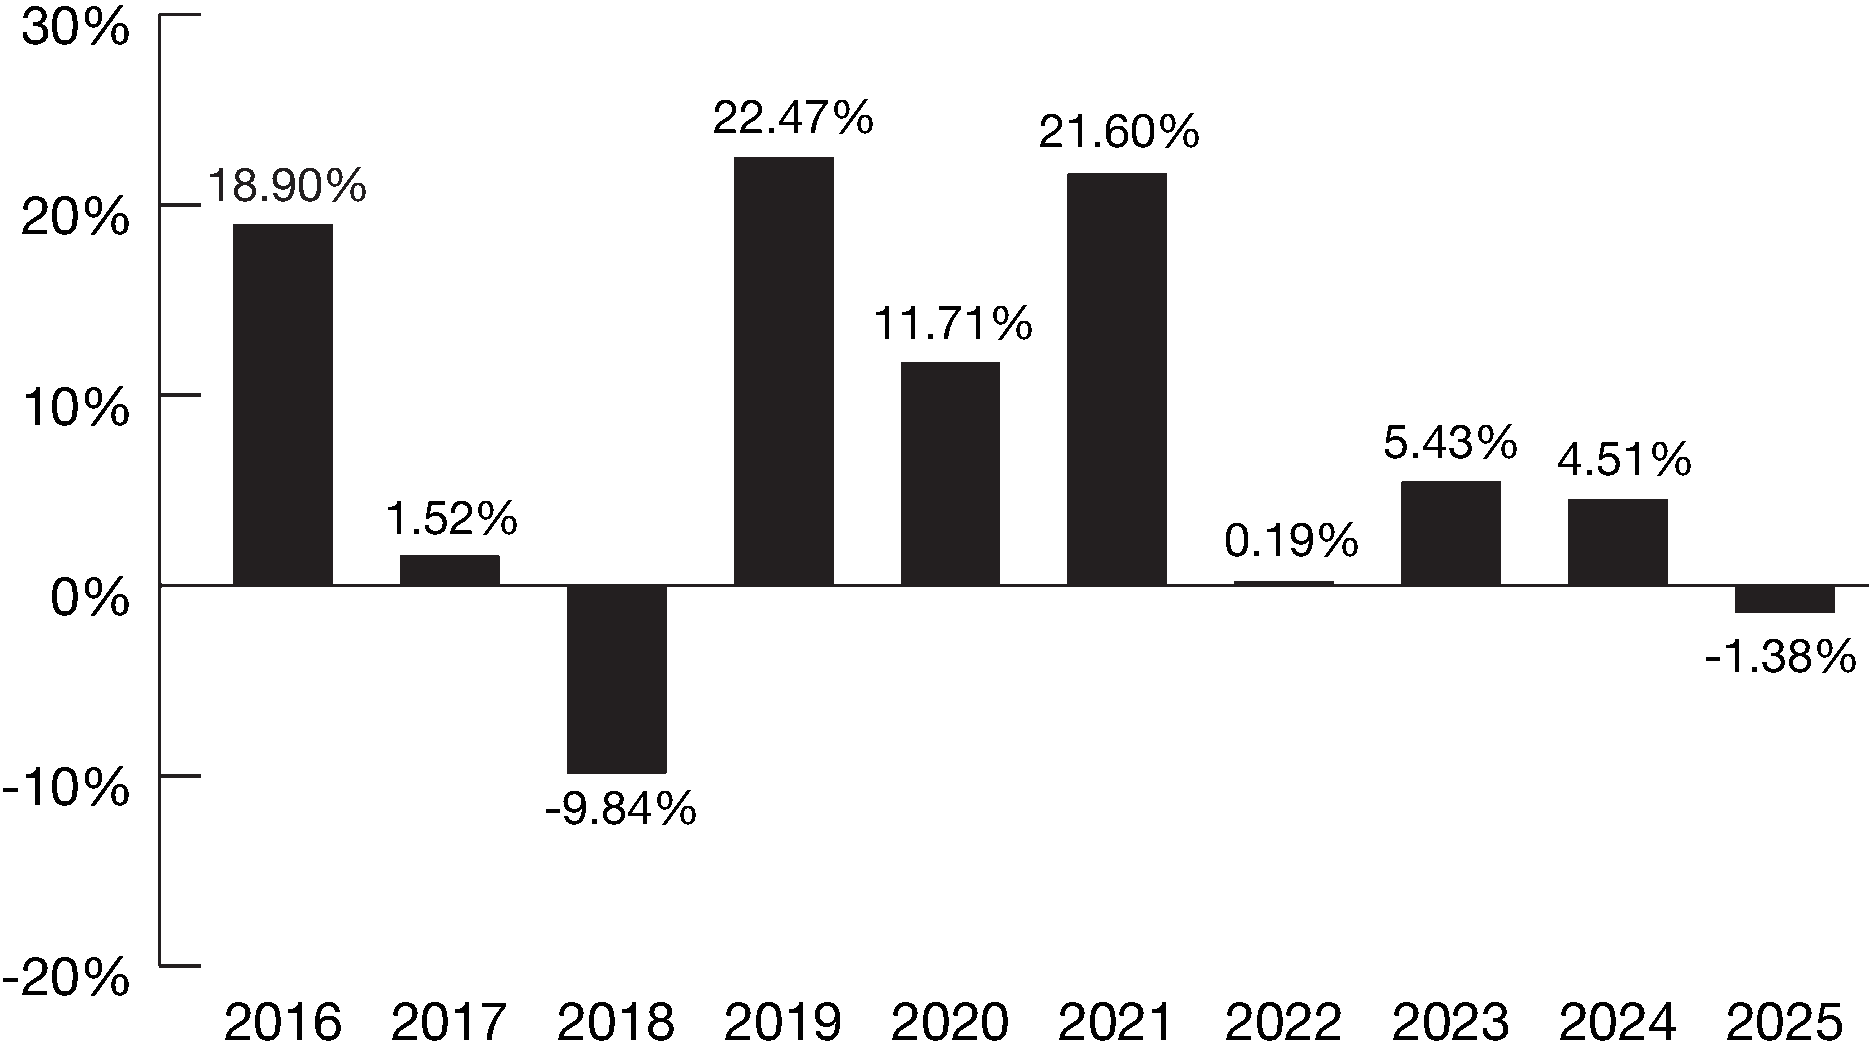
The Small Cap Value Fund’s 2026 year-to-date total return through September 30, 2026 was 1.09%.
|
Best and Worst Quarter Returns (for the period reflected in the bar chart above) |
|
|
|
|
Return |
Quarter/Year |
|
Highest Return |
40.91% |
|
|
Lowest Return |
-36.31% |
|
|
Small Cap Value Fund, Retail Class |
1 Year |
5 Year |
10 Year |
|
Returns before taxes |
-1.38% |
5.77% |
7.02% |
|
Returns after taxes on distributions1 |
-1.56% |
3.71% |
4.77% |
|
Returns after taxes on distributions and sale of Fund shares |
-0.67% |
3.75% |
4.55% |
|
|
|
|
|
|
Small Cap Value Fund, Class I |
|
|
|
|
Returns before taxes |
-1.21% |
6.02% |
7.29% |
|
|
|
|
|
|
Small Cap Value Fund, Class C |
|
|
|
|
Returns before taxes |
-2.12% |
4.97% |
6.22% |
|
Russell 2000 Value Index (reflects no deduction for fees, expenses or taxes) |
12.59% |
8.88% |
9.27% |
|
Russell 1000 Index2 |
17.37% |
13.59% |
14.59% |
| 1 | After-tax returns are shown for Retail Class shares only. After-tax returns for Class C and Class I shares will differ. After-tax returns are calculated using the historical highest individual federal marginal income tax rates and do not reflect the impact of state and local taxes. Actual after-tax returns depend on your tax situation and may differ from those shown. Furthermore, the after-tax returns shown are not relevant to those who hold their shares through tax-deferred arrangements such as 401(k) plans or individual retirement accounts (“IRAs”). |
| 2 | Per new regulatory requirements, the Fund’s regulatory broad-based securities market index is the Russell 1000® Index, which represents the overall U.S. equity market. |
The Russell 1000 Index is an index that measures the performance of the large-cap segment of the U.S. equity universe. It is a subset of the Russell 3000 Index and includes approximately 1,000 of the largest securities based on a combination of their market cap and current index membership.
The following bar chart shows the total return of the Value Fund from year to year (on a calendar year-to-date basis), and the table shows the Value Fund’s average annual total return over time compared to one or more broad measures of market performance. Both the bar chart and the table assume that all dividends and distributions are reinvested in the Value Fund and, by comparing the Fund’s performance to one or more broad measures of market performance, give some indication of the risks of an investment in the Fund. The Value Fund’s past performance, before and after taxes, is not necessarily an indication of how the Value Fund will perform in the future.
Updated performance information is available at www.cullenfunds.com or by calling 1-877-485-8586.
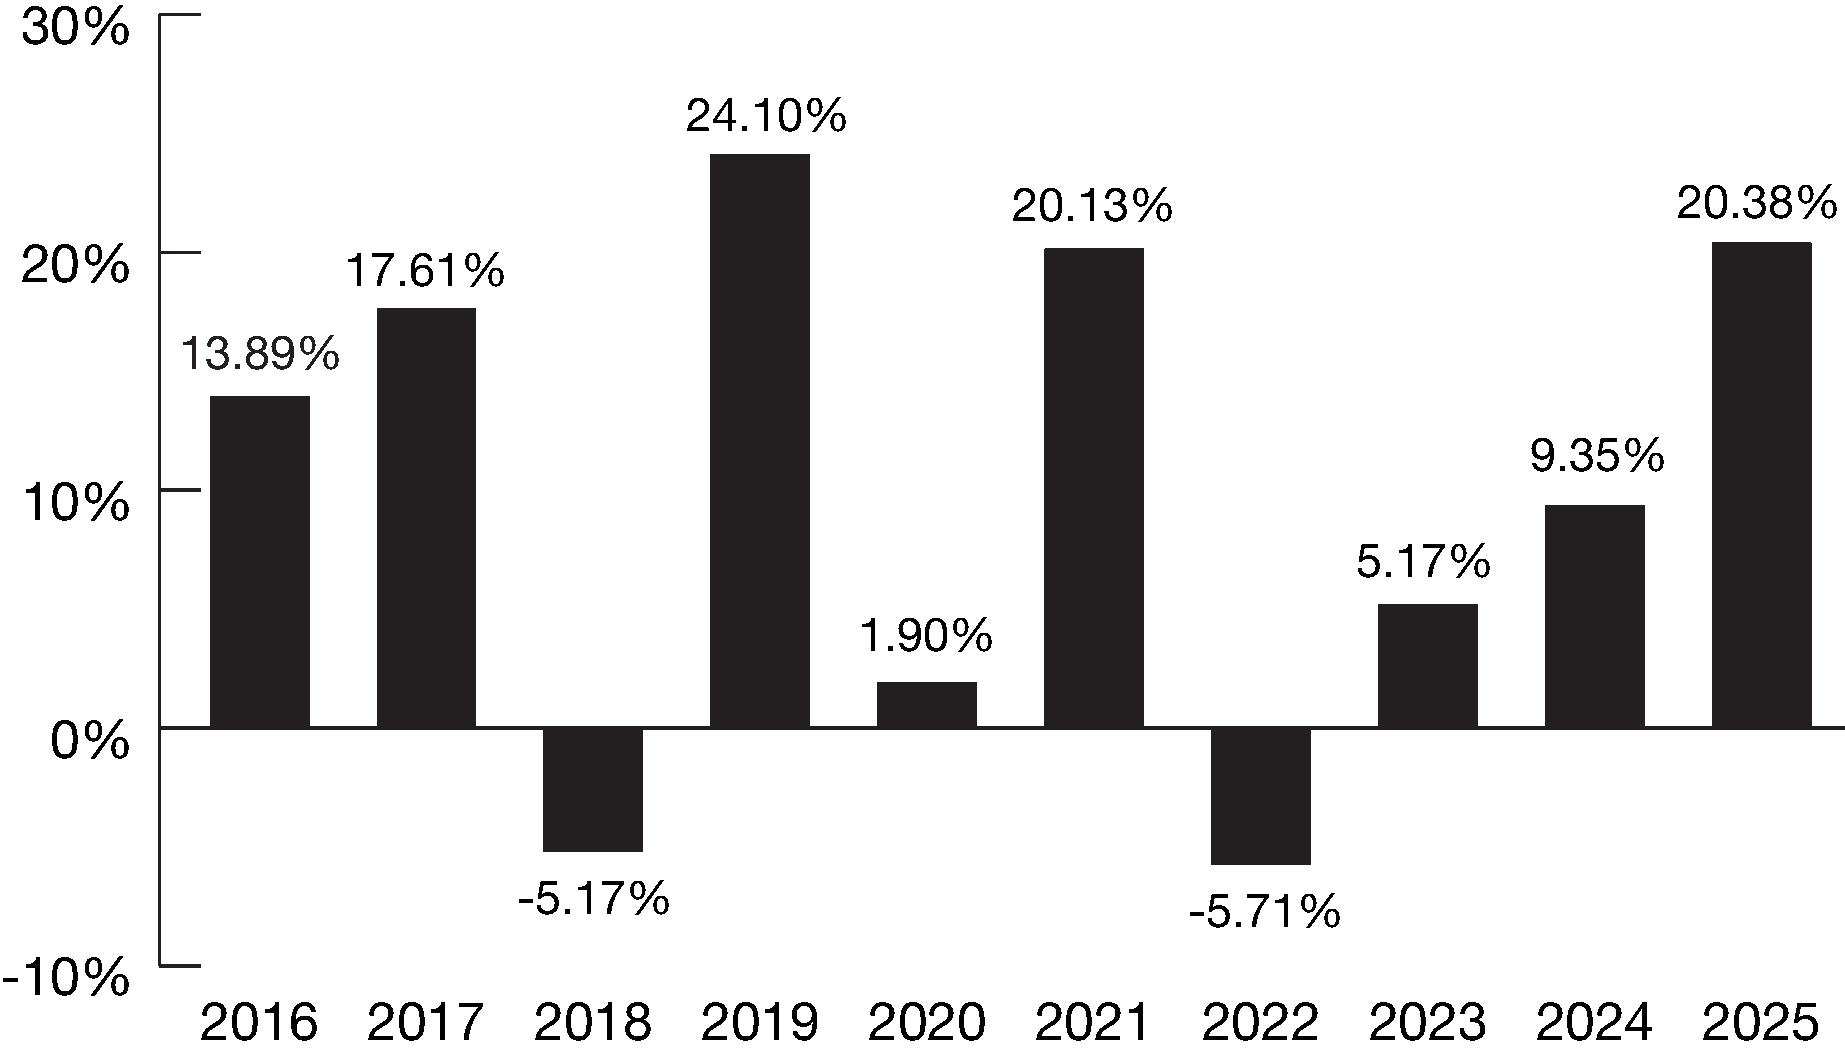
The Value Fund’s 2026 year-to-date total return through September 30, 2026 was 14.76%.
|
Best and Worst Quarter Returns (for the period reflected in the bar chart above) |
|
|
|
|
Return |
Quarter/Year |
|
Highest Return |
15.79% |
|
|
Lowest Return |
-24.96% |
|
|
Value Fund, Retail Class |
1 Year |
5 Year |
10 Year |
|
Returns before taxes |
20.38% |
9.41% |
9.68% |
|
Returns after taxes on distributions1 |
19.38% |
7.31% |
7.37% |
|
Returns after taxes on distributions and sale of Fund shares |
12.73% |
6.78% |
7.04% |
|
|
|
|
|
|
Value Fund, Class I |
|
|
|
|
Returns before taxes |
20.65% |
9.69% |
9.96% |
|
|
|
|
|
|
Value Fund, Class C |
|
|
|
|
Returns before taxes |
19.51% |
8.59% |
8.87% |
|
|
|
|
|
|
S&P 500® Total Return Index (reflects no deduction for fees, expenses or taxes) |
17.88% |
14.42% |
14.82% |
| 1 | After-tax returns are shown for Retail Class shares only. After-tax returns for Class C and Class I shares will differ. After-tax returns are calculated using the historical highest individual federal marginal income tax rates and do not reflect the impact of state and local taxes. Actual after-tax returns depend on your tax situation and may differ from those shown. Furthermore, the after-tax returns shown are not relevant to those who hold their shares through tax-deferred arrangements such as 401(k) plans or individual retirement accounts (“IRAs”). |
The following bar chart shows the total return of the Emerging Markets High Dividend Fund from year to year (on a calendar year-to-date basis), and the table shows the Emerging Markets High Dividend Fund’s average annual total return over time compared to one or more broad measures of market performance. Both the bar chart and the table assume that all dividends and distributions are reinvested in the Emerging Markets High Dividend Fund and, by comparing the Fund’s performance to one or more broad measures of market performance, give some indication of the risks of an investment in the Fund. The Emerging Markets High Dividend Fund’s past performance, before and after taxes, is not necessarily an indication of how the Emerging Markets High Dividend Fund will perform in the future.
Updated performance information is available at www.cullenfunds.com or by calling 1-877-485-8586.
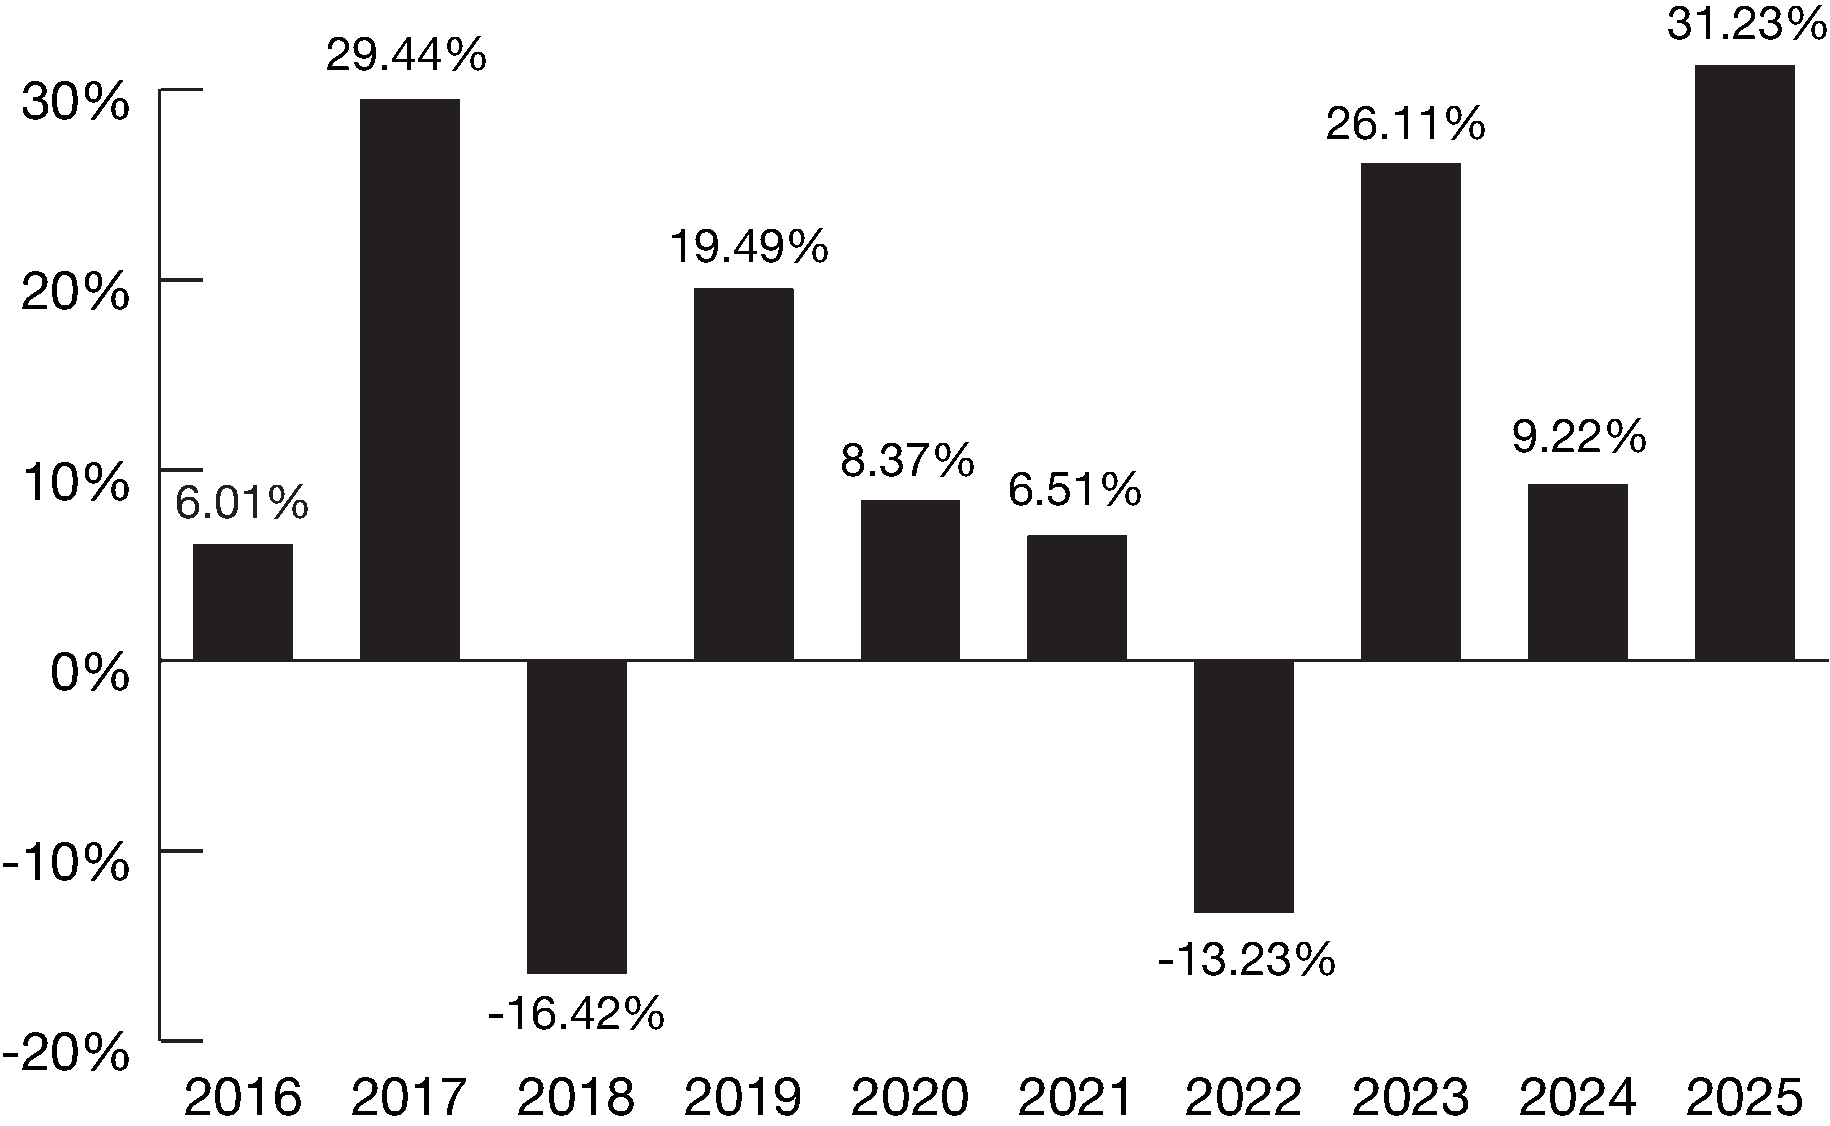
The Emerging Markets High Dividend Fund’s 2026 year-to-date total return through September 30, 2026 was 22.71%.
|
Best and Worst Quarter Returns (for the period reflected in the bar chart above) |
|
|
|
|
Return |
Quarter/Year |
|
Highest Return |
21.08% |
|
|
Lowest Return |
-26.19% |
|
|
Emerging Markets High Dividend Fund, Retail Class |
1 Year1 |
5 Year1 |
10 Year1 |
|
Returns before taxes |
31.23% |
10.81% |
9.51% |
|
Returns after taxes on distributions2 |
30.88% |
9.74% |
8.45% |
|
Returns after taxes on distributions and sale of Fund shares |
18.98% |
8.17% |
7.32% |
|
|
|
|
|
|
Emerging Markets High Dividend Fund, Class I |
|
|
|
|
Returns before taxes |
31.59% |
11.09% |
9.78% |
|
|
|
|
|
|
Emerging Markets High Dividend Fund, Class C |
|
|
|
|
Returns before taxes |
30.26% |
9.99% |
8.70% |
|
|
|
|
|
|
MSCI Emerging Markets Stock Index (reflects no deduction for fees, expenses or taxes) |
33.57% |
4.20% |
8.42% |
| 1 | Return information for Class R6 shares will be shown in future prospectuses offering the Fund’s Class R6 shares after the shares have a full calendar year of return information to report. |
| 2 | After-tax returns are shown for Retail Class shares only. After-tax returns for Class C, Class I and Class R6 shares will differ. After-tax returns are calculated using the historical highest individual federal marginal income tax rates and do not reflect the impact of state and local taxes. Actual after-tax returns depend on your tax situation and may differ from those shown. Furthermore, the after-tax returns shown are not relevant to those who hold their shares through tax-deferred arrangements such as 401(k) plans or individual retirement accounts (“IRAs”). |
33
The following bar chart shows the total return of the Enhanced Equity Income Fund from year to year (on a calendar year-to-date basis), and the table shows the Enhanced Equity Income Fund’s average annual total return over time compared with one or more broad measures of market performance. The S&P 500 Index serves as the Fund’s regulatory broad-based securities market index. The CBOE S&P 500 BuyWrite Index is relevant to the Fund because it has characteristics similar to the Fund’s investment strategy. Both the bar chart and the table assume that all dividends and distributions are reinvested in the Enhanced Equity Income Fund and, by comparing the Fund’s performance to one or more broad measures of market performance, give some indication of the risks of an investment in the Fund. The Enhanced Equity Income Fund’s past performance, before and after taxes, is not necessarily an indication of how the Enhanced Equity Income Fund will perform in the future.
Updated performance information is available at www.cullenfunds.com or by calling 1-877-485-8586.
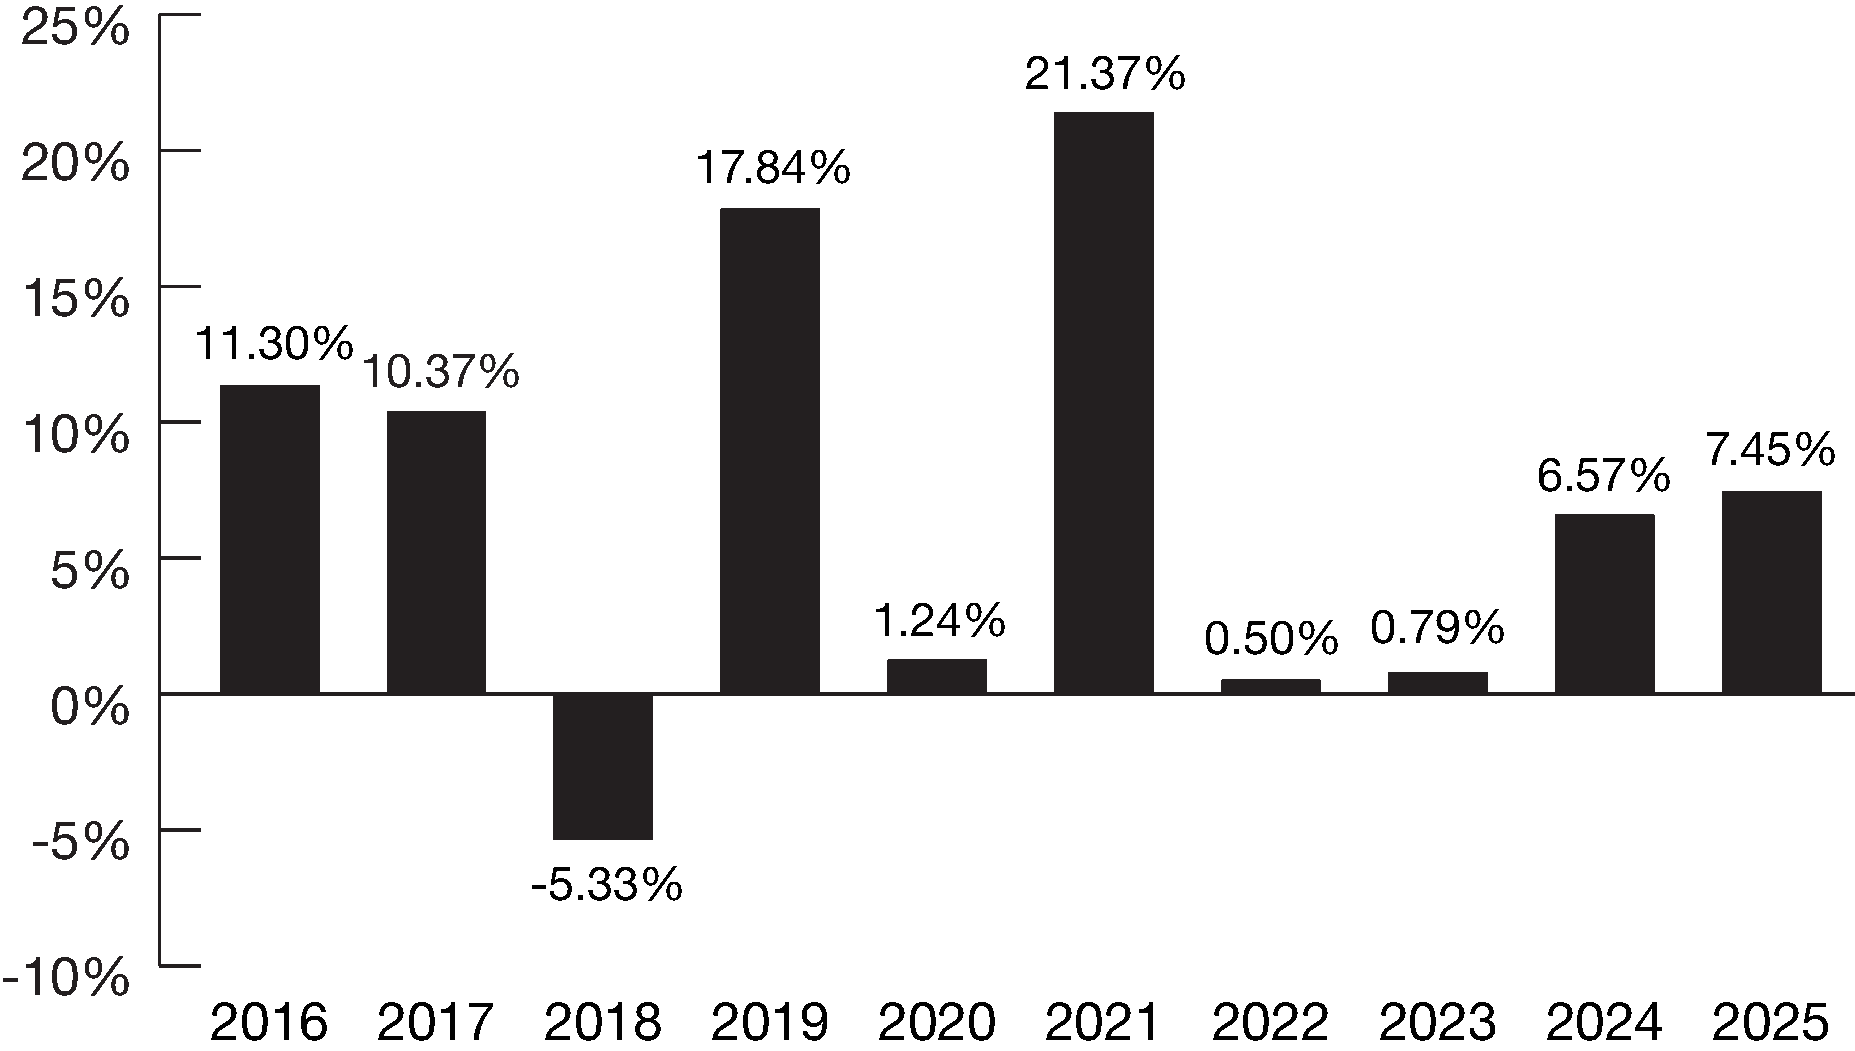
The Enhanced Equity Income Fund’s 2026 year-to-date total return through September 30, 2026 was 7.61%.
|
Best and Worst Quarter Returns (for the period reflected in the bar chart above) |
|
|
|
|
Return |
Quarter/Year |
|
Highest Return |
15.95% |
|
|
Lowest Return |
-24.37% |
|
|
Enhanced Equity Income Fund, Retail Class |
1 Year |
5 Years |
10 Years1 |
|
Returns before taxes |
7.45% |
7.08% |
6.92% |
|
Returns after taxes on distributions1 |
6.52% |
4.89% |
4.56% |
|
Returns after taxes on distributions and sale of Fund shares |
4.71% |
4.64% |
4.43% |
|
|
|
|
|
|
Enhanced Equity Income Fund, Class I |
|
|
|
|
Returns before taxes |
7.77% |
7.37% |
7.20% |
|
|
|
|
|
|
Enhanced Equity Income Fund, Class C |
|
|
|
|
Returns before taxes |
6.67% |
6.30% |
6.13% |
|
|
|
|
|
|
S&P 500 Index® 2 |
17.88% |
14.42% |
14.82% |
|
CBOE S&P 500 BuyWrite Index (reflects no deduction for fees, expenses or taxes) |
8.91% |
9.33% |
7.31% |
| 1 | After-tax returns are shown for Retail Class shares only. After-tax returns for Class C and Class I shares will differ. After-tax returns are calculated using the historical highest individual federal marginal income tax rates and do not reflect the impact of state and local taxes. Actual after-tax returns depend on your tax situation and may differ from those shown. Furthermore, the after-tax returns shown are not relevant to those who hold their shares through tax- deferred arrangements such as 401(k) plans or individual retirement accounts (“IRAs”). |
| 2 | Per new regulatory requirements, the Fund’s regulatory broad-based securities market index is the S&P 500, which represents 500 of the largest companies listed on stock exchange in the United States. |