Shareholder Report
|
12 Months Ended |
|
Aug. 31, 2026
USD ($)
Holding
|
Aug. 31, 2025 |
| Shareholder Report [Line Items] |
|
|
|
| Document Type |
|
N-CSR
|
|
| Amendment Flag |
|
false
|
|
| Registrant Name |
|
Principal Funds, Inc.
|
|
| Entity Central Index Key |
|
0000898745
|
|
| Entity Investment Company Type |
|
N-1A
|
|
| Document Period End Date |
|
Aug. 31, 2026
|
|
| C000131723 |
|
|
|
| Shareholder Report [Line Items] |
|
|
|
| Fund Name |
|
Blue Chip Fund
|
|
| Class Name |
|
Class A
|
|
| Trading Symbol |
|
PBLAX
|
|
| Annual or Semi-Annual Statement [Text Block] |
|
This annual shareholder report contains important information about Blue Chip Fund (the "Fund") for the period of September 1, 2025 to August 31, 2026.
|
|
| Shareholder Report Annual or Semi-Annual |
|
Annual Shareholder Report
|
|
| Additional Information [Text Block] |
|
You can find additional information about the Fund at www.PrincipalAM.com/prospectuses or you can request information by contacting us at 1-800-222-5852 or emailing prospectus@principalfunds.com.
|
|
| Additional Information Phone Number |
|
1-800-222-5852
|
|
| Additional Information Email |
|
<span style="box-sizing: border-box; color: rgb(0, 0, 0); display: inline; flex-wrap: nowrap; font-size: 10.6667px; font-weight: 400; grid-area: auto; line-height: 16px; margin: 0px; overflow: visible; text-align: left; text-align-last: auto; white-space-collapse: preserve-breaks;">prospectus@principalfunds.com</span>
|
|
| Additional Information Website |
|
<span style="box-sizing: border-box; color: rgb(0, 0, 0); display: inline; flex-wrap: nowrap; font-size: 10.6667px; font-weight: 400; grid-area: auto; line-height: 16px; margin: 0px; overflow: visible; text-align: left; text-align-last: auto; white-space-collapse: preserve-breaks;">www.PrincipalAM.com/prospectuses</span>
|
|
| Expenses [Text Block] |
|
What were the Fund costs for the last year? (based on a hypothetical $10,000 investment) Table SummaryClass Name | Costs of a $10,000 investment | Costs paid as a percentage of a $10,000 investment |
|---|
Class A | $93 | 0.93% |
|---|
|
|
| Expenses Paid, Amount |
|
$ 93
|
|
| Expense Ratio, Percent |
|
0.93%
|
|
| Factors Affecting Performance [Text Block] |
|
Management’s Discussion of Fund PerformanceThe Fund seeks long-term growth of capital. The Fund normally invests at least 80% of its net assets in equity securities of companies with large market capitalizations that, in the Fund's investment advisor's opinion, display characteristics of a "blue chip" company. The advisor tends to focus on securities of companies that show potential for growth of capital as well as an expectation for above average earnings. The Fund also invests in securities of foreign companies. Over the year, the Fund's investments benefited from strong company selection in consumer discretionary, where Amazon.com, Inc. and DoorDash, Inc. were among the top contributors to relative results versus the Russell 1000 Growth Index (“Index”). Amazon.com, Inc. reported accelerated growth in its cloud business, Amazon Web Services, as demand for AI-related compute continued to build. DoorDash, Inc. also delivered strong results, supported by expansion beyond restaurant delivery into newer verticals such as grocery and retail, which meaningfully increased its addressable market. These gains were offset by weaker company selection in information technology, where the Fund had less exposure to some of the market’s most powerful AI-led winners, including semiconductors, semiconductor equipment, and electrical components. Several software holdings also came under pressure, including Roper Technologies, Inc. and Cadence Design Systems, Inc., as investors questioned whether AI could increase competition or disrupt existing business models. Allocation to financial companies was another relative headwind, with alternative asset managers Brookfield Corp. and KKR & Co., Inc. detracting from performance. CoStar Group, Inc., a commercial real estate data and analytics provider, weighed on results as the company continued to absorb elevated investment spending tied to the buildout of its Homes.com business. |
|
| Performance Past Does Not Indicate Future [Text] |
|
Past performance is not a good predictor of the Fund's future performance.
|
|
| Line Graph [Table Text Block] |
|
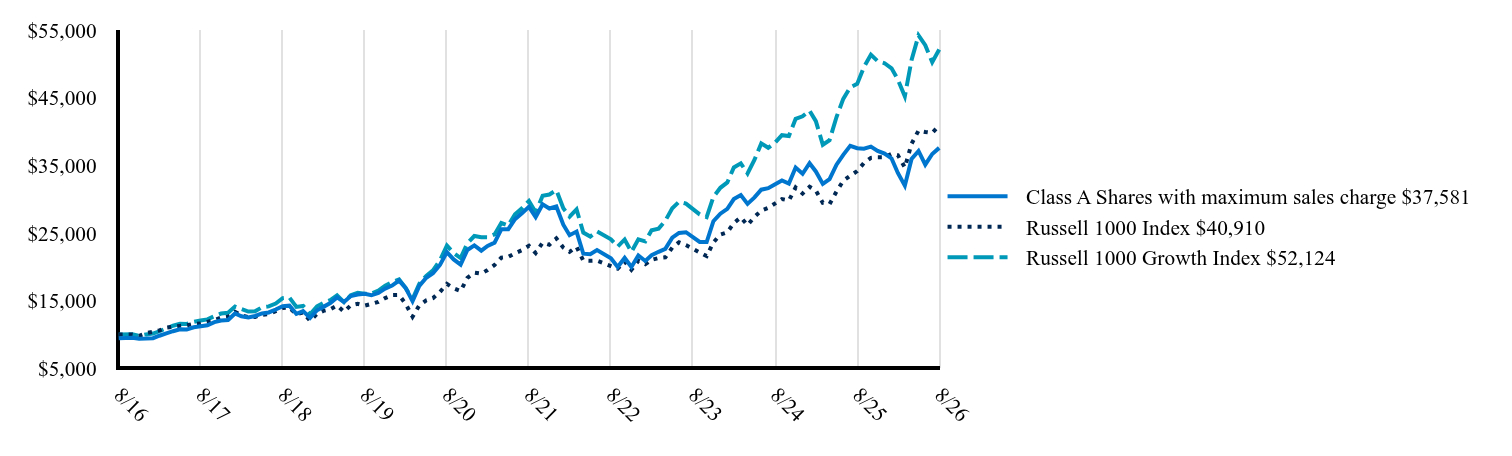 Table Summary | Class A Shares with maximum sales charge $37,581 | Russell 1000 Index $40,910 | Russell 1000 Growth Index $52,124 |
|---|
8/16 | 9,450 | 10,000 | 10,000 |
|---|
10/16 | 9,523 | 10,008 | 10,037 |
|---|
11/16 | 9,383 | 9,813 | 9,801 |
|---|
12/16 | 9,394 | 10,200 | 10,014 |
|---|
1/17 | 9,457 | 10,391 | 10,138 |
|---|
2/17 | 9,818 | 10,600 | 10,480 |
|---|
3/17 | 10,173 | 11,010 | 10,915 |
|---|
4/17 | 10,489 | 11,134 | 11,294 |
|---|
5/17 | 10,771 | 11,276 | 11,587 |
|---|
6/17 | 10,731 | 11,355 | 11,557 |
|---|
7/17 | 11,064 | 11,580 | 11,864 |
|---|
8/17 | 11,228 | 11,616 | 12,082 |
|---|
9/17 | 11,369 | 11,863 | 12,239 |
|---|
10/17 | 11,831 | 12,135 | 12,713 |
|---|
11/17 | 12,074 | 12,505 | 13,099 |
|---|
12/17 | 12,134 | 12,645 | 13,201 |
|---|
1/18 | 13,113 | 13,339 | 14,136 |
|---|
2/18 | 12,696 | 12,849 | 13,765 |
|---|
3/18 | 12,528 | 12,558 | 13,388 |
|---|
4/18 | 12,742 | 12,600 | 13,435 |
|---|
5/18 | 13,113 | 12,922 | 14,024 |
|---|
6/18 | 13,258 | 13,005 | 14,159 |
|---|
7/18 | 13,693 | 13,454 | 14,574 |
|---|
8/18 | 14,198 | 13,918 | 15,371 |
|---|
9/18 | 14,261 | 13,971 | 15,457 |
|---|
10/18 | 13,050 | 12,982 | 14,075 |
|---|
11/18 | 13,456 | 13,246 | 14,224 |
|---|
12/18 | 12,457 | 12,040 | 13,001 |
|---|
1/19 | 13,584 | 13,049 | 14,170 |
|---|
2/19 | 14,085 | 13,491 | 14,677 |
|---|
3/19 | 14,649 | 13,726 | 15,095 |
|---|
4/19 | 15,488 | 14,280 | 15,777 |
|---|
5/19 | 14,793 | 13,370 | 14,780 |
|---|
6/19 | 15,676 | 14,308 | 15,795 |
|---|
7/19 | 15,901 | 14,531 | 16,152 |
|---|
8/19 | 16,008 | 14,265 | 16,028 |
|---|
9/19 | 15,795 | 14,512 | 16,030 |
|---|
10/19 | 16,158 | 14,819 | 16,482 |
|---|
11/19 | 16,778 | 15,379 | 17,213 |
|---|
12/19 | 17,227 | 15,824 | 17,732 |
|---|
1/20 | 17,973 | 15,841 | 18,129 |
|---|
2/20 | 16,886 | 14,546 | 16,894 |
|---|
3/20 | 14,921 | 12,624 | 15,232 |
|---|
4/20 | 17,187 | 14,292 | 17,486 |
|---|
5/20 | 18,393 | 15,046 | 18,660 |
|---|
6/20 | 19,048 | 15,379 | 19,473 |
|---|
7/20 | 20,273 | 16,279 | 20,971 |
|---|
8/20 | 22,172 | 17,474 | 23,135 |
|---|
9/20 | 21,098 | 16,836 | 22,046 |
|---|
10/20 | 20,325 | 16,430 | 21,298 |
|---|
11/20 | 22,493 | 18,364 | 23,478 |
|---|
12/20 | 23,170 | 19,141 | 24,558 |
|---|
1/21 | 22,391 | 18,983 | 24,376 |
|---|
2/21 | 23,096 | 19,533 | 24,371 |
|---|
3/21 | 23,577 | 20,272 | 24,789 |
|---|
4/21 | 25,542 | 21,364 | 26,476 |
|---|
5/21 | 25,563 | 21,465 | 26,110 |
|---|
6/21 | 27,047 | 22,003 | 27,748 |
|---|
7/21 | 27,921 | 22,460 | 28,662 |
|---|
8/21 | 28,863 | 23,110 | 29,734 |
|---|
9/21 | 27,359 | 22,048 | 28,069 |
|---|
10/21 | 29,243 | 23,578 | 30,500 |
|---|
11/21 | 28,626 | 23,262 | 30,686 |
|---|
12/21 | 28,921 | 24,204 | 31,335 |
|---|
1/22 | 26,234 | 22,840 | 28,646 |
|---|
2/22 | 24,677 | 22,213 | 27,429 |
|---|
3/22 | 25,213 | 22,962 | 28,502 |
|---|
4/22 | 21,939 | 20,916 | 25,060 |
|---|
5/22 | 21,852 | 20,884 | 24,478 |
|---|
6/22 | 22,468 | 20,917 | 25,244 |
|---|
8/22 | 21,258 | 20,114 | 24,068 |
|---|
9/22 | 19,984 | 19,717 | 22,998 |
|---|
10/22 | 21,316 | 20,783 | 24,046 |
|---|
11/22 | 19,976 | 19,575 | 22,205 |
|---|
12/22 | 21,689 | 20,887 | 24,056 |
|---|
1/23 | 20,865 | 20,390 | 23,770 |
|---|
2/23 | 21,726 | 21,035 | 25,395 |
|---|
3/23 | 22,222 | 21,296 | 25,646 |
|---|
4/23 | 22,659 | 21,395 | 26,814 |
|---|
5/23 | 24,322 | 22,840 | 28,648 |
|---|
6/23 | 25,015 | 23,625 | 29,613 |
|---|
7/23 | 25,117 | 23,212 | 29,347 |
|---|
9/23 | 23,673 | 22,121 | 27,751 |
|---|
10/23 | 23,666 | 21,587 | 27,356 |
|---|
11/23 | 26,736 | 23,603 | 30,338 |
|---|
12/23 | 27,852 | 24,768 | 31,682 |
|---|
1/24 | 28,574 | 25,113 | 32,472 |
|---|
2/24 | 30,018 | 26,469 | 34,688 |
|---|
3/24 | 30,616 | 27,318 | 35,298 |
|---|
4/24 | 29,303 | 26,155 | 33,801 |
|---|
5/24 | 30,266 | 27,387 | 35,825 |
|---|
6/24 | 31,404 | 28,294 | 38,240 |
|---|
7/24 | 31,623 | 28,705 | 37,590 |
|---|
8/24 | 32,213 | 29,386 | 38,373 |
|---|
9/24 | 32,753 | 30,014 | 39,460 |
|---|
10/24 | 32,301 | 29,804 | 39,329 |
|---|
11/24 | 34,671 | 31,723 | 41,880 |
|---|
12/24 | 33,756 | 30,839 | 42,250 |
|---|
1/25 | 35,310 | 31,820 | 43,085 |
|---|
2/25 | 34,099 | 31,264 | 41,538 |
|---|
3/25 | 32,248 | 29,454 | 38,038 |
|---|
4/25 | 32,949 | 29,279 | 38,712 |
|---|
5/25 | 35,089 | 31,148 | 42,137 |
|---|
6/25 | 36,552 | 32,726 | 44,824 |
|---|
7/25 | 37,893 | 33,453 | 46,516 |
|---|
8/25 | 37,527 | 34,157 | 47,036 |
|---|
9/25 | 37,459 | 35,341 | 49,535 |
|---|
10/25 | 37,763 | 36,104 | 51,334 |
|---|
11/25 | 37,139 | 36,192 | 50,404 |
|---|
12/25 | 36,736 | 36,194 | 50,092 |
|---|
1/26 | 36,018 | 36,692 | 49,334 |
|---|
2/26 | 33,876 | 36,496 | 47,678 |
|---|
3/26 | 32,001 | 34,681 | 45,194 |
|---|
4/26 | 35,945 | 38,185 | 50,570 |
|---|
5/26 | 37,122 | 40,133 | 54,212 |
|---|
6/26 | 35,099 | 39,928 | 52,760 |
|---|
7/26 | 36,680 | 39,788 | 50,250 |
|---|
8/26 | 37,581 | 40,910 | 52,124 |
|---|
|
|
| Average Annual Return [Table Text Block] |
|
Table SummaryName | 1-Year | 5-Year | 10-Year |
|---|
Class A Shares Excluding Sales Charge | 0.14% | 5.42% | 14.80% |
|---|
Class A Shares Including Sales Charge | -5.37% | 4.23% | 14.16% |
|---|
Russell 1000 Index | 19.77% | 12.10% | 15.13% |
|---|
Russell 1000 Growth Index | 10.82% | 11.88% | 17.95% |
|---|
|
|
| No Deduction of Taxes [Text Block] |
|
The graph above represents historical performance of a hypothetical investment of $10,000 in the Fund over the past ten years (or since inception if shorter). The table and graph above do not reflect the impact of taxes. If they did, performance would be lower.
|
|
| Performance Table Market Index Changed [Text Block] |
|
The Russell 1000 Index is the Fund's primary broad-based securities market index. The Russell 1000 Growth Index is included as an additional index for the Fund as it shows how the Fund’s performance compares with the returns of an index of funds with similar investment objectives.
|
|
| Updated Performance Information Location [Text Block] |
|
Visit www.principalam.com/mutualfundperformance for more recent performance information.
|
|
| AssetsNet |
|
$ 6,905,834,000
|
|
| Holdings Count | Holding |
|
39
|
|
| Advisory Fees Paid, Amount |
|
$ 51,161,000
|
|
| InvestmentCompanyPortfolioTurnover |
|
29.40%
|
|
| Additional Fund Statistics [Text Block] |
|
- Net Assets (amount in thousands)$6,905,834
- Total Number of Portfolio Holdings39
- Portfolio Turnover Rate 29.4%
- Total Advisory Fees Paid (amount in thousands)$51,161
|
|
| Holdings [Text Block] |
|
Table SummaryAsset Weighting | Percent of Net Assets |
|---|
Common Stocks | 100.48% | Investment Companies | 0.07% | Other Assets and Liabilities | (0.55)% | Total Net Assets | 100.00% | Table SummarySector | Percent of Net Assets |
|---|
Technology | 32.97% | Communications | 30.57% | Financial | 21.08% | Industrial | 10.60% | Consumer, Non-cyclical | 3.07% | Consumer, Cyclical | 1.85% | Basic Materials | 0.34% | Money Market Funds | 0.07% | Other Assets and Liabilities | (0.55)% | Total Net Assets | 100.00% | |
|
| Material Fund Change [Text Block] |
|
There were no material changes to the Fund for the period September 1, 2025 to August 31, 2026. For more complete information, you may review the Fund's most recent prospectus at www.PrincipalAM.com/prospectuses. |
|
| C000131724 |
|
|
|
| Shareholder Report [Line Items] |
|
|
|
| Fund Name |
|
Blue Chip Fund
|
|
| Class Name |
|
Class C
|
|
| Trading Symbol |
|
PBLCX
|
|
| Annual or Semi-Annual Statement [Text Block] |
|
This annual shareholder report contains important information about Blue Chip Fund (the "Fund") for the period of September 1, 2025 to August 31, 2026.
|
|
| Shareholder Report Annual or Semi-Annual |
|
Annual Shareholder Report
|
|
| Additional Information [Text Block] |
|
You can find additional information about the Fund at www.PrincipalAM.com/prospectuses or you can request information by contacting us at 1-800-222-5852 or emailing prospectus@principalfunds.com.
|
|
| Additional Information Phone Number |
|
1-800-222-5852
|
|
| Additional Information Email |
|
<span style="box-sizing: border-box; color: rgb(0, 0, 0); display: inline; flex-wrap: nowrap; font-size: 10.6667px; font-weight: 400; grid-area: auto; line-height: 16px; margin: 0px; overflow: visible; text-align: left; text-align-last: auto; white-space-collapse: preserve-breaks;">prospectus@principalfunds.com</span>
|
|
| Additional Information Website |
|
<span style="box-sizing: border-box; color: rgb(0, 0, 0); display: inline; flex-wrap: nowrap; font-size: 10.6667px; font-weight: 400; grid-area: auto; line-height: 16px; margin: 0px; overflow: visible; text-align: left; text-align-last: auto; white-space-collapse: preserve-breaks;">www.PrincipalAM.com/prospectuses</span>
|
|
| Expenses [Text Block] |
|
What were the Fund costs for the last year? (based on a hypothetical $10,000 investment) Table SummaryClass Name | Costs of a $10,000 investment | Costs paid as a percentage of a $10,000 investment |
|---|
Class C | $166 | 1.66% |
|---|
|
|
| Expenses Paid, Amount |
|
$ 166
|
|
| Expense Ratio, Percent |
|
1.66%
|
|
| Factors Affecting Performance [Text Block] |
|
Management’s Discussion of Fund PerformanceThe Fund seeks long-term growth of capital. The Fund normally invests at least 80% of its net assets in equity securities of companies with large market capitalizations that, in the Fund's investment advisor's opinion, display characteristics of a "blue chip" company. The advisor tends to focus on securities of companies that show potential for growth of capital as well as an expectation for above average earnings. The Fund also invests in securities of foreign companies. Over the year, the Fund's investments benefited from strong company selection in consumer discretionary, where Amazon.com, Inc. and DoorDash, Inc. were among the top contributors to relative results versus the Russell 1000 Growth Index (“Index”). Amazon.com, Inc. reported accelerated growth in its cloud business, Amazon Web Services, as demand for AI-related compute continued to build. DoorDash, Inc. also delivered strong results, supported by expansion beyond restaurant delivery into newer verticals such as grocery and retail, which meaningfully increased its addressable market. These gains were offset by weaker company selection in information technology, where the Fund had less exposure to some of the market’s most powerful AI-led winners, including semiconductors, semiconductor equipment, and electrical components. Several software holdings also came under pressure, including Roper Technologies, Inc. and Cadence Design Systems, Inc., as investors questioned whether AI could increase competition or disrupt existing business models. Allocation to financial companies was another relative headwind, with alternative asset managers Brookfield Corp. and KKR & Co., Inc. detracting from performance. CoStar Group, Inc., a commercial real estate data and analytics provider, weighed on results as the company continued to absorb elevated investment spending tied to the buildout of its Homes.com business. |
|
| Performance Past Does Not Indicate Future [Text] |
|
Past performance is not a good predictor of the Fund's future performance.
|
|
| Line Graph [Table Text Block] |
|
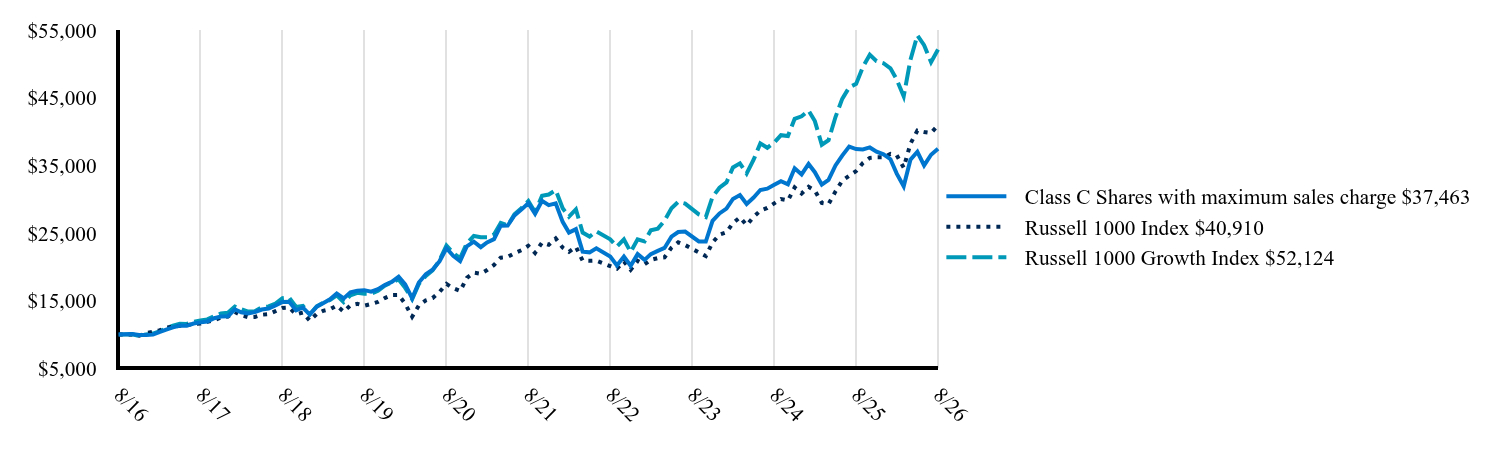 Table Summary | Class C Shares with maximum sales charge $37,463 | Russell 1000 Index $40,910 | Russell 1000 Growth Index $52,124 |
|---|
8/16 | 10,000 | 10,000 | 10,000 |
|---|
10/16 | 10,073 | 10,008 | 10,037 |
|---|
11/16 | 9,915 | 9,813 | 9,801 |
|---|
12/16 | 9,921 | 10,200 | 10,014 |
|---|
1/17 | 9,983 | 10,391 | 10,138 |
|---|
2/17 | 10,354 | 10,600 | 10,480 |
|---|
3/17 | 10,719 | 11,010 | 10,915 |
|---|
4/17 | 11,048 | 11,134 | 11,294 |
|---|
5/17 | 11,334 | 11,276 | 11,587 |
|---|
6/17 | 11,285 | 11,355 | 11,557 |
|---|
7/17 | 11,626 | 11,580 | 11,864 |
|---|
8/17 | 11,791 | 11,616 | 12,082 |
|---|
9/17 | 11,931 | 11,863 | 12,239 |
|---|
10/17 | 12,406 | 12,135 | 12,713 |
|---|
11/17 | 12,655 | 12,505 | 13,099 |
|---|
12/17 | 12,708 | 12,645 | 13,201 |
|---|
1/18 | 13,723 | 13,339 | 14,136 |
|---|
2/18 | 13,278 | 12,849 | 13,765 |
|---|
3/18 | 13,096 | 12,558 | 13,388 |
|---|
4/18 | 13,309 | 12,600 | 13,435 |
|---|
5/18 | 13,685 | 12,922 | 14,024 |
|---|
6/18 | 13,829 | 13,005 | 14,159 |
|---|
7/18 | 14,280 | 13,454 | 14,574 |
|---|
8/18 | 14,794 | 13,918 | 15,371 |
|---|
9/18 | 14,850 | 13,971 | 15,457 |
|---|
10/18 | 13,579 | 12,982 | 14,075 |
|---|
11/18 | 13,992 | 13,246 | 14,224 |
|---|
12/18 | 12,944 | 12,040 | 13,001 |
|---|
1/19 | 14,111 | 13,049 | 14,170 |
|---|
2/19 | 14,620 | 13,491 | 14,677 |
|---|
3/19 | 15,197 | 13,726 | 15,095 |
|---|
4/19 | 16,059 | 14,280 | 15,777 |
|---|
5/19 | 15,333 | 13,370 | 14,780 |
|---|
6/19 | 16,236 | 14,308 | 15,795 |
|---|
7/19 | 16,453 | 14,531 | 16,152 |
|---|
8/19 | 16,555 | 14,265 | 16,028 |
|---|
9/19 | 16,331 | 14,512 | 16,030 |
|---|
10/19 | 16,697 | 14,819 | 16,482 |
|---|
11/19 | 17,322 | 15,379 | 17,213 |
|---|
12/19 | 17,776 | 15,824 | 17,732 |
|---|
1/20 | 18,530 | 15,841 | 18,129 |
|---|
2/20 | 17,407 | 14,546 | 16,894 |
|---|
3/20 | 15,367 | 12,624 | 15,232 |
|---|
4/20 | 17,684 | 14,292 | 17,486 |
|---|
5/20 | 18,914 | 15,046 | 18,660 |
|---|
6/20 | 19,575 | 15,379 | 19,473 |
|---|
7/20 | 20,818 | 16,279 | 20,971 |
|---|
8/20 | 22,752 | 17,474 | 23,135 |
|---|
9/20 | 21,643 | 16,836 | 22,046 |
|---|
10/20 | 20,833 | 16,430 | 21,298 |
|---|
11/20 | 23,043 | 18,364 | 23,478 |
|---|
12/20 | 23,721 | 19,141 | 24,558 |
|---|
1/21 | 22,911 | 18,983 | 24,376 |
|---|
2/21 | 23,618 | 19,533 | 24,371 |
|---|
3/21 | 24,097 | 20,272 | 24,789 |
|---|
4/21 | 26,087 | 21,364 | 26,476 |
|---|
5/21 | 26,094 | 21,465 | 26,110 |
|---|
6/21 | 27,590 | 22,003 | 27,748 |
|---|
7/21 | 28,459 | 22,460 | 28,662 |
|---|
8/21 | 29,410 | 23,110 | 29,734 |
|---|
9/21 | 27,855 | 22,048 | 28,069 |
|---|
10/21 | 29,764 | 23,578 | 30,500 |
|---|
11/21 | 29,115 | 23,262 | 30,686 |
|---|
12/21 | 29,391 | 24,204 | 31,335 |
|---|
1/22 | 26,645 | 22,840 | 28,646 |
|---|
2/22 | 25,055 | 22,213 | 27,429 |
|---|
3/22 | 25,577 | 22,962 | 28,502 |
|---|
4/22 | 22,245 | 20,916 | 25,060 |
|---|
5/22 | 22,142 | 20,884 | 24,478 |
|---|
6/22 | 22,736 | 20,917 | 25,244 |
|---|
8/22 | 21,509 | 20,114 | 24,068 |
|---|
9/22 | 20,188 | 19,717 | 22,998 |
|---|
10/22 | 21,525 | 20,783 | 24,046 |
|---|
11/22 | 20,155 | 19,575 | 22,205 |
|---|
12/22 | 21,877 | 20,887 | 24,056 |
|---|
1/23 | 21,032 | 20,390 | 23,770 |
|---|
2/23 | 21,885 | 21,035 | 25,395 |
|---|
3/23 | 22,364 | 21,296 | 25,646 |
|---|
4/23 | 22,794 | 21,395 | 26,814 |
|---|
5/23 | 24,453 | 22,840 | 28,648 |
|---|
6/23 | 25,138 | 23,625 | 29,613 |
|---|
7/23 | 25,218 | 23,212 | 29,347 |
|---|
9/23 | 23,759 | 22,121 | 27,751 |
|---|
10/23 | 23,735 | 21,587 | 27,356 |
|---|
11/23 | 26,797 | 23,603 | 30,338 |
|---|
12/23 | 27,897 | 24,768 | 31,682 |
|---|
1/24 | 28,606 | 25,113 | 32,472 |
|---|
2/24 | 30,034 | 26,469 | 34,688 |
|---|
3/24 | 30,616 | 27,318 | 35,298 |
|---|
4/24 | 29,284 | 26,155 | 33,801 |
|---|
5/24 | 30,233 | 27,387 | 35,825 |
|---|
6/24 | 31,349 | 28,294 | 38,240 |
|---|
7/24 | 31,548 | 28,705 | 37,590 |
|---|
8/24 | 32,114 | 29,386 | 38,373 |
|---|
9/24 | 32,650 | 30,014 | 39,460 |
|---|
10/24 | 32,199 | 29,804 | 39,329 |
|---|
11/24 | 34,562 | 31,723 | 41,880 |
|---|
12/24 | 33,650 | 30,839 | 42,250 |
|---|
1/25 | 35,199 | 31,820 | 43,085 |
|---|
2/25 | 33,992 | 31,264 | 41,538 |
|---|
3/25 | 32,146 | 29,454 | 38,038 |
|---|
4/25 | 32,845 | 29,279 | 38,712 |
|---|
5/25 | 34,979 | 31,148 | 42,137 |
|---|
6/25 | 36,437 | 32,726 | 44,824 |
|---|
7/25 | 37,774 | 33,453 | 46,516 |
|---|
8/25 | 37,409 | 34,157 | 47,036 |
|---|
9/25 | 37,341 | 35,341 | 49,535 |
|---|
10/25 | 37,645 | 36,104 | 51,334 |
|---|
11/25 | 37,022 | 36,192 | 50,404 |
|---|
12/25 | 36,620 | 36,194 | 50,092 |
|---|
1/26 | 35,905 | 36,692 | 49,334 |
|---|
2/26 | 33,770 | 36,496 | 47,678 |
|---|
3/26 | 31,900 | 34,681 | 45,194 |
|---|
4/26 | 35,832 | 38,185 | 50,570 |
|---|
5/26 | 37,005 | 40,133 | 54,212 |
|---|
6/26 | 34,989 | 39,928 | 52,760 |
|---|
7/26 | 36,565 | 39,788 | 50,250 |
|---|
8/26 | 37,463 | 40,910 | 52,124 |
|---|
|
|
| Average Annual Return [Table Text Block] |
|
Table SummaryName | 1-Year | 5-Year | 10-Year |
|---|
Class C Shares Excluding Sales Charge | -0.57% | 4.65% | 14.12% |
|---|
Class C Shares Including Sales Charge | -1.37% | 4.65% | 14.12% |
|---|
Russell 1000 Index | 19.77% | 12.10% | 15.13% |
|---|
Russell 1000 Growth Index | 10.82% | 11.88% | 17.95% |
|---|
|
|
| No Deduction of Taxes [Text Block] |
|
The graph above represents historical performance of a hypothetical investment of $10,000 in the Fund over the past ten years (or since inception if shorter). The table and graph above do not reflect the impact of taxes. If they did, performance would be lower.
|
|
| Performance Table Market Index Changed [Text Block] |
|
The Russell 1000 Index is the Fund's primary broad-based securities market index. The Russell 1000 Growth Index is included as an additional index for the Fund as it shows how the Fund’s performance compares with the returns of an index of funds with similar investment objectives.
|
|
| Updated Performance Information Location [Text Block] |
|
Visit www.principalam.com/mutualfundperformance for more recent performance information.
|
|
| AssetsNet |
|
$ 6,905,834,000
|
|
| Holdings Count | Holding |
|
39
|
|
| Advisory Fees Paid, Amount |
|
$ 51,161,000
|
|
| InvestmentCompanyPortfolioTurnover |
|
29.40%
|
|
| Additional Fund Statistics [Text Block] |
|
- Net Assets (amount in thousands)$6,905,834
- Total Number of Portfolio Holdings39
- Portfolio Turnover Rate 29.4%
- Total Advisory Fees Paid (amount in thousands)$51,161
|
|
| Holdings [Text Block] |
|
Table SummaryAsset Weighting | Percent of Net Assets |
|---|
Common Stocks | 100.48% | Investment Companies | 0.07% | Other Assets and Liabilities | (0.55)% | Total Net Assets | 100.00% | Table SummarySector | Percent of Net Assets |
|---|
Technology | 32.97% | Communications | 30.57% | Financial | 21.08% | Industrial | 10.60% | Consumer, Non-cyclical | 3.07% | Consumer, Cyclical | 1.85% | Basic Materials | 0.34% | Money Market Funds | 0.07% | Other Assets and Liabilities | (0.55)% | Total Net Assets | 100.00% | |
|
| Material Fund Change [Text Block] |
|
There were no material changes to the Fund for the period September 1, 2025 to August 31, 2026. For more complete information, you may review the Fund's most recent prospectus at www.PrincipalAM.com/prospectuses. |
|
| C000193661 |
|
|
|
| Shareholder Report [Line Items] |
|
|
|
| Fund Name |
|
Blue Chip Fund
|
|
| Class Name |
|
Class J
|
|
| Trading Symbol |
|
PBCJX
|
|
| Annual or Semi-Annual Statement [Text Block] |
|
This annual shareholder report contains important information about Blue Chip Fund (the "Fund") for the period of September 1, 2025 to August 31, 2026.
|
|
| Shareholder Report Annual or Semi-Annual |
|
Annual Shareholder Report
|
|
| Additional Information [Text Block] |
|
You can find additional information about the Fund at www.PrincipalAM.com/prospectuses or you can request information by contacting us at 1-800-222-5852 or emailing prospectus@principalfunds.com.
|
|
| Additional Information Phone Number |
|
1-800-222-5852
|
|
| Additional Information Email |
|
<span style="box-sizing: border-box; color: rgb(0, 0, 0); display: inline; flex-wrap: nowrap; font-size: 10.6667px; font-weight: 400; grid-area: auto; line-height: 16px; margin: 0px; overflow: visible; text-align: left; text-align-last: auto; white-space-collapse: preserve-breaks;">prospectus@principalfunds.com</span>
|
|
| Additional Information Website |
|
<span style="box-sizing: border-box; color: rgb(0, 0, 0); display: inline; flex-wrap: nowrap; font-size: 10.6667px; font-weight: 400; grid-area: auto; line-height: 16px; margin: 0px; overflow: visible; text-align: left; text-align-last: auto; white-space-collapse: preserve-breaks;">www.PrincipalAM.com/prospectuses</span>
|
|
| Expenses [Text Block] |
|
What were the Fund costs for the last year? (based on a hypothetical $10,000 investment) Table SummaryClass Name | Costs of a $10,000 investment | Costs paid as a percentage of a $10,000 investment |
|---|
Class J | $77 | 0.77% |
|---|
|
|
| Expenses Paid, Amount |
|
$ 77
|
|
| Expense Ratio, Percent |
|
0.77%
|
|
| Factors Affecting Performance [Text Block] |
|
Management’s Discussion of Fund PerformanceThe Fund seeks long-term growth of capital. The Fund normally invests at least 80% of its net assets in equity securities of companies with large market capitalizations that, in the Fund's investment advisor's opinion, display characteristics of a "blue chip" company. The advisor tends to focus on securities of companies that show potential for growth of capital as well as an expectation for above average earnings. The Fund also invests in securities of foreign companies. Over the year, the Fund's investments benefited from strong company selection in consumer discretionary, where Amazon.com, Inc. and DoorDash, Inc. were among the top contributors to relative results versus the Russell 1000 Growth Index (“Index”). Amazon.com, Inc. reported accelerated growth in its cloud business, Amazon Web Services, as demand for AI-related compute continued to build. DoorDash, Inc. also delivered strong results, supported by expansion beyond restaurant delivery into newer verticals such as grocery and retail, which meaningfully increased its addressable market. These gains were offset by weaker company selection in information technology, where the Fund had less exposure to some of the market’s most powerful AI-led winners, including semiconductors, semiconductor equipment, and electrical components. Several software holdings also came under pressure, including Roper Technologies, Inc. and Cadence Design Systems, Inc., as investors questioned whether AI could increase competition or disrupt existing business models. Allocation to financial companies was another relative headwind, with alternative asset managers Brookfield Corp. and KKR & Co., Inc. detracting from performance. CoStar Group, Inc., a commercial real estate data and analytics provider, weighed on results as the company continued to absorb elevated investment spending tied to the buildout of its Homes.com business. |
|
| Performance Past Does Not Indicate Future [Text] |
|
Past performance is not a good predictor of the Fund's future performance.
|
|
| Line Graph [Table Text Block] |
|
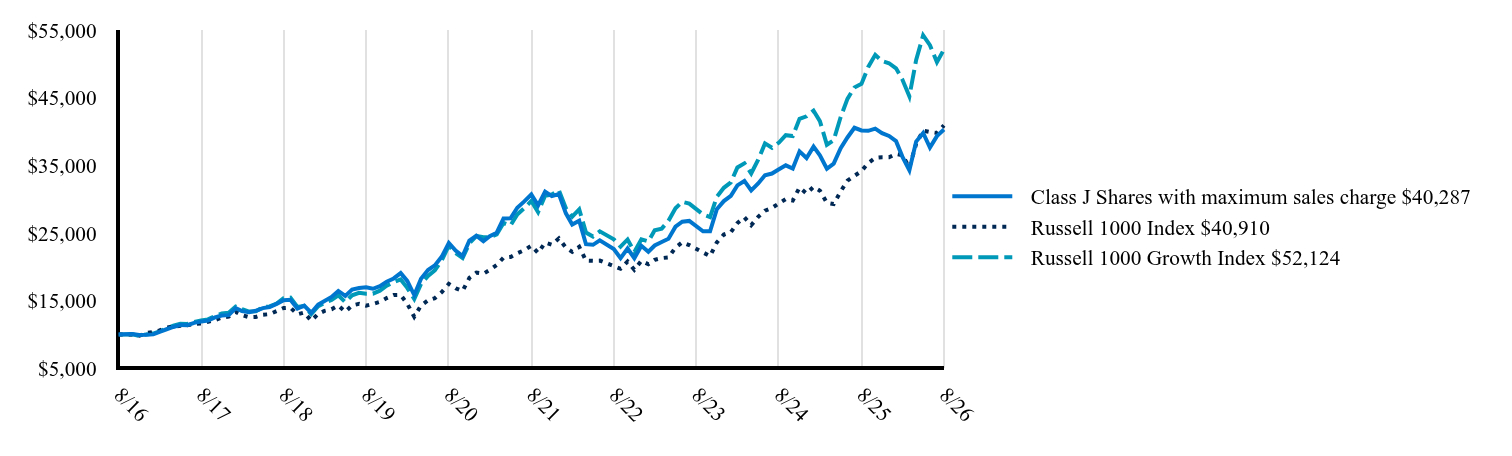 Table Summary | Class J Shares with maximum sales charge $40,287 | Russell 1000 Index $40,910 | Russell 1000 Growth Index $52,124 |
|---|
8/16 | 10,000 | 10,000 | 10,000 |
|---|
10/16 | 10,085 | 10,008 | 10,037 |
|---|
11/16 | 9,935 | 9,813 | 9,801 |
|---|
12/16 | 9,950 | 10,200 | 10,014 |
|---|
1/17 | 10,017 | 10,391 | 10,138 |
|---|
2/17 | 10,400 | 10,600 | 10,480 |
|---|
3/17 | 10,776 | 11,010 | 10,915 |
|---|
4/17 | 11,114 | 11,134 | 11,294 |
|---|
5/17 | 11,419 | 11,276 | 11,587 |
|---|
6/17 | 11,374 | 11,355 | 11,557 |
|---|
7/17 | 11,726 | 11,580 | 11,864 |
|---|
8/17 | 11,900 | 11,616 | 12,082 |
|---|
9/17 | 12,047 | 11,863 | 12,239 |
|---|
10/17 | 12,538 | 12,135 | 12,713 |
|---|
11/17 | 12,799 | 12,505 | 13,099 |
|---|
12/17 | 12,862 | 12,645 | 13,201 |
|---|
1/18 | 13,896 | 13,339 | 14,136 |
|---|
2/18 | 13,452 | 12,849 | 13,765 |
|---|
3/18 | 13,282 | 12,558 | 13,388 |
|---|
4/18 | 13,507 | 12,600 | 13,435 |
|---|
5/18 | 13,903 | 12,922 | 14,024 |
|---|
6/18 | 14,055 | 13,005 | 14,159 |
|---|
7/18 | 14,523 | 13,454 | 14,574 |
|---|
8/18 | 15,052 | 13,918 | 15,371 |
|---|
9/18 | 15,125 | 13,971 | 15,457 |
|---|
10/18 | 13,842 | 12,982 | 14,075 |
|---|
11/18 | 14,274 | 13,246 | 14,224 |
|---|
12/18 | 13,213 | 12,040 | 13,001 |
|---|
1/19 | 14,415 | 13,049 | 14,170 |
|---|
2/19 | 14,947 | 13,491 | 14,677 |
|---|
3/19 | 15,544 | 13,726 | 15,095 |
|---|
4/19 | 16,438 | 14,280 | 15,777 |
|---|
5/19 | 15,702 | 13,370 | 14,780 |
|---|
6/19 | 16,635 | 14,308 | 15,795 |
|---|
7/19 | 16,871 | 14,531 | 16,152 |
|---|
8/19 | 16,983 | 14,265 | 16,028 |
|---|
9/19 | 16,759 | 14,512 | 16,030 |
|---|
10/19 | 17,147 | 14,819 | 16,482 |
|---|
11/19 | 17,804 | 15,379 | 17,213 |
|---|
12/19 | 18,284 | 15,824 | 17,732 |
|---|
1/20 | 19,074 | 15,841 | 18,129 |
|---|
2/20 | 17,921 | 14,546 | 16,894 |
|---|
3/20 | 15,834 | 12,624 | 15,232 |
|---|
4/20 | 18,236 | 14,292 | 17,486 |
|---|
5/20 | 19,520 | 15,046 | 18,660 |
|---|
6/20 | 20,213 | 15,379 | 19,473 |
|---|
7/20 | 21,517 | 16,279 | 20,971 |
|---|
8/20 | 23,535 | 17,474 | 23,135 |
|---|
9/20 | 22,396 | 16,836 | 22,046 |
|---|
10/20 | 21,579 | 16,430 | 21,298 |
|---|
11/20 | 23,885 | 18,364 | 23,478 |
|---|
12/20 | 24,609 | 19,141 | 24,558 |
|---|
1/21 | 23,778 | 18,983 | 24,376 |
|---|
2/21 | 24,531 | 19,533 | 24,371 |
|---|
3/21 | 25,049 | 20,272 | 24,789 |
|---|
4/21 | 27,136 | 21,364 | 26,476 |
|---|
5/21 | 27,164 | 21,465 | 26,110 |
|---|
6/21 | 28,740 | 22,003 | 27,748 |
|---|
7/21 | 29,670 | 22,460 | 28,662 |
|---|
8/21 | 30,685 | 23,110 | 29,734 |
|---|
9/21 | 29,088 | 22,048 | 28,069 |
|---|
10/21 | 31,096 | 23,578 | 30,500 |
|---|
11/21 | 30,443 | 23,262 | 30,686 |
|---|
12/21 | 30,760 | 24,204 | 31,335 |
|---|
1/22 | 27,910 | 22,840 | 28,646 |
|---|
2/22 | 26,251 | 22,213 | 27,429 |
|---|
3/22 | 26,827 | 22,962 | 28,502 |
|---|
4/22 | 23,348 | 20,916 | 25,060 |
|---|
5/22 | 23,257 | 20,884 | 24,478 |
|---|
6/22 | 23,917 | 20,917 | 25,244 |
|---|
8/22 | 22,636 | 20,114 | 24,068 |
|---|
9/22 | 21,287 | 19,717 | 22,998 |
|---|
10/22 | 22,712 | 20,783 | 24,046 |
|---|
11/22 | 21,279 | 19,575 | 22,205 |
|---|
12/22 | 23,110 | 20,887 | 24,056 |
|---|
1/23 | 22,240 | 20,390 | 23,770 |
|---|
2/23 | 23,156 | 21,035 | 25,395 |
|---|
3/23 | 23,682 | 21,296 | 25,646 |
|---|
4/23 | 24,155 | 21,395 | 26,814 |
|---|
5/23 | 25,933 | 22,840 | 28,648 |
|---|
6/23 | 26,673 | 23,625 | 29,613 |
|---|
7/23 | 26,787 | 23,212 | 29,347 |
|---|
9/23 | 25,254 | 22,121 | 27,751 |
|---|
10/23 | 25,246 | 21,587 | 27,356 |
|---|
11/23 | 28,527 | 23,603 | 30,338 |
|---|
12/23 | 29,717 | 24,768 | 31,682 |
|---|
1/24 | 30,503 | 25,113 | 32,472 |
|---|
2/24 | 32,044 | 26,469 | 34,688 |
|---|
3/24 | 32,692 | 27,318 | 35,298 |
|---|
4/24 | 31,289 | 26,155 | 33,801 |
|---|
5/24 | 32,326 | 27,387 | 35,825 |
|---|
6/24 | 33,539 | 28,294 | 38,240 |
|---|
7/24 | 33,783 | 28,705 | 37,590 |
|---|
8/24 | 34,417 | 29,386 | 38,373 |
|---|
9/24 | 35,004 | 30,014 | 39,460 |
|---|
10/24 | 34,531 | 29,804 | 39,329 |
|---|
11/24 | 37,064 | 31,723 | 41,880 |
|---|
12/24 | 36,084 | 30,839 | 42,250 |
|---|
1/25 | 37,756 | 31,820 | 43,085 |
|---|
2/25 | 36,474 | 31,264 | 41,538 |
|---|
3/25 | 34,492 | 29,454 | 38,038 |
|---|
4/25 | 35,248 | 29,279 | 38,712 |
|---|
5/25 | 37,541 | 31,148 | 42,137 |
|---|
6/25 | 39,118 | 32,726 | 44,824 |
|---|
7/25 | 40,551 | 33,453 | 46,516 |
|---|
8/25 | 40,161 | 34,157 | 47,036 |
|---|
9/25 | 40,097 | 35,341 | 49,535 |
|---|
10/25 | 40,423 | 36,104 | 51,334 |
|---|
11/25 | 39,763 | 36,192 | 50,404 |
|---|
12/25 | 39,341 | 36,194 | 50,092 |
|---|
1/26 | 38,576 | 36,692 | 49,334 |
|---|
2/26 | 36,291 | 36,496 | 47,678 |
|---|
3/26 | 34,284 | 34,681 | 45,194 |
|---|
4/26 | 38,509 | 38,185 | 50,570 |
|---|
5/26 | 39,781 | 40,133 | 54,212 |
|---|
6/26 | 37,620 | 39,928 | 52,760 |
|---|
7/26 | 39,322 | 39,788 | 50,250 |
|---|
8/26 | 40,287 | 40,910 | 52,124 |
|---|
|
|
| Average Annual Return [Table Text Block] |
|
Table SummaryName | 1-Year | 5-Year | 10-YearFootnote Reference* |
|---|
Class J Shares Excluding Sales Charge | 0.32% | 5.60% | 14.95% |
|---|
Class J Shares Including Sales Charge | -0.52% | 5.60% | 14.95% |
|---|
Russell 1000 Index | 19.77% | 12.10% | 15.13% |
|---|
Russell 1000 Growth Index | 10.82% | 11.88% | 17.95% |
|---|
|
|
| Performance Inception Date |
|
Jun. 14, 2012
|
|
| No Deduction of Taxes [Text Block] |
|
The graph above represents historical performance of a hypothetical investment of $10,000 in the Fund over the past ten years (or since inception if shorter). The table and graph above do not reflect the impact of taxes. If they did, performance would be lower.
|
|
| Performance Table Market Index Changed [Text Block] |
|
The Russell 1000 Index is the Fund's primary broad-based securities market index. The Russell 1000 Growth Index is included as an additional index for the Fund as it shows how the Fund’s performance compares with the returns of an index of funds with similar investment objectives.
|
|
| Updated Performance Information Location [Text Block] |
|
Visit www.principalam.com/mutualfundperformance for more recent performance information.
|
|
| AssetsNet |
|
$ 6,905,834,000
|
|
| Holdings Count | Holding |
|
39
|
|
| Advisory Fees Paid, Amount |
|
$ 51,161,000
|
|
| InvestmentCompanyPortfolioTurnover |
|
29.40%
|
|
| Additional Fund Statistics [Text Block] |
|
- Net Assets (amount in thousands)$6,905,834
- Total Number of Portfolio Holdings39
- Portfolio Turnover Rate 29.4%
- Total Advisory Fees Paid (amount in thousands)$51,161
|
|
| Holdings [Text Block] |
|
Table SummaryAsset Weighting | Percent of Net Assets |
|---|
Common Stocks | 100.48% | Investment Companies | 0.07% | Other Assets and Liabilities | (0.55)% | Total Net Assets | 100.00% | Table SummarySector | Percent of Net Assets |
|---|
Technology | 32.97% | Communications | 30.57% | Financial | 21.08% | Industrial | 10.60% | Consumer, Non-cyclical | 3.07% | Consumer, Cyclical | 1.85% | Basic Materials | 0.34% | Money Market Funds | 0.07% | Other Assets and Liabilities | (0.55)% | Total Net Assets | 100.00% | |
|
| Material Fund Change [Text Block] |
|
There were no material changes to the Fund for the period September 1, 2025 to August 31, 2026. For more complete information, you may review the Fund's most recent prospectus at www.PrincipalAM.com/prospectuses. |
|
| C000115413 |
|
|
|
| Shareholder Report [Line Items] |
|
|
|
| Fund Name |
|
Blue Chip Fund
|
|
| Class Name |
|
Institutional
|
|
| Trading Symbol |
|
PBCKX
|
|
| Annual or Semi-Annual Statement [Text Block] |
|
This annual shareholder report contains important information about Blue Chip Fund (the "Fund") for the period of September 1, 2025 to August 31, 2026.
|
|
| Shareholder Report Annual or Semi-Annual |
|
Annual Shareholder Report
|
|
| Additional Information [Text Block] |
|
You can find additional information about the Fund at www.PrincipalAM.com/prospectuses or you can request information by contacting us at 1-800-222-5852 or emailing prospectus@principalfunds.com.
|
|
| Additional Information Phone Number |
|
1-800-222-5852
|
|
| Additional Information Email |
|
<span style="box-sizing: border-box; color: rgb(0, 0, 0); display: inline; flex-wrap: nowrap; font-size: 10.6667px; font-weight: 400; grid-area: auto; line-height: 16px; margin: 0px; overflow: visible; text-align: left; text-align-last: auto; white-space-collapse: preserve-breaks;">prospectus@principalfunds.com</span>
|
|
| Additional Information Website |
|
<span style="box-sizing: border-box; color: rgb(0, 0, 0); display: inline; flex-wrap: nowrap; font-size: 10.6667px; font-weight: 400; grid-area: auto; line-height: 16px; margin: 0px; overflow: visible; text-align: left; text-align-last: auto; white-space-collapse: preserve-breaks;">www.PrincipalAM.com/prospectuses</span>
|
|
| Expenses [Text Block] |
|
What were the Fund costs for the last year? (based on a hypothetical $10,000 investment) Table SummaryClass Name | Costs of a $10,000 investment | Costs paid as a percentage of a $10,000 investment |
|---|
Institutional | $66 | 0.66% |
|---|
|
|
| Expenses Paid, Amount |
|
$ 66
|
|
| Expense Ratio, Percent |
|
0.66%
|
|
| Factors Affecting Performance [Text Block] |
|
Management’s Discussion of Fund PerformanceThe Fund seeks long-term growth of capital. The Fund normally invests at least 80% of its net assets in equity securities of companies with large market capitalizations that, in the Fund's investment advisor's opinion, display characteristics of a "blue chip" company. The advisor tends to focus on securities of companies that show potential for growth of capital as well as an expectation for above average earnings. The Fund also invests in securities of foreign companies. Over the year, the Fund's investments benefited from strong company selection in consumer discretionary, where Amazon.com, Inc. and DoorDash, Inc. were among the top contributors to relative results versus the Russell 1000 Growth Index (“Index”). Amazon.com, Inc. reported accelerated growth in its cloud business, Amazon Web Services, as demand for AI-related compute continued to build. DoorDash, Inc. also delivered strong results, supported by expansion beyond restaurant delivery into newer verticals such as grocery and retail, which meaningfully increased its addressable market. These gains were offset by weaker company selection in information technology, where the Fund had less exposure to some of the market’s most powerful AI-led winners, including semiconductors, semiconductor equipment, and electrical components. Several software holdings also came under pressure, including Roper Technologies, Inc. and Cadence Design Systems, Inc., as investors questioned whether AI could increase competition or disrupt existing business models. Allocation to financial companies was another relative headwind, with alternative asset managers Brookfield Corp. and KKR & Co., Inc. detracting from performance. CoStar Group, Inc., a commercial real estate data and analytics provider, weighed on results as the company continued to absorb elevated investment spending tied to the buildout of its Homes.com business. |
|
| Performance Past Does Not Indicate Future [Text] |
|
Past performance is not a good predictor of the Fund's future performance.
|
|
| Line Graph [Table Text Block] |
|
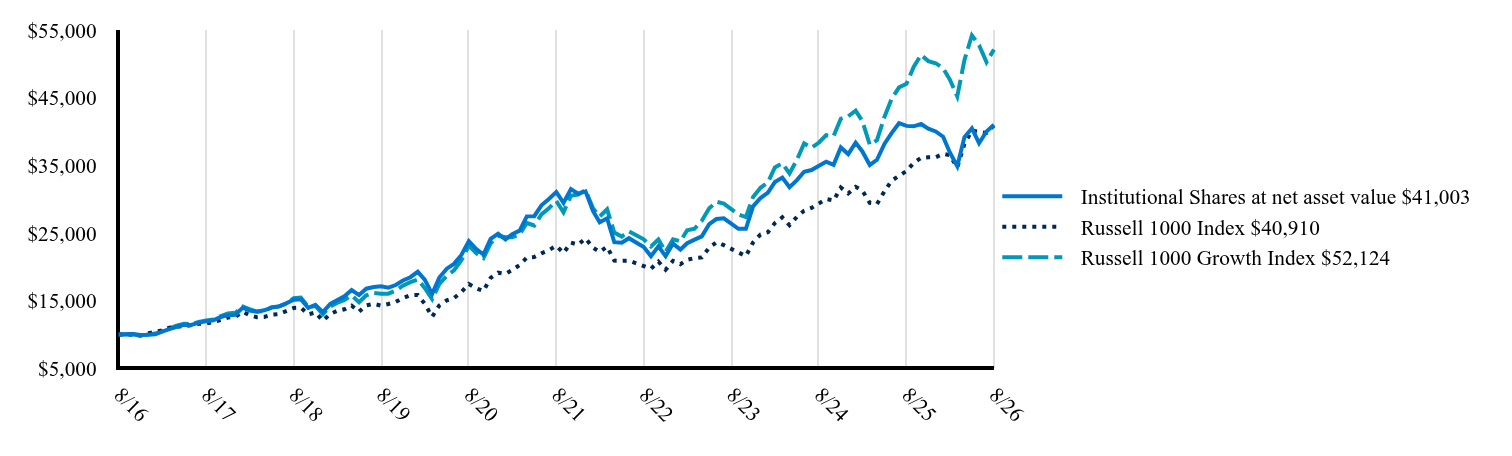 Table Summary | Institutional Shares at net asset value $41,003 | Russell 1000 Index $40,910 | Russell 1000 Growth Index $52,124 |
|---|
8/16 | 10,000 | 10,000 | 10,000 |
|---|
10/16 | 10,088 | 10,008 | 10,037 |
|---|
11/16 | 9,941 | 9,813 | 9,801 |
|---|
12/16 | 9,959 | 10,200 | 10,014 |
|---|
1/17 | 10,029 | 10,391 | 10,138 |
|---|
2/17 | 10,415 | 10,600 | 10,480 |
|---|
3/17 | 10,795 | 11,010 | 10,915 |
|---|
4/17 | 11,140 | 11,134 | 11,294 |
|---|
5/17 | 11,449 | 11,276 | 11,587 |
|---|
6/17 | 11,407 | 11,355 | 11,557 |
|---|
7/17 | 11,763 | 11,580 | 11,864 |
|---|
8/17 | 11,942 | 11,616 | 12,082 |
|---|
9/17 | 12,096 | 11,863 | 12,239 |
|---|
10/17 | 12,589 | 12,135 | 12,713 |
|---|
11/17 | 12,857 | 12,505 | 13,099 |
|---|
12/17 | 12,923 | 12,645 | 13,201 |
|---|
1/18 | 13,967 | 13,339 | 14,136 |
|---|
2/18 | 13,521 | 12,849 | 13,765 |
|---|
3/18 | 13,356 | 12,558 | 13,388 |
|---|
4/18 | 13,582 | 12,600 | 13,435 |
|---|
5/18 | 13,979 | 12,922 | 14,024 |
|---|
6/18 | 14,138 | 13,005 | 14,159 |
|---|
7/18 | 14,608 | 13,454 | 14,574 |
|---|
8/18 | 15,152 | 13,918 | 15,371 |
|---|
9/18 | 15,219 | 13,971 | 15,457 |
|---|
10/18 | 13,937 | 12,982 | 14,075 |
|---|
11/18 | 14,370 | 13,246 | 14,224 |
|---|
12/18 | 13,306 | 12,040 | 13,001 |
|---|
1/19 | 14,518 | 13,049 | 14,170 |
|---|
2/19 | 15,059 | 13,491 | 14,677 |
|---|
3/19 | 15,658 | 13,726 | 15,095 |
|---|
4/19 | 16,568 | 14,280 | 15,777 |
|---|
5/19 | 15,830 | 13,370 | 14,780 |
|---|
6/19 | 16,772 | 14,308 | 15,795 |
|---|
7/19 | 17,016 | 14,531 | 16,152 |
|---|
8/19 | 17,134 | 14,265 | 16,028 |
|---|
9/19 | 16,917 | 14,512 | 16,030 |
|---|
10/19 | 17,312 | 14,819 | 16,482 |
|---|
11/19 | 17,978 | 15,379 | 17,213 |
|---|
12/19 | 18,467 | 15,824 | 17,732 |
|---|
1/20 | 19,267 | 15,841 | 18,129 |
|---|
2/20 | 18,108 | 14,546 | 16,894 |
|---|
3/20 | 16,002 | 12,624 | 15,232 |
|---|
4/20 | 18,425 | 14,292 | 17,486 |
|---|
5/20 | 19,730 | 15,046 | 18,660 |
|---|
6/20 | 20,434 | 15,379 | 19,473 |
|---|
7/20 | 21,753 | 16,279 | 20,971 |
|---|
8/20 | 23,796 | 17,474 | 23,135 |
|---|
9/20 | 22,643 | 16,836 | 22,046 |
|---|
10/20 | 21,822 | 16,430 | 21,298 |
|---|
11/20 | 24,155 | 18,364 | 23,478 |
|---|
12/20 | 24,890 | 19,141 | 24,558 |
|---|
1/21 | 24,055 | 18,983 | 24,376 |
|---|
2/21 | 24,819 | 19,533 | 24,371 |
|---|
3/21 | 25,347 | 20,272 | 24,789 |
|---|
4/21 | 27,460 | 21,364 | 26,476 |
|---|
5/21 | 27,488 | 21,465 | 26,110 |
|---|
6/21 | 29,087 | 22,003 | 27,748 |
|---|
7/21 | 30,029 | 22,460 | 28,662 |
|---|
8/21 | 31,057 | 23,110 | 29,734 |
|---|
9/21 | 29,444 | 22,048 | 28,069 |
|---|
10/21 | 31,478 | 23,578 | 30,500 |
|---|
11/21 | 30,822 | 23,262 | 30,686 |
|---|
12/21 | 31,147 | 24,204 | 31,335 |
|---|
1/22 | 28,260 | 22,840 | 28,646 |
|---|
2/22 | 26,584 | 22,213 | 27,429 |
|---|
3/22 | 27,171 | 22,962 | 28,502 |
|---|
4/22 | 23,644 | 20,916 | 25,060 |
|---|
5/22 | 23,560 | 20,884 | 24,478 |
|---|
6/22 | 24,231 | 20,917 | 25,244 |
|---|
8/22 | 22,943 | 20,114 | 24,068 |
|---|
9/22 | 21,572 | 19,717 | 22,998 |
|---|
10/22 | 23,019 | 20,783 | 24,046 |
|---|
11/22 | 21,571 | 19,575 | 22,205 |
|---|
12/22 | 23,435 | 20,887 | 24,056 |
|---|
1/23 | 22,553 | 20,390 | 23,770 |
|---|
2/23 | 23,481 | 21,035 | 25,395 |
|---|
3/23 | 24,018 | 21,296 | 25,646 |
|---|
4/23 | 24,501 | 21,395 | 26,814 |
|---|
5/23 | 26,303 | 22,840 | 28,648 |
|---|
6/23 | 27,062 | 23,625 | 29,613 |
|---|
7/23 | 27,177 | 23,212 | 29,347 |
|---|
9/23 | 25,628 | 22,121 | 27,751 |
|---|
10/23 | 25,620 | 21,587 | 27,356 |
|---|
11/23 | 28,948 | 23,603 | 30,338 |
|---|
12/23 | 30,168 | 24,768 | 31,682 |
|---|
1/24 | 30,958 | 25,113 | 32,472 |
|---|
2/24 | 32,530 | 26,469 | 34,688 |
|---|
3/24 | 33,189 | 27,318 | 35,298 |
|---|
4/24 | 31,770 | 26,155 | 33,801 |
|---|
5/24 | 32,821 | 27,387 | 35,825 |
|---|
6/24 | 34,056 | 28,294 | 38,240 |
|---|
7/24 | 34,309 | 28,705 | 37,590 |
|---|
8/24 | 34,953 | 29,386 | 38,373 |
|---|
9/24 | 35,543 | 30,014 | 39,460 |
|---|
10/24 | 35,068 | 29,804 | 39,329 |
|---|
11/24 | 37,645 | 31,723 | 41,880 |
|---|
12/24 | 36,660 | 30,839 | 42,250 |
|---|
1/25 | 38,357 | 31,820 | 43,085 |
|---|
2/25 | 37,053 | 31,264 | 41,538 |
|---|
3/25 | 35,052 | 29,454 | 38,038 |
|---|
4/25 | 35,820 | 29,279 | 38,712 |
|---|
5/25 | 38,157 | 31,148 | 42,137 |
|---|
6/25 | 39,757 | 32,726 | 44,824 |
|---|
7/25 | 41,221 | 33,453 | 46,516 |
|---|
8/25 | 40,829 | 34,157 | 47,036 |
|---|
9/25 | 40,765 | 35,341 | 49,535 |
|---|
10/25 | 41,101 | 36,104 | 51,334 |
|---|
11/25 | 40,429 | 36,192 | 50,404 |
|---|
12/25 | 40,006 | 36,194 | 50,092 |
|---|
1/26 | 39,230 | 36,692 | 49,334 |
|---|
2/26 | 36,910 | 36,496 | 47,678 |
|---|
3/26 | 34,878 | 34,681 | 45,194 |
|---|
4/26 | 39,172 | 38,185 | 50,570 |
|---|
5/26 | 40,476 | 40,133 | 54,212 |
|---|
6/26 | 38,271 | 39,928 | 52,760 |
|---|
7/26 | 40,006 | 39,788 | 50,250 |
|---|
8/26 | 41,003 | 40,910 | 52,124 |
|---|
|
|
| Average Annual Return [Table Text Block] |
|
Table SummaryName | 1-Year | 5-Year | 10-Year |
|---|
Institutional Shares | 0.43% | 5.71% | 15.15% |
|---|
Russell 1000 Index | 19.77% | 12.10% | 15.13% |
|---|
Russell 1000 Growth Index | 10.82% | 11.88% | 17.95% |
|---|
|
|
| No Deduction of Taxes [Text Block] |
|
The graph above represents historical performance of a hypothetical investment of $10,000 in the Fund over the past ten years (or since inception if shorter). The table and graph above do not reflect the impact of taxes. If they did, performance would be lower.
|
|
| Performance Table Market Index Changed [Text Block] |
|
The Russell 1000 Index is the Fund's primary broad-based securities market index. The Russell 1000 Growth Index is included as an additional index for the Fund as it shows how the Fund’s performance compares with the returns of an index of funds with similar investment objectives.
|
|
| Updated Performance Information Location [Text Block] |
|
Visit www.principalam.com/mutualfundperformance for more recent performance information.
|
|
| AssetsNet |
|
$ 6,905,834,000
|
|
| Holdings Count | Holding |
|
39
|
|
| Advisory Fees Paid, Amount |
|
$ 51,161,000
|
|
| InvestmentCompanyPortfolioTurnover |
|
29.40%
|
|
| Additional Fund Statistics [Text Block] |
|
- Net Assets (amount in thousands)$6,905,834
- Total Number of Portfolio Holdings39
- Portfolio Turnover Rate 29.4%
- Total Advisory Fees Paid (amount in thousands)$51,161
|
|
| Holdings [Text Block] |
|
Table SummaryAsset Weighting | Percent of Net Assets |
|---|
Common Stocks | 100.48% | Investment Companies | 0.07% | Other Assets and Liabilities | (0.55)% | Total Net Assets | 100.00% | Table SummarySector | Percent of Net Assets |
|---|
Technology | 32.97% | Communications | 30.57% | Financial | 21.08% | Industrial | 10.60% | Consumer, Non-cyclical | 3.07% | Consumer, Cyclical | 1.85% | Basic Materials | 0.34% | Money Market Funds | 0.07% | Other Assets and Liabilities | (0.55)% | Total Net Assets | 100.00% | |
|
| Material Fund Change [Text Block] |
|
There were no material changes to the Fund for the period September 1, 2025 to August 31, 2026. For more complete information, you may review the Fund's most recent prospectus at www.PrincipalAM.com/prospectuses. |
|
| C000167694 |
|
|
|
| Shareholder Report [Line Items] |
|
|
|
| Fund Name |
|
Blue Chip Fund
|
|
| Class Name |
|
R-3
|
|
| Trading Symbol |
|
PGBEX
|
|
| Annual or Semi-Annual Statement [Text Block] |
|
This annual shareholder report contains important information about Blue Chip Fund (the "Fund") for the period of September 1, 2025 to August 31, 2026.
|
|
| Shareholder Report Annual or Semi-Annual |
|
Annual Shareholder Report
|
|
| Additional Information [Text Block] |
|
You can find additional information about the Fund at www.PrincipalAM.com/prospectuses or you can request information by contacting us at 1-800-222-5852 or emailing prospectus@principalfunds.com.
|
|
| Additional Information Phone Number |
|
1-800-222-5852
|
|
| Additional Information Email |
|
<span style="box-sizing: border-box; color: rgb(0, 0, 0); display: inline; flex-wrap: nowrap; font-size: 10.6667px; font-weight: 400; grid-area: auto; line-height: 16px; margin: 0px; overflow: visible; text-align: left; text-align-last: auto; white-space-collapse: preserve-breaks;">prospectus@principalfunds.com</span>
|
|
| Additional Information Website |
|
<span style="box-sizing: border-box; color: rgb(0, 0, 0); display: inline; flex-wrap: nowrap; font-size: 10.6667px; font-weight: 400; grid-area: auto; line-height: 16px; margin: 0px; overflow: visible; text-align: left; text-align-last: auto; white-space-collapse: preserve-breaks;">www.PrincipalAM.com/prospectuses</span>
|
|
| Expenses [Text Block] |
|
What were the Fund costs for the last year? (based on a hypothetical $10,000 investment) Table SummaryClass Name | Costs of a $10,000 investment | Costs paid as a percentage of a $10,000 investment |
|---|
R-3 | $114 | 1.14% |
|---|
|
|
| Expenses Paid, Amount |
|
$ 114
|
|
| Expense Ratio, Percent |
|
1.14%
|
|
| Factors Affecting Performance [Text Block] |
|
Management’s Discussion of Fund PerformanceThe Fund seeks long-term growth of capital. The Fund normally invests at least 80% of its net assets in equity securities of companies with large market capitalizations that, in the Fund's investment advisor's opinion, display characteristics of a "blue chip" company. The advisor tends to focus on securities of companies that show potential for growth of capital as well as an expectation for above average earnings. The Fund also invests in securities of foreign companies. Over the year, the Fund's investments benefited from strong company selection in consumer discretionary, where Amazon.com, Inc. and DoorDash, Inc. were among the top contributors to relative results versus the Russell 1000 Growth Index (“Index”). Amazon.com, Inc. reported accelerated growth in its cloud business, Amazon Web Services, as demand for AI-related compute continued to build. DoorDash, Inc. also delivered strong results, supported by expansion beyond restaurant delivery into newer verticals such as grocery and retail, which meaningfully increased its addressable market. These gains were offset by weaker company selection in information technology, where the Fund had less exposure to some of the market’s most powerful AI-led winners, including semiconductors, semiconductor equipment, and electrical components. Several software holdings also came under pressure, including Roper Technologies, Inc. and Cadence Design Systems, Inc., as investors questioned whether AI could increase competition or disrupt existing business models. Allocation to financial companies was another relative headwind, with alternative asset managers Brookfield Corp. and KKR & Co., Inc. detracting from performance. CoStar Group, Inc., a commercial real estate data and analytics provider, weighed on results as the company continued to absorb elevated investment spending tied to the buildout of its Homes.com business. |
|
| Performance Past Does Not Indicate Future [Text] |
|
Past performance is not a good predictor of the Fund's future performance.
|
|
| Line Graph [Table Text Block] |
|
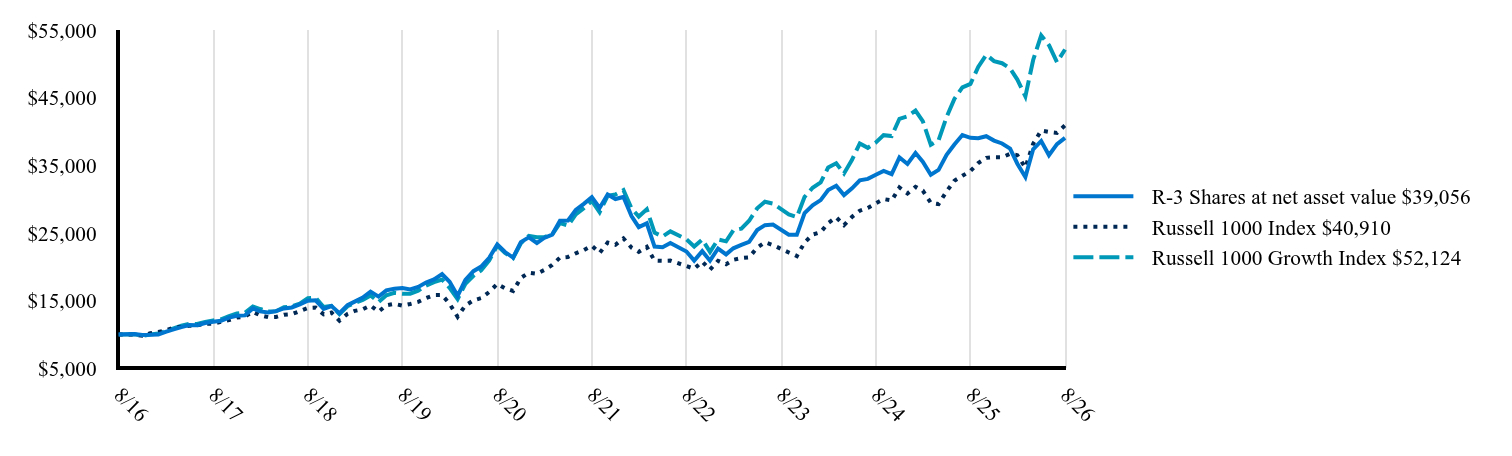 Table Summary | R-3 Shares at net asset value $39,056 | Russell 1000 Index $40,910 | Russell 1000 Growth Index $52,124 |
|---|
8/16 | 10,000 | 10,000 | 10,000 |
|---|
10/16 | 10,083 | 10,008 | 10,037 |
|---|
11/16 | 9,929 | 9,813 | 9,801 |
|---|
12/16 | 9,947 | 10,200 | 10,014 |
|---|
1/17 | 10,012 | 10,391 | 10,138 |
|---|
2/17 | 10,392 | 10,600 | 10,480 |
|---|
3/17 | 10,767 | 11,010 | 10,915 |
|---|
4/17 | 11,099 | 11,134 | 11,294 |
|---|
5/17 | 11,396 | 11,276 | 11,587 |
|---|
6/17 | 11,354 | 11,355 | 11,557 |
|---|
7/17 | 11,705 | 11,580 | 11,864 |
|---|
8/17 | 11,877 | 11,616 | 12,082 |
|---|
9/17 | 12,025 | 11,863 | 12,239 |
|---|
10/17 | 12,506 | 12,135 | 12,713 |
|---|
11/17 | 12,768 | 12,505 | 13,099 |
|---|
12/17 | 12,825 | 12,645 | 13,201 |
|---|
1/18 | 13,857 | 13,339 | 14,136 |
|---|
2/18 | 13,411 | 12,849 | 13,765 |
|---|
3/18 | 13,240 | 12,558 | 13,388 |
|---|
4/18 | 13,460 | 12,600 | 13,435 |
|---|
5/18 | 13,851 | 12,922 | 14,024 |
|---|
6/18 | 13,997 | 13,005 | 14,159 |
|---|
7/18 | 14,461 | 13,454 | 14,574 |
|---|
8/18 | 14,986 | 13,918 | 15,371 |
|---|
9/18 | 15,053 | 13,971 | 15,457 |
|---|
10/18 | 13,777 | 12,982 | 14,075 |
|---|
11/18 | 14,199 | 13,246 | 14,224 |
|---|
12/18 | 13,147 | 12,040 | 13,001 |
|---|
1/19 | 14,334 | 13,049 | 14,170 |
|---|
2/19 | 14,861 | 13,491 | 14,677 |
|---|
3/19 | 15,448 | 13,726 | 15,095 |
|---|
4/19 | 16,338 | 14,280 | 15,777 |
|---|
5/19 | 15,599 | 13,370 | 14,780 |
|---|
6/19 | 16,529 | 14,308 | 15,795 |
|---|
7/19 | 16,766 | 14,531 | 16,152 |
|---|
8/19 | 16,872 | 14,265 | 16,028 |
|---|
9/19 | 16,654 | 14,512 | 16,030 |
|---|
10/19 | 17,030 | 14,819 | 16,482 |
|---|
11/19 | 17,683 | 15,379 | 17,213 |
|---|
12/19 | 18,151 | 15,824 | 17,732 |
|---|
1/20 | 18,930 | 15,841 | 18,129 |
|---|
2/20 | 17,786 | 14,546 | 16,894 |
|---|
3/20 | 15,713 | 12,624 | 15,232 |
|---|
4/20 | 18,089 | 14,292 | 17,486 |
|---|
5/20 | 19,357 | 15,046 | 18,660 |
|---|
6/20 | 20,039 | 15,379 | 19,473 |
|---|
7/20 | 21,327 | 16,279 | 20,971 |
|---|
8/20 | 23,318 | 17,474 | 23,135 |
|---|
9/20 | 22,188 | 16,836 | 22,046 |
|---|
10/20 | 21,368 | 16,430 | 21,298 |
|---|
11/20 | 23,648 | 18,364 | 23,478 |
|---|
12/20 | 24,354 | 19,141 | 24,558 |
|---|
1/21 | 23,527 | 18,983 | 24,376 |
|---|
2/21 | 24,268 | 19,533 | 24,371 |
|---|
3/21 | 24,767 | 20,272 | 24,789 |
|---|
4/21 | 26,827 | 21,364 | 26,476 |
|---|
5/21 | 26,848 | 21,465 | 26,110 |
|---|
6/21 | 28,395 | 22,003 | 27,748 |
|---|
7/21 | 29,307 | 22,460 | 28,662 |
|---|
8/21 | 30,298 | 23,110 | 29,734 |
|---|
9/21 | 28,709 | 22,048 | 28,069 |
|---|
10/21 | 30,683 | 23,578 | 30,500 |
|---|
11/21 | 30,027 | 23,262 | 30,686 |
|---|
12/21 | 30,330 | 24,204 | 31,335 |
|---|
1/22 | 27,511 | 22,840 | 28,646 |
|---|
2/22 | 25,873 | 22,213 | 27,429 |
|---|
3/22 | 26,429 | 22,962 | 28,502 |
|---|
4/22 | 22,993 | 20,916 | 25,060 |
|---|
5/22 | 22,902 | 20,884 | 24,478 |
|---|
6/22 | 23,534 | 20,917 | 25,244 |
|---|
8/22 | 22,270 | 20,114 | 24,068 |
|---|
9/22 | 20,929 | 19,717 | 22,998 |
|---|
10/22 | 22,323 | 20,783 | 24,046 |
|---|
11/22 | 20,913 | 19,575 | 22,205 |
|---|
12/22 | 22,708 | 20,887 | 24,056 |
|---|
1/23 | 21,841 | 20,390 | 23,770 |
|---|
2/23 | 22,739 | 21,035 | 25,395 |
|---|
3/23 | 23,245 | 21,296 | 25,646 |
|---|
4/23 | 23,705 | 21,395 | 26,814 |
|---|
5/23 | 25,439 | 22,840 | 28,648 |
|---|
6/23 | 26,160 | 23,625 | 29,613 |
|---|
7/23 | 26,260 | 23,212 | 29,347 |
|---|
9/23 | 24,756 | 22,121 | 27,751 |
|---|
10/23 | 24,733 | 21,587 | 27,356 |
|---|
11/23 | 27,940 | 23,603 | 30,338 |
|---|
12/23 | 29,106 | 24,768 | 31,682 |
|---|
1/24 | 29,858 | 25,113 | 32,472 |
|---|
2/24 | 31,361 | 26,469 | 34,688 |
|---|
3/24 | 31,983 | 27,318 | 35,298 |
|---|
4/24 | 30,602 | 26,155 | 33,801 |
|---|
5/24 | 31,607 | 27,387 | 35,825 |
|---|
6/24 | 32,781 | 28,294 | 38,240 |
|---|
7/24 | 33,003 | 28,705 | 37,590 |
|---|
8/24 | 33,617 | 29,386 | 38,373 |
|---|
9/24 | 34,169 | 30,014 | 39,460 |
|---|
10/24 | 33,701 | 29,804 | 39,329 |
|---|
11/24 | 36,164 | 31,723 | 41,880 |
|---|
12/24 | 35,201 | 30,839 | 42,250 |
|---|
1/25 | 36,821 | 31,820 | 43,085 |
|---|
2/25 | 35,554 | 31,264 | 41,538 |
|---|
3/25 | 33,614 | 29,454 | 38,038 |
|---|
4/25 | 34,335 | 29,279 | 38,712 |
|---|
5/25 | 36,564 | 31,148 | 42,137 |
|---|
6/25 | 38,079 | 32,726 | 44,824 |
|---|
7/25 | 39,474 | 33,453 | 46,516 |
|---|
8/25 | 39,073 | 34,157 | 47,036 |
|---|
9/25 | 39,001 | 35,341 | 49,535 |
|---|
10/25 | 39,306 | 36,104 | 51,334 |
|---|
11/25 | 38,656 | 36,192 | 50,404 |
|---|
12/25 | 38,232 | 36,194 | 50,092 |
|---|
1/26 | 37,475 | 36,692 | 49,334 |
|---|
2/26 | 35,245 | 36,496 | 47,678 |
|---|
3/26 | 33,287 | 34,681 | 45,194 |
|---|
4/26 | 37,378 | 38,185 | 50,570 |
|---|
5/26 | 38,600 | 40,133 | 54,212 |
|---|
6/26 | 36,486 | 39,928 | 52,760 |
|---|
7/26 | 38,125 | 39,788 | 50,250 |
|---|
8/26 | 39,056 | 40,910 | 52,124 |
|---|
|
|
| Average Annual Return [Table Text Block] |
|
Table SummaryName | 1-Year | 5-Year | 10-Year |
|---|
R-3 Shares | -0.05% | 5.21% | 14.60% |
|---|
Russell 1000 Index | 19.77% | 12.10% | 15.13% |
|---|
Russell 1000 Growth Index | 10.82% | 11.88% | 17.95% |
|---|
|
|
| No Deduction of Taxes [Text Block] |
|
The graph above represents historical performance of a hypothetical investment of $10,000 in the Fund over the past ten years (or since inception if shorter). The table and graph above do not reflect the impact of taxes. If they did, performance would be lower.
|
|
| Performance Table Market Index Changed [Text Block] |
|
The Russell 1000 Index is the Fund's primary broad-based securities market index. The Russell 1000 Growth Index is included as an additional index for the Fund as it shows how the Fund’s performance compares with the returns of an index of funds with similar investment objectives.
|
|
| Updated Performance Information Location [Text Block] |
|
Visit www.principalam.com/mutualfundperformance for more recent performance information.
|
|
| AssetsNet |
|
$ 6,905,834,000
|
|
| Holdings Count | Holding |
|
39
|
|
| Advisory Fees Paid, Amount |
|
$ 51,161,000
|
|
| InvestmentCompanyPortfolioTurnover |
|
29.40%
|
|
| Additional Fund Statistics [Text Block] |
|
- Net Assets (amount in thousands)$6,905,834
- Total Number of Portfolio Holdings39
- Portfolio Turnover Rate 29.4%
- Total Advisory Fees Paid (amount in thousands)$51,161
|
|
| Holdings [Text Block] |
|
Table SummaryAsset Weighting | Percent of Net Assets |
|---|
Common Stocks | 100.48% | Investment Companies | 0.07% | Other Assets and Liabilities | (0.55)% | Total Net Assets | 100.00% | Table SummarySector | Percent of Net Assets |
|---|
Technology | 32.97% | Communications | 30.57% | Financial | 21.08% | Industrial | 10.60% | Consumer, Non-cyclical | 3.07% | Consumer, Cyclical | 1.85% | Basic Materials | 0.34% | Money Market Funds | 0.07% | Other Assets and Liabilities | (0.55)% | Total Net Assets | 100.00% | |
|
| Material Fund Change [Text Block] |
|
There were no material changes to the Fund for the period September 1, 2025 to August 31, 2026. For more complete information, you may review the Fund's most recent prospectus at www.PrincipalAM.com/prospectuses. |
|
| C000167696 |
|
|
|
| Shareholder Report [Line Items] |
|
|
|
| Fund Name |
|
Blue Chip Fund
|
|
| Class Name |
|
R-5
|
|
| Trading Symbol |
|
PGBGX
|
|
| Annual or Semi-Annual Statement [Text Block] |
|
This annual shareholder report contains important information about Blue Chip Fund (the "Fund") for the period of September 1, 2025 to August 31, 2026.
|
|
| Shareholder Report Annual or Semi-Annual |
|
Annual Shareholder Report
|
|
| Additional Information [Text Block] |
|
You can find additional information about the Fund at www.PrincipalAM.com/prospectuses or you can request information by contacting us at 1-800-222-5852 or emailing prospectus@principalfunds.com.
|
|
| Additional Information Phone Number |
|
1-800-222-5852
|
|
| Additional Information Email |
|
<span style="box-sizing: border-box; color: rgb(0, 0, 0); display: inline; flex-wrap: nowrap; font-size: 10.6667px; font-weight: 400; grid-area: auto; line-height: 16px; margin: 0px; overflow: visible; text-align: left; text-align-last: auto; white-space-collapse: preserve-breaks;">prospectus@principalfunds.com</span>
|
|
| Additional Information Website |
|
<span style="box-sizing: border-box; color: rgb(0, 0, 0); display: inline; flex-wrap: nowrap; font-size: 10.6667px; font-weight: 400; grid-area: auto; line-height: 16px; margin: 0px; overflow: visible; text-align: left; text-align-last: auto; white-space-collapse: preserve-breaks;">www.PrincipalAM.com/prospectuses</span>
|
|
| Expenses [Text Block] |
|
What were the Fund costs for the last year? (based on a hypothetical $10,000 investment) Table SummaryClass Name | Costs of a $10,000 investment | Costs paid as a percentage of a $10,000 investment |
|---|
R-5 | $83 | 0.83% |
|---|
|
|
| Expenses Paid, Amount |
|
$ 83
|
|
| Expense Ratio, Percent |
|
0.83%
|
|
| Factors Affecting Performance [Text Block] |
|
Management’s Discussion of Fund PerformanceThe Fund seeks long-term growth of capital. The Fund normally invests at least 80% of its net assets in equity securities of companies with large market capitalizations that, in the Fund's investment advisor's opinion, display characteristics of a "blue chip" company. The advisor tends to focus on securities of companies that show potential for growth of capital as well as an expectation for above average earnings. The Fund also invests in securities of foreign companies. Over the year, the Fund's investments benefited from strong company selection in consumer discretionary, where Amazon.com, Inc. and DoorDash, Inc. were among the top contributors to relative results versus the Russell 1000 Growth Index (“Index”). Amazon.com, Inc. reported accelerated growth in its cloud business, Amazon Web Services, as demand for AI-related compute continued to build. DoorDash, Inc. also delivered strong results, supported by expansion beyond restaurant delivery into newer verticals such as grocery and retail, which meaningfully increased its addressable market. These gains were offset by weaker company selection in information technology, where the Fund had less exposure to some of the market’s most powerful AI-led winners, including semiconductors, semiconductor equipment, and electrical components. Several software holdings also came under pressure, including Roper Technologies, Inc. and Cadence Design Systems, Inc., as investors questioned whether AI could increase competition or disrupt existing business models. Allocation to financial companies was another relative headwind, with alternative asset managers Brookfield Corp. and KKR & Co., Inc. detracting from performance. CoStar Group, Inc., a commercial real estate data and analytics provider, weighed on results as the company continued to absorb elevated investment spending tied to the buildout of its Homes.com business. |
|
| Performance Past Does Not Indicate Future [Text] |
|
Past performance is not a good predictor of the Fund's future performance.
|
|
| Line Graph [Table Text Block] |
|
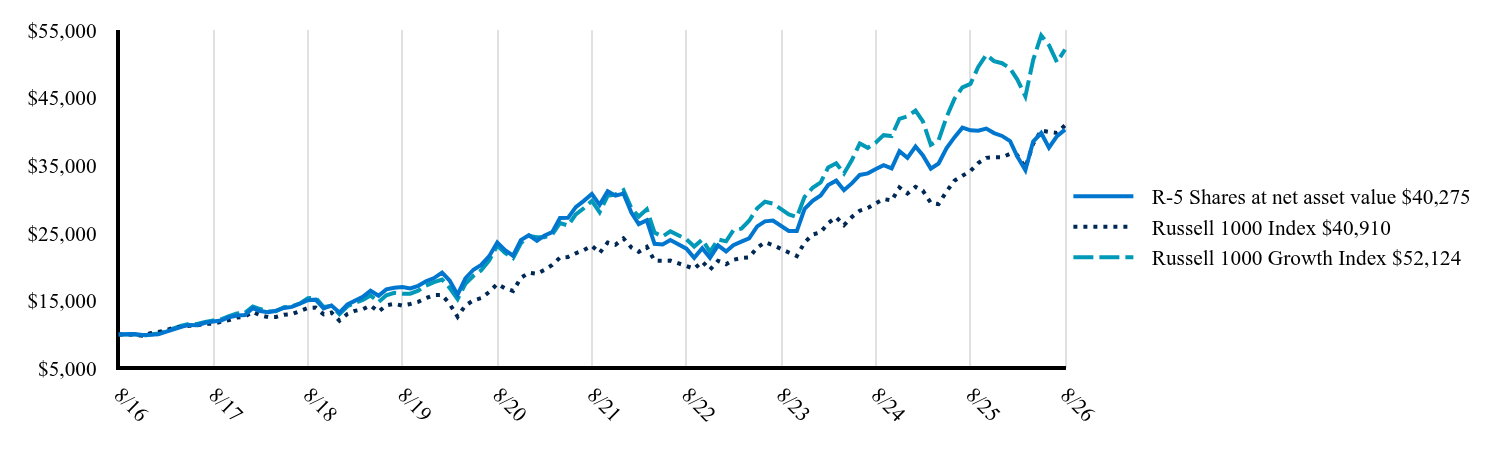 Table Summary | R-5 Shares at net asset value $40,275 | Russell 1000 Index $40,910 | Russell 1000 Growth Index $52,124 |
|---|
8/16 | 10,000 | 10,000 | 10,000 |
|---|
10/16 | 10,082 | 10,008 | 10,037 |
|---|
11/16 | 9,929 | 9,813 | 9,801 |
|---|
12/16 | 9,953 | 10,200 | 10,014 |
|---|
1/17 | 10,018 | 10,391 | 10,138 |
|---|
2/17 | 10,403 | 10,600 | 10,480 |
|---|
3/17 | 10,777 | 11,010 | 10,915 |
|---|
4/17 | 11,121 | 11,134 | 11,294 |
|---|
5/17 | 11,418 | 11,276 | 11,587 |
|---|
6/17 | 11,383 | 11,355 | 11,557 |
|---|
7/17 | 11,739 | 11,580 | 11,864 |
|---|
8/17 | 11,911 | 11,616 | 12,082 |
|---|
9/17 | 12,059 | 11,863 | 12,239 |
|---|
10/17 | 12,552 | 12,135 | 12,713 |
|---|
11/17 | 12,813 | 12,505 | 13,099 |
|---|
12/17 | 12,876 | 12,645 | 13,201 |
|---|
1/18 | 13,913 | 13,339 | 14,136 |
|---|
2/18 | 13,474 | 12,849 | 13,765 |
|---|
3/18 | 13,303 | 12,558 | 13,388 |
|---|
4/18 | 13,529 | 12,600 | 13,435 |
|---|
5/18 | 13,925 | 12,922 | 14,024 |
|---|
6/18 | 14,078 | 13,005 | 14,159 |
|---|
7/18 | 14,548 | 13,454 | 14,574 |
|---|
8/18 | 15,078 | 13,918 | 15,371 |
|---|
9/18 | 15,151 | 13,971 | 15,457 |
|---|
10/18 | 13,864 | 12,982 | 14,075 |
|---|
11/18 | 14,297 | 13,246 | 14,224 |
|---|
12/18 | 13,241 | 12,040 | 13,001 |
|---|
1/19 | 14,439 | 13,049 | 14,170 |
|---|
2/19 | 14,972 | 13,491 | 14,677 |
|---|
3/19 | 15,572 | 13,726 | 15,095 |
|---|
4/19 | 16,467 | 14,280 | 15,777 |
|---|
5/19 | 15,736 | 13,370 | 14,780 |
|---|
6/19 | 16,671 | 14,308 | 15,795 |
|---|
7/19 | 16,915 | 14,531 | 16,152 |
|---|
8/19 | 17,027 | 14,265 | 16,028 |
|---|
9/19 | 16,809 | 14,512 | 16,030 |
|---|
10/19 | 17,198 | 14,819 | 16,482 |
|---|
11/19 | 17,856 | 15,379 | 17,213 |
|---|
12/19 | 18,342 | 15,824 | 17,732 |
|---|
1/20 | 19,134 | 15,841 | 18,129 |
|---|
2/20 | 17,977 | 14,546 | 16,894 |
|---|
3/20 | 15,884 | 12,624 | 15,232 |
|---|
4/20 | 18,294 | 14,292 | 17,486 |
|---|
5/20 | 19,574 | 15,046 | 18,660 |
|---|
6/20 | 20,277 | 15,379 | 19,473 |
|---|
7/20 | 21,578 | 16,279 | 20,971 |
|---|
8/20 | 23,609 | 17,474 | 23,135 |
|---|
9/20 | 22,466 | 16,836 | 22,046 |
|---|
10/20 | 21,647 | 16,430 | 21,298 |
|---|
11/20 | 23,953 | 18,364 | 23,478 |
|---|
12/20 | 24,679 | 19,141 | 24,558 |
|---|
1/21 | 23,846 | 18,983 | 24,376 |
|---|
2/21 | 24,601 | 19,533 | 24,371 |
|---|
3/21 | 25,121 | 20,272 | 24,789 |
|---|
4/21 | 27,207 | 21,364 | 26,476 |
|---|
5/21 | 27,235 | 21,465 | 26,110 |
|---|
6/21 | 28,816 | 22,003 | 27,748 |
|---|
7/21 | 29,749 | 22,460 | 28,662 |
|---|
8/21 | 30,760 | 23,110 | 29,734 |
|---|
9/21 | 29,158 | 22,048 | 28,069 |
|---|
10/21 | 31,173 | 23,578 | 30,500 |
|---|
11/21 | 30,518 | 23,262 | 30,686 |
|---|
12/21 | 30,836 | 24,204 | 31,335 |
|---|
1/22 | 27,970 | 22,840 | 28,646 |
|---|
2/22 | 26,312 | 22,213 | 27,429 |
|---|
3/22 | 26,882 | 22,962 | 28,502 |
|---|
4/22 | 23,400 | 20,916 | 25,060 |
|---|
5/22 | 23,309 | 20,884 | 24,478 |
|---|
6/22 | 23,971 | 20,917 | 25,244 |
|---|
8/22 | 22,686 | 20,114 | 24,068 |
|---|
9/22 | 21,325 | 19,717 | 22,998 |
|---|
10/22 | 22,754 | 20,783 | 24,046 |
|---|
11/22 | 21,324 | 19,575 | 22,205 |
|---|
12/22 | 23,161 | 20,887 | 24,056 |
|---|
1/23 | 22,281 | 20,390 | 23,770 |
|---|
2/23 | 23,200 | 21,035 | 25,395 |
|---|
3/23 | 23,728 | 21,296 | 25,646 |
|---|
4/23 | 24,202 | 21,395 | 26,814 |
|---|
5/23 | 25,978 | 22,840 | 28,648 |
|---|
6/23 | 26,720 | 23,625 | 29,613 |
|---|
7/23 | 26,835 | 23,212 | 29,347 |
|---|
9/23 | 25,297 | 22,121 | 27,751 |
|---|
10/23 | 25,289 | 21,587 | 27,356 |
|---|
11/23 | 28,573 | 23,603 | 30,338 |
|---|
12/23 | 29,767 | 24,768 | 31,682 |
|---|
1/24 | 30,547 | 25,113 | 32,472 |
|---|
2/24 | 32,086 | 26,469 | 34,688 |
|---|
3/24 | 32,737 | 27,318 | 35,298 |
|---|
4/24 | 31,328 | 26,155 | 33,801 |
|---|
5/24 | 32,369 | 27,387 | 35,825 |
|---|
6/24 | 33,578 | 28,294 | 38,240 |
|---|
7/24 | 33,816 | 28,705 | 37,590 |
|---|
8/24 | 34,451 | 29,386 | 38,373 |
|---|
9/24 | 35,033 | 30,014 | 39,460 |
|---|
10/24 | 34,558 | 29,804 | 39,329 |
|---|
11/24 | 37,092 | 31,723 | 41,880 |
|---|
12/24 | 36,116 | 30,839 | 42,250 |
|---|
1/25 | 37,786 | 31,820 | 43,085 |
|---|
2/25 | 36,492 | 31,264 | 41,538 |
|---|
3/25 | 34,519 | 29,454 | 38,038 |
|---|
4/25 | 35,269 | 29,279 | 38,712 |
|---|
5/25 | 37,562 | 31,148 | 42,137 |
|---|
6/25 | 39,128 | 32,726 | 44,824 |
|---|
7/25 | 40,566 | 33,453 | 46,516 |
|---|
8/25 | 40,174 | 34,157 | 47,036 |
|---|
9/25 | 40,111 | 35,341 | 49,535 |
|---|
10/25 | 40,430 | 36,104 | 51,334 |
|---|
11/25 | 39,767 | 36,192 | 50,404 |
|---|
12/25 | 39,344 | 36,194 | 50,092 |
|---|
1/26 | 38,576 | 36,692 | 49,334 |
|---|
2/26 | 36,292 | 36,496 | 47,678 |
|---|
3/26 | 34,286 | 34,681 | 45,194 |
|---|
4/26 | 38,509 | 38,185 | 50,570 |
|---|
5/26 | 39,776 | 40,133 | 54,212 |
|---|
6/26 | 37,607 | 39,928 | 52,760 |
|---|
7/26 | 39,306 | 39,788 | 50,250 |
|---|
8/26 | 40,275 | 40,910 | 52,124 |
|---|
|
|
| Average Annual Return [Table Text Block] |
|
Table SummaryName | 1-Year | 5-Year | 10-Year |
|---|
R-5 Shares | 0.25% | 5.54% | 14.95% |
|---|
Russell 1000 Index | 19.77% | 12.10% | 15.13% |
|---|
Russell 1000 Growth Index | 10.82% | 11.88% | 17.95% |
|---|
|
|
| No Deduction of Taxes [Text Block] |
|
The graph above represents historical performance of a hypothetical investment of $10,000 in the Fund over the past ten years (or since inception if shorter). The table and graph above do not reflect the impact of taxes. If they did, performance would be lower.
|
|
| Performance Table Market Index Changed [Text Block] |
|
The Russell 1000 Index is the Fund's primary broad-based securities market index. The Russell 1000 Growth Index is included as an additional index for the Fund as it shows how the Fund’s performance compares with the returns of an index of funds with similar investment objectives.
|
|
| Updated Performance Information Location [Text Block] |
|
Visit www.principalam.com/mutualfundperformance for more recent performance information.
|
|
| AssetsNet |
|
$ 6,905,834,000
|
|
| Holdings Count | Holding |
|
39
|
|
| Advisory Fees Paid, Amount |
|
$ 51,161,000
|
|
| InvestmentCompanyPortfolioTurnover |
|
29.40%
|
|
| Additional Fund Statistics [Text Block] |
|
- Net Assets (amount in thousands)$6,905,834
- Total Number of Portfolio Holdings39
- Portfolio Turnover Rate 29.4%
- Total Advisory Fees Paid (amount in thousands)$51,161
|
|
| Holdings [Text Block] |
|
Table SummaryAsset Weighting | Percent of Net Assets |
|---|
Common Stocks | 100.48% | Investment Companies | 0.07% | Other Assets and Liabilities | (0.55)% | Total Net Assets | 100.00% | Table SummarySector | Percent of Net Assets |
|---|
Technology | 32.97% | Communications | 30.57% | Financial | 21.08% | Industrial | 10.60% | Consumer, Non-cyclical | 3.07% | Consumer, Cyclical | 1.85% | Basic Materials | 0.34% | Money Market Funds | 0.07% | Other Assets and Liabilities | (0.55)% | Total Net Assets | 100.00% | |
|
| Material Fund Change [Text Block] |
|
There were no material changes to the Fund for the period September 1, 2025 to August 31, 2026. For more complete information, you may review the Fund's most recent prospectus at www.PrincipalAM.com/prospectuses. |
|
| C000176331 |
|
|
|
| Shareholder Report [Line Items] |
|
|
|
| Fund Name |
|
Blue Chip Fund
|
|
| Class Name |
|
R-6
|
|
| Trading Symbol |
|
PGBHX
|
|
| Annual or Semi-Annual Statement [Text Block] |
|
This annual shareholder report contains important information about Blue Chip Fund (the "Fund") for the period of September 1, 2025 to August 31, 2026.
|
|
| Shareholder Report Annual or Semi-Annual |
|
Annual Shareholder Report
|
|
| Additional Information [Text Block] |
|
You can find additional information about the Fund at www.PrincipalAM.com/prospectuses or you can request information by contacting us at 1-800-222-5852 or emailing prospectus@principalfunds.com.
|
|
| Additional Information Phone Number |
|
1-800-222-5852
|
|
| Additional Information Email |
|
<span style="box-sizing: border-box; color: rgb(0, 0, 0); display: inline; flex-wrap: nowrap; font-size: 10.6667px; font-weight: 400; grid-area: auto; line-height: 16px; margin: 0px; overflow: visible; text-align: left; text-align-last: auto; white-space-collapse: preserve-breaks;">prospectus@principalfunds.com</span>
|
|
| Additional Information Website |
|
<span style="box-sizing: border-box; color: rgb(0, 0, 0); display: inline; flex-wrap: nowrap; font-size: 10.6667px; font-weight: 400; grid-area: auto; line-height: 16px; margin: 0px; overflow: visible; text-align: left; text-align-last: auto; white-space-collapse: preserve-breaks;">www.PrincipalAM.com/prospectuses</span>
|
|
| Expenses [Text Block] |
|
What were the Fund costs for the last year? (based on a hypothetical $10,000 investment) Table SummaryClass Name | Costs of a $10,000 investment | Costs paid as a percentage of a $10,000 investment |
|---|
R-6 | $58 | 0.58% |
|---|
|
|
| Expenses Paid, Amount |
|
$ 58
|
|
| Expense Ratio, Percent |
|
0.58%
|
|
| Factors Affecting Performance [Text Block] |
|
Management’s Discussion of Fund PerformanceThe Fund seeks long-term growth of capital. The Fund normally invests at least 80% of its net assets in equity securities of companies with large market capitalizations that, in the Fund's investment advisor's opinion, display characteristics of a "blue chip" company. The advisor tends to focus on securities of companies that show potential for growth of capital as well as an expectation for above average earnings. The Fund also invests in securities of foreign companies. Over the year, the Fund's investments benefited from strong company selection in consumer discretionary, where Amazon.com, Inc. and DoorDash, Inc. were among the top contributors to relative results versus the Russell 1000 Growth Index (“Index”). Amazon.com, Inc. reported accelerated growth in its cloud business, Amazon Web Services, as demand for AI-related compute continued to build. DoorDash, Inc. also delivered strong results, supported by expansion beyond restaurant delivery into newer verticals such as grocery and retail, which meaningfully increased its addressable market. These gains were offset by weaker company selection in information technology, where the Fund had less exposure to some of the market’s most powerful AI-led winners, including semiconductors, semiconductor equipment, and electrical components. Several software holdings also came under pressure, including Roper Technologies, Inc. and Cadence Design Systems, Inc., as investors questioned whether AI could increase competition or disrupt existing business models. Allocation to financial companies was another relative headwind, with alternative asset managers Brookfield Corp. and KKR & Co., Inc. detracting from performance. CoStar Group, Inc., a commercial real estate data and analytics provider, weighed on results as the company continued to absorb elevated investment spending tied to the buildout of its Homes.com business. |
|
| Performance Past Does Not Indicate Future [Text] |
|
Past performance is not a good predictor of the Fund's future performance.
|
|
| Line Graph [Table Text Block] |
|
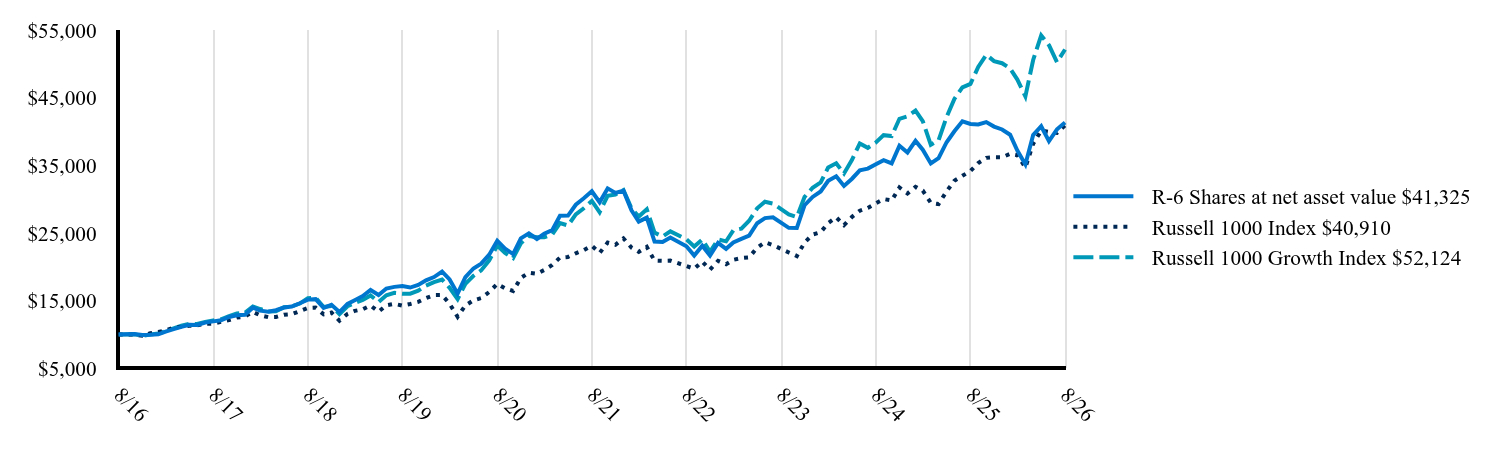 Table Summary | R-6 Shares at net asset value $41,325 | Russell 1000 Index $40,910 | Russell 1000 Growth Index $52,124 |
|---|
8/16 | 10,000 | 10,000 | 10,000 |
|---|
10/16 | 10,088 | 10,008 | 10,037 |
|---|
11/16 | 9,940 | 9,813 | 9,801 |
|---|
12/16 | 9,957 | 10,200 | 10,014 |
|---|
1/17 | 10,027 | 10,391 | 10,138 |
|---|
2/17 | 10,419 | 10,600 | 10,480 |
|---|
3/17 | 10,793 | 11,010 | 10,915 |
|---|
4/17 | 11,137 | 11,134 | 11,294 |
|---|
5/17 | 11,446 | 11,276 | 11,587 |
|---|
6/17 | 11,405 | 11,355 | 11,557 |
|---|
7/17 | 11,761 | 11,580 | 11,864 |
|---|
8/17 | 11,939 | 11,616 | 12,082 |
|---|
9/17 | 12,094 | 11,863 | 12,239 |
|---|
10/17 | 12,587 | 12,135 | 12,713 |
|---|
11/17 | 12,854 | 12,505 | 13,099 |
|---|
12/17 | 12,920 | 12,645 | 13,201 |
|---|
1/18 | 13,964 | 13,339 | 14,136 |
|---|
2/18 | 13,525 | 12,849 | 13,765 |
|---|
3/18 | 13,354 | 12,558 | 13,388 |
|---|
4/18 | 13,586 | 12,600 | 13,435 |
|---|
5/18 | 13,983 | 12,922 | 14,024 |
|---|
6/18 | 14,141 | 13,005 | 14,159 |
|---|
7/18 | 14,618 | 13,454 | 14,574 |
|---|
8/18 | 15,155 | 13,918 | 15,371 |
|---|
9/18 | 15,228 | 13,971 | 15,457 |
|---|
10/18 | 13,946 | 12,982 | 14,075 |
|---|
11/18 | 14,380 | 13,246 | 14,224 |
|---|
12/18 | 13,317 | 12,040 | 13,001 |
|---|
1/19 | 14,530 | 13,049 | 14,170 |
|---|
2/19 | 15,070 | 13,491 | 14,677 |
|---|
3/19 | 15,676 | 13,726 | 15,095 |
|---|
4/19 | 16,579 | 14,280 | 15,777 |
|---|
5/19 | 15,847 | 13,370 | 14,780 |
|---|
6/19 | 16,790 | 14,308 | 15,795 |
|---|
7/19 | 17,040 | 14,531 | 16,152 |
|---|
8/19 | 17,159 | 14,265 | 16,028 |
|---|
9/19 | 16,941 | 14,512 | 16,030 |
|---|
10/19 | 17,337 | 14,819 | 16,482 |
|---|
11/19 | 18,009 | 15,379 | 17,213 |
|---|
12/19 | 18,493 | 15,824 | 17,732 |
|---|
1/20 | 19,301 | 15,841 | 18,129 |
|---|
2/20 | 18,141 | 14,546 | 16,894 |
|---|
3/20 | 16,035 | 12,624 | 15,232 |
|---|
4/20 | 18,465 | 14,292 | 17,486 |
|---|
5/20 | 19,764 | 15,046 | 18,660 |
|---|
6/20 | 20,475 | 15,379 | 19,473 |
|---|
7/20 | 21,801 | 16,279 | 20,971 |
|---|
8/20 | 23,852 | 17,474 | 23,135 |
|---|
9/20 | 22,698 | 16,836 | 22,046 |
|---|
10/20 | 21,877 | 16,430 | 21,298 |
|---|
11/20 | 24,218 | 18,364 | 23,478 |
|---|
12/20 | 24,953 | 19,141 | 24,558 |
|---|
1/21 | 24,117 | 18,983 | 24,376 |
|---|
2/21 | 24,889 | 19,533 | 24,371 |
|---|
3/21 | 25,417 | 20,272 | 24,789 |
|---|
4/21 | 27,537 | 21,364 | 26,476 |
|---|
5/21 | 27,573 | 21,465 | 26,110 |
|---|
6/21 | 29,179 | 22,003 | 27,748 |
|---|
7/21 | 30,129 | 22,460 | 28,662 |
|---|
8/21 | 31,164 | 23,110 | 29,734 |
|---|
9/21 | 29,544 | 22,048 | 28,069 |
|---|
10/21 | 31,593 | 23,578 | 30,500 |
|---|
11/21 | 30,929 | 23,262 | 30,686 |
|---|
12/21 | 31,262 | 24,204 | 31,335 |
|---|
1/22 | 28,367 | 22,840 | 28,646 |
|---|
2/22 | 26,691 | 22,213 | 27,429 |
|---|
3/22 | 27,278 | 22,962 | 28,502 |
|---|
4/22 | 23,743 | 20,916 | 25,060 |
|---|
5/22 | 23,660 | 20,884 | 24,478 |
|---|
6/22 | 24,338 | 20,917 | 25,244 |
|---|
8/22 | 23,035 | 20,114 | 24,068 |
|---|
9/22 | 21,672 | 19,717 | 22,998 |
|---|
10/22 | 23,126 | 20,783 | 24,046 |
|---|
11/22 | 21,671 | 19,575 | 22,205 |
|---|
12/22 | 23,542 | 20,887 | 24,056 |
|---|
1/23 | 22,660 | 20,390 | 23,770 |
|---|
2/23 | 23,596 | 21,035 | 25,395 |
|---|
3/23 | 24,140 | 21,296 | 25,646 |
|---|
4/23 | 24,623 | 21,395 | 26,814 |
|---|
5/23 | 26,441 | 22,840 | 28,648 |
|---|
6/23 | 27,200 | 23,625 | 29,613 |
|---|
7/23 | 27,322 | 23,212 | 29,347 |
|---|
9/23 | 25,766 | 22,121 | 27,751 |
|---|
10/23 | 25,758 | 21,587 | 27,356 |
|---|
11/23 | 29,109 | 23,603 | 30,338 |
|---|
12/23 | 30,330 | 24,768 | 31,682 |
|---|
1/24 | 31,135 | 25,113 | 32,472 |
|---|
2/24 | 32,716 | 26,469 | 34,688 |
|---|
3/24 | 33,383 | 27,318 | 35,298 |
|---|
4/24 | 31,956 | 26,155 | 33,801 |
|---|
5/24 | 33,022 | 27,387 | 35,825 |
|---|
6/24 | 34,265 | 28,294 | 38,240 |
|---|
7/24 | 34,518 | 28,705 | 37,590 |
|---|
8/24 | 35,170 | 29,386 | 38,373 |
|---|
9/24 | 35,769 | 30,014 | 39,460 |
|---|
10/24 | 35,293 | 29,804 | 39,329 |
|---|
11/24 | 37,886 | 31,723 | 41,880 |
|---|
12/24 | 36,895 | 30,839 | 42,250 |
|---|
1/25 | 38,609 | 31,820 | 43,085 |
|---|
2/25 | 37,303 | 31,264 | 41,538 |
|---|
3/25 | 35,285 | 29,454 | 38,038 |
|---|
4/25 | 36,062 | 29,279 | 38,712 |
|---|
5/25 | 38,416 | 31,148 | 42,137 |
|---|
6/25 | 40,026 | 32,726 | 44,824 |
|---|
7/25 | 41,508 | 33,453 | 46,516 |
|---|
8/25 | 41,115 | 34,157 | 47,036 |
|---|
9/25 | 41,051 | 35,341 | 49,535 |
|---|
10/25 | 41,395 | 36,104 | 51,334 |
|---|
11/25 | 40,731 | 36,192 | 50,404 |
|---|
12/25 | 40,300 | 36,194 | 50,092 |
|---|
1/26 | 39,524 | 36,692 | 49,334 |
|---|
2/26 | 37,186 | 36,496 | 47,678 |
|---|
3/26 | 35,135 | 34,681 | 45,194 |
|---|
4/26 | 39,476 | 38,185 | 50,570 |
|---|
5/26 | 40,779 | 40,133 | 54,212 |
|---|
6/26 | 38,575 | 39,928 | 52,760 |
|---|
7/26 | 40,319 | 39,788 | 50,250 |
|---|
8/26 | 41,325 | 40,910 | 52,124 |
|---|
|
|
| Average Annual Return [Table Text Block] |
|
Table SummaryName | 1-Year | 5-Year | 10-YearFootnote Reference* |
|---|
R-6 Shares | 0.51% | 5.81% | 15.24% |
|---|
Russell 1000 Index | 19.77% | 12.10% | 15.13% |
|---|
Russell 1000 Growth Index | 10.82% | 11.88% | 17.95% |
|---|
|
|
| Performance Inception Date |
|
Jun. 14, 2012
|
|
| No Deduction of Taxes [Text Block] |
|
The graph above represents historical performance of a hypothetical investment of $10,000 in the Fund over the past ten years (or since inception if shorter). The table and graph above do not reflect the impact of taxes. If they did, performance would be lower.
|
|
| Performance Table Market Index Changed [Text Block] |
|
The Russell 1000 Index is the Fund's primary broad-based securities market index. The Russell 1000 Growth Index is included as an additional index for the Fund as it shows how the Fund’s performance compares with the returns of an index of funds with similar investment objectives.
|
|
| Updated Performance Information Location [Text Block] |
|
Visit www.principalam.com/mutualfundperformance for more recent performance information.
|
|
| AssetsNet |
|
$ 6,905,834,000
|
|
| Holdings Count | Holding |
|
39
|
|
| Advisory Fees Paid, Amount |
|
$ 51,161,000
|
|
| InvestmentCompanyPortfolioTurnover |
|
29.40%
|
|
| Additional Fund Statistics [Text Block] |
|
- Net Assets (amount in thousands)$6,905,834
- Total Number of Portfolio Holdings39
- Portfolio Turnover Rate 29.4%
- Total Advisory Fees Paid (amount in thousands)$51,161
|
|
| Holdings [Text Block] |
|
Table SummaryAsset Weighting | Percent of Net Assets |
|---|
Common Stocks | 100.48% | Investment Companies | 0.07% | Other Assets and Liabilities | (0.55)% | Total Net Assets | 100.00% | Table SummarySector | Percent of Net Assets |
|---|
Technology | 32.97% | Communications | 30.57% | Financial | 21.08% | Industrial | 10.60% | Consumer, Non-cyclical | 3.07% | Consumer, Cyclical | 1.85% | Basic Materials | 0.34% | Money Market Funds | 0.07% | Other Assets and Liabilities | (0.55)% | Total Net Assets | 100.00% | |
|
| Material Fund Change [Text Block] |
|
There were no material changes to the Fund for the period September 1, 2025 to August 31, 2026. For more complete information, you may review the Fund's most recent prospectus at www.PrincipalAM.com/prospectuses. |
|
| C000085837 |
|
|
|
| Shareholder Report [Line Items] |
|
|
|
| Fund Name |
|
Bond Market Index Fund
|
|
| Class Name |
|
Class J
|
|
| Trading Symbol |
|
PBIJX
|
|
| Annual or Semi-Annual Statement [Text Block] |
|
This annual shareholder report contains important information about Bond Market Index Fund (the "Fund") for the period of September 1, 2025 to August 31, 2026.
|
|
| Shareholder Report Annual or Semi-Annual |
|
Annual Shareholder Report
|
|
| Additional Information [Text Block] |
|
You can find additional information about the Fund at www.PrincipalAM.com/prospectuses or you can request information by contacting us at 1-800-222-5852 or emailing prospectus@principalfunds.com.
|
|
| Material Fund Change Notice [Text Block] |
|
This report describes certain changes to the Fund that occurred during the reporting period.
|
|
| Additional Information Phone Number |
|
1-800-222-5852
|
|
| Additional Information Email |
|
<span style="box-sizing: border-box; color: rgb(0, 0, 0); display: inline; flex-wrap: nowrap; font-size: 10.6667px; font-weight: 400; grid-area: auto; line-height: 16px; margin: 0px; overflow: visible; text-align: left; text-align-last: auto; white-space-collapse: preserve-breaks;">prospectus@principalfunds.com</span>
|
|
| Additional Information Website |
|
<span style="box-sizing: border-box; color: rgb(0, 0, 0); display: inline; flex-wrap: nowrap; font-size: 10.6667px; font-weight: 400; grid-area: auto; line-height: 16px; margin: 0px; overflow: visible; text-align: left; text-align-last: auto; white-space-collapse: preserve-breaks;">www.PrincipalAM.com/prospectuses</span>
|
|
| Expenses [Text Block] |
|
What were the Fund costs for the last year? (based on a hypothetical $10,000 investment) Table SummaryClass Name | Costs of a $10,000 investment | Costs paid as a percentage of a $10,000 investment |
|---|
Class J | $42 | 0.42% |
|---|
|
|
| Expenses Paid, Amount |
|
$ 42
|
|
| Expense Ratio, Percent |
|
0.42%
|
|
| Factors Affecting Performance [Text Block] |
|
Management’s Discussion of Fund PerformanceThe Fund seeks to provide current income. Under normal circumstances, the Fund invests at least 80% of its net assets in investments designed to track the Bloomberg US Aggregate Index (the "Index") at the time of purchase. The Index is composed of investment grade, fixed-rate debt issues with maturities of one year or more, including government securities, corporate securities, and asset-backed and mortgage-backed securities (securitized products). During the fiscal year ending August 31, 2026, the Fund’s investments performed in line with the Index. The Fund uses a passive investment approach that tracks and replicates the risk and return characteristics of the Index, seeking to provide investment results that closely correspond, before expenses, to the performance of the Index. The top contributors to performance included slightly higher allocation compared to Index weight to investment grade corporate bonds, security specific impacts within U.S. Treasury securities, and slightly higher allocation compared to Index weight to mortgage-backed securities. The top detractors from performance for the fiscal year included security specific impacts within mortgage-backed securities, slightly higher allocation compared to Index weight to U.S. Treasury securities, and security specific impacts within investment grade corporate bonds. |
|
| Performance Past Does Not Indicate Future [Text] |
|
Past performance is not a good predictor of the Fund's future performance.
|
|
| Line Graph [Table Text Block] |
|
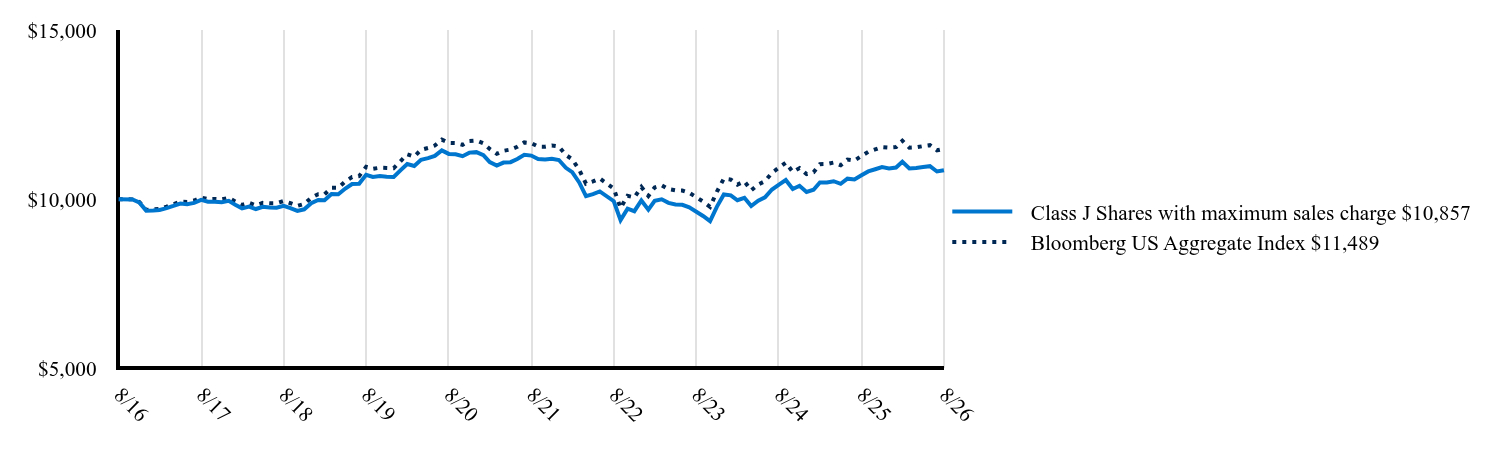 Table Summary | Class J Shares with maximum sales charge $10,857 | Bloomberg US Aggregate Index $11,489 |
|---|
8/16 | 10,000 | 10,000 |
|---|
10/16 | 9,991 | 9,994 |
|---|
11/16 | 9,902 | 9,918 |
|---|
12/16 | 9,660 | 9,683 |
|---|
1/17 | 9,663 | 9,697 |
|---|
2/17 | 9,681 | 9,716 |
|---|
3/17 | 9,736 | 9,781 |
|---|
4/17 | 9,799 | 9,851 |
|---|
5/17 | 9,872 | 9,927 |
|---|
6/17 | 9,853 | 9,917 |
|---|
7/17 | 9,890 | 9,960 |
|---|
8/17 | 9,980 | 10,049 |
|---|
9/17 | 9,926 | 10,001 |
|---|
10/17 | 9,926 | 10,007 |
|---|
11/17 | 9,908 | 9,994 |
|---|
12/17 | 9,950 | 10,040 |
|---|
1/18 | 9,830 | 9,925 |
|---|
2/18 | 9,728 | 9,830 |
|---|
3/18 | 9,783 | 9,894 |
|---|
4/18 | 9,709 | 9,820 |
|---|
5/18 | 9,774 | 9,890 |
|---|
6/18 | 9,756 | 9,878 |
|---|
7/18 | 9,746 | 9,880 |
|---|
8/18 | 9,802 | 9,944 |
|---|
9/18 | 9,737 | 9,880 |
|---|
10/18 | 9,654 | 9,802 |
|---|
11/18 | 9,700 | 9,860 |
|---|
12/18 | 9,881 | 10,041 |
|---|
1/19 | 9,975 | 10,148 |
|---|
2/19 | 9,966 | 10,142 |
|---|
3/19 | 10,155 | 10,337 |
|---|
4/19 | 10,145 | 10,339 |
|---|
5/19 | 10,315 | 10,523 |
|---|
6/19 | 10,447 | 10,655 |
|---|
7/19 | 10,457 | 10,679 |
|---|
8/19 | 10,721 | 10,955 |
|---|
9/19 | 10,655 | 10,897 |
|---|
10/19 | 10,683 | 10,930 |
|---|
11/19 | 10,664 | 10,924 |
|---|
12/19 | 10,655 | 10,917 |
|---|
1/20 | 10,857 | 11,127 |
|---|
2/20 | 11,040 | 11,327 |
|---|
3/20 | 10,982 | 11,260 |
|---|
4/20 | 11,165 | 11,460 |
|---|
5/20 | 11,213 | 11,514 |
|---|
6/20 | 11,280 | 11,586 |
|---|
7/20 | 11,443 | 11,759 |
|---|
8/20 | 11,338 | 11,664 |
|---|
9/20 | 11,328 | 11,658 |
|---|
10/20 | 11,270 | 11,606 |
|---|
11/20 | 11,376 | 11,720 |
|---|
12/20 | 11,390 | 11,736 |
|---|
1/21 | 11,299 | 11,652 |
|---|
2/21 | 11,094 | 11,484 |
|---|
3/21 | 10,991 | 11,340 |
|---|
4/21 | 11,082 | 11,430 |
|---|
5/21 | 11,094 | 11,467 |
|---|
6/21 | 11,185 | 11,548 |
|---|
7/21 | 11,310 | 11,677 |
|---|
8/21 | 11,288 | 11,655 |
|---|
9/21 | 11,185 | 11,554 |
|---|
10/21 | 11,173 | 11,551 |
|---|
11/21 | 11,196 | 11,585 |
|---|
12/21 | 11,158 | 11,555 |
|---|
1/22 | 10,926 | 11,306 |
|---|
2/22 | 10,798 | 11,180 |
|---|
3/22 | 10,496 | 10,869 |
|---|
4/22 | 10,090 | 10,457 |
|---|
5/22 | 10,148 | 10,524 |
|---|
6/22 | 10,229 | 10,612 |
|---|
8/22 | 9,939 | 10,313 |
|---|
9/22 | 9,381 | 9,739 |
|---|
10/22 | 9,718 | 10,097 |
|---|
11/22 | 9,644 | 10,052 |
|---|
12/22 | 9,961 | 10,361 |
|---|
1/23 | 9,691 | 10,093 |
|---|
2/23 | 9,950 | 10,349 |
|---|
3/23 | 9,997 | 10,412 |
|---|
4/23 | 9,891 | 10,299 |
|---|
5/23 | 9,844 | 10,262 |
|---|
6/23 | 9,832 | 10,255 |
|---|
7/23 | 9,761 | 10,189 |
|---|
9/23 | 9,503 | 9,931 |
|---|
10/23 | 9,350 | 9,774 |
|---|
11/23 | 9,773 | 10,216 |
|---|
12/23 | 10,139 | 10,608 |
|---|
1/24 | 10,114 | 10,578 |
|---|
2/24 | 9,968 | 10,429 |
|---|
3/24 | 10,041 | 10,525 |
|---|
4/24 | 9,797 | 10,259 |
|---|
5/24 | 9,955 | 10,433 |
|---|
6/24 | 10,053 | 10,532 |
|---|
7/24 | 10,285 | 10,778 |
|---|
8/24 | 10,432 | 10,933 |
|---|
9/24 | 10,566 | 11,079 |
|---|
10/24 | 10,298 | 10,805 |
|---|
11/24 | 10,395 | 10,919 |
|---|
12/24 | 10,215 | 10,740 |
|---|
1/25 | 10,278 | 10,797 |
|---|
2/25 | 10,493 | 11,035 |
|---|
3/25 | 10,493 | 11,039 |
|---|
4/25 | 10,531 | 11,082 |
|---|
5/25 | 10,455 | 11,003 |
|---|
6/25 | 10,606 | 11,172 |
|---|
7/25 | 10,581 | 11,143 |
|---|
8/25 | 10,707 | 11,276 |
|---|
9/25 | 10,821 | 11,399 |
|---|
10/25 | 10,884 | 11,470 |
|---|
11/25 | 10,947 | 11,541 |
|---|
12/25 | 10,910 | 11,524 |
|---|
1/26 | 10,936 | 11,537 |
|---|
2/26 | 11,107 | 11,725 |
|---|
3/26 | 10,910 | 11,519 |
|---|
4/26 | 10,923 | 11,532 |
|---|
5/26 | 10,949 | 11,568 |
|---|
6/26 | 10,975 | 11,596 |
|---|
7/26 | 10,818 | 11,444 |
|---|
8/26 | 10,857 | 11,489 |
|---|
|
|
| Average Annual Return [Table Text Block] |
|
Table SummaryName | 1-Year | 5-Year | 10-Year |
|---|
Class J Shares Excluding Sales Charge | 1.40% | -0.77% | 0.83% |
|---|
Class J Shares Including Sales Charge | 0.43% | -0.77% | 0.83% |
|---|
Bloomberg US Aggregate Index | 1.89% | -0.29% | 1.40% |
|---|
|
|
| No Deduction of Taxes [Text Block] |
|
The graph above represents historical performance of a hypothetical investment of $10,000 in the Fund over the past ten years (or since inception if shorter). The table and graph above do not reflect the impact of taxes. If they did, performance would be lower.
|
|
| Material Change Date |
|
|
Aug. 31, 2025
|
| Updated Performance Information Location [Text Block] |
|
Visit www.principalam.com/mutualfundperformance for more recent performance information.
|
|
| AssetsNet |
|
$ 3,167,674,000
|
|
| Holdings Count | Holding |
|
4,307
|
|
| Advisory Fees Paid, Amount |
|
$ 3,071,000
|
|
| InvestmentCompanyPortfolioTurnover |
|
34.70%
|
|
| Additional Fund Statistics [Text Block] |
|
- Net Assets (amount in thousands)$3,167,674
- Total Number of Portfolio Holdings4,307
- Portfolio Turnover Rate 34.7%
- Total Advisory Fees Paid (amount in thousands)$3,071
|
|
| Holdings [Text Block] |
|
Table SummaryAsset Weighting | Percent of Net Assets |
|---|
U.S. Government & Government Agency Obligations | 70.76% | Bonds | 26.81% | Investment Companies | 2.40% | Municipal Bonds | 0.08% | Other Assets and Liabilities | (0.05)% | Total Net Assets | 100.00% | Table SummarySector | Percent of Net Assets |
|---|
Government | 49.68% | Mortgage Securities | 24.49% | Financial | 7.58% | Consumer, Non-cyclical | 3.92% | Communications | 2.57% | Utilities | 2.42% | Technology | 1.95% | Industrial | 1.69% | Energy | 1.66% | Money Market Funds | 1.52% | Consumer, Cyclical | 1.13% | Exchange-Traded Funds | 0.88% | Basic Materials | 0.48% | Revenue Bonds | 0.04% | General Obligation Unlimited | 0.03% | Insured | 0.01% | Other Assets and Liabilities | (0.05)% | Total Net Assets | 100.00% | |
|
| Material Fund Change [Text Block] |
|
This is a summary of certain changes to the Fund since August 31, 2025. For more complete information, you may review the Fund's most recent prospectus, which we expect to be effective by December 31 or upon request at www.PrincipalAM.com/prospectuses. Effective December 31, 2025, the Fund's management fees were changed. The management fee was reduced from 0.12% to 0.10% on the first $3 billion of net assets and from 0.10% to 0.09% on the next $3 billion of net assets. The remaining breakpoints in the fee schedule are unchanged. |
|
| Material Fund Change Expenses [Text Block] |
|
Effective December 31, 2025, the Fund's management fees were changed. The management fee was reduced from 0.12% to 0.10% on the first $3 billion of net assets and from 0.10% to 0.09% on the next $3 billion of net assets. The remaining breakpoints in the fee schedule are unchanged.
|
|
| Summary of Change Legend [Text Block] |
|
This is a summary of certain changes to the Fund since August 31, 2025. For more complete information, you may review the Fund's most recent prospectus, which we expect to be effective by December 31 or upon request at www.PrincipalAM.com/prospectuses.
|
|
| Updated Prospectus Web Address |
|
www.PrincipalAM.com/prospectuses
|
|
| C000082026 |
|
|
|
| Shareholder Report [Line Items] |
|
|
|
| Fund Name |
|
Bond Market Index Fund
|
|
| Class Name |
|
Institutional
|
|
| Trading Symbol |
|
PNIIX
|
|
| Annual or Semi-Annual Statement [Text Block] |
|
This annual shareholder report contains important information about Bond Market Index Fund (the "Fund") for the period of September 1, 2025 to August 31, 2026.
|
|
| Shareholder Report Annual or Semi-Annual |
|
Annual Shareholder Report
|
|
| Additional Information [Text Block] |
|
You can find additional information about the Fund at www.PrincipalAM.com/prospectuses or you can request information by contacting us at 1-800-222-5852 or emailing prospectus@principalfunds.com.
|
|
| Material Fund Change Notice [Text Block] |
|
This report describes certain changes to the Fund that occurred during the reporting period.
|
|
| Additional Information Phone Number |
|
1-800-222-5852
|
|
| Additional Information Email |
|
<span style="box-sizing: border-box; color: rgb(0, 0, 0); display: inline; flex-wrap: nowrap; font-size: 10.6667px; font-weight: 400; grid-area: auto; line-height: 16px; margin: 0px; overflow: visible; text-align: left; text-align-last: auto; white-space-collapse: preserve-breaks;">prospectus@principalfunds.com</span>
|
|
| Additional Information Website |
|
<span style="box-sizing: border-box; color: rgb(0, 0, 0); display: inline; flex-wrap: nowrap; font-size: 10.6667px; font-weight: 400; grid-area: auto; line-height: 16px; margin: 0px; overflow: visible; text-align: left; text-align-last: auto; white-space-collapse: preserve-breaks;">www.PrincipalAM.com/prospectuses</span>
|
|
| Expenses [Text Block] |
|
What were the Fund costs for the last year? (based on a hypothetical $10,000 investment) Table SummaryClass Name | Costs of a $10,000 investment | Costs paid as a percentage of a $10,000 investment |
|---|
Institutional | $12 | 0.12% |
|---|
|
|
| Expenses Paid, Amount |
|
$ 12
|
|
| Expense Ratio, Percent |
|
0.12%
|
|
| Factors Affecting Performance [Text Block] |
|
Management’s Discussion of Fund PerformanceThe Fund seeks to provide current income. Under normal circumstances, the Fund invests at least 80% of its net assets in investments designed to track the Bloomberg US Aggregate Index (the "Index") at the time of purchase. The Index is composed of investment grade, fixed-rate debt issues with maturities of one year or more, including government securities, corporate securities, and asset-backed and mortgage-backed securities (securitized products). During the fiscal year ending August 31, 2026, the Fund’s investments performed in line with the Index. The Fund uses a passive investment approach that tracks and replicates the risk and return characteristics of the Index, seeking to provide investment results that closely correspond, before expenses, to the performance of the Index. The top contributors to performance included slightly higher allocation compared to Index weight to investment grade corporate bonds, security specific impacts within U.S. Treasury securities, and slightly higher allocation compared to Index weight to mortgage-backed securities. The top detractors from performance for the fiscal year included security specific impacts within mortgage-backed securities, slightly higher allocation compared to Index weight to U.S. Treasury securities, and security specific impacts within investment grade corporate bonds. |
|
| Performance Past Does Not Indicate Future [Text] |
|
Past performance is not a good predictor of the Fund's future performance.
|
|
| Line Graph [Table Text Block] |
|
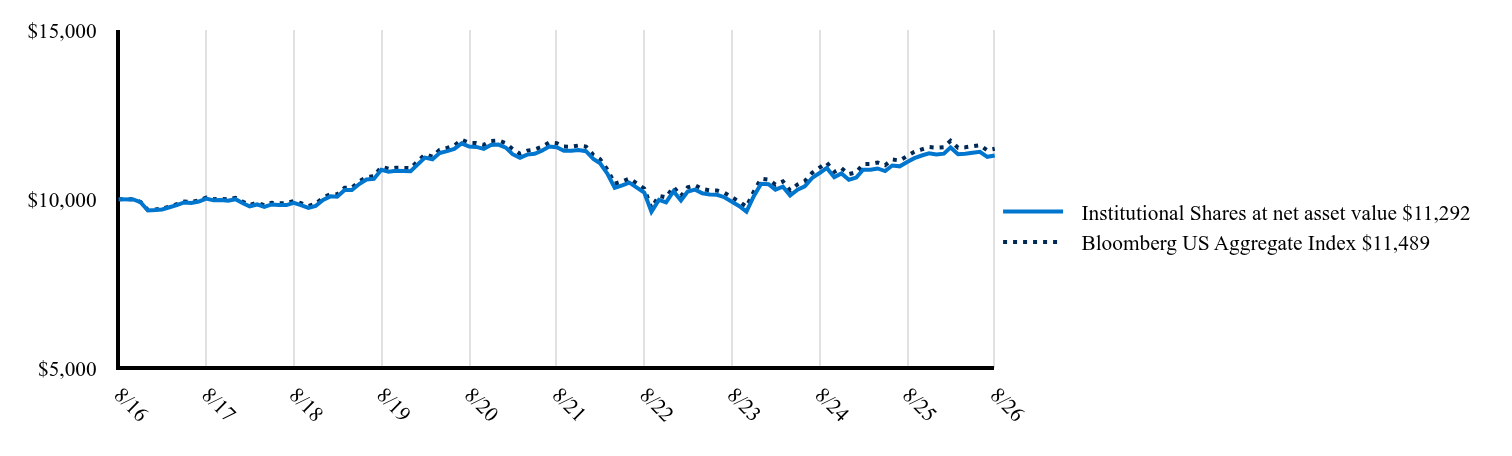 Table Summary | Institutional Shares at net asset value $11,292 | Bloomberg US Aggregate Index $11,489 |
|---|
8/16 | 10,000 | 10,000 |
|---|
10/16 | 9,991 | 9,994 |
|---|
11/16 | 9,912 | 9,918 |
|---|
12/16 | 9,666 | 9,683 |
|---|
1/17 | 9,679 | 9,697 |
|---|
2/17 | 9,697 | 9,716 |
|---|
3/17 | 9,760 | 9,781 |
|---|
4/17 | 9,822 | 9,851 |
|---|
5/17 | 9,903 | 9,927 |
|---|
6/17 | 9,885 | 9,917 |
|---|
7/17 | 9,929 | 9,960 |
|---|
8/17 | 10,019 | 10,049 |
|---|
9/17 | 9,965 | 10,001 |
|---|
10/17 | 9,974 | 10,007 |
|---|
11/17 | 9,956 | 9,994 |
|---|
12/17 | 9,999 | 10,040 |
|---|
1/18 | 9,880 | 9,925 |
|---|
2/18 | 9,789 | 9,830 |
|---|
3/18 | 9,844 | 9,894 |
|---|
4/18 | 9,771 | 9,820 |
|---|
5/18 | 9,844 | 9,890 |
|---|
6/18 | 9,825 | 9,878 |
|---|
7/18 | 9,825 | 9,880 |
|---|
8/18 | 9,889 | 9,944 |
|---|
9/18 | 9,825 | 9,880 |
|---|
10/18 | 9,743 | 9,802 |
|---|
11/18 | 9,798 | 9,860 |
|---|
12/18 | 9,980 | 10,041 |
|---|
1/19 | 10,083 | 10,148 |
|---|
2/19 | 10,073 | 10,142 |
|---|
3/19 | 10,270 | 10,337 |
|---|
4/19 | 10,270 | 10,339 |
|---|
5/19 | 10,448 | 10,523 |
|---|
6/19 | 10,580 | 10,655 |
|---|
7/19 | 10,599 | 10,679 |
|---|
8/19 | 10,871 | 10,955 |
|---|
9/19 | 10,814 | 10,897 |
|---|
10/19 | 10,842 | 10,930 |
|---|
11/19 | 10,833 | 10,924 |
|---|
12/19 | 10,825 | 10,917 |
|---|
1/20 | 11,036 | 11,127 |
|---|
2/20 | 11,228 | 11,327 |
|---|
3/20 | 11,180 | 11,260 |
|---|
4/20 | 11,362 | 11,460 |
|---|
5/20 | 11,420 | 11,514 |
|---|
6/20 | 11,487 | 11,586 |
|---|
7/20 | 11,651 | 11,759 |
|---|
8/20 | 11,554 | 11,664 |
|---|
9/20 | 11,545 | 11,658 |
|---|
10/20 | 11,487 | 11,606 |
|---|
11/20 | 11,603 | 11,720 |
|---|
12/20 | 11,613 | 11,736 |
|---|
1/21 | 11,522 | 11,652 |
|---|
2/21 | 11,329 | 11,484 |
|---|
3/21 | 11,226 | 11,340 |
|---|
4/21 | 11,317 | 11,430 |
|---|
5/21 | 11,340 | 11,467 |
|---|
6/21 | 11,431 | 11,548 |
|---|
7/21 | 11,556 | 11,677 |
|---|
8/21 | 11,534 | 11,655 |
|---|
9/21 | 11,431 | 11,554 |
|---|
10/21 | 11,431 | 11,551 |
|---|
11/21 | 11,454 | 11,585 |
|---|
12/21 | 11,419 | 11,555 |
|---|
1/22 | 11,187 | 11,306 |
|---|
2/22 | 11,059 | 11,180 |
|---|
3/22 | 10,745 | 10,869 |
|---|
4/22 | 10,338 | 10,457 |
|---|
5/22 | 10,407 | 10,524 |
|---|
6/22 | 10,489 | 10,612 |
|---|
8/22 | 10,198 | 10,313 |
|---|
9/22 | 9,628 | 9,739 |
|---|
10/22 | 9,977 | 10,097 |
|---|
11/22 | 9,904 | 10,052 |
|---|
12/22 | 10,235 | 10,361 |
|---|
1/23 | 9,963 | 10,093 |
|---|
2/23 | 10,223 | 10,349 |
|---|
3/23 | 10,282 | 10,412 |
|---|
4/23 | 10,176 | 10,299 |
|---|
5/23 | 10,141 | 10,262 |
|---|
6/23 | 10,129 | 10,255 |
|---|
7/23 | 10,058 | 10,189 |
|---|
9/23 | 9,798 | 9,931 |
|---|
10/23 | 9,632 | 9,774 |
|---|
11/23 | 10,081 | 10,216 |
|---|
12/23 | 10,454 | 10,608 |
|---|
1/24 | 10,442 | 10,578 |
|---|
2/24 | 10,282 | 10,429 |
|---|
3/24 | 10,368 | 10,525 |
|---|
4/24 | 10,109 | 10,259 |
|---|
5/24 | 10,282 | 10,433 |
|---|
6/24 | 10,380 | 10,532 |
|---|
7/24 | 10,627 | 10,778 |
|---|
8/24 | 10,774 | 10,933 |
|---|
9/24 | 10,922 | 11,079 |
|---|
10/24 | 10,651 | 10,805 |
|---|
11/24 | 10,762 | 10,919 |
|---|
12/24 | 10,575 | 10,740 |
|---|
1/25 | 10,639 | 10,797 |
|---|
2/25 | 10,869 | 11,035 |
|---|
3/25 | 10,869 | 11,039 |
|---|
4/25 | 10,907 | 11,082 |
|---|
5/25 | 10,831 | 11,003 |
|---|
6/25 | 10,996 | 11,172 |
|---|
7/25 | 10,971 | 11,143 |
|---|
8/25 | 11,098 | 11,276 |
|---|
9/25 | 11,213 | 11,399 |
|---|
10/25 | 11,290 | 11,470 |
|---|
11/25 | 11,354 | 11,541 |
|---|
12/25 | 11,318 | 11,524 |
|---|
1/26 | 11,345 | 11,537 |
|---|
2/26 | 11,530 | 11,725 |
|---|
3/26 | 11,331 | 11,519 |
|---|
4/26 | 11,345 | 11,532 |
|---|
5/26 | 11,371 | 11,568 |
|---|
6/26 | 11,398 | 11,596 |
|---|
7/26 | 11,252 | 11,444 |
|---|
8/26 | 11,292 | 11,489 |
|---|
|
|
| Average Annual Return [Table Text Block] |
|
Table SummaryName | 1-Year | 5-Year | 10-Year |
|---|
Institutional Shares | 1.74% | -0.42% | 1.22% |
|---|
Bloomberg US Aggregate Index | 1.89% | -0.29% | 1.40% |
|---|
|
|
| No Deduction of Taxes [Text Block] |
|
The graph above represents historical performance of a hypothetical investment of $10,000 in the Fund over the past ten years (or since inception if shorter). The table and graph above do not reflect the impact of taxes. If they did, performance would be lower.
|
|
| Material Change Date |
|
|
Aug. 31, 2025
|
| Updated Performance Information Location [Text Block] |
|
Visit www.principalam.com/mutualfundperformance for more recent performance information.
|
|
| AssetsNet |
|
$ 3,167,674,000
|
|
| Holdings Count | Holding |
|
4,307
|
|
| Advisory Fees Paid, Amount |
|
$ 3,071,000
|
|
| InvestmentCompanyPortfolioTurnover |
|
34.70%
|
|
| Additional Fund Statistics [Text Block] |
|
- Net Assets (amount in thousands)$3,167,674
- Total Number of Portfolio Holdings4,307
- Portfolio Turnover Rate 34.7%
- Total Advisory Fees Paid (amount in thousands)$3,071
|
|
| Holdings [Text Block] |
|
Table SummaryAsset Weighting | Percent of Net Assets |
|---|
U.S. Government & Government Agency Obligations | 70.76% | Bonds | 26.81% | Investment Companies | 2.40% | Municipal Bonds | 0.08% | Other Assets and Liabilities | (0.05)% | Total Net Assets | 100.00% | Table SummarySector | Percent of Net Assets |
|---|
Government | 49.68% | Mortgage Securities | 24.49% | Financial | 7.58% | Consumer, Non-cyclical | 3.92% | Communications | 2.57% | Utilities | 2.42% | Technology | 1.95% | Industrial | 1.69% | Energy | 1.66% | Money Market Funds | 1.52% | Consumer, Cyclical | 1.13% | Exchange-Traded Funds | 0.88% | Basic Materials | 0.48% | Revenue Bonds | 0.04% | General Obligation Unlimited | 0.03% | Insured | 0.01% | Other Assets and Liabilities | (0.05)% | Total Net Assets | 100.00% | |
|
| Material Fund Change [Text Block] |
|
This is a summary of certain changes to the Fund since August 31, 2025. For more complete information, you may review the Fund's most recent prospectus, which we expect to be effective by December 31 or upon request at www.PrincipalAM.com/prospectuses. Effective December 31, 2025, the Fund's management fees were changed. The management fee was reduced from 0.12% to 0.10% on the first $3 billion of net assets and from 0.10% to 0.09% on the next $3 billion of net assets. The remaining breakpoints in the fee schedule are unchanged. |
|
| Material Fund Change Expenses [Text Block] |
|
Effective December 31, 2025, the Fund's management fees were changed. The management fee was reduced from 0.12% to 0.10% on the first $3 billion of net assets and from 0.10% to 0.09% on the next $3 billion of net assets. The remaining breakpoints in the fee schedule are unchanged.
|
|
| Summary of Change Legend [Text Block] |
|
This is a summary of certain changes to the Fund since August 31, 2025. For more complete information, you may review the Fund's most recent prospectus, which we expect to be effective by December 31 or upon request at www.PrincipalAM.com/prospectuses.
|
|
| Updated Prospectus Web Address |
|
www.PrincipalAM.com/prospectuses
|
|
| C000082029 |
|
|
|
| Shareholder Report [Line Items] |
|
|
|
| Fund Name |
|
Bond Market Index Fund
|
|
| Class Name |
|
R-3
|
|
| Trading Symbol |
|
PBOIX
|
|
| Annual or Semi-Annual Statement [Text Block] |
|
This annual shareholder report contains important information about Bond Market Index Fund (the "Fund") for the period of September 1, 2025 to August 31, 2026.
|
|
| Shareholder Report Annual or Semi-Annual |
|
Annual Shareholder Report
|
|
| Additional Information [Text Block] |
|
You can find additional information about the Fund at www.PrincipalAM.com/prospectuses or you can request information by contacting us at 1-800-222-5852 or emailing prospectus@principalfunds.com.
|
|
| Material Fund Change Notice [Text Block] |
|
This report describes certain changes to the Fund that occurred during the reporting period.
|
|
| Additional Information Phone Number |
|
1-800-222-5852
|
|
| Additional Information Email |
|
<span style="box-sizing: border-box; color: rgb(0, 0, 0); display: inline; flex-wrap: nowrap; font-size: 10.6667px; font-weight: 400; grid-area: auto; line-height: 16px; margin: 0px; overflow: visible; text-align: left; text-align-last: auto; white-space-collapse: preserve-breaks;">prospectus@principalfunds.com</span>
|
|
| Additional Information Website |
|
<span style="box-sizing: border-box; color: rgb(0, 0, 0); display: inline; flex-wrap: nowrap; font-size: 10.6667px; font-weight: 400; grid-area: auto; line-height: 16px; margin: 0px; overflow: visible; text-align: left; text-align-last: auto; white-space-collapse: preserve-breaks;">www.PrincipalAM.com/prospectuses</span>
|
|
| Expenses [Text Block] |
|
What were the Fund costs for the last year? (based on a hypothetical $10,000 investment) Table SummaryClass Name | Costs of a $10,000 investment | Costs paid as a percentage of a $10,000 investment |
|---|
R-3 | $68 | 0.68% |
|---|
|
|
| Expenses Paid, Amount |
|
$ 68
|
|
| Expense Ratio, Percent |
|
0.68%
|
|
| Factors Affecting Performance [Text Block] |
|
Management’s Discussion of Fund PerformanceThe Fund seeks to provide current income. Under normal circumstances, the Fund invests at least 80% of its net assets in investments designed to track the Bloomberg US Aggregate Index (the "Index") at the time of purchase. The Index is composed of investment grade, fixed-rate debt issues with maturities of one year or more, including government securities, corporate securities, and asset-backed and mortgage-backed securities (securitized products). During the fiscal year ending August 31, 2026, the Fund’s investments performed in line with the Index. The Fund uses a passive investment approach that tracks and replicates the risk and return characteristics of the Index, seeking to provide investment results that closely correspond, before expenses, to the performance of the Index. The top contributors to performance included slightly higher allocation compared to Index weight to investment grade corporate bonds, security specific impacts within U.S. Treasury securities, and slightly higher allocation compared to Index weight to mortgage-backed securities. The top detractors from performance for the fiscal year included security specific impacts within mortgage-backed securities, slightly higher allocation compared to Index weight to U.S. Treasury securities, and security specific impacts within investment grade corporate bonds. |
|
| Performance Past Does Not Indicate Future [Text] |
|
Past performance is not a good predictor of the Fund's future performance.
|
|
| Line Graph [Table Text Block] |
|
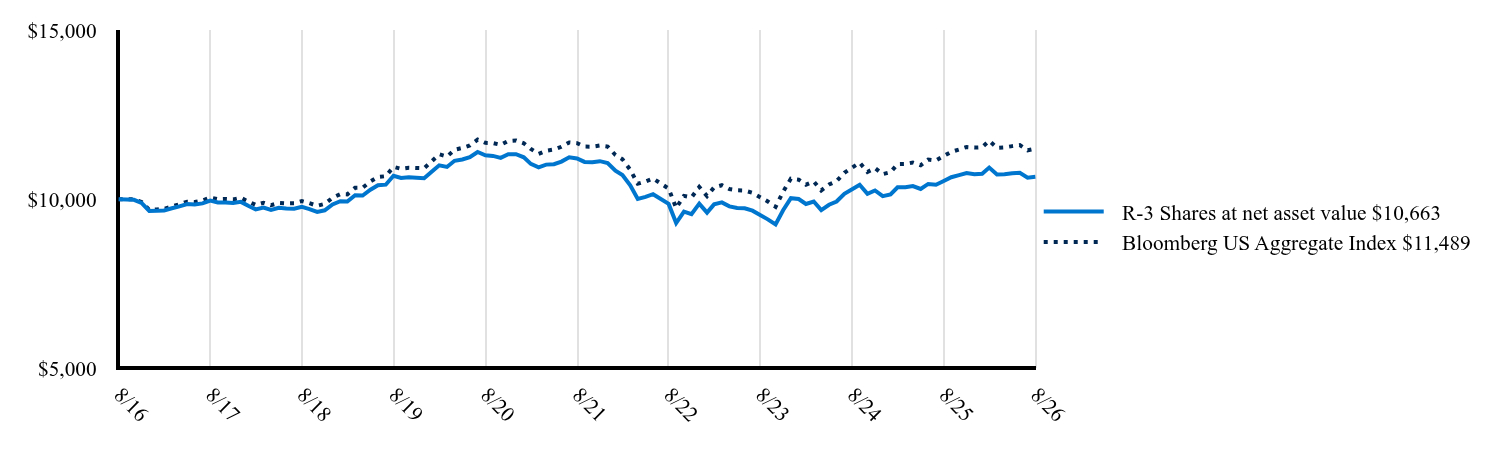 Table Summary | R-3 Shares at net asset value $10,663 | Bloomberg US Aggregate Index $11,489 |
|---|
8/16 | 10,000 | 10,000 |
|---|
10/16 | 9,982 | 9,994 |
|---|
11/16 | 9,892 | 9,918 |
|---|
12/16 | 9,651 | 9,683 |
|---|
1/17 | 9,659 | 9,697 |
|---|
2/17 | 9,668 | 9,716 |
|---|
3/17 | 9,731 | 9,781 |
|---|
4/17 | 9,786 | 9,851 |
|---|
5/17 | 9,858 | 9,927 |
|---|
6/17 | 9,840 | 9,917 |
|---|
7/17 | 9,876 | 9,960 |
|---|
8/17 | 9,958 | 10,049 |
|---|
9/17 | 9,904 | 10,001 |
|---|
10/17 | 9,904 | 10,007 |
|---|
11/17 | 9,886 | 9,994 |
|---|
12/17 | 9,920 | 10,040 |
|---|
1/18 | 9,800 | 9,925 |
|---|
2/18 | 9,698 | 9,830 |
|---|
3/18 | 9,754 | 9,894 |
|---|
4/18 | 9,680 | 9,820 |
|---|
5/18 | 9,745 | 9,890 |
|---|
6/18 | 9,726 | 9,878 |
|---|
7/18 | 9,717 | 9,880 |
|---|
8/18 | 9,772 | 9,944 |
|---|
9/18 | 9,708 | 9,880 |
|---|
10/18 | 9,624 | 9,802 |
|---|
11/18 | 9,671 | 9,860 |
|---|
12/18 | 9,844 | 10,041 |
|---|
1/19 | 9,939 | 10,148 |
|---|
2/19 | 9,929 | 10,142 |
|---|
3/19 | 10,118 | 10,337 |
|---|
4/19 | 10,108 | 10,339 |
|---|
5/19 | 10,278 | 10,523 |
|---|
6/19 | 10,410 | 10,655 |
|---|
7/19 | 10,428 | 10,679 |
|---|
8/19 | 10,692 | 10,955 |
|---|
9/19 | 10,626 | 10,897 |
|---|
10/19 | 10,645 | 10,930 |
|---|
11/19 | 10,636 | 10,924 |
|---|
12/19 | 10,617 | 10,917 |
|---|
1/20 | 10,818 | 11,127 |
|---|
2/20 | 11,000 | 11,327 |
|---|
3/20 | 10,952 | 11,260 |
|---|
4/20 | 11,135 | 11,460 |
|---|
5/20 | 11,173 | 11,514 |
|---|
6/20 | 11,240 | 11,586 |
|---|
7/20 | 11,394 | 11,759 |
|---|
8/20 | 11,298 | 11,664 |
|---|
9/20 | 11,278 | 11,658 |
|---|
10/20 | 11,221 | 11,606 |
|---|
11/20 | 11,326 | 11,720 |
|---|
12/20 | 11,328 | 11,736 |
|---|
1/21 | 11,237 | 11,652 |
|---|
2/21 | 11,044 | 11,484 |
|---|
3/21 | 10,942 | 11,340 |
|---|
4/21 | 11,021 | 11,430 |
|---|
5/21 | 11,033 | 11,467 |
|---|
6/21 | 11,112 | 11,548 |
|---|
7/21 | 11,237 | 11,677 |
|---|
8/21 | 11,203 | 11,655 |
|---|
9/21 | 11,101 | 11,554 |
|---|
10/21 | 11,089 | 11,551 |
|---|
11/21 | 11,123 | 11,585 |
|---|
12/21 | 11,069 | 11,555 |
|---|
1/22 | 10,839 | 11,306 |
|---|
2/22 | 10,712 | 11,180 |
|---|
3/22 | 10,412 | 10,869 |
|---|
4/22 | 10,009 | 10,457 |
|---|
5/22 | 10,067 | 10,524 |
|---|
6/22 | 10,147 | 10,612 |
|---|
8/22 | 9,860 | 10,313 |
|---|
9/22 | 9,295 | 9,739 |
|---|
10/22 | 9,629 | 10,097 |
|---|
11/22 | 9,555 | 10,052 |
|---|
12/22 | 9,869 | 10,361 |
|---|
1/23 | 9,602 | 10,093 |
|---|
2/23 | 9,846 | 10,349 |
|---|
3/23 | 9,904 | 10,412 |
|---|
4/23 | 9,788 | 10,299 |
|---|
5/23 | 9,741 | 10,262 |
|---|
6/23 | 9,730 | 10,255 |
|---|
7/23 | 9,660 | 10,189 |
|---|
9/23 | 9,404 | 9,931 |
|---|
10/23 | 9,253 | 9,774 |
|---|
11/23 | 9,672 | 10,216 |
|---|
12/23 | 10,028 | 10,608 |
|---|
1/24 | 10,004 | 10,578 |
|---|
2/24 | 9,859 | 10,429 |
|---|
3/24 | 9,931 | 10,525 |
|---|
4/24 | 9,678 | 10,259 |
|---|
5/24 | 9,835 | 10,433 |
|---|
6/24 | 9,931 | 10,532 |
|---|
7/24 | 10,160 | 10,778 |
|---|
8/24 | 10,293 | 10,933 |
|---|
9/24 | 10,426 | 11,079 |
|---|
10/24 | 10,160 | 10,805 |
|---|
11/24 | 10,257 | 10,919 |
|---|
12/24 | 10,089 | 10,740 |
|---|
1/25 | 10,139 | 10,797 |
|---|
2/25 | 10,351 | 11,035 |
|---|
3/25 | 10,351 | 11,039 |
|---|
4/25 | 10,388 | 11,082 |
|---|
5/25 | 10,301 | 11,003 |
|---|
6/25 | 10,450 | 11,172 |
|---|
7/25 | 10,425 | 11,143 |
|---|
8/25 | 10,537 | 11,276 |
|---|
9/25 | 10,649 | 11,399 |
|---|
10/25 | 10,712 | 11,470 |
|---|
11/25 | 10,774 | 11,541 |
|---|
12/25 | 10,740 | 11,524 |
|---|
1/26 | 10,753 | 11,537 |
|---|
2/26 | 10,933 | 11,725 |
|---|
3/26 | 10,727 | 11,519 |
|---|
4/26 | 10,740 | 11,532 |
|---|
5/26 | 10,766 | 11,568 |
|---|
6/26 | 10,778 | 11,596 |
|---|
7/26 | 10,637 | 11,444 |
|---|
8/26 | 10,663 | 11,489 |
|---|
|
|
| Average Annual Return [Table Text Block] |
|
Table SummaryName | 1-Year | 5-Year | 10-Year |
|---|
R-3 Shares | 1.19% | -0.98% | 0.64% |
|---|
Bloomberg US Aggregate Index | 1.89% | -0.29% | 1.40% |
|---|
|
|
| No Deduction of Taxes [Text Block] |
|
The graph above represents historical performance of a hypothetical investment of $10,000 in the Fund over the past ten years (or since inception if shorter). The table and graph above do not reflect the impact of taxes. If they did, performance would be lower.
|
|
| Material Change Date |
|
|
Aug. 31, 2025
|
| Updated Performance Information Location [Text Block] |
|
Visit www.principalam.com/mutualfundperformance for more recent performance information.
|
|
| AssetsNet |
|
$ 3,167,674,000
|
|
| Holdings Count | Holding |
|
4,307
|
|
| Advisory Fees Paid, Amount |
|
$ 3,071,000
|
|
| InvestmentCompanyPortfolioTurnover |
|
34.70%
|
|
| Additional Fund Statistics [Text Block] |
|
- Net Assets (amount in thousands)$3,167,674
- Total Number of Portfolio Holdings4,307
- Portfolio Turnover Rate 34.7%
- Total Advisory Fees Paid (amount in thousands)$3,071
|
|
| Holdings [Text Block] |
|
Table SummaryAsset Weighting | Percent of Net Assets |
|---|
U.S. Government & Government Agency Obligations | 70.76% | Bonds | 26.81% | Investment Companies | 2.40% | Municipal Bonds | 0.08% | Other Assets and Liabilities | (0.05)% | Total Net Assets | 100.00% | Table SummarySector | Percent of Net Assets |
|---|
Government | 49.68% | Mortgage Securities | 24.49% | Financial | 7.58% | Consumer, Non-cyclical | 3.92% | Communications | 2.57% | Utilities | 2.42% | Technology | 1.95% | Industrial | 1.69% | Energy | 1.66% | Money Market Funds | 1.52% | Consumer, Cyclical | 1.13% | Exchange-Traded Funds | 0.88% | Basic Materials | 0.48% | Revenue Bonds | 0.04% | General Obligation Unlimited | 0.03% | Insured | 0.01% | Other Assets and Liabilities | (0.05)% | Total Net Assets | 100.00% | |
|
| Material Fund Change [Text Block] |
|
This is a summary of certain changes to the Fund since August 31, 2025. For more complete information, you may review the Fund's most recent prospectus, which we expect to be effective by December 31 or upon request at www.PrincipalAM.com/prospectuses. Effective December 31, 2025, the Fund's management fees were changed. The management fee was reduced from 0.12% to 0.10% on the first $3 billion of net assets and from 0.10% to 0.09% on the next $3 billion of net assets. The remaining breakpoints in the fee schedule are unchanged. |
|
| Material Fund Change Expenses [Text Block] |
|
Effective December 31, 2025, the Fund's management fees were changed. The management fee was reduced from 0.12% to 0.10% on the first $3 billion of net assets and from 0.10% to 0.09% on the next $3 billion of net assets. The remaining breakpoints in the fee schedule are unchanged.
|
|
| Summary of Change Legend [Text Block] |
|
This is a summary of certain changes to the Fund since August 31, 2025. For more complete information, you may review the Fund's most recent prospectus, which we expect to be effective by December 31 or upon request at www.PrincipalAM.com/prospectuses.
|
|
| Updated Prospectus Web Address |
|
www.PrincipalAM.com/prospectuses
|
|
| C000082031 |
|
|
|
| Shareholder Report [Line Items] |
|
|
|
| Fund Name |
|
Bond Market Index Fund
|
|
| Class Name |
|
R-5
|
|
| Trading Symbol |
|
PBIQX
|
|
| Annual or Semi-Annual Statement [Text Block] |
|
This annual shareholder report contains important information about Bond Market Index Fund (the "Fund") for the period of September 1, 2025 to August 31, 2026.
|
|
| Shareholder Report Annual or Semi-Annual |
|
Annual Shareholder Report
|
|
| Additional Information [Text Block] |
|
You can find additional information about the Fund at www.PrincipalAM.com/prospectuses or you can request information by contacting us at 1-800-222-5852 or emailing prospectus@principalfunds.com.
|
|
| Material Fund Change Notice [Text Block] |
|
This report describes certain changes to the Fund that occurred during the reporting period.
|
|
| Additional Information Phone Number |
|
1-800-222-5852
|
|
| Additional Information Email |
|
<span style="box-sizing: border-box; color: rgb(0, 0, 0); display: inline; flex-wrap: nowrap; font-size: 10.6667px; font-weight: 400; grid-area: auto; line-height: 16px; margin: 0px; overflow: visible; text-align: left; text-align-last: auto; white-space-collapse: preserve-breaks;">prospectus@principalfunds.com</span>
|
|
| Additional Information Website |
|
<span style="box-sizing: border-box; color: rgb(0, 0, 0); display: inline; flex-wrap: nowrap; font-size: 10.6667px; font-weight: 400; grid-area: auto; line-height: 16px; margin: 0px; overflow: visible; text-align: left; text-align-last: auto; white-space-collapse: preserve-breaks;">www.PrincipalAM.com/prospectuses</span>
|
|
| Expenses [Text Block] |
|
What were the Fund costs for the last year? (based on a hypothetical $10,000 investment) Table SummaryClass Name | Costs of a $10,000 investment | Costs paid as a percentage of a $10,000 investment |
|---|
R-5 | $37 | 0.37% |
|---|
|
|
| Expenses Paid, Amount |
|
$ 37
|
|
| Expense Ratio, Percent |
|
0.37%
|
|
| Factors Affecting Performance [Text Block] |
|
Management’s Discussion of Fund PerformanceThe Fund seeks to provide current income. Under normal circumstances, the Fund invests at least 80% of its net assets in investments designed to track the Bloomberg US Aggregate Index (the "Index") at the time of purchase. The Index is composed of investment grade, fixed-rate debt issues with maturities of one year or more, including government securities, corporate securities, and asset-backed and mortgage-backed securities (securitized products). During the fiscal year ending August 31, 2026, the Fund’s investments performed in line with the Index. The Fund uses a passive investment approach that tracks and replicates the risk and return characteristics of the Index, seeking to provide investment results that closely correspond, before expenses, to the performance of the Index. The top contributors to performance included slightly higher allocation compared to Index weight to investment grade corporate bonds, security specific impacts within U.S. Treasury securities, and slightly higher allocation compared to Index weight to mortgage-backed securities. The top detractors from performance for the fiscal year included security specific impacts within mortgage-backed securities, slightly higher allocation compared to Index weight to U.S. Treasury securities, and security specific impacts within investment grade corporate bonds. |
|
| Performance Past Does Not Indicate Future [Text] |
|
Past performance is not a good predictor of the Fund's future performance.
|
|
| Line Graph [Table Text Block] |
|
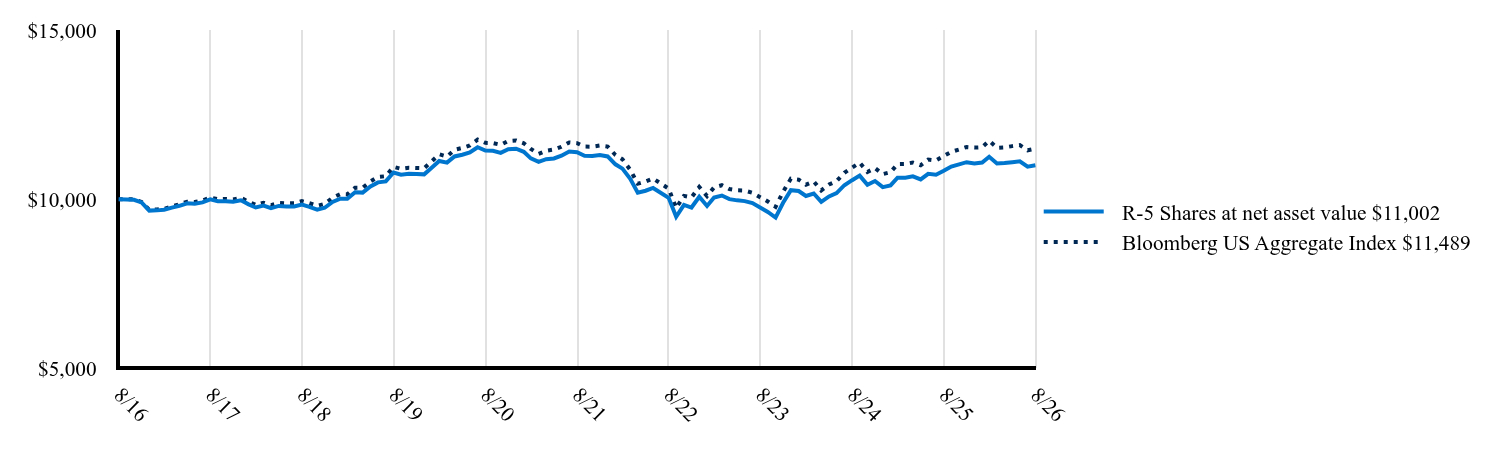 Table Summary | R-5 Shares at net asset value $11,002 | Bloomberg US Aggregate Index $11,489 |
|---|
8/16 | 10,000 | 10,000 |
|---|
10/16 | 9,982 | 9,994 |
|---|
11/16 | 9,902 | 9,918 |
|---|
12/16 | 9,662 | 9,683 |
|---|
1/17 | 9,669 | 9,697 |
|---|
2/17 | 9,687 | 9,716 |
|---|
3/17 | 9,750 | 9,781 |
|---|
4/17 | 9,804 | 9,851 |
|---|
5/17 | 9,877 | 9,927 |
|---|
6/17 | 9,868 | 9,917 |
|---|
7/17 | 9,904 | 9,960 |
|---|
8/17 | 9,994 | 10,049 |
|---|
9/17 | 9,940 | 10,001 |
|---|
10/17 | 9,940 | 10,007 |
|---|
11/17 | 9,922 | 9,994 |
|---|
12/17 | 9,968 | 10,040 |
|---|
1/18 | 9,847 | 9,925 |
|---|
2/18 | 9,755 | 9,830 |
|---|
3/18 | 9,811 | 9,894 |
|---|
4/18 | 9,737 | 9,820 |
|---|
5/18 | 9,801 | 9,890 |
|---|
6/18 | 9,783 | 9,878 |
|---|
7/18 | 9,783 | 9,880 |
|---|
8/18 | 9,838 | 9,944 |
|---|
9/18 | 9,774 | 9,880 |
|---|
10/18 | 9,690 | 9,802 |
|---|
11/18 | 9,746 | 9,860 |
|---|
12/18 | 9,920 | 10,041 |
|---|
1/19 | 10,015 | 10,148 |
|---|
2/19 | 10,015 | 10,142 |
|---|
3/19 | 10,204 | 10,337 |
|---|
4/19 | 10,194 | 10,339 |
|---|
5/19 | 10,374 | 10,523 |
|---|
6/19 | 10,496 | 10,655 |
|---|
7/19 | 10,525 | 10,679 |
|---|
8/19 | 10,789 | 10,955 |
|---|
9/19 | 10,723 | 10,897 |
|---|
10/19 | 10,751 | 10,930 |
|---|
11/19 | 10,742 | 10,924 |
|---|
12/19 | 10,733 | 10,917 |
|---|
1/20 | 10,935 | 11,127 |
|---|
2/20 | 11,128 | 11,327 |
|---|
3/20 | 11,080 | 11,260 |
|---|
4/20 | 11,263 | 11,460 |
|---|
5/20 | 11,312 | 11,514 |
|---|
6/20 | 11,379 | 11,586 |
|---|
7/20 | 11,534 | 11,759 |
|---|
8/20 | 11,437 | 11,664 |
|---|
9/20 | 11,428 | 11,658 |
|---|
10/20 | 11,370 | 11,606 |
|---|
11/20 | 11,476 | 11,720 |
|---|
12/20 | 11,490 | 11,736 |
|---|
1/21 | 11,399 | 11,652 |
|---|
2/21 | 11,204 | 11,484 |
|---|
3/21 | 11,101 | 11,340 |
|---|
4/21 | 11,181 | 11,430 |
|---|
5/21 | 11,204 | 11,467 |
|---|
6/21 | 11,284 | 11,548 |
|---|
7/21 | 11,410 | 11,677 |
|---|
8/21 | 11,387 | 11,655 |
|---|
9/21 | 11,284 | 11,554 |
|---|
10/21 | 11,273 | 11,551 |
|---|
11/21 | 11,307 | 11,585 |
|---|
12/21 | 11,263 | 11,555 |
|---|
1/22 | 11,030 | 11,306 |
|---|
2/22 | 10,902 | 11,180 |
|---|
3/22 | 10,599 | 10,869 |
|---|
4/22 | 10,191 | 10,457 |
|---|
5/22 | 10,249 | 10,524 |
|---|
6/22 | 10,331 | 10,612 |
|---|
8/22 | 10,039 | 10,313 |
|---|
9/22 | 9,479 | 9,739 |
|---|
10/22 | 9,829 | 10,097 |
|---|
11/22 | 9,753 | 10,052 |
|---|
12/22 | 10,072 | 10,361 |
|---|
1/23 | 9,800 | 10,093 |
|---|
2/23 | 10,048 | 10,349 |
|---|
3/23 | 10,107 | 10,412 |
|---|
4/23 | 10,001 | 10,299 |
|---|
5/23 | 9,965 | 10,262 |
|---|
6/23 | 9,942 | 10,255 |
|---|
7/23 | 9,883 | 10,189 |
|---|
9/23 | 9,623 | 9,931 |
|---|
10/23 | 9,457 | 9,774 |
|---|
11/23 | 9,894 | 10,216 |
|---|
12/23 | 10,266 | 10,608 |
|---|
1/24 | 10,241 | 10,578 |
|---|
2/24 | 10,094 | 10,429 |
|---|
3/24 | 10,167 | 10,525 |
|---|
4/24 | 9,922 | 10,259 |
|---|
5/24 | 10,081 | 10,433 |
|---|
6/24 | 10,180 | 10,532 |
|---|
7/24 | 10,413 | 10,778 |
|---|
8/24 | 10,561 | 10,933 |
|---|
9/24 | 10,696 | 11,079 |
|---|
10/24 | 10,426 | 10,805 |
|---|
11/24 | 10,536 | 10,919 |
|---|
12/24 | 10,355 | 10,740 |
|---|
1/25 | 10,406 | 10,797 |
|---|
2/25 | 10,635 | 11,035 |
|---|
3/25 | 10,635 | 11,039 |
|---|
4/25 | 10,673 | 11,082 |
|---|
5/25 | 10,584 | 11,003 |
|---|
6/25 | 10,749 | 11,172 |
|---|
7/25 | 10,724 | 11,143 |
|---|
8/25 | 10,838 | 11,276 |
|---|
9/25 | 10,966 | 11,399 |
|---|
10/25 | 11,029 | 11,470 |
|---|
11/25 | 11,093 | 11,541 |
|---|
12/25 | 11,055 | 11,524 |
|---|
1/26 | 11,081 | 11,537 |
|---|
2/26 | 11,253 | 11,725 |
|---|
3/26 | 11,055 | 11,519 |
|---|
4/26 | 11,068 | 11,532 |
|---|
5/26 | 11,094 | 11,568 |
|---|
6/26 | 11,121 | 11,596 |
|---|
7/26 | 10,962 | 11,444 |
|---|
8/26 | 11,002 | 11,489 |
|---|
|
|
| Average Annual Return [Table Text Block] |
|
Table SummaryName | 1-Year | 5-Year | 10-Year |
|---|
R-5 Shares | 1.51% | -0.69% | 0.96% |
|---|
Bloomberg US Aggregate Index | 1.89% | -0.29% | 1.40% |
|---|
|
|
| No Deduction of Taxes [Text Block] |
|
The graph above represents historical performance of a hypothetical investment of $10,000 in the Fund over the past ten years (or since inception if shorter). The table and graph above do not reflect the impact of taxes. If they did, performance would be lower.
|
|
| Material Change Date |
|
|
Aug. 31, 2025
|
| Updated Performance Information Location [Text Block] |
|
Visit www.principalam.com/mutualfundperformance for more recent performance information.
|
|
| AssetsNet |
|
$ 3,167,674,000
|
|
| Holdings Count | Holding |
|
4,307
|
|
| Advisory Fees Paid, Amount |
|
$ 3,071,000
|
|
| InvestmentCompanyPortfolioTurnover |
|
34.70%
|
|
| Additional Fund Statistics [Text Block] |
|
- Net Assets (amount in thousands)$3,167,674
- Total Number of Portfolio Holdings4,307
- Portfolio Turnover Rate 34.7%
- Total Advisory Fees Paid (amount in thousands)$3,071
|
|
| Holdings [Text Block] |
|
Table SummaryAsset Weighting | Percent of Net Assets |
|---|
U.S. Government & Government Agency Obligations | 70.76% | Bonds | 26.81% | Investment Companies | 2.40% | Municipal Bonds | 0.08% | Other Assets and Liabilities | (0.05)% | Total Net Assets | 100.00% | Table SummarySector | Percent of Net Assets |
|---|
Government | 49.68% | Mortgage Securities | 24.49% | Financial | 7.58% | Consumer, Non-cyclical | 3.92% | Communications | 2.57% | Utilities | 2.42% | Technology | 1.95% | Industrial | 1.69% | Energy | 1.66% | Money Market Funds | 1.52% | Consumer, Cyclical | 1.13% | Exchange-Traded Funds | 0.88% | Basic Materials | 0.48% | Revenue Bonds | 0.04% | General Obligation Unlimited | 0.03% | Insured | 0.01% | Other Assets and Liabilities | (0.05)% | Total Net Assets | 100.00% | |
|
| Material Fund Change [Text Block] |
|
This is a summary of certain changes to the Fund since August 31, 2025. For more complete information, you may review the Fund's most recent prospectus, which we expect to be effective by December 31 or upon request at www.PrincipalAM.com/prospectuses. Effective December 31, 2025, the Fund's management fees were changed. The management fee was reduced from 0.12% to 0.10% on the first $3 billion of net assets and from 0.10% to 0.09% on the next $3 billion of net assets. The remaining breakpoints in the fee schedule are unchanged. |
|
| Material Fund Change Expenses [Text Block] |
|
Effective December 31, 2025, the Fund's management fees were changed. The management fee was reduced from 0.12% to 0.10% on the first $3 billion of net assets and from 0.10% to 0.09% on the next $3 billion of net assets. The remaining breakpoints in the fee schedule are unchanged.
|
|
| Summary of Change Legend [Text Block] |
|
This is a summary of certain changes to the Fund since August 31, 2025. For more complete information, you may review the Fund's most recent prospectus, which we expect to be effective by December 31 or upon request at www.PrincipalAM.com/prospectuses.
|
|
| Updated Prospectus Web Address |
|
www.PrincipalAM.com/prospectuses
|
|
| C000129138 |
|
|
|
| Shareholder Report [Line Items] |
|
|
|
| Fund Name |
|
Capital Securities Fund
|
|
| Class Name |
|
Class S
|
|
| Trading Symbol |
|
PCSFX
|
|
| Annual or Semi-Annual Statement [Text Block] |
|
This annual shareholder report contains important information about Capital Securities Fund (the "Fund") for the period of September 1, 2025 to August 31, 2026.
|
|
| Shareholder Report Annual or Semi-Annual |
|
Annual Shareholder Report
|
|
| Additional Information [Text Block] |
|
You can find additional information about the Fund at www.PrincipalAM.com/prospectuses or you can request information by contacting us at 1-800-222-5852 or emailing prospectus@principalfunds.com.
|
|
| Additional Information Phone Number |
|
1-800-222-5852
|
|
| Additional Information Email |
|
<span style="box-sizing: border-box; color: rgb(0, 0, 0); display: inline; flex-wrap: nowrap; font-size: 10.6667px; font-weight: 400; grid-area: auto; line-height: 16px; margin: 0px; overflow: visible; text-align: left; text-align-last: auto; white-space-collapse: preserve-breaks;">prospectus@principalfunds.com</span>
|
|
| Additional Information Website |
|
<span style="box-sizing: border-box; color: rgb(0, 0, 0); display: inline; flex-wrap: nowrap; font-size: 10.6667px; font-weight: 400; grid-area: auto; line-height: 16px; margin: 0px; overflow: visible; text-align: left; text-align-last: auto; white-space-collapse: preserve-breaks;">www.PrincipalAM.com/prospectuses</span>
|
|
| Expenses [Text Block] |
|
What were the Fund costs for the last year? (based on a hypothetical $10,000 investment) Table SummaryClass Name | Costs of a $10,000 investment | Costs paid as a percentage of a $10,000 investment |
|---|
Class S | $0 | 0.00% |
|---|
|
|
| Expenses Paid, Amount |
|
$ 0
|
|
| Expense Ratio, Percent |
|
0.00%
|
|
| Factors Affecting Performance [Text Block] |
|
Management’s Discussion of Fund PerformanceThe Fund seeks to provide current income. The Fund invests at least 80% of its net assets in capital securities. It may invest up to 100% of its assets in below investment grade (sometimes called "junk") preferred securities, which are rated at the time of purchase Ba1 or lower by Moody's and BB+ or lower by S&P Global. The Fund concentrates its investments (invests more than 25% of its net assets) in securities in one or more industries (i.e., banking, insurance, and commercial finance) within the U.S. and non-U.S. (foreign) financial services sector. The bond market spent the first four months of the fiscal year in an easing cycle and the final eight in a pause. The Fed cut rates by 25 basis points (bps) in September, October, and December bringing the target rate to 3.50%-3.75%, with the September move described as a "risk management cut" in response to sharply revised payrolls. Policy remained on hold through August, even as the bond market began pricing in hikes. Rates did not follow the Fed lower: the 5 year U.S. Treasury yield rose about 75bps to 4.50%, driven primarily by real rates, which climbed from 1.29% to 2.15%, while 5 year breakevens edged lower to 2.35%. Supply and term premium, rather than inflation expectations, drove the move. Spreads tightened into January, widened sharply in March when conflict with Iran pushed oil over $100 and the CBOE Volatility Index above 30. Hybrid prices had their worst month in two and a half years, then snapped back in April on a 10% equity rally and re-tightened through the summer. Allocation and security selection within banking and insurance industries were the primary contributors to Fund investment performance in absolute terms and relative to the ICE BofA US All Capital Securities Index. REITS and telecommunications contributed positively but underweights in each detracted from relative Index performance. An out-of-index allocation to ETFs detracted. Elevated real rates and resilient risk sentiment continue to keep U.S. Treasury yields high and credit spreads tighter than average. |
|
| Performance Past Does Not Indicate Future [Text] |
|
Past performance is not a good predictor of the Fund's future performance.
|
|
| Line Graph [Table Text Block] |
|
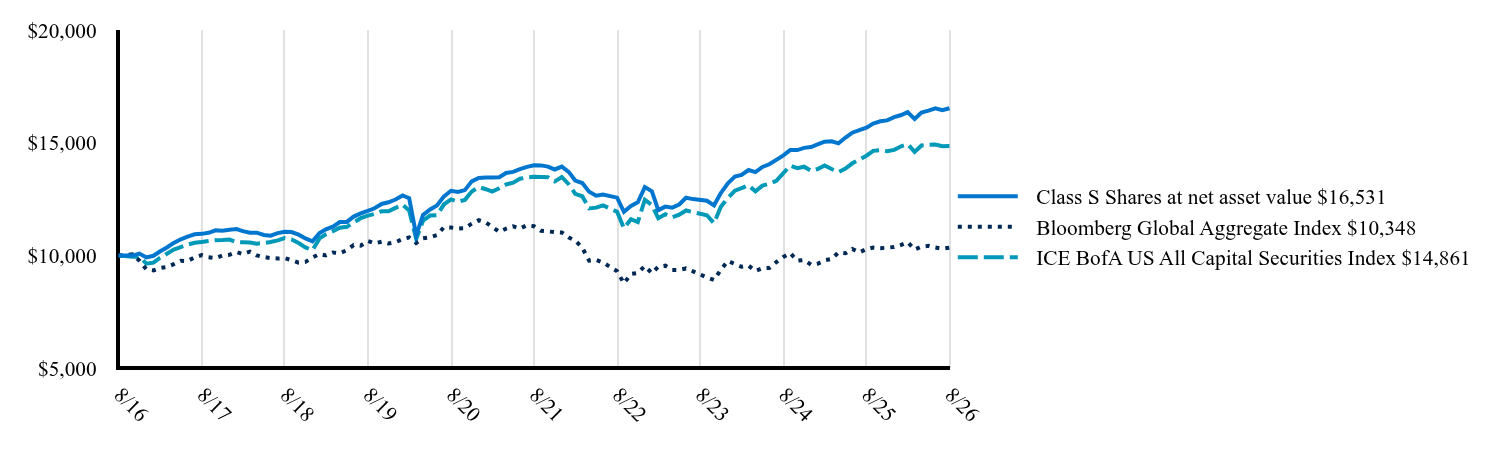 Table Summary | Class S Shares at net asset value $16,531 | Bloomberg Global Aggregate Index $10,348 | ICE BofA US All Capital Securities Index $14,861 |
|---|
8/16 | 10,000 | 10,000 | 10,000 |
|---|
10/16 | 10,000 | 10,055 | 9,949 |
|---|
11/16 | 10,089 | 9,776 | 9,948 |
|---|
12/16 | 9,917 | 9,388 | 9,642 |
|---|
1/17 | 9,990 | 9,344 | 9,686 |
|---|
2/17 | 10,177 | 9,450 | 9,892 |
|---|
3/17 | 10,356 | 9,494 | 10,080 |
|---|
4/17 | 10,561 | 9,616 | 10,269 |
|---|
5/17 | 10,721 | 9,765 | 10,376 |
|---|
6/17 | 10,840 | 9,757 | 10,485 |
|---|
7/17 | 10,944 | 9,921 | 10,565 |
|---|
8/17 | 10,962 | 10,019 | 10,605 |
|---|
9/17 | 11,010 | 9,929 | 10,642 |
|---|
10/17 | 11,121 | 9,891 | 10,682 |
|---|
11/17 | 11,103 | 10,001 | 10,690 |
|---|
12/17 | 11,146 | 10,035 | 10,709 |
|---|
1/18 | 11,173 | 10,155 | 10,592 |
|---|
2/18 | 11,081 | 10,065 | 10,595 |
|---|
3/18 | 11,009 | 10,172 | 10,580 |
|---|
4/18 | 11,016 | 10,009 | 10,527 |
|---|
5/18 | 10,911 | 9,933 | 10,557 |
|---|
6/18 | 10,881 | 9,889 | 10,604 |
|---|
7/18 | 10,993 | 9,872 | 10,671 |
|---|
8/18 | 11,057 | 9,883 | 10,775 |
|---|
9/18 | 11,041 | 9,798 | 10,716 |
|---|
10/18 | 10,927 | 9,688 | 10,556 |
|---|
11/18 | 10,759 | 9,718 | 10,364 |
|---|
12/18 | 10,632 | 9,915 | 10,233 |
|---|
1/19 | 10,999 | 10,066 | 10,761 |
|---|
2/19 | 11,165 | 10,008 | 10,941 |
|---|
3/19 | 11,284 | 10,133 | 11,084 |
|---|
4/19 | 11,486 | 10,103 | 11,236 |
|---|
5/19 | 11,492 | 10,240 | 11,273 |
|---|
6/19 | 11,729 | 10,467 | 11,465 |
|---|
7/19 | 11,872 | 10,438 | 11,657 |
|---|
8/19 | 11,984 | 10,650 | 11,769 |
|---|
9/19 | 12,097 | 10,542 | 11,847 |
|---|
10/19 | 12,287 | 10,612 | 11,965 |
|---|
11/19 | 12,361 | 10,532 | 11,966 |
|---|
12/19 | 12,484 | 10,593 | 12,114 |
|---|
1/20 | 12,665 | 10,728 | 12,261 |
|---|
2/20 | 12,543 | 10,801 | 11,998 |
|---|
3/20 | 10,896 | 10,559 | 10,725 |
|---|
4/20 | 11,799 | 10,766 | 11,553 |
|---|
5/20 | 12,045 | 10,813 | 11,773 |
|---|
6/20 | 12,218 | 10,909 | 11,792 |
|---|
7/20 | 12,625 | 11,257 | 12,273 |
|---|
8/20 | 12,873 | 11,240 | 12,491 |
|---|
9/20 | 12,819 | 11,199 | 12,391 |
|---|
10/20 | 12,902 | 11,210 | 12,469 |
|---|
11/20 | 13,291 | 11,414 | 12,838 |
|---|
12/20 | 13,443 | 11,567 | 13,038 |
|---|
1/21 | 13,465 | 11,465 | 12,941 |
|---|
2/21 | 13,463 | 11,268 | 12,835 |
|---|
3/21 | 13,473 | 11,051 | 12,984 |
|---|
4/21 | 13,662 | 11,191 | 13,151 |
|---|
5/21 | 13,711 | 11,296 | 13,228 |
|---|
6/21 | 13,834 | 11,196 | 13,405 |
|---|
7/21 | 13,931 | 11,345 | 13,463 |
|---|
8/21 | 14,002 | 11,298 | 13,489 |
|---|
9/21 | 13,998 | 11,097 | 13,486 |
|---|
10/21 | 13,943 | 11,071 | 13,474 |
|---|
11/21 | 13,817 | 11,038 | 13,287 |
|---|
12/21 | 13,946 | 11,023 | 13,484 |
|---|
1/22 | 13,702 | 10,797 | 13,153 |
|---|
2/22 | 13,325 | 10,669 | 12,736 |
|---|
3/22 | 13,214 | 10,344 | 12,630 |
|---|
4/22 | 12,834 | 9,777 | 12,090 |
|---|
5/22 | 12,657 | 9,804 | 12,124 |
|---|
6/22 | 12,708 | 9,691 | 12,227 |
|---|
8/22 | 12,568 | 9,308 | 11,945 |
|---|
9/22 | 11,939 | 8,769 | 11,209 |
|---|
10/22 | 12,203 | 9,182 | 11,614 |
|---|
11/22 | 12,363 | 9,232 | 11,482 |
|---|
12/22 | 13,033 | 9,535 | 12,474 |
|---|
1/23 | 12,850 | 9,218 | 12,235 |
|---|
2/23 | 12,016 | 9,509 | 11,654 |
|---|
3/23 | 12,169 | 9,551 | 11,833 |
|---|
4/23 | 12,123 | 9,365 | 11,695 |
|---|
5/23 | 12,264 | 9,364 | 11,811 |
|---|
6/23 | 12,563 | 9,429 | 12,000 |
|---|
7/23 | 12,503 | 9,300 | 11,923 |
|---|
9/23 | 12,431 | 9,028 | 11,787 |
|---|
10/23 | 12,228 | 8,920 | 11,432 |
|---|
11/23 | 12,774 | 9,370 | 12,161 |
|---|
12/23 | 13,206 | 9,759 | 12,549 |
|---|
1/24 | 13,500 | 9,625 | 12,876 |
|---|
2/24 | 13,572 | 9,504 | 12,986 |
|---|
3/24 | 13,793 | 9,556 | 13,119 |
|---|
4/24 | 13,702 | 9,315 | 12,849 |
|---|
5/24 | 13,927 | 9,437 | 13,100 |
|---|
6/24 | 14,048 | 9,451 | 13,181 |
|---|
7/24 | 14,244 | 9,712 | 13,312 |
|---|
8/24 | 14,444 | 9,941 | 13,658 |
|---|
9/24 | 14,676 | 10,111 | 13,986 |
|---|
10/24 | 14,678 | 9,772 | 13,878 |
|---|
11/24 | 14,774 | 9,805 | 13,940 |
|---|
12/24 | 14,809 | 9,595 | 13,755 |
|---|
1/25 | 14,938 | 9,649 | 13,844 |
|---|
2/25 | 15,049 | 9,787 | 13,995 |
|---|
3/25 | 15,067 | 9,847 | 13,835 |
|---|
4/25 | 14,974 | 10,137 | 13,698 |
|---|
5/25 | 15,232 | 10,101 | 13,856 |
|---|
6/25 | 15,448 | 10,292 | 14,090 |
|---|
7/25 | 15,558 | 10,139 | 14,257 |
|---|
8/25 | 15,673 | 10,286 | 14,428 |
|---|
9/25 | 15,852 | 10,354 | 14,644 |
|---|
10/25 | 15,953 | 10,327 | 14,677 |
|---|
11/25 | 15,994 | 10,351 | 14,627 |
|---|
12/25 | 16,135 | 10,378 | 14,686 |
|---|
1/26 | 16,231 | 10,475 | 14,845 |
|---|
2/26 | 16,360 | 10,593 | 14,939 |
|---|
3/26 | 16,056 | 10,267 | 14,593 |
|---|
4/26 | 16,341 | 10,395 | 14,881 |
|---|
5/26 | 16,423 | 10,430 | 14,906 |
|---|
6/26 | 16,524 | 10,356 | 14,919 |
|---|
7/26 | 16,441 | 10,301 | 14,848 |
|---|
8/26 | 16,531 | 10,348 | 14,861 |
|---|
|
|
| Average Annual Return [Table Text Block] |
|
Table SummaryName | 1-Year | 5-Year | 10-Year |
|---|
Class S Shares | 5.47% | 3.38% | 5.15% |
|---|
Bloomberg Global Aggregate Index | 0.60% | -1.74% | 0.34% |
|---|
ICE BofA US All Capital Securities Index | 3.00% | 1.96% | 4.04% |
|---|
|
|
| No Deduction of Taxes [Text Block] |
|
The graph above represents historical performance of a hypothetical investment of $10,000 in the Fund over the past ten years (or since inception if shorter). The table and graph above do not reflect the impact of taxes. If they did, performance would be lower.
|
|
| Performance Table Market Index Changed [Text Block] |
|
The Bloomberg Global Aggregate Index is the Fund's primary broad-based securities market index. The ICE BofA US All Capital Securities Index is included as an additional index for the Fund as it shows how the Fund’s performance compares with the returns of an index of funds with similar investment objectives.
|
|
| Updated Performance Information Location [Text Block] |
|
Visit www.principalam.com/mutualfundperformance for more recent performance information.
|
|
| AssetsNet |
|
$ 796,306,000
|
|
| Holdings Count | Holding |
|
181
|
|
| Advisory Fees Paid, Amount |
|
$ 0
|
|
| InvestmentCompanyPortfolioTurnover |
|
26.80%
|
|
| Additional Fund Statistics [Text Block] |
|
- Net Assets (amount in thousands)$796,306
- Total Number of Portfolio Holdings181
- Portfolio Turnover Rate 26.8%
- Total Advisory Fees Paid (amount in thousands)$0
|
|
| Holdings [Text Block] |
|
Table SummaryAsset Weighting | Percent of Net Assets |
|---|
Bonds | 97.23% | Preferred Stocks | 1.60% | Investment Companies | 1.34% | Other Assets and Liabilities | (0.17)% | Total Net Assets | 100.00% | Table SummarySector | Percent of Net Assets |
|---|
Financial | 79.75% | Utilities | 8.60% | Energy | 7.04% | Government | 1.70% | Money Market Funds | 1.34% | Consumer, Non-cyclical | 0.88% | Communications | 0.86% | Other Assets and Liabilities | (0.17)% | Total Net Assets | 100.00% | |
|
| Material Fund Change [Text Block] |
|
There were no material changes to the Fund for the period September 1, 2025 to August 31, 2026. For more complete information, you may review the Fund's most recent prospectus at www.PrincipalAM.com/prospectuses. |
|
| C000085834 |
|
|
|
| Shareholder Report [Line Items] |
|
|
|
| Fund Name |
|
Diversified Real Asset Fund
|
|
| Class Name |
|
Class A
|
|
| Trading Symbol |
|
PRDAX
|
|
| Annual or Semi-Annual Statement [Text Block] |
|
This annual shareholder report contains important information about Diversified Real Asset Fund (the "Fund") for the period of September 1, 2025 to August 31, 2026.
|
|
| Shareholder Report Annual or Semi-Annual |
|
Annual Shareholder Report
|
|
| Additional Information [Text Block] |
|
You can find additional information about the Fund at www.PrincipalAM.com/prospectuses or you can request information by contacting us at 1-800-222-5852 or emailing prospectus@principalfunds.com.
|
|
| Material Fund Change Notice [Text Block] |
|
This report describes certain changes to the Fund that occurred during the reporting period.
|
|
| Additional Information Phone Number |
|
1-800-222-5852
|
|
| Additional Information Email |
|
<span style="box-sizing: border-box; color: rgb(0, 0, 0); display: inline; flex-wrap: nowrap; font-size: 10.6667px; font-weight: 400; grid-area: auto; line-height: 16px; margin: 0px; overflow: visible; text-align: left; text-align-last: auto; white-space-collapse: preserve-breaks;">prospectus@principalfunds.com</span>
|
|
| Additional Information Website |
|
<span style="box-sizing: border-box; color: rgb(0, 0, 0); display: inline; flex-wrap: nowrap; font-size: 10.6667px; font-weight: 400; grid-area: auto; line-height: 16px; margin: 0px; overflow: visible; text-align: left; text-align-last: auto; white-space-collapse: preserve-breaks;">www.PrincipalAM.com/prospectuses</span>
|
|
| Expenses [Text Block] |
|
What were the Fund costs for the last year? (based on a hypothetical $10,000 investment) Table SummaryClass Name | Costs of a $10,000 investment | Costs paid as a percentage of a $10,000 investment |
|---|
Class A | $133 | 1.21% |
|---|
|
|
| Expenses Paid, Amount |
|
$ 133
|
|
| Expense Ratio, Percent |
|
1.21%
|
|
| Factors Affecting Performance [Text Block] |
|
Management’s Discussion of Fund PerformanceThe Fund seeks a long-term total return in excess of inflation. Under normal circumstances, the Fund invests at least 80% of its net assets in investments related to real assets and real asset companies. It allocates its assets among general investment categories related to real assets, which include tangible assets and investments that are expected to perform well in periods of rising or high inflation, such as the following: infrastructure, natural resources, commodities, and real estate. For the year ending August 31, 2026, the Fund’s investments delivered attractive performance in excess of inflation. Performance was driven by strong results in both the natural resources and commodities allocations, in large part because of higher commodity prices in the wake of geopolitical conflict. Russia’s full-scale invasion of Ukraine is now in its fifth year, and early 2026 brought a new war as Israel and the U.S. began a conflict with Iran in late February. Both of these wars have had effects on global energy prices, which have driven prices for commodities and commodity-sensitive equities higher. Strong manager results also contributed to performance. This was especially true for ClearBridge Investments (North America) Pty Limited in their global infrastructure portfolio and for Newton Investment Management North America LLC in their global natural resources portfolio, as both managers outperformed their benchmarks through good security selection. Global infrastructure and global real estate securities also contributed to performance during the year, but to a lesser extent. Performance suffered from being underweight in commodities in the first quarter of 2026, and from a small allocation to timber-focused equities which underperformed broad natural resource equities during the year. The Fund utilizes derivatives primarily through ownership of commodity futures; this exposure contributed to performance. |
|
| Performance Past Does Not Indicate Future [Text] |
|
Past performance is not a good predictor of the Fund's future performance.
|
|
| Line Graph [Table Text Block] |
|
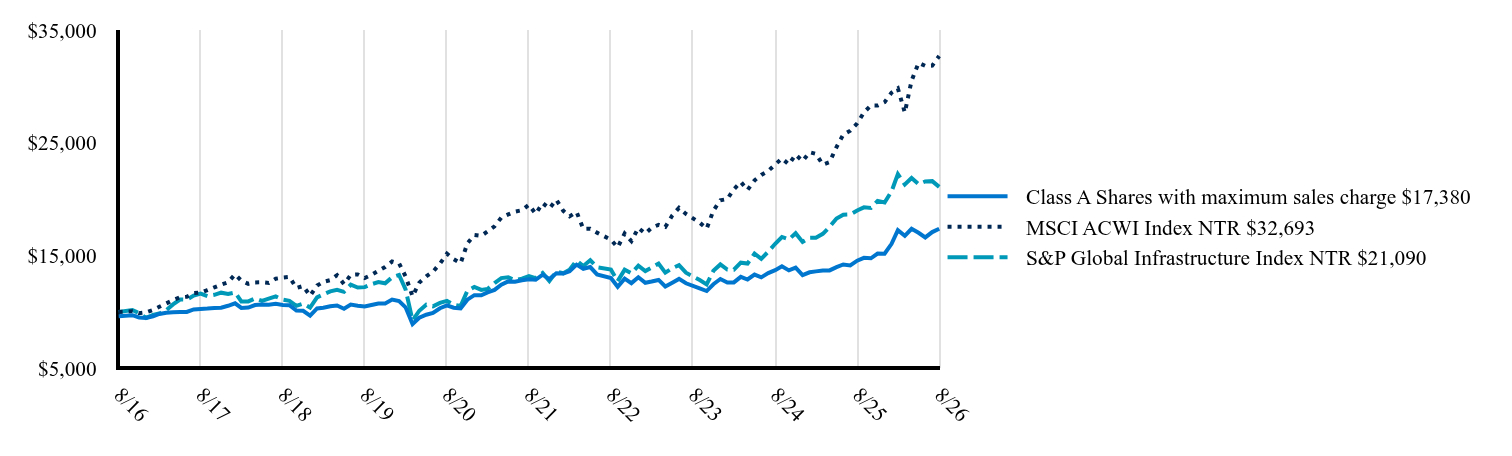 Table Summary | Class A Shares with maximum sales charge $17,380 | MSCI ACWI Index NTR $32,693 | S&P Global Infrastructure Index NTR $21,090 |
|---|
8/16 | 9,626 | 10,000 | 10,000 |
|---|
10/16 | 9,713 | 10,061 | 10,174 |
|---|
11/16 | 9,513 | 9,891 | 9,885 |
|---|
12/16 | 9,461 | 9,966 | 9,475 |
|---|
1/17 | 9,615 | 10,181 | 9,739 |
|---|
2/17 | 9,819 | 10,459 | 9,868 |
|---|
3/17 | 9,935 | 10,753 | 10,155 |
|---|
4/17 | 9,980 | 11,054 | 10,669 |
|---|
5/17 | 9,989 | 11,298 | 11,103 |
|---|
6/17 | 9,997 | 11,349 | 11,085 |
|---|
7/17 | 10,220 | 11,667 | 11,450 |
|---|
8/17 | 10,264 | 11,711 | 11,626 |
|---|
9/17 | 10,300 | 11,938 | 11,412 |
|---|
10/17 | 10,353 | 12,185 | 11,517 |
|---|
11/17 | 10,371 | 12,421 | 11,709 |
|---|
12/17 | 10,546 | 12,622 | 11,596 |
|---|
1/18 | 10,764 | 13,334 | 11,727 |
|---|
2/18 | 10,356 | 12,774 | 10,933 |
|---|
3/18 | 10,392 | 12,491 | 10,935 |
|---|
4/18 | 10,610 | 12,620 | 11,200 |
|---|
5/18 | 10,655 | 12,635 | 10,980 |
|---|
6/18 | 10,637 | 12,567 | 11,181 |
|---|
7/18 | 10,719 | 12,946 | 11,377 |
|---|
8/18 | 10,610 | 13,048 | 11,093 |
|---|
9/18 | 10,601 | 13,104 | 10,980 |
|---|
10/18 | 10,120 | 12,122 | 10,544 |
|---|
11/18 | 10,102 | 12,300 | 10,736 |
|---|
12/18 | 9,679 | 11,433 | 10,393 |
|---|
1/19 | 10,314 | 12,336 | 11,297 |
|---|
2/19 | 10,370 | 12,666 | 11,554 |
|---|
3/19 | 10,510 | 12,825 | 11,831 |
|---|
4/19 | 10,576 | 13,258 | 11,969 |
|---|
5/19 | 10,286 | 12,472 | 11,786 |
|---|
6/19 | 10,660 | 13,289 | 12,415 |
|---|
7/19 | 10,557 | 13,327 | 12,164 |
|---|
8/19 | 10,492 | 13,011 | 12,201 |
|---|
9/19 | 10,623 | 13,285 | 12,459 |
|---|
10/19 | 10,753 | 13,649 | 12,646 |
|---|
11/19 | 10,753 | 13,982 | 12,538 |
|---|
12/19 | 11,098 | 14,474 | 13,070 |
|---|
1/20 | 10,965 | 14,314 | 13,275 |
|---|
2/20 | 10,414 | 13,158 | 12,000 |
|---|
3/20 | 8,920 | 11,382 | 9,239 |
|---|
4/20 | 9,482 | 12,601 | 10,108 |
|---|
5/20 | 9,757 | 13,149 | 10,639 |
|---|
6/20 | 9,910 | 13,569 | 10,498 |
|---|
7/20 | 10,328 | 14,287 | 10,807 |
|---|
8/20 | 10,585 | 15,161 | 10,978 |
|---|
9/20 | 10,375 | 14,672 | 10,641 |
|---|
10/20 | 10,318 | 14,316 | 10,523 |
|---|
11/20 | 11,089 | 16,080 | 11,873 |
|---|
12/20 | 11,490 | 16,827 | 12,221 |
|---|
1/21 | 11,471 | 16,751 | 11,957 |
|---|
2/21 | 11,738 | 17,138 | 12,042 |
|---|
3/21 | 11,957 | 17,596 | 12,564 |
|---|
4/21 | 12,424 | 18,366 | 13,004 |
|---|
5/21 | 12,710 | 18,651 | 13,065 |
|---|
6/21 | 12,681 | 18,897 | 12,830 |
|---|
7/21 | 12,805 | 19,027 | 12,948 |
|---|
8/21 | 12,891 | 19,504 | 13,174 |
|---|
9/21 | 12,853 | 18,698 | 12,996 |
|---|
10/21 | 13,303 | 19,652 | 13,462 |
|---|
11/21 | 12,912 | 19,179 | 12,735 |
|---|
12/21 | 13,438 | 19,946 | 13,570 |
|---|
1/22 | 13,407 | 18,967 | 13,428 |
|---|
2/22 | 13,600 | 18,477 | 13,755 |
|---|
3/22 | 14,194 | 18,877 | 14,557 |
|---|
4/22 | 13,827 | 17,366 | 14,075 |
|---|
5/22 | 13,980 | 17,386 | 14,578 |
|---|
6/22 | 13,330 | 17,033 | 13,972 |
|---|
8/22 | 13,013 | 16,406 | 13,751 |
|---|
9/22 | 12,233 | 15,730 | 12,732 |
|---|
10/22 | 12,955 | 16,950 | 13,750 |
|---|
11/22 | 12,555 | 16,283 | 13,436 |
|---|
12/22 | 13,079 | 17,451 | 14,106 |
|---|
1/23 | 12,589 | 16,950 | 13,623 |
|---|
2/23 | 12,700 | 17,473 | 13,937 |
|---|
3/23 | 12,838 | 17,724 | 14,295 |
|---|
4/23 | 12,254 | 17,534 | 13,484 |
|---|
5/23 | 12,598 | 18,553 | 13,879 |
|---|
6/23 | 12,932 | 19,232 | 14,152 |
|---|
7/23 | 12,540 | 18,694 | 13,479 |
|---|
9/23 | 12,085 | 17,921 | 12,838 |
|---|
10/23 | 11,854 | 17,382 | 12,448 |
|---|
11/23 | 12,456 | 18,987 | 13,646 |
|---|
12/23 | 12,921 | 19,898 | 14,213 |
|---|
1/24 | 12,606 | 20,015 | 13,759 |
|---|
2/24 | 12,618 | 20,874 | 13,749 |
|---|
3/24 | 13,112 | 21,529 | 14,372 |
|---|
4/24 | 12,878 | 20,819 | 14,291 |
|---|
5/24 | 13,311 | 21,665 | 15,168 |
|---|
6/24 | 13,065 | 22,147 | 14,707 |
|---|
7/24 | 13,443 | 22,504 | 15,347 |
|---|
8/24 | 13,702 | 23,076 | 16,046 |
|---|
9/24 | 14,053 | 23,612 | 16,648 |
|---|
10/24 | 13,686 | 23,082 | 16,433 |
|---|
11/24 | 13,934 | 23,945 | 16,981 |
|---|
12/24 | 13,266 | 23,379 | 16,210 |
|---|
1/25 | 13,516 | 24,163 | 16,578 |
|---|
2/25 | 13,599 | 24,018 | 16,588 |
|---|
3/25 | 13,682 | 23,069 | 16,925 |
|---|
4/25 | 13,682 | 23,284 | 17,539 |
|---|
5/25 | 13,969 | 24,622 | 18,289 |
|---|
6/25 | 14,212 | 25,728 | 18,626 |
|---|
7/25 | 14,128 | 26,077 | 18,646 |
|---|
8/25 | 14,548 | 26,721 | 19,000 |
|---|
9/25 | 14,795 | 27,689 | 19,278 |
|---|
10/25 | 14,759 | 28,309 | 19,224 |
|---|
11/25 | 15,174 | 28,305 | 19,847 |
|---|
12/25 | 15,163 | 28,601 | 19,701 |
|---|
1/26 | 16,040 | 29,449 | 20,692 |
|---|
2/26 | 17,251 | 29,827 | 22,217 |
|---|
3/26 | 16,744 | 27,685 | 21,300 |
|---|
4/26 | 17,376 | 30,502 | 21,875 |
|---|
5/26 | 17,017 | 32,075 | 21,331 |
|---|
6/26 | 16,608 | 31,818 | 21,572 |
|---|
7/26 | 17,082 | 31,842 | 21,598 |
|---|
8/26 | 17,380 | 32,693 | 21,090 |
|---|
|
|
| Average Annual Return [Table Text Block] |
|
Table SummaryName | 1-Year | 5-Year | 10-Year |
|---|
Class A Shares Excluding Sales Charge | 19.46% | 6.16% | 6.09% |
|---|
Class A Shares Including Sales Charge | 15.01% | 5.35% | 5.68% |
|---|
MSCI ACWI Index NTR | 22.35% | 10.88% | 12.58% |
|---|
S&P Global Infrastructure Index NTR | 11.00% | 9.87% | 7.75% |
|---|
|
|
| No Deduction of Taxes [Text Block] |
|
The graph above represents historical performance of a hypothetical investment of $10,000 in the Fund over the past ten years (or since inception if shorter). The table and graph above do not reflect the impact of taxes. If they did, performance would be lower.
|
|
| Performance Table Market Index Changed [Text Block] |
|
The MSCI ACWI Index NTR is the Fund's primary broad-based securities market index. The Fund uses a blended benchmark, Diversified Real Asset Index (Linked). The largest component of the blended benchmark, S&P Global Infrastructure Index NTR, is included as an additional index for the Fund to show how the Fund’s performance compares with returns of indices of funds with similar investment objectives. The weightings of the Diversified Real Asset Index (Linked) are as follows: 35% S&P Global Infrastructure Index NTR, 25% FTSE EPRA Nareit Developed Net Tax Index, 20% S&P Global Natural Resources Index NTR, and 20% Bloomberg Commodity Index TR.
|
|
| Material Change Date |
|
|
Aug. 31, 2025
|
| Updated Performance Information Location [Text Block] |
|
Visit www.principalam.com/mutualfundperformance for more recent performance information.
|
|
| AssetsNet |
|
$ 2,654,642,000
|
|
| Holdings Count | Holding |
|
462
|
|
| Advisory Fees Paid, Amount |
|
$ 19,535,000
|
|
| InvestmentCompanyPortfolioTurnover |
|
99.60%
|
|
| Additional Fund Statistics [Text Block] |
|
- Net Assets (amount in thousands)$2,654,642
- Total Number of Portfolio Holdings462
- Portfolio Turnover Rate 99.6%
- Total Advisory Fees Paid (amount in thousands)$19,535
|
|
| Holdings [Text Block] |
|
Table SummaryAsset Weighting | Percent of Net Assets |
|---|
Common Stocks | 72.65% | U.S. Government & Government Agency Obligations | 19.40% | Investment Companies | 10.73% | Senior Floating Rate Interests | 0.00% | Other Assets and LiabilitiesFootnote Reference* | (2.78)% | Total Net Assets | 100.00% | | Footnote | Description | Footnote* | Includes derivatives |
Table SummarySector | Percent of Net Assets |
|---|
Financial | 21.50% | Government | 19.40% | Energy | 14.61% | Utilities | 14.47% | Basic Materials | 9.93% | Industrial | 8.73% | Exchange-Traded Funds | 6.79% | Money Market Funds | 3.47% | Consumer, Non-cyclical | 2.82% | Closed-End Funds | 0.47% | Communications | 0.37% | Consumer, Cyclical | 0.22% | Technology | 0.00% | Other Assets and LiabilitiesFootnote Reference* | (2.78)% | Total Net Assets | 100.00% | | Footnote | Description | Footnote* | Includes derivatives |
|
|
| Material Fund Change [Text Block] |
|
This is a summary of certain changes to the Fund since August 31, 2025. For more complete information, you may review the Fund's most recent prospectus, which we expect to be effective by December 31 or upon request at www.PrincipalAM.com/prospectuses. Effective January 15, 2026, BlackRock Financial Management, Inc. was terminated as a sub-advisor. Effective April 30, 2026, Nomura Investments Fund Advisers was terminated as a sub-advisor. |
|
| Material Fund Change Adviser [Text Block] |
|
Effective January 15, 2026, BlackRock Financial Management, Inc. was terminated as a sub-advisor. Effective April 30, 2026, Nomura Investments Fund Advisers was terminated as a sub-advisor.
|
|
| Summary of Change Legend [Text Block] |
|
This is a summary of certain changes to the Fund since August 31, 2025. For more complete information, you may review the Fund's most recent prospectus, which we expect to be effective by December 31 or upon request at www.PrincipalAM.com/prospectuses.
|
|
| Updated Prospectus Web Address |
|
www.PrincipalAM.com/prospectuses
|
|
| C000085836 |
|
|
|
| Shareholder Report [Line Items] |
|
|
|
| Fund Name |
|
Diversified Real Asset Fund
|
|
| Class Name |
|
Institutional
|
|
| Trading Symbol |
|
PDRDX
|
|
| Annual or Semi-Annual Statement [Text Block] |
|
This annual shareholder report contains important information about Diversified Real Asset Fund (the "Fund") for the period of September 1, 2025 to August 31, 2026.
|
|
| Shareholder Report Annual or Semi-Annual |
|
Annual Shareholder Report
|
|
| Additional Information [Text Block] |
|
You can find additional information about the Fund at www.PrincipalAM.com/prospectuses or you can request information by contacting us at 1-800-222-5852 or emailing prospectus@principalfunds.com.
|
|
| Material Fund Change Notice [Text Block] |
|
This report describes certain changes to the Fund that occurred during the reporting period.
|
|
| Additional Information Phone Number |
|
1-800-222-5852
|
|
| Additional Information Email |
|
<span style="box-sizing: border-box; color: rgb(0, 0, 0); display: inline; flex-wrap: nowrap; font-size: 10.6667px; font-weight: 400; grid-area: auto; line-height: 16px; margin: 0px; overflow: visible; text-align: left; text-align-last: auto; white-space-collapse: preserve-breaks;">prospectus@principalfunds.com</span>
|
|
| Additional Information Website |
|
<span style="box-sizing: border-box; color: rgb(0, 0, 0); display: inline; flex-wrap: nowrap; font-size: 10.6667px; font-weight: 400; grid-area: auto; line-height: 16px; margin: 0px; overflow: visible; text-align: left; text-align-last: auto; white-space-collapse: preserve-breaks;">www.PrincipalAM.com/prospectuses</span>
|
|
| Expenses [Text Block] |
|
What were the Fund costs for the last year? (based on a hypothetical $10,000 investment) Table SummaryClass Name | Costs of a $10,000 investment | Costs paid as a percentage of a $10,000 investment |
|---|
Institutional | $92 | 0.84% |
|---|
|
|
| Expenses Paid, Amount |
|
$ 92
|
|
| Expense Ratio, Percent |
|
0.84%
|
|
| Factors Affecting Performance [Text Block] |
|
Management’s Discussion of Fund PerformanceThe Fund seeks a long-term total return in excess of inflation. Under normal circumstances, the Fund invests at least 80% of its net assets in investments related to real assets and real asset companies. It allocates its assets among general investment categories related to real assets, which include tangible assets and investments that are expected to perform well in periods of rising or high inflation, such as the following: infrastructure, natural resources, commodities, and real estate. For the year ending August 31, 2026, the Fund’s investments delivered attractive performance in excess of inflation. Performance was driven by strong results in both the natural resources and commodities allocations, in large part because of higher commodity prices in the wake of geopolitical conflict. Russia’s full-scale invasion of Ukraine is now in its fifth year, and early 2026 brought a new war as Israel and the U.S. began a conflict with Iran in late February. Both of these wars have had effects on global energy prices, which have driven prices for commodities and commodity-sensitive equities higher. Strong manager results also contributed to performance. This was especially true for ClearBridge Investments (North America) Pty Limited in their global infrastructure portfolio and for Newton Investment Management North America LLC in their global natural resources portfolio, as both managers outperformed their benchmarks through good security selection. Global infrastructure and global real estate securities also contributed to performance during the year, but to a lesser extent. Performance suffered from being underweight in commodities in the first quarter of 2026, and from a small allocation to timber-focused equities which underperformed broad natural resource equities during the year. The Fund utilizes derivatives primarily through ownership of commodity futures; this exposure contributed to performance. |
|
| Performance Past Does Not Indicate Future [Text] |
|
Past performance is not a good predictor of the Fund's future performance.
|
|
| Line Graph [Table Text Block] |
|
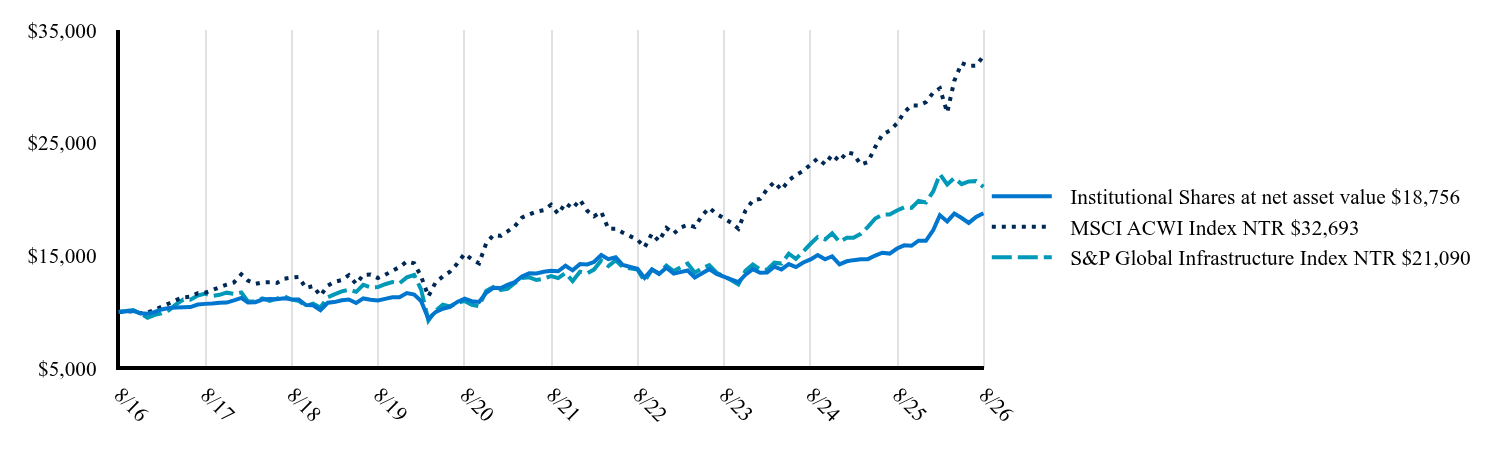 Table Summary | Institutional Shares at net asset value $18,756 | MSCI ACWI Index NTR $32,693 | S&P Global Infrastructure Index NTR $21,090 |
|---|
8/16 | 10,000 | 10,000 | 10,000 |
|---|
10/16 | 10,099 | 10,061 | 10,174 |
|---|
11/16 | 9,892 | 9,891 | 9,885 |
|---|
12/16 | 9,847 | 9,966 | 9,475 |
|---|
1/17 | 10,003 | 10,181 | 9,739 |
|---|
2/17 | 10,225 | 10,459 | 9,868 |
|---|
3/17 | 10,345 | 10,753 | 10,155 |
|---|
4/17 | 10,401 | 11,054 | 10,669 |
|---|
5/17 | 10,420 | 11,298 | 11,103 |
|---|
6/17 | 10,429 | 11,349 | 11,085 |
|---|
7/17 | 10,660 | 11,667 | 11,450 |
|---|
8/17 | 10,716 | 11,711 | 11,626 |
|---|
9/17 | 10,753 | 11,938 | 11,412 |
|---|
10/17 | 10,809 | 12,185 | 11,517 |
|---|
11/17 | 10,827 | 12,421 | 11,709 |
|---|
12/17 | 11,020 | 12,622 | 11,596 |
|---|
1/18 | 11,248 | 13,334 | 11,727 |
|---|
2/18 | 10,831 | 12,774 | 10,933 |
|---|
3/18 | 10,869 | 12,491 | 10,935 |
|---|
4/18 | 11,096 | 12,620 | 11,200 |
|---|
5/18 | 11,153 | 12,635 | 10,980 |
|---|
6/18 | 11,134 | 12,567 | 11,181 |
|---|
7/18 | 11,219 | 12,946 | 11,377 |
|---|
8/18 | 11,115 | 13,048 | 11,093 |
|---|
9/18 | 11,106 | 13,104 | 10,980 |
|---|
10/18 | 10,604 | 12,122 | 10,544 |
|---|
11/18 | 10,585 | 12,300 | 10,736 |
|---|
12/18 | 10,150 | 11,433 | 10,393 |
|---|
1/19 | 10,817 | 12,336 | 11,297 |
|---|
2/19 | 10,875 | 12,666 | 11,554 |
|---|
3/19 | 11,032 | 12,825 | 11,831 |
|---|
4/19 | 11,101 | 13,258 | 11,969 |
|---|
5/19 | 10,797 | 12,472 | 11,786 |
|---|
6/19 | 11,199 | 13,289 | 12,415 |
|---|
7/19 | 11,091 | 13,327 | 12,164 |
|---|
8/19 | 11,022 | 13,011 | 12,201 |
|---|
9/19 | 11,159 | 13,285 | 12,459 |
|---|
10/19 | 11,306 | 13,649 | 12,646 |
|---|
11/19 | 11,306 | 13,982 | 12,538 |
|---|
12/19 | 11,674 | 14,474 | 13,070 |
|---|
1/20 | 11,543 | 14,314 | 13,275 |
|---|
2/20 | 10,972 | 13,158 | 12,000 |
|---|
3/20 | 9,397 | 11,382 | 9,239 |
|---|
4/20 | 9,989 | 12,601 | 10,108 |
|---|
5/20 | 10,280 | 13,149 | 10,639 |
|---|
6/20 | 10,450 | 13,569 | 10,498 |
|---|
7/20 | 10,892 | 14,287 | 10,807 |
|---|
8/20 | 11,172 | 15,161 | 10,978 |
|---|
9/20 | 10,952 | 14,672 | 10,641 |
|---|
10/20 | 10,892 | 14,316 | 10,523 |
|---|
11/20 | 11,704 | 16,080 | 11,873 |
|---|
12/20 | 12,138 | 16,827 | 12,221 |
|---|
1/21 | 12,118 | 16,751 | 11,957 |
|---|
2/21 | 12,400 | 17,138 | 12,042 |
|---|
3/21 | 12,642 | 17,596 | 12,564 |
|---|
4/21 | 13,136 | 18,366 | 13,004 |
|---|
5/21 | 13,438 | 18,651 | 13,065 |
|---|
6/21 | 13,418 | 18,897 | 12,830 |
|---|
7/21 | 13,559 | 19,027 | 12,948 |
|---|
8/21 | 13,650 | 19,504 | 13,174 |
|---|
9/21 | 13,609 | 18,698 | 12,996 |
|---|
10/21 | 14,096 | 19,652 | 13,462 |
|---|
11/21 | 13,692 | 19,179 | 12,735 |
|---|
12/21 | 14,242 | 19,946 | 13,570 |
|---|
1/22 | 14,210 | 18,967 | 13,428 |
|---|
2/22 | 14,425 | 18,477 | 13,755 |
|---|
3/22 | 15,055 | 18,877 | 14,557 |
|---|
4/22 | 14,676 | 17,366 | 14,075 |
|---|
5/22 | 14,849 | 17,386 | 14,578 |
|---|
6/22 | 14,161 | 17,033 | 13,972 |
|---|
8/22 | 13,835 | 16,406 | 13,751 |
|---|
9/22 | 13,018 | 15,730 | 12,732 |
|---|
10/22 | 13,776 | 16,950 | 13,750 |
|---|
11/22 | 13,365 | 16,283 | 13,436 |
|---|
12/22 | 13,924 | 17,451 | 14,106 |
|---|
1/23 | 13,401 | 16,950 | 13,623 |
|---|
2/23 | 13,532 | 17,473 | 13,937 |
|---|
3/23 | 13,678 | 17,724 | 14,295 |
|---|
4/23 | 13,055 | 17,534 | 13,484 |
|---|
5/23 | 13,425 | 18,553 | 13,879 |
|---|
6/23 | 13,794 | 19,232 | 14,152 |
|---|
7/23 | 13,376 | 18,694 | 13,479 |
|---|
9/23 | 12,891 | 17,921 | 12,838 |
|---|
10/23 | 12,644 | 17,382 | 12,448 |
|---|
11/23 | 13,300 | 18,987 | 13,646 |
|---|
12/23 | 13,798 | 19,898 | 14,213 |
|---|
1/24 | 13,474 | 20,015 | 13,759 |
|---|
2/24 | 13,486 | 20,874 | 13,749 |
|---|
3/24 | 14,016 | 21,529 | 14,372 |
|---|
4/24 | 13,765 | 20,819 | 14,291 |
|---|
5/24 | 14,241 | 21,665 | 15,168 |
|---|
6/24 | 13,979 | 22,147 | 14,707 |
|---|
7/24 | 14,383 | 22,504 | 15,347 |
|---|
8/24 | 14,661 | 23,076 | 16,046 |
|---|
9/24 | 15,051 | 23,612 | 16,648 |
|---|
10/24 | 14,669 | 23,082 | 16,433 |
|---|
11/24 | 14,936 | 23,945 | 16,981 |
|---|
12/24 | 14,223 | 23,379 | 16,210 |
|---|
1/25 | 14,491 | 24,163 | 16,578 |
|---|
2/25 | 14,593 | 24,018 | 16,588 |
|---|
3/25 | 14,682 | 23,069 | 16,925 |
|---|
4/25 | 14,682 | 23,284 | 17,539 |
|---|
5/25 | 15,002 | 24,622 | 18,289 |
|---|
6/25 | 15,253 | 25,728 | 18,626 |
|---|
7/25 | 15,175 | 26,077 | 18,646 |
|---|
8/25 | 15,627 | 26,721 | 19,000 |
|---|
9/25 | 15,907 | 27,689 | 19,278 |
|---|
10/25 | 15,868 | 28,309 | 19,224 |
|---|
11/25 | 16,314 | 28,305 | 19,847 |
|---|
12/25 | 16,305 | 28,601 | 19,701 |
|---|
1/26 | 17,264 | 29,449 | 20,692 |
|---|
2/26 | 18,570 | 29,827 | 22,217 |
|---|
3/26 | 18,024 | 27,685 | 21,300 |
|---|
4/26 | 18,720 | 30,502 | 21,875 |
|---|
5/26 | 18,332 | 32,075 | 21,331 |
|---|
6/26 | 17,895 | 31,818 | 21,572 |
|---|
7/26 | 18,419 | 31,842 | 21,598 |
|---|
8/26 | 18,756 | 32,693 | 21,090 |
|---|
|
|
| Average Annual Return [Table Text Block] |
|
Table SummaryName | 1-Year | 5-Year | 10-Year |
|---|
Institutional Shares | 20.02% | 6.56% | 6.49% |
|---|
MSCI ACWI Index NTR | 22.35% | 10.88% | 12.58% |
|---|
S&P Global Infrastructure Index NTR | 11.00% | 9.87% | 7.75% |
|---|
|
|
| No Deduction of Taxes [Text Block] |
|
The graph above represents historical performance of a hypothetical investment of $10,000 in the Fund over the past ten years (or since inception if shorter). The table and graph above do not reflect the impact of taxes. If they did, performance would be lower.
|
|
| Performance Table Market Index Changed [Text Block] |
|
The MSCI ACWI Index NTR is the Fund's primary broad-based securities market index. The Fund uses a blended benchmark, Diversified Real Asset Index (Linked). The largest component of the blended benchmark, S&P Global Infrastructure Index NTR, is included as an additional index for the Fund to show how the Fund’s performance compares with returns of indices of funds with similar investment objectives. The weightings of the Diversified Real Asset Index (Linked) are as follows: 35% S&P Global Infrastructure Index NTR, 25% FTSE EPRA Nareit Developed Net Tax Index, 20% S&P Global Natural Resources Index NTR, and 20% Bloomberg Commodity Index TR.
|
|
| Material Change Date |
|
|
Aug. 31, 2025
|
| Updated Performance Information Location [Text Block] |
|
Visit www.principalam.com/mutualfundperformance for more recent performance information.
|
|
| AssetsNet |
|
$ 2,654,642,000
|
|
| Holdings Count | Holding |
|
462
|
|
| Advisory Fees Paid, Amount |
|
$ 19,535,000
|
|
| InvestmentCompanyPortfolioTurnover |
|
99.60%
|
|
| Additional Fund Statistics [Text Block] |
|
- Net Assets (amount in thousands)$2,654,642
- Total Number of Portfolio Holdings462
- Portfolio Turnover Rate 99.6%
- Total Advisory Fees Paid (amount in thousands)$19,535
|
|
| Holdings [Text Block] |
|
Table SummaryAsset Weighting | Percent of Net Assets |
|---|
Common Stocks | 72.65% | U.S. Government & Government Agency Obligations | 19.40% | Investment Companies | 10.73% | Senior Floating Rate Interests | 0.00% | Other Assets and LiabilitiesFootnote Reference* | (2.78)% | Total Net Assets | 100.00% | | Footnote | Description | Footnote* | Includes derivatives |
Table SummarySector | Percent of Net Assets |
|---|
Financial | 21.50% | Government | 19.40% | Energy | 14.61% | Utilities | 14.47% | Basic Materials | 9.93% | Industrial | 8.73% | Exchange-Traded Funds | 6.79% | Money Market Funds | 3.47% | Consumer, Non-cyclical | 2.82% | Closed-End Funds | 0.47% | Communications | 0.37% | Consumer, Cyclical | 0.22% | Technology | 0.00% | Other Assets and LiabilitiesFootnote Reference* | (2.78)% | Total Net Assets | 100.00% | | Footnote | Description | Footnote* | Includes derivatives |
|
|
| Material Fund Change [Text Block] |
|
This is a summary of certain changes to the Fund since August 31, 2025. For more complete information, you may review the Fund's most recent prospectus, which we expect to be effective by December 31 or upon request at www.PrincipalAM.com/prospectuses. Effective January 15, 2026, BlackRock Financial Management, Inc. was terminated as a sub-advisor. Effective April 30, 2026, Nomura Investments Fund Advisers was terminated as a sub-advisor. |
|
| Material Fund Change Adviser [Text Block] |
|
Effective January 15, 2026, BlackRock Financial Management, Inc. was terminated as a sub-advisor. Effective April 30, 2026, Nomura Investments Fund Advisers was terminated as a sub-advisor.
|
|
| Summary of Change Legend [Text Block] |
|
This is a summary of certain changes to the Fund since August 31, 2025. For more complete information, you may review the Fund's most recent prospectus, which we expect to be effective by December 31 or upon request at www.PrincipalAM.com/prospectuses.
|
|
| Updated Prospectus Web Address |
|
www.PrincipalAM.com/prospectuses
|
|
| C000150253 |
|
|
|
| Shareholder Report [Line Items] |
|
|
|
| Fund Name |
|
Diversified Real Asset Fund
|
|
| Class Name |
|
R-6
|
|
| Trading Symbol |
|
PDARX
|
|
| Annual or Semi-Annual Statement [Text Block] |
|
This annual shareholder report contains important information about Diversified Real Asset Fund (the "Fund") for the period of September 1, 2025 to August 31, 2026.
|
|
| Shareholder Report Annual or Semi-Annual |
|
Annual Shareholder Report
|
|
| Additional Information [Text Block] |
|
You can find additional information about the Fund at www.PrincipalAM.com/prospectuses or you can request information by contacting us at 1-800-222-5852 or emailing prospectus@principalfunds.com.
|
|
| Material Fund Change Notice [Text Block] |
|
This report describes certain changes to the Fund that occurred during the reporting period.
|
|
| Additional Information Phone Number |
|
1-800-222-5852
|
|
| Additional Information Email |
|
<span style="box-sizing: border-box; color: rgb(0, 0, 0); display: inline; flex-wrap: nowrap; font-size: 10.6667px; font-weight: 400; grid-area: auto; line-height: 16px; margin: 0px; overflow: visible; text-align: left; text-align-last: auto; white-space-collapse: preserve-breaks;">prospectus@principalfunds.com</span>
|
|
| Additional Information Website |
|
<span style="box-sizing: border-box; color: rgb(0, 0, 0); display: inline; flex-wrap: nowrap; font-size: 10.6667px; font-weight: 400; grid-area: auto; line-height: 16px; margin: 0px; overflow: visible; text-align: left; text-align-last: auto; white-space-collapse: preserve-breaks;">www.PrincipalAM.com/prospectuses</span>
|
|
| Expenses [Text Block] |
|
What were the Fund costs for the last year? (based on a hypothetical $10,000 investment) Table SummaryClass Name | Costs of a $10,000 investment | Costs paid as a percentage of a $10,000 investment |
|---|
R-6 | $87 | 0.79% |
|---|
|
|
| Expenses Paid, Amount |
|
$ 87
|
|
| Expense Ratio, Percent |
|
0.79%
|
|
| Factors Affecting Performance [Text Block] |
|
Management’s Discussion of Fund PerformanceThe Fund seeks a long-term total return in excess of inflation. Under normal circumstances, the Fund invests at least 80% of its net assets in investments related to real assets and real asset companies. It allocates its assets among general investment categories related to real assets, which include tangible assets and investments that are expected to perform well in periods of rising or high inflation, such as the following: infrastructure, natural resources, commodities, and real estate. For the year ending August 31, 2026, the Fund’s investments delivered attractive performance in excess of inflation. Performance was driven by strong results in both the natural resources and commodities allocations, in large part because of higher commodity prices in the wake of geopolitical conflict. Russia’s full-scale invasion of Ukraine is now in its fifth year, and early 2026 brought a new war as Israel and the U.S. began a conflict with Iran in late February. Both of these wars have had effects on global energy prices, which have driven prices for commodities and commodity-sensitive equities higher. Strong manager results also contributed to performance. This was especially true for ClearBridge Investments (North America) Pty Limited in their global infrastructure portfolio and for Newton Investment Management North America LLC in their global natural resources portfolio, as both managers outperformed their benchmarks through good security selection. Global infrastructure and global real estate securities also contributed to performance during the year, but to a lesser extent. Performance suffered from being underweight in commodities in the first quarter of 2026, and from a small allocation to timber-focused equities which underperformed broad natural resource equities during the year. The Fund utilizes derivatives primarily through ownership of commodity futures; this exposure contributed to performance. |
|
| Performance Past Does Not Indicate Future [Text] |
|
Past performance is not a good predictor of the Fund's future performance.
|
|
| Line Graph [Table Text Block] |
|
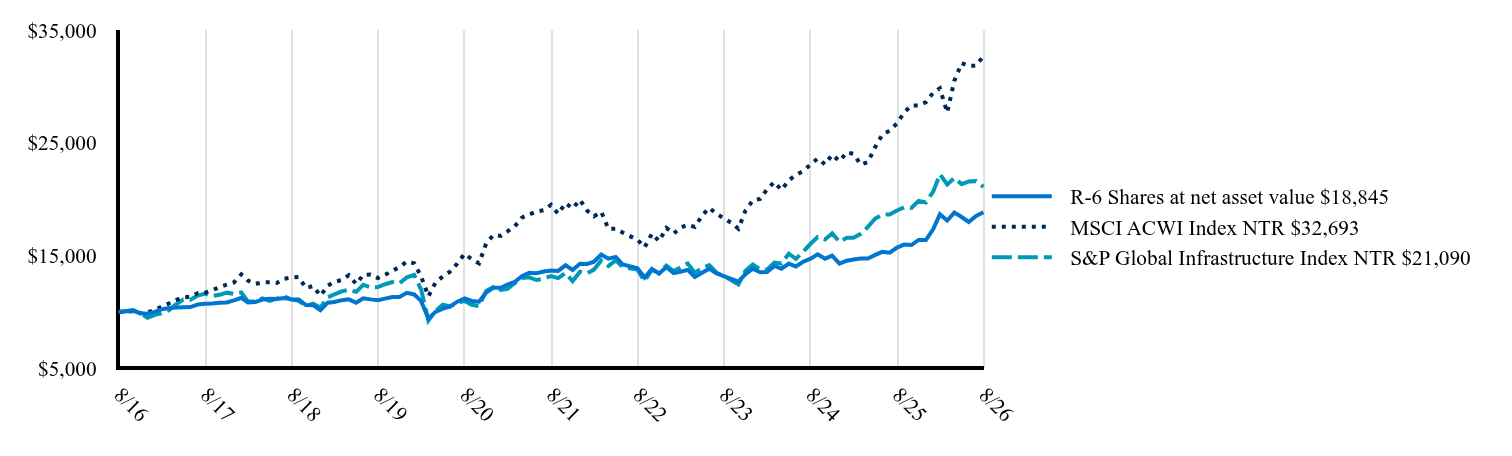 Table Summary | R-6 Shares at net asset value $18,845 | MSCI ACWI Index NTR $32,693 | S&P Global Infrastructure Index NTR $21,090 |
|---|
8/16 | 10,000 | 10,000 | 10,000 |
|---|
10/16 | 10,099 | 10,061 | 10,174 |
|---|
11/16 | 9,892 | 9,891 | 9,885 |
|---|
12/16 | 9,847 | 9,966 | 9,475 |
|---|
1/17 | 10,003 | 10,181 | 9,739 |
|---|
2/17 | 10,226 | 10,459 | 9,868 |
|---|
3/17 | 10,346 | 10,753 | 10,155 |
|---|
4/17 | 10,402 | 11,054 | 10,669 |
|---|
5/17 | 10,420 | 11,298 | 11,103 |
|---|
6/17 | 10,430 | 11,349 | 11,085 |
|---|
7/17 | 10,661 | 11,667 | 11,450 |
|---|
8/17 | 10,717 | 11,711 | 11,626 |
|---|
9/17 | 10,754 | 11,938 | 11,412 |
|---|
10/17 | 10,809 | 12,185 | 11,517 |
|---|
11/17 | 10,837 | 12,421 | 11,709 |
|---|
12/17 | 11,028 | 12,622 | 11,596 |
|---|
1/18 | 11,255 | 13,334 | 11,727 |
|---|
2/18 | 10,838 | 12,774 | 10,933 |
|---|
3/18 | 10,876 | 12,491 | 10,935 |
|---|
4/18 | 11,103 | 12,620 | 11,200 |
|---|
5/18 | 11,160 | 12,635 | 10,980 |
|---|
6/18 | 11,141 | 12,567 | 11,181 |
|---|
7/18 | 11,226 | 12,946 | 11,377 |
|---|
8/18 | 11,122 | 13,048 | 11,093 |
|---|
9/18 | 11,113 | 13,104 | 10,980 |
|---|
10/18 | 10,611 | 12,122 | 10,544 |
|---|
11/18 | 10,601 | 12,300 | 10,736 |
|---|
12/18 | 10,163 | 11,433 | 10,393 |
|---|
1/19 | 10,821 | 12,336 | 11,297 |
|---|
2/19 | 10,889 | 12,666 | 11,554 |
|---|
3/19 | 11,046 | 12,825 | 11,831 |
|---|
4/19 | 11,115 | 13,258 | 11,969 |
|---|
5/19 | 10,811 | 12,472 | 11,786 |
|---|
6/19 | 11,213 | 13,289 | 12,415 |
|---|
7/19 | 11,115 | 13,327 | 12,164 |
|---|
8/19 | 11,046 | 13,011 | 12,201 |
|---|
9/19 | 11,184 | 13,285 | 12,459 |
|---|
10/19 | 11,331 | 13,649 | 12,646 |
|---|
11/19 | 11,331 | 13,982 | 12,538 |
|---|
12/19 | 11,695 | 14,474 | 13,070 |
|---|
1/20 | 11,554 | 14,314 | 13,275 |
|---|
2/20 | 10,981 | 13,158 | 12,000 |
|---|
3/20 | 9,414 | 11,382 | 9,239 |
|---|
4/20 | 10,007 | 12,601 | 10,108 |
|---|
5/20 | 10,298 | 13,149 | 10,639 |
|---|
6/20 | 10,469 | 13,569 | 10,498 |
|---|
7/20 | 10,911 | 14,287 | 10,807 |
|---|
8/20 | 11,192 | 15,161 | 10,978 |
|---|
9/20 | 10,971 | 14,672 | 10,641 |
|---|
10/20 | 10,911 | 14,316 | 10,523 |
|---|
11/20 | 11,725 | 16,080 | 11,873 |
|---|
12/20 | 12,155 | 16,827 | 12,221 |
|---|
1/21 | 12,145 | 16,751 | 11,957 |
|---|
2/21 | 12,428 | 17,138 | 12,042 |
|---|
3/21 | 12,671 | 17,596 | 12,564 |
|---|
4/21 | 13,166 | 18,366 | 13,004 |
|---|
5/21 | 13,469 | 18,651 | 13,065 |
|---|
6/21 | 13,438 | 18,897 | 12,830 |
|---|
7/21 | 13,580 | 19,027 | 12,948 |
|---|
8/21 | 13,671 | 19,504 | 13,174 |
|---|
9/21 | 13,635 | 18,698 | 12,996 |
|---|
10/21 | 14,135 | 19,652 | 13,462 |
|---|
11/21 | 13,719 | 19,179 | 12,735 |
|---|
12/21 | 14,273 | 19,946 | 13,570 |
|---|
1/22 | 14,251 | 18,967 | 13,428 |
|---|
2/22 | 14,456 | 18,477 | 13,755 |
|---|
3/22 | 15,090 | 18,877 | 14,557 |
|---|
4/22 | 14,721 | 17,366 | 14,075 |
|---|
5/22 | 14,884 | 17,386 | 14,578 |
|---|
6/22 | 14,206 | 17,033 | 13,972 |
|---|
8/22 | 13,868 | 16,406 | 13,751 |
|---|
9/22 | 13,052 | 15,730 | 12,732 |
|---|
10/22 | 13,823 | 16,950 | 13,750 |
|---|
11/22 | 13,402 | 16,283 | 13,436 |
|---|
12/22 | 13,962 | 17,451 | 14,106 |
|---|
1/23 | 13,450 | 16,950 | 13,623 |
|---|
2/23 | 13,571 | 17,473 | 13,937 |
|---|
3/23 | 13,730 | 17,724 | 14,295 |
|---|
4/23 | 13,093 | 17,534 | 13,484 |
|---|
5/23 | 13,478 | 18,553 | 13,879 |
|---|
6/23 | 13,836 | 19,232 | 14,152 |
|---|
7/23 | 13,416 | 18,694 | 13,479 |
|---|
9/23 | 12,932 | 17,921 | 12,838 |
|---|
10/23 | 12,695 | 17,382 | 12,448 |
|---|
11/23 | 13,354 | 18,987 | 13,646 |
|---|
12/23 | 13,844 | 19,898 | 14,213 |
|---|
1/24 | 13,518 | 20,015 | 13,759 |
|---|
2/24 | 13,531 | 20,874 | 13,749 |
|---|
3/24 | 14,077 | 21,529 | 14,372 |
|---|
4/24 | 13,825 | 20,819 | 14,291 |
|---|
5/24 | 14,291 | 21,665 | 15,168 |
|---|
6/24 | 14,029 | 22,147 | 14,707 |
|---|
7/24 | 14,448 | 22,504 | 15,347 |
|---|
8/24 | 14,728 | 23,076 | 16,046 |
|---|
9/24 | 15,108 | 23,612 | 16,648 |
|---|
10/24 | 14,725 | 23,082 | 16,433 |
|---|
11/24 | 14,993 | 23,945 | 16,981 |
|---|
12/24 | 14,278 | 23,379 | 16,210 |
|---|
1/25 | 14,547 | 24,163 | 16,578 |
|---|
2/25 | 14,650 | 24,018 | 16,588 |
|---|
3/25 | 14,741 | 23,069 | 16,925 |
|---|
4/25 | 14,741 | 23,284 | 17,539 |
|---|
5/25 | 15,063 | 24,622 | 18,289 |
|---|
6/25 | 15,330 | 25,728 | 18,626 |
|---|
7/25 | 15,252 | 26,077 | 18,646 |
|---|
8/25 | 15,706 | 26,721 | 19,000 |
|---|
9/25 | 15,976 | 27,689 | 19,278 |
|---|
10/25 | 15,936 | 28,309 | 19,224 |
|---|
11/25 | 16,385 | 28,305 | 19,847 |
|---|
12/25 | 16,378 | 28,601 | 19,701 |
|---|
1/26 | 17,342 | 29,449 | 20,692 |
|---|
2/26 | 18,654 | 29,827 | 22,217 |
|---|
3/26 | 18,108 | 27,685 | 21,300 |
|---|
4/26 | 18,807 | 30,502 | 21,875 |
|---|
5/26 | 18,417 | 32,075 | 21,331 |
|---|
6/26 | 17,980 | 31,818 | 21,572 |
|---|
7/26 | 18,507 | 31,842 | 21,598 |
|---|
8/26 | 18,845 | 32,693 | 21,090 |
|---|
|
|
| Average Annual Return [Table Text Block] |
|
Table SummaryName | 1-Year | 5-Year | 10-Year |
|---|
R-6 Shares | 19.99% | 6.63% | 6.54% |
|---|
MSCI ACWI Index NTR | 22.35% | 10.88% | 12.58% |
|---|
S&P Global Infrastructure Index NTR | 11.00% | 9.87% | 7.75% |
|---|
|
|
| No Deduction of Taxes [Text Block] |
|
The graph above represents historical performance of a hypothetical investment of $10,000 in the Fund over the past ten years (or since inception if shorter). The table and graph above do not reflect the impact of taxes. If they did, performance would be lower.
|
|
| Performance Table Market Index Changed [Text Block] |
|
The MSCI ACWI Index NTR is the Fund's primary broad-based securities market index. The Fund uses a blended benchmark, Diversified Real Asset Index (Linked). The largest component of the blended benchmark, S&P Global Infrastructure Index NTR, is included as an additional index for the Fund to show how the Fund’s performance compares with returns of indices of funds with similar investment objectives. The weightings of the Diversified Real Asset Index (Linked) are as follows: 35% S&P Global Infrastructure Index NTR, 25% FTSE EPRA Nareit Developed Net Tax Index, 20% S&P Global Natural Resources Index NTR, and 20% Bloomberg Commodity Index TR.
|
|
| Material Change Date |
|
|
Aug. 31, 2025
|
| Updated Performance Information Location [Text Block] |
|
Visit www.principalam.com/mutualfundperformance for more recent performance information.
|
|
| AssetsNet |
|
$ 2,654,642,000
|
|
| Holdings Count | Holding |
|
462
|
|
| Advisory Fees Paid, Amount |
|
$ 19,535,000
|
|
| InvestmentCompanyPortfolioTurnover |
|
99.60%
|
|
| Additional Fund Statistics [Text Block] |
|
- Net Assets (amount in thousands)$2,654,642
- Total Number of Portfolio Holdings462
- Portfolio Turnover Rate 99.6%
- Total Advisory Fees Paid (amount in thousands)$19,535
|
|
| Holdings [Text Block] |
|
Table SummaryAsset Weighting | Percent of Net Assets |
|---|
Common Stocks | 72.65% | U.S. Government & Government Agency Obligations | 19.40% | Investment Companies | 10.73% | Senior Floating Rate Interests | 0.00% | Other Assets and LiabilitiesFootnote Reference* | (2.78)% | Total Net Assets | 100.00% | | Footnote | Description | Footnote* | Includes derivatives |
Table SummarySector | Percent of Net Assets |
|---|
Financial | 21.50% | Government | 19.40% | Energy | 14.61% | Utilities | 14.47% | Basic Materials | 9.93% | Industrial | 8.73% | Exchange-Traded Funds | 6.79% | Money Market Funds | 3.47% | Consumer, Non-cyclical | 2.82% | Closed-End Funds | 0.47% | Communications | 0.37% | Consumer, Cyclical | 0.22% | Technology | 0.00% | Other Assets and LiabilitiesFootnote Reference* | (2.78)% | Total Net Assets | 100.00% | | Footnote | Description | Footnote* | Includes derivatives |
|
|
| Material Fund Change [Text Block] |
|
This is a summary of certain changes to the Fund since August 31, 2025. For more complete information, you may review the Fund's most recent prospectus, which we expect to be effective by December 31 or upon request at www.PrincipalAM.com/prospectuses. Effective January 15, 2026, BlackRock Financial Management, Inc. was terminated as a sub-advisor. Effective April 30, 2026, Nomura Investments Fund Advisers was terminated as a sub-advisor. |
|
| Material Fund Change Adviser [Text Block] |
|
Effective January 15, 2026, BlackRock Financial Management, Inc. was terminated as a sub-advisor. Effective April 30, 2026, Nomura Investments Fund Advisers was terminated as a sub-advisor.
|
|
| Summary of Change Legend [Text Block] |
|
This is a summary of certain changes to the Fund since August 31, 2025. For more complete information, you may review the Fund's most recent prospectus, which we expect to be effective by December 31 or upon request at www.PrincipalAM.com/prospectuses.
|
|
| Updated Prospectus Web Address |
|
www.PrincipalAM.com/prospectuses
|
|
| C000261435 |
|
|
|
| Shareholder Report [Line Items] |
|
|
|
| Fund Name |
|
Global Macro Fund
|
|
| Class Name |
|
R-6
|
|
| Trading Symbol |
|
PAFIX
|
|
| Annual or Semi-Annual Statement [Text Block] |
|
This annual shareholder report contains important information about Global Macro Fund (the "Fund") for the period of November 14, 2025 to August 31, 2026.
|
|
| Shareholder Report Annual or Semi-Annual |
|
Annual Shareholder Report
|
|
| Additional Information [Text Block] |
|
You can find additional information about the Fund at www.PrincipalAM.com/prospectuses or you can request information by contacting us at 1-800-222-5852 or emailing prospectus@principalfunds.com.
|
|
| Additional Information Phone Number |
|
1-800-222-5852
|
|
| Additional Information Email |
|
<span style="box-sizing: border-box; color: rgb(0, 0, 0); display: inline; flex-wrap: nowrap; font-size: 10.6667px; font-weight: 400; grid-area: auto; line-height: 16px; margin: 0px; overflow: visible; text-align: left; text-align-last: auto; white-space-collapse: preserve-breaks;">prospectus@principalfunds.com</span>
|
|
| Additional Information Website |
|
<span style="box-sizing: border-box; color: rgb(0, 0, 0); display: inline; flex-wrap: nowrap; font-size: 10.6667px; font-weight: 400; grid-area: auto; line-height: 16px; margin: 0px; overflow: visible; text-align: left; text-align-last: auto; white-space-collapse: preserve-breaks;">www.PrincipalAM.com/prospectuses</span>
|
|
| Expenses [Text Block] |
|
What were the Fund costs for the last year? (based on a hypothetical $10,000 investment) Table SummaryClass Name | Costs of a $10,000 investment | Costs paid as a percentage of a $10,000 investment |
|---|
R-6 | $67Footnote Reference* | 0.79%Footnote Reference† |
|---|
| Footnote | Description | Footnote* | Expenses are for the period from November 14, 2025, date operations commenced, through August 31, 2026. Expenses for the full reporting period would be higher. | Footnote† | Computed on an annualized basis. |
|
|
| Expenses Paid, Amount |
[1] |
$ 67
|
|
| Expense Ratio, Percent |
[2] |
0.79%
|
|
| Expenses Short Period Footnote [Text Block] |
|
Expenses are for the period from November 14, 2025, date operations commenced, through August 31, 2026. Expenses for the full reporting period would be higher.
|
|
| Factors Affecting Performance [Text Block] |
|
Management’s Discussion of Fund PerformanceThe Fund seeks long-term capital appreciation while managing volatility. It provides long and short exposure to a broad spectrum of global assets (namely, derivatives that provide exposure to equities, currencies, fixed-income securities, and commodities) to profit from movement in the price of asset classes that are sensitive to macroeconomic conditions. Under normal market conditions, the Fund will have investment exposure to at least three countries (excluding the United States) and combined exposure to foreign securities, foreign currencies, and other foreign investments equal to at least 40% of the Fund’s net assets. This foreign exposure includes sovereign debt and emerging market assets. From the Fund’s inception on November 14, 2025 through August 31, 2026, the Fund’s investments outperformed the Bloomberg 1-3 Month US Treasury Bill Index (“Index”). The Fund’s relative-value strategies were the largest positive contributor to performance. Country equity long/short positioning was the largest contributor, primarily benefiting from long positions in South Korea and Taiwan. Currency long/short positioning also contributed significantly, driven by long positions in the Norwegian krone and South Korean won. Commodity relative-value positioning also aided performance, while fixed income relative-value positioning modestly detracted. In addition, the Fund’s directional strategies contributed positively, primarily benefiting from long equity and short sovereign bond positions. The Fund used derivatives, primarily equity index, commodity and sovereign bond futures, and currency forwards, to establish long and short exposures across global markets. Overall, these derivative positions contributed positively to performance, particularly through the Fund’s equity and currency relative-value strategies. |
|
| Performance Past Does Not Indicate Future [Text] |
|
Past performance is not a good predictor of the Fund's future performance.
|
|
| Line Graph [Table Text Block] |
|
Table Summary | R-6 Shares at net asset value $11,358 | Bloomberg Global Aggregate Index $10,037 | Bloomberg 1-3 Month US Treasury Bill Index $10,296 |
|---|
11/25 | 10,000 | 10,000 | 10,000 |
|---|
11/25 | 10,000 | 10,041 | 10,015 |
|---|
12/25 | 10,045 | 10,067 | 10,050 |
|---|
1/26 | 10,326 | 10,161 | 10,080 |
|---|
2/26 | 10,556 | 10,275 | 10,108 |
|---|
3/26 | 10,667 | 9,959 | 10,138 |
|---|
4/26 | 11,027 | 10,083 | 10,169 |
|---|
5/26 | 11,248 | 10,117 | 10,201 |
|---|
6/26 | 11,017 | 10,045 | 10,231 |
|---|
7/26 | 11,198 | 9,992 | 10,266 |
|---|
8/26 | 11,358 | 10,037 | 10,296 |
|---|
|
|
| Average Annual Return [Table Text Block] |
|
Table SummaryName | Since InceptionFootnote Reference* |
|---|
R-6 Shares | 13.58% |
|---|
Bloomberg Global Aggregate Index | 0.37% |
|---|
Bloomberg 1-3 Month US Treasury Bill Index | 2.96% |
|---|
|
|
| Performance Inception Date |
|
Nov. 14, 2025
|
|
| No Deduction of Taxes [Text Block] |
|
The graph above represents historical performance of a hypothetical investment of $10,000 in the Fund over the past ten years (or since inception if shorter). The table and graph above do not reflect the impact of taxes. If they did, performance would be lower.
|
|
| Performance Table Market Index Changed [Text Block] |
|
The Bloomberg Global Aggregate Index is the Fund's primary broad-based securities market index. The Bloomberg 1-3 Month US Treasury Bill Index is an additional index for the Fund as it shows how the Fund’s performance compares with the returns of an index of funds with similar investment objectives.
|
|
| Updated Performance Information Location [Text Block] |
|
Visit www.principalam.com/mutualfundperformance for more recent performance information.
|
|
| AssetsNet |
|
$ 172,433,000
|
|
| Holdings Count | Holding |
|
175
|
|
| Advisory Fees Paid, Amount |
|
$ 960,000
|
|
| InvestmentCompanyPortfolioTurnover |
|
0.00%
|
|
| Additional Fund Statistics [Text Block] |
|
- Net Assets (amount in thousands)$172,433
- Total Number of Portfolio Holdings175
- Portfolio Turnover Rate 0.0%
- Total Advisory Fees Paid (amount in thousands)$960
|
|
| Holdings [Text Block] |
|
Table SummaryAsset Weighting | Percent of Net Assets |
|---|
Investment Companies | 86.79% | Other Assets and LiabilitiesFootnote Reference* | 13.21% | Total Net Assets | 100.00% | | Footnote | Description | Footnote* | Includes derivatives |
Table SummaryTop Locations | Percent of Net Assets |
|---|
Other LocationsFootnote Reference* | 86.79% | Other Assets and LiabilitiesFootnote Reference† | 13.21% | Total Net Assets | 100.00% | | Footnote | Description | Footnote* | Includes locations other than the top twenty and/or Investment Companies
| Footnote† | Includes derivatives |
|
|
| Material Fund Change [Text Block] |
|
There were no material changes to the Fund for the period November 14, 2025 to August 31, 2026. For more complete information, you may review the Fund's most recent prospectus at www.PrincipalAM.com/prospectuses. |
|
| C000104712 |
|
|
|
| Shareholder Report [Line Items] |
|
|
|
| Fund Name |
|
Global Multi-Strategy Fund
|
|
| Class Name |
|
Class A
|
|
| Trading Symbol |
|
PMSAX
|
|
| Annual or Semi-Annual Statement [Text Block] |
|
This annual shareholder report contains important information about Global Multi-Strategy Fund (the "Fund") for the period of September 1, 2025 to August 31, 2026.
|
|
| Shareholder Report Annual or Semi-Annual |
|
Annual Shareholder Report
|
|
| Additional Information [Text Block] |
|
You can find additional information about the Fund at www.PrincipalAM.com/prospectuses or you can request information by contacting us at 1-800-222-5852 or emailing prospectus@principalfunds.com.
|
|
| Material Fund Change Notice [Text Block] |
|
This report describes certain changes to the Fund that occurred during the reporting period.
|
|
| Additional Information Phone Number |
|
1-800-222-5852
|
|
| Additional Information Email |
|
<span style="box-sizing: border-box; color: rgb(0, 0, 0); display: inline; flex-wrap: nowrap; font-size: 10.6667px; font-weight: 400; grid-area: auto; line-height: 16px; margin: 0px; overflow: visible; text-align: left; text-align-last: auto; white-space-collapse: preserve-breaks;">prospectus@principalfunds.com</span>
|
|
| Additional Information Website |
|
<span style="box-sizing: border-box; color: rgb(0, 0, 0); display: inline; flex-wrap: nowrap; font-size: 10.6667px; font-weight: 400; grid-area: auto; line-height: 16px; margin: 0px; overflow: visible; text-align: left; text-align-last: auto; white-space-collapse: preserve-breaks;">www.PrincipalAM.com/prospectuses</span>
|
|
| Expenses [Text Block] |
|
What were the Fund costs for the last year? (based on a hypothetical $10,000 investment) Table SummaryClass Name | Costs of a $10,000 investment | Costs paid as a percentage of a $10,000 investment |
|---|
Class A | $181 | 1.71% |
|---|
|
|
| Expenses Paid, Amount |
|
$ 181
|
|
| Expense Ratio, Percent |
|
1.71%
|
|
| Factors Affecting Performance [Text Block] |
|
Management’s Discussion of Fund PerformanceThe Fund seeks to achieve long-term capital appreciation with an emphasis on positive total returns and managing volatility. The Fund invests in a broad range of instruments including, but not limited to, equities, bonds, currencies, commodities, convertible securities, and bank loans. Under normal market conditions, it invests in securities of issuers located throughout the world, including the U.S., invests at least 30% of its net assets in foreign and emerging market securities, and holds investments tied economically to at least twenty countries. The Fund’s investments achieved attractive performance for the year ending August 31, 2026, and did so with consistent monthly results. The Fund’s investments significantly outperformed the HFRX Global Hedge Fund Index (“Index”) over the year, in part by outperforming the Index during the months when the Index delivered negative returns (in both March 2026 and July 2026). The Fund’s largest contributors were its trend-following strategy sleeves managed by Graham Capital Management, L.P. (“Graham”) and Crabel Capital Management, LLC (“Crabel”) within the Fund’s global macro portfolio. Both Graham and Crabel benefited from a combination of allocations to commodities and global equity indices, as well as being short interest rate futures. Other significant contributors to performance were the Fund’s equity hedge sleeves, especially the sleeve managed by Los Angeles Capital Management (“LA Capital”). LA Capital delivered solid performance, driven by its overweight allocation to quality growth and momentum factors. There were no sleeves which detracted from the Fund’s absolute performance. However, several sleeves delivered modest positive performance, including sleeves managed by Record Currency Management Limited, Loomis, Sayles & Company, L.P., and Westchester Capital Management, LLC. The Fund and its subadvisors use derivatives to gain exposure to asset classes as well as to reduce portfolio risk. |
|
| Performance Past Does Not Indicate Future [Text] |
|
Past performance is not a good predictor of the Fund's future performance.
|
|
| Line Graph [Table Text Block] |
|
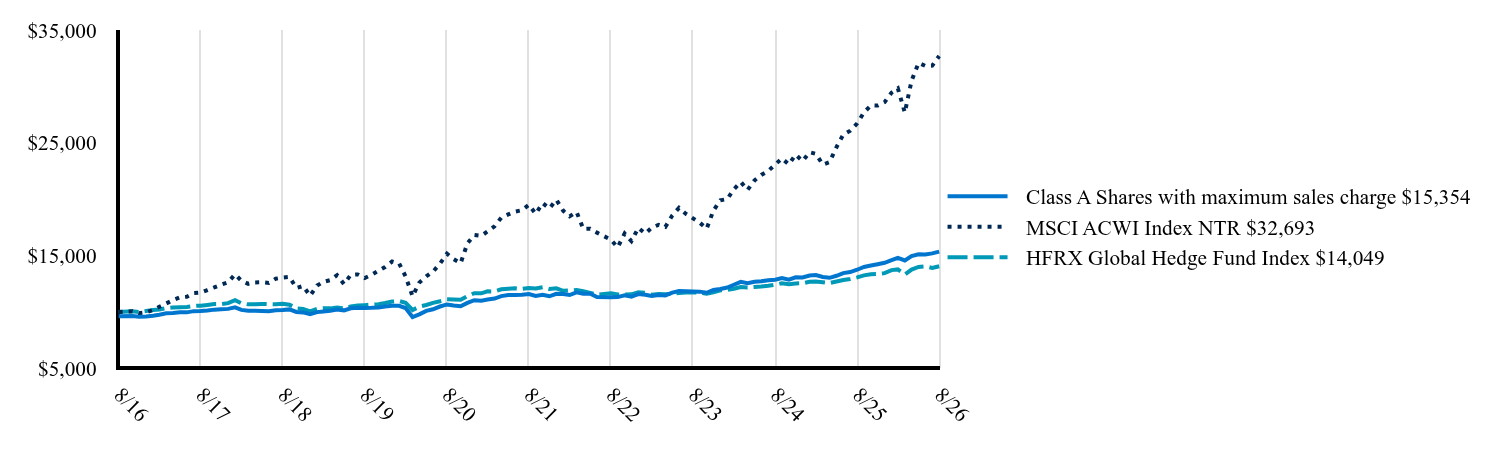 Table Summary | Class A Shares with maximum sales charge $15,354 | MSCI ACWI Index NTR $32,693 | HFRX Global Hedge Fund Index $14,049 |
|---|
8/16 | 9,625 | 10,000 | 10,000 |
|---|
10/16 | 9,643 | 10,061 | 10,055 |
|---|
11/16 | 9,580 | 9,891 | 9,998 |
|---|
12/16 | 9,607 | 9,966 | 10,085 |
|---|
1/17 | 9,669 | 10,181 | 10,171 |
|---|
2/17 | 9,759 | 10,459 | 10,223 |
|---|
3/17 | 9,875 | 10,753 | 10,337 |
|---|
4/17 | 9,911 | 11,054 | 10,384 |
|---|
5/17 | 9,982 | 11,298 | 10,409 |
|---|
6/17 | 9,964 | 11,349 | 10,432 |
|---|
7/17 | 10,071 | 11,667 | 10,528 |
|---|
8/17 | 10,080 | 11,711 | 10,559 |
|---|
9/17 | 10,125 | 11,938 | 10,622 |
|---|
10/17 | 10,206 | 12,185 | 10,696 |
|---|
11/17 | 10,232 | 12,421 | 10,703 |
|---|
12/17 | 10,272 | 12,622 | 10,781 |
|---|
1/18 | 10,409 | 13,334 | 11,045 |
|---|
2/18 | 10,180 | 12,774 | 10,777 |
|---|
3/18 | 10,097 | 12,491 | 10,672 |
|---|
4/18 | 10,107 | 12,620 | 10,681 |
|---|
5/18 | 10,088 | 12,635 | 10,710 |
|---|
6/18 | 10,070 | 12,567 | 10,690 |
|---|
7/18 | 10,152 | 12,946 | 10,674 |
|---|
8/18 | 10,171 | 13,048 | 10,722 |
|---|
9/18 | 10,226 | 13,104 | 10,648 |
|---|
10/18 | 9,996 | 12,122 | 10,318 |
|---|
11/18 | 9,960 | 12,300 | 10,254 |
|---|
12/18 | 9,801 | 11,433 | 10,057 |
|---|
1/19 | 9,986 | 12,336 | 10,270 |
|---|
2/19 | 10,044 | 12,666 | 10,335 |
|---|
3/19 | 10,112 | 12,825 | 10,318 |
|---|
4/19 | 10,209 | 13,258 | 10,386 |
|---|
5/19 | 10,141 | 12,472 | 10,315 |
|---|
6/19 | 10,326 | 13,289 | 10,481 |
|---|
7/19 | 10,365 | 13,327 | 10,562 |
|---|
8/19 | 10,355 | 13,011 | 10,602 |
|---|
9/19 | 10,365 | 13,285 | 10,650 |
|---|
10/19 | 10,394 | 13,649 | 10,682 |
|---|
11/19 | 10,482 | 13,982 | 10,792 |
|---|
12/19 | 10,550 | 14,474 | 10,923 |
|---|
1/20 | 10,540 | 14,314 | 10,968 |
|---|
2/20 | 10,346 | 13,158 | 10,811 |
|---|
3/20 | 9,548 | 11,382 | 10,175 |
|---|
4/20 | 9,791 | 12,601 | 10,468 |
|---|
5/20 | 10,093 | 13,149 | 10,619 |
|---|
6/20 | 10,239 | 13,569 | 10,805 |
|---|
7/20 | 10,482 | 14,287 | 10,951 |
|---|
8/20 | 10,667 | 15,161 | 11,120 |
|---|
9/20 | 10,569 | 14,672 | 11,101 |
|---|
10/20 | 10,511 | 14,316 | 11,077 |
|---|
11/20 | 10,803 | 16,080 | 11,389 |
|---|
12/20 | 11,044 | 16,827 | 11,668 |
|---|
1/21 | 11,004 | 16,751 | 11,648 |
|---|
2/21 | 11,103 | 17,138 | 11,825 |
|---|
3/21 | 11,192 | 17,596 | 11,818 |
|---|
4/21 | 11,408 | 18,366 | 12,011 |
|---|
5/21 | 11,507 | 18,651 | 12,057 |
|---|
6/21 | 11,507 | 18,897 | 12,103 |
|---|
7/21 | 11,517 | 19,027 | 12,049 |
|---|
8/21 | 11,595 | 19,504 | 12,131 |
|---|
9/21 | 11,418 | 18,698 | 12,085 |
|---|
10/21 | 11,527 | 19,652 | 12,194 |
|---|
11/21 | 11,389 | 19,179 | 12,036 |
|---|
12/21 | 11,611 | 19,946 | 12,094 |
|---|
1/22 | 11,591 | 18,967 | 11,875 |
|---|
2/22 | 11,499 | 18,477 | 11,903 |
|---|
3/22 | 11,744 | 18,877 | 11,948 |
|---|
4/22 | 11,611 | 17,366 | 11,846 |
|---|
5/22 | 11,611 | 17,386 | 11,693 |
|---|
6/22 | 11,325 | 17,033 | 11,538 |
|---|
8/22 | 11,294 | 16,406 | 11,654 |
|---|
9/22 | 11,315 | 15,730 | 11,544 |
|---|
10/22 | 11,468 | 16,950 | 11,555 |
|---|
11/22 | 11,344 | 16,283 | 11,562 |
|---|
12/22 | 11,584 | 17,451 | 11,754 |
|---|
1/23 | 11,527 | 16,950 | 11,705 |
|---|
2/23 | 11,413 | 17,473 | 11,533 |
|---|
3/23 | 11,504 | 17,724 | 11,592 |
|---|
4/23 | 11,470 | 17,534 | 11,560 |
|---|
5/23 | 11,710 | 18,553 | 11,618 |
|---|
6/23 | 11,847 | 19,232 | 11,681 |
|---|
7/23 | 11,836 | 18,694 | 11,733 |
|---|
9/23 | 11,801 | 17,921 | 11,728 |
|---|
10/23 | 11,699 | 17,382 | 11,623 |
|---|
11/23 | 11,950 | 18,987 | 11,743 |
|---|
12/23 | 12,035 | 19,898 | 11,921 |
|---|
1/24 | 12,164 | 20,015 | 11,962 |
|---|
2/24 | 12,412 | 20,874 | 12,058 |
|---|
3/24 | 12,671 | 21,529 | 12,214 |
|---|
4/24 | 12,553 | 20,819 | 12,169 |
|---|
5/24 | 12,682 | 21,665 | 12,219 |
|---|
6/24 | 12,730 | 22,147 | 12,258 |
|---|
7/24 | 12,812 | 22,504 | 12,320 |
|---|
8/24 | 12,859 | 23,076 | 12,407 |
|---|
9/24 | 13,000 | 23,612 | 12,536 |
|---|
10/24 | 12,859 | 23,082 | 12,464 |
|---|
11/24 | 13,071 | 23,945 | 12,531 |
|---|
12/24 | 13,051 | 23,379 | 12,541 |
|---|
1/25 | 13,230 | 24,163 | 12,670 |
|---|
2/25 | 13,266 | 24,018 | 12,702 |
|---|
3/25 | 13,099 | 23,069 | 12,634 |
|---|
4/25 | 13,028 | 23,284 | 12,559 |
|---|
5/25 | 13,206 | 24,622 | 12,701 |
|---|
6/25 | 13,445 | 25,728 | 12,827 |
|---|
7/25 | 13,540 | 26,077 | 12,920 |
|---|
8/25 | 13,743 | 26,721 | 13,065 |
|---|
9/25 | 13,993 | 27,689 | 13,246 |
|---|
10/25 | 14,112 | 28,309 | 13,347 |
|---|
11/25 | 14,231 | 28,305 | 13,365 |
|---|
12/25 | 14,362 | 28,601 | 13,443 |
|---|
1/26 | 14,588 | 29,449 | 13,711 |
|---|
2/26 | 14,789 | 29,827 | 13,772 |
|---|
3/26 | 14,563 | 27,685 | 13,325 |
|---|
4/26 | 14,952 | 30,502 | 13,758 |
|---|
5/26 | 15,115 | 32,075 | 13,987 |
|---|
6/26 | 15,090 | 31,818 | 14,040 |
|---|
7/26 | 15,191 | 31,842 | 13,900 |
|---|
8/26 | 15,354 | 32,693 | 14,049 |
|---|
|
|
| Average Annual Return [Table Text Block] |
|
Table SummaryName | 1-Year | 5-Year | 10-Year |
|---|
Class A Shares Excluding Sales Charge | 11.72% | 5.78% | 4.78% |
|---|
Class A Shares Including Sales Charge | 7.53% | 4.97% | 4.38% |
|---|
MSCI ACWI Index NTR | 22.35% | 10.88% | 12.58% |
|---|
HFRX Global Hedge Fund Index | 7.53% | 2.98% | 3.46% |
|---|
|
|
| No Deduction of Taxes [Text Block] |
|
The graph above represents historical performance of a hypothetical investment of $10,000 in the Fund over the past ten years (or since inception if shorter). The table and graph above do not reflect the impact of taxes. If they did, performance would be lower.
|
|
| Performance Table Market Index Changed [Text Block] |
|
The MSCI ACWI Index NTR is the Fund's primary broad-based securities market index. The HFRX Global Hedge Fund Index is included as an additional index for the Fund as it shows how the Fund’s performance compares with the returns of an index of funds with similar investment objectives.
|
|
| Material Change Date |
|
|
Aug. 31, 2025
|
| Updated Performance Information Location [Text Block] |
|
Visit www.principalam.com/mutualfundperformance for more recent performance information.
|
|
| AssetsNet |
|
$ 637,164,000
|
|
| Holdings Count | Holding |
|
2,339
|
|
| Advisory Fees Paid, Amount |
|
$ 6,370,000
|
|
| InvestmentCompanyPortfolioTurnover |
|
182.10%
|
|
| Additional Fund Statistics [Text Block] |
|
- Net Assets (amount in thousands)$637,164
- Total Number of Portfolio Holdings2,339
- Portfolio Turnover Rate 182.1%
- Total Advisory Fees Paid (amount in thousands)$6,370
|
|
| Holdings [Text Block] |
|
Table SummaryAsset Weighting | Percent of Net Assets |
|---|
Common Stocks | 36.25% | Bonds | 26.93% | Investment Companies | 22.96% | U.S. Government & Government Agency Obligations | 8.17% | Senior Floating Rate Interests | 1.41% | Convertible Bonds | 0.08% | Preferred Stocks | 0.06% | Purchased Options | 0.04% | Convertible Preferred Stocks | 0.03% | Other Assets and LiabilitiesFootnote Reference*Footnote Reference† | 4.07% | Total Net Assets | 100.00% | | Footnote | Description | Footnote* | Includes derivatives | Footnote† | Includes short sales |
Table SummaryTop Locations | Percent of Net Assets |
|---|
United States | 39.44% | Japan | 7.75% | Canada | 2.25% | United Kingdom | 1.80% | Cayman Islands | 1.65% | Mexico | 1.58% | Netherlands | 1.46% | Australia | 0.93% | Czech Republic | 0.86% | Hungary | 0.73% | Supranational | 0.68% | Luxembourg | 0.68% | Brazil | 0.65% | Colombia | 0.62% | South Africa | 0.59% | Italy | 0.56% | Hong Kong | 0.55% | Peru | 0.55% | Israel | 0.48% | Argentina | 0.47% | Other LocationsFootnote Reference* | 31.65% | Other Assets and LiabilitiesFootnote Reference†Footnote Reference‡ | 4.07% | Total Net Assets | 100.00% | | Footnote | Description | Footnote* | Includes locations other than the top twenty and/or Investment Companies
| Footnote† | Includes derivatives | Footnote‡ | Includes short sales |
|
|
| Material Fund Change [Text Block] |
|
This is a summary of certain changes to the Fund since August 31, 2025. For more complete information, you may review the Fund's most recent prospectus, which we expect to be effective by December 31 or upon request at www.PrincipalAM.com/prospectuses. Effective January 15, 2026, Wellington Management Company LLP was terminated as a sub-advisor. Effective May 15, 2026, Gotham Asset Management, LLC was terminated as a sub-advisor. Additionally on that date, Parametric Portfolio Associates, LLC was hired as a sub-advisor. |
|
| Material Fund Change Adviser [Text Block] |
|
Effective January 15, 2026, Wellington Management Company LLP was terminated as a sub-advisor. Effective May 15, 2026, Gotham Asset Management, LLC was terminated as a sub-advisor. Additionally on that date, Parametric Portfolio Associates, LLC was hired as a sub-advisor.
|
|
| Summary of Change Legend [Text Block] |
|
This is a summary of certain changes to the Fund since August 31, 2025. For more complete information, you may review the Fund's most recent prospectus, which we expect to be effective by December 31 or upon request at www.PrincipalAM.com/prospectuses.
|
|
| Updated Prospectus Web Address |
|
www.PrincipalAM.com/prospectuses
|
|
| C000104714 |
|
|
|
| Shareholder Report [Line Items] |
|
|
|
| Fund Name |
|
Global Multi-Strategy Fund
|
|
| Class Name |
|
Institutional
|
|
| Trading Symbol |
|
PSMIX
|
|
| Annual or Semi-Annual Statement [Text Block] |
|
This annual shareholder report contains important information about Global Multi-Strategy Fund (the "Fund") for the period of September 1, 2025 to August 31, 2026.
|
|
| Shareholder Report Annual or Semi-Annual |
|
Annual Shareholder Report
|
|
| Additional Information [Text Block] |
|
You can find additional information about the Fund at www.PrincipalAM.com/prospectuses or you can request information by contacting us at 1-800-222-5852 or emailing prospectus@principalfunds.com.
|
|
| Material Fund Change Notice [Text Block] |
|
This report describes certain changes to the Fund that occurred during the reporting period.
|
|
| Additional Information Phone Number |
|
1-800-222-5852
|
|
| Additional Information Email |
|
<span style="box-sizing: border-box; color: rgb(0, 0, 0); display: inline; flex-wrap: nowrap; font-size: 10.6667px; font-weight: 400; grid-area: auto; line-height: 16px; margin: 0px; overflow: visible; text-align: left; text-align-last: auto; white-space-collapse: preserve-breaks;">prospectus@principalfunds.com</span>
|
|
| Additional Information Website |
|
<span style="box-sizing: border-box; color: rgb(0, 0, 0); display: inline; flex-wrap: nowrap; font-size: 10.6667px; font-weight: 400; grid-area: auto; line-height: 16px; margin: 0px; overflow: visible; text-align: left; text-align-last: auto; white-space-collapse: preserve-breaks;">www.PrincipalAM.com/prospectuses</span>
|
|
| Expenses [Text Block] |
|
What were the Fund costs for the last year? (based on a hypothetical $10,000 investment) Table SummaryClass Name | Costs of a $10,000 investment | Costs paid as a percentage of a $10,000 investment |
|---|
Institutional | $149 | 1.41% |
|---|
|
|
| Expenses Paid, Amount |
|
$ 149
|
|
| Expense Ratio, Percent |
|
1.41%
|
|
| Factors Affecting Performance [Text Block] |
|
Management’s Discussion of Fund PerformanceThe Fund seeks to achieve long-term capital appreciation with an emphasis on positive total returns and managing volatility. The Fund invests in a broad range of instruments including, but not limited to, equities, bonds, currencies, commodities, convertible securities, and bank loans. Under normal market conditions, it invests in securities of issuers located throughout the world, including the U.S., invests at least 30% of its net assets in foreign and emerging market securities, and holds investments tied economically to at least twenty countries. The Fund’s investments achieved attractive performance for the year ending August 31, 2026, and did so with consistent monthly results. The Fund’s investments significantly outperformed the HFRX Global Hedge Fund Index (“Index”) over the year, in part by outperforming the Index during the months when the Index delivered negative returns (in both March 2026 and July 2026). The Fund’s largest contributors were its trend-following strategy sleeves managed by Graham Capital Management, L.P. (“Graham”) and Crabel Capital Management, LLC (“Crabel”) within the Fund’s global macro portfolio. Both Graham and Crabel benefited from a combination of allocations to commodities and global equity indices, as well as being short interest rate futures. Other significant contributors to performance were the Fund’s equity hedge sleeves, especially the sleeve managed by Los Angeles Capital Management (“LA Capital”). LA Capital delivered solid performance, driven by its overweight allocation to quality growth and momentum factors. There were no sleeves which detracted from the Fund’s absolute performance. However, several sleeves delivered modest positive performance, including sleeves managed by Record Currency Management Limited, Loomis, Sayles & Company, L.P., and Westchester Capital Management, LLC. The Fund and its subadvisors use derivatives to gain exposure to asset classes as well as to reduce portfolio risk. |
|
| Performance Past Does Not Indicate Future [Text] |
|
Past performance is not a good predictor of the Fund's future performance.
|
|
| Line Graph [Table Text Block] |
|
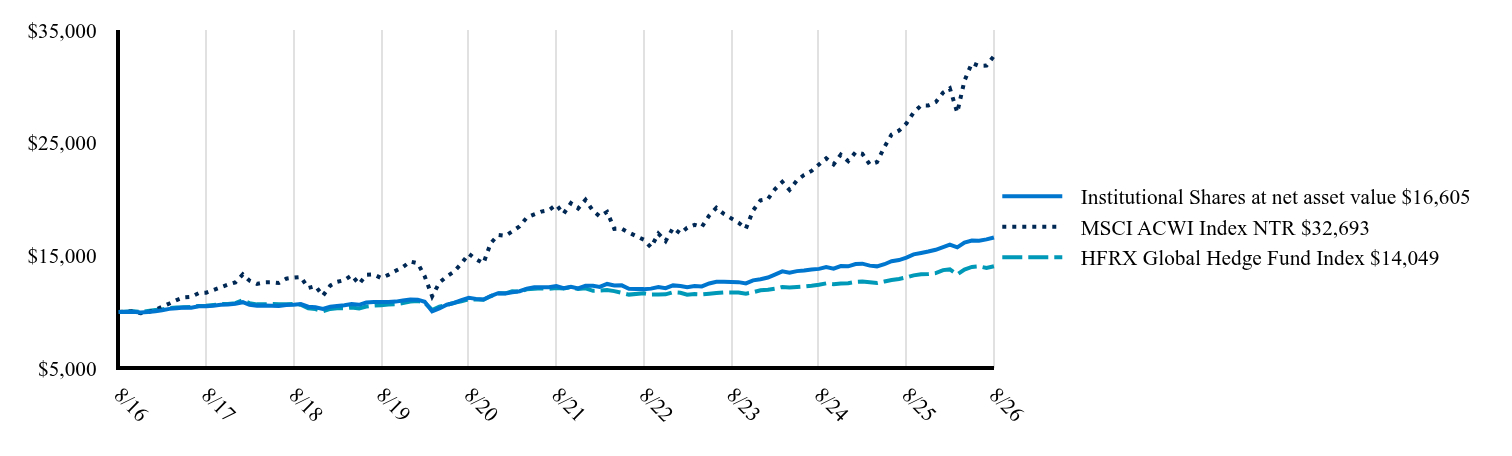 Table Summary | Institutional Shares at net asset value $16,605 | MSCI ACWI Index NTR $32,693 | HFRX Global Hedge Fund Index $14,049 |
|---|
8/16 | 10,000 | 10,000 | 10,000 |
|---|
10/16 | 10,018 | 10,061 | 10,055 |
|---|
11/16 | 9,954 | 9,891 | 9,998 |
|---|
12/16 | 9,991 | 9,966 | 10,085 |
|---|
1/17 | 10,061 | 10,181 | 10,171 |
|---|
2/17 | 10,153 | 10,459 | 10,223 |
|---|
3/17 | 10,273 | 10,753 | 10,337 |
|---|
4/17 | 10,319 | 11,054 | 10,384 |
|---|
5/17 | 10,393 | 11,298 | 10,409 |
|---|
6/17 | 10,375 | 11,349 | 10,432 |
|---|
7/17 | 10,495 | 11,667 | 10,528 |
|---|
8/17 | 10,504 | 11,711 | 10,559 |
|---|
9/17 | 10,559 | 11,938 | 10,622 |
|---|
10/17 | 10,642 | 12,185 | 10,696 |
|---|
11/17 | 10,670 | 12,421 | 10,703 |
|---|
12/17 | 10,724 | 12,622 | 10,781 |
|---|
1/18 | 10,867 | 13,334 | 11,045 |
|---|
2/18 | 10,629 | 12,774 | 10,777 |
|---|
3/18 | 10,544 | 12,491 | 10,672 |
|---|
4/18 | 10,563 | 12,620 | 10,681 |
|---|
5/18 | 10,544 | 12,635 | 10,710 |
|---|
6/18 | 10,535 | 12,567 | 10,690 |
|---|
7/18 | 10,620 | 12,946 | 10,674 |
|---|
8/18 | 10,639 | 13,048 | 10,722 |
|---|
9/18 | 10,696 | 13,104 | 10,648 |
|---|
10/18 | 10,468 | 12,122 | 10,318 |
|---|
11/18 | 10,421 | 12,300 | 10,254 |
|---|
12/18 | 10,260 | 11,433 | 10,057 |
|---|
1/19 | 10,462 | 12,336 | 10,270 |
|---|
2/19 | 10,533 | 12,666 | 10,335 |
|---|
3/19 | 10,594 | 12,825 | 10,318 |
|---|
4/19 | 10,705 | 13,258 | 10,386 |
|---|
5/19 | 10,634 | 12,472 | 10,315 |
|---|
6/19 | 10,836 | 13,289 | 10,481 |
|---|
7/19 | 10,877 | 13,327 | 10,562 |
|---|
8/19 | 10,877 | 13,011 | 10,602 |
|---|
9/19 | 10,887 | 13,285 | 10,650 |
|---|
10/19 | 10,917 | 13,649 | 10,682 |
|---|
11/19 | 11,018 | 13,982 | 10,792 |
|---|
12/19 | 11,099 | 14,474 | 10,923 |
|---|
1/20 | 11,089 | 14,314 | 10,968 |
|---|
2/20 | 10,897 | 13,158 | 10,811 |
|---|
3/20 | 10,048 | 11,382 | 10,175 |
|---|
4/20 | 10,311 | 12,601 | 10,468 |
|---|
5/20 | 10,644 | 13,149 | 10,619 |
|---|
6/20 | 10,796 | 13,569 | 10,805 |
|---|
7/20 | 11,049 | 14,287 | 10,951 |
|---|
8/20 | 11,251 | 15,161 | 11,120 |
|---|
9/20 | 11,160 | 14,672 | 11,101 |
|---|
10/20 | 11,099 | 14,316 | 11,077 |
|---|
11/20 | 11,413 | 16,080 | 11,389 |
|---|
12/20 | 11,666 | 16,827 | 11,668 |
|---|
1/21 | 11,636 | 16,751 | 11,648 |
|---|
2/21 | 11,738 | 17,138 | 11,825 |
|---|
3/21 | 11,841 | 17,596 | 11,818 |
|---|
4/21 | 12,067 | 18,366 | 12,011 |
|---|
5/21 | 12,191 | 18,651 | 12,057 |
|---|
6/21 | 12,191 | 18,897 | 12,103 |
|---|
7/21 | 12,201 | 19,027 | 12,049 |
|---|
8/21 | 12,293 | 19,504 | 12,131 |
|---|
9/21 | 12,108 | 18,698 | 12,085 |
|---|
10/21 | 12,232 | 19,652 | 12,194 |
|---|
11/21 | 12,088 | 19,179 | 12,036 |
|---|
12/21 | 12,324 | 19,946 | 12,094 |
|---|
1/22 | 12,313 | 18,967 | 11,875 |
|---|
2/22 | 12,217 | 18,477 | 11,903 |
|---|
3/22 | 12,484 | 18,877 | 11,948 |
|---|
4/22 | 12,345 | 17,366 | 11,846 |
|---|
5/22 | 12,356 | 17,386 | 11,693 |
|---|
6/22 | 12,056 | 17,033 | 11,538 |
|---|
8/22 | 12,024 | 16,406 | 11,654 |
|---|
9/22 | 12,067 | 15,730 | 11,544 |
|---|
10/22 | 12,217 | 16,950 | 11,555 |
|---|
11/22 | 12,103 | 16,283 | 11,562 |
|---|
12/22 | 12,355 | 17,451 | 11,754 |
|---|
1/23 | 12,307 | 16,950 | 11,705 |
|---|
2/23 | 12,187 | 17,473 | 11,533 |
|---|
3/23 | 12,295 | 17,724 | 11,592 |
|---|
4/23 | 12,259 | 17,534 | 11,560 |
|---|
5/23 | 12,523 | 18,553 | 11,618 |
|---|
6/23 | 12,667 | 19,232 | 11,681 |
|---|
7/23 | 12,667 | 18,694 | 11,733 |
|---|
9/23 | 12,643 | 17,921 | 11,728 |
|---|
10/23 | 12,535 | 17,382 | 11,623 |
|---|
11/23 | 12,799 | 18,987 | 11,743 |
|---|
12/23 | 12,899 | 19,898 | 11,921 |
|---|
1/24 | 13,048 | 20,015 | 11,962 |
|---|
2/24 | 13,309 | 20,874 | 12,058 |
|---|
3/24 | 13,595 | 21,529 | 12,214 |
|---|
4/24 | 13,471 | 20,819 | 12,169 |
|---|
5/24 | 13,620 | 21,665 | 12,219 |
|---|
6/24 | 13,669 | 22,147 | 12,258 |
|---|
7/24 | 13,769 | 22,504 | 12,320 |
|---|
8/24 | 13,818 | 23,076 | 12,407 |
|---|
9/24 | 13,980 | 23,612 | 12,536 |
|---|
10/24 | 13,831 | 23,082 | 12,464 |
|---|
11/24 | 14,067 | 23,945 | 12,531 |
|---|
12/24 | 14,043 | 23,379 | 12,541 |
|---|
1/25 | 14,245 | 24,163 | 12,670 |
|---|
2/25 | 14,283 | 24,018 | 12,702 |
|---|
3/25 | 14,106 | 23,069 | 12,634 |
|---|
4/25 | 14,043 | 23,284 | 12,559 |
|---|
5/25 | 14,232 | 24,622 | 12,701 |
|---|
6/25 | 14,497 | 25,728 | 12,827 |
|---|
7/25 | 14,598 | 26,077 | 12,920 |
|---|
8/25 | 14,825 | 26,721 | 13,065 |
|---|
9/25 | 15,103 | 27,689 | 13,246 |
|---|
10/25 | 15,229 | 28,309 | 13,347 |
|---|
11/25 | 15,355 | 28,305 | 13,365 |
|---|
12/25 | 15,513 | 28,601 | 13,443 |
|---|
1/26 | 15,753 | 29,449 | 13,711 |
|---|
2/26 | 15,979 | 29,827 | 13,772 |
|---|
3/26 | 15,726 | 27,685 | 13,325 |
|---|
4/26 | 16,152 | 30,502 | 13,758 |
|---|
5/26 | 16,338 | 32,075 | 13,987 |
|---|
6/26 | 16,312 | 31,818 | 14,040 |
|---|
7/26 | 16,432 | 31,842 | 13,900 |
|---|
8/26 | 16,605 | 32,693 | 14,049 |
|---|
|
|
| Average Annual Return [Table Text Block] |
|
Table SummaryName | 1-Year | 5-Year | 10-Year |
|---|
Institutional Shares | 12.00% | 6.20% | 5.20% |
|---|
MSCI ACWI Index NTR | 22.35% | 10.88% | 12.58% |
|---|
HFRX Global Hedge Fund Index | 7.53% | 2.98% | 3.46% |
|---|
|
|
| No Deduction of Taxes [Text Block] |
|
The graph above represents historical performance of a hypothetical investment of $10,000 in the Fund over the past ten years (or since inception if shorter). The table and graph above do not reflect the impact of taxes. If they did, performance would be lower.
|
|
| Performance Table Market Index Changed [Text Block] |
|
The MSCI ACWI Index NTR is the Fund's primary broad-based securities market index. The HFRX Global Hedge Fund Index is included as an additional index for the Fund as it shows how the Fund’s performance compares with the returns of an index of funds with similar investment objectives.
|
|
| Material Change Date |
|
|
Aug. 31, 2025
|
| Updated Performance Information Location [Text Block] |
|
Visit www.principalam.com/mutualfundperformance for more recent performance information.
|
|
| AssetsNet |
|
$ 637,164,000
|
|
| Holdings Count | Holding |
|
2,339
|
|
| Advisory Fees Paid, Amount |
|
$ 6,370,000
|
|
| InvestmentCompanyPortfolioTurnover |
|
182.10%
|
|
| Additional Fund Statistics [Text Block] |
|
- Net Assets (amount in thousands)$637,164
- Total Number of Portfolio Holdings2,339
- Portfolio Turnover Rate 182.1%
- Total Advisory Fees Paid (amount in thousands)$6,370
|
|
| Holdings [Text Block] |
|
Table SummaryAsset Weighting | Percent of Net Assets |
|---|
Common Stocks | 36.25% | Bonds | 26.93% | Investment Companies | 22.96% | U.S. Government & Government Agency Obligations | 8.17% | Senior Floating Rate Interests | 1.41% | Convertible Bonds | 0.08% | Preferred Stocks | 0.06% | Purchased Options | 0.04% | Convertible Preferred Stocks | 0.03% | Other Assets and LiabilitiesFootnote Reference*Footnote Reference† | 4.07% | Total Net Assets | 100.00% | | Footnote | Description | Footnote* | Includes derivatives | Footnote† | Includes short sales |
Table SummaryTop Locations | Percent of Net Assets |
|---|
United States | 39.44% | Japan | 7.75% | Canada | 2.25% | United Kingdom | 1.80% | Cayman Islands | 1.65% | Mexico | 1.58% | Netherlands | 1.46% | Australia | 0.93% | Czech Republic | 0.86% | Hungary | 0.73% | Supranational | 0.68% | Luxembourg | 0.68% | Brazil | 0.65% | Colombia | 0.62% | South Africa | 0.59% | Italy | 0.56% | Hong Kong | 0.55% | Peru | 0.55% | Israel | 0.48% | Argentina | 0.47% | Other LocationsFootnote Reference* | 31.65% | Other Assets and LiabilitiesFootnote Reference†Footnote Reference‡ | 4.07% | Total Net Assets | 100.00% | | Footnote | Description | Footnote* | Includes locations other than the top twenty and/or Investment Companies
| Footnote† | Includes derivatives | Footnote‡ | Includes short sales |
|
|
| Material Fund Change [Text Block] |
|
This is a summary of certain changes to the Fund since August 31, 2025. For more complete information, you may review the Fund's most recent prospectus, which we expect to be effective by December 31 or upon request at www.PrincipalAM.com/prospectuses. Effective January 15, 2026, Wellington Management Company LLP was terminated as a sub-advisor. Effective May 15, 2026, Gotham Asset Management, LLC was terminated as a sub-advisor. Additionally on that date, Parametric Portfolio Associates, LLC was hired as a sub-advisor. |
|
| Material Fund Change Adviser [Text Block] |
|
Effective January 15, 2026, Wellington Management Company LLP was terminated as a sub-advisor. Effective May 15, 2026, Gotham Asset Management, LLC was terminated as a sub-advisor. Additionally on that date, Parametric Portfolio Associates, LLC was hired as a sub-advisor.
|
|
| Summary of Change Legend [Text Block] |
|
This is a summary of certain changes to the Fund since August 31, 2025. For more complete information, you may review the Fund's most recent prospectus, which we expect to be effective by December 31 or upon request at www.PrincipalAM.com/prospectuses.
|
|
| Updated Prospectus Web Address |
|
www.PrincipalAM.com/prospectuses
|
|
| C000190071 |
|
|
|
| Shareholder Report [Line Items] |
|
|
|
| Fund Name |
|
Global Multi-Strategy Fund
|
|
| Class Name |
|
R-6
|
|
| Trading Symbol |
|
PGLSX
|
|
| Annual or Semi-Annual Statement [Text Block] |
|
This annual shareholder report contains important information about Global Multi-Strategy Fund (the "Fund") for the period of September 1, 2025 to August 31, 2026.
|
|
| Shareholder Report Annual or Semi-Annual |
|
Annual Shareholder Report
|
|
| Additional Information [Text Block] |
|
You can find additional information about the Fund at www.PrincipalAM.com/prospectuses or you can request information by contacting us at 1-800-222-5852 or emailing prospectus@principalfunds.com.
|
|
| Material Fund Change Notice [Text Block] |
|
This report describes certain changes to the Fund that occurred during the reporting period.
|
|
| Additional Information Phone Number |
|
1-800-222-5852
|
|
| Additional Information Email |
|
<span style="box-sizing: border-box; color: rgb(0, 0, 0); display: inline; flex-wrap: nowrap; font-size: 10.6667px; font-weight: 400; grid-area: auto; line-height: 16px; margin: 0px; overflow: visible; text-align: left; text-align-last: auto; white-space-collapse: preserve-breaks;">prospectus@principalfunds.com</span>
|
|
| Additional Information Website |
|
<span style="box-sizing: border-box; color: rgb(0, 0, 0); display: inline; flex-wrap: nowrap; font-size: 10.6667px; font-weight: 400; grid-area: auto; line-height: 16px; margin: 0px; overflow: visible; text-align: left; text-align-last: auto; white-space-collapse: preserve-breaks;">www.PrincipalAM.com/prospectuses</span>
|
|
| Expenses [Text Block] |
|
What were the Fund costs for the last year? (based on a hypothetical $10,000 investment) Table SummaryClass Name | Costs of a $10,000 investment | Costs paid as a percentage of a $10,000 investment |
|---|
R-6 | $135 | 1.27% |
|---|
|
|
| Expenses Paid, Amount |
|
$ 135
|
|
| Expense Ratio, Percent |
|
1.27%
|
|
| Factors Affecting Performance [Text Block] |
|
Management’s Discussion of Fund PerformanceThe Fund seeks to achieve long-term capital appreciation with an emphasis on positive total returns and managing volatility. The Fund invests in a broad range of instruments including, but not limited to, equities, bonds, currencies, commodities, convertible securities, and bank loans. Under normal market conditions, it invests in securities of issuers located throughout the world, including the U.S., invests at least 30% of its net assets in foreign and emerging market securities, and holds investments tied economically to at least twenty countries. The Fund’s investments achieved attractive performance for the year ending August 31, 2026, and did so with consistent monthly results. The Fund’s investments significantly outperformed the HFRX Global Hedge Fund Index (“Index”) over the year, in part by outperforming the Index during the months when the Index delivered negative returns (in both March 2026 and July 2026). The Fund’s largest contributors were its trend-following strategy sleeves managed by Graham Capital Management, L.P. (“Graham”) and Crabel Capital Management, LLC (“Crabel”) within the Fund’s global macro portfolio. Both Graham and Crabel benefited from a combination of allocations to commodities and global equity indices, as well as being short interest rate futures. Other significant contributors to performance were the Fund’s equity hedge sleeves, especially the sleeve managed by Los Angeles Capital Management (“LA Capital”). LA Capital delivered solid performance, driven by its overweight allocation to quality growth and momentum factors. There were no sleeves which detracted from the Fund’s absolute performance. However, several sleeves delivered modest positive performance, including sleeves managed by Record Currency Management Limited, Loomis, Sayles & Company, L.P., and Westchester Capital Management, LLC. The Fund and its subadvisors use derivatives to gain exposure to asset classes as well as to reduce portfolio risk. |
|
| Performance Past Does Not Indicate Future [Text] |
|
Past performance is not a good predictor of the Fund's future performance.
|
|
| Line Graph [Table Text Block] |
|
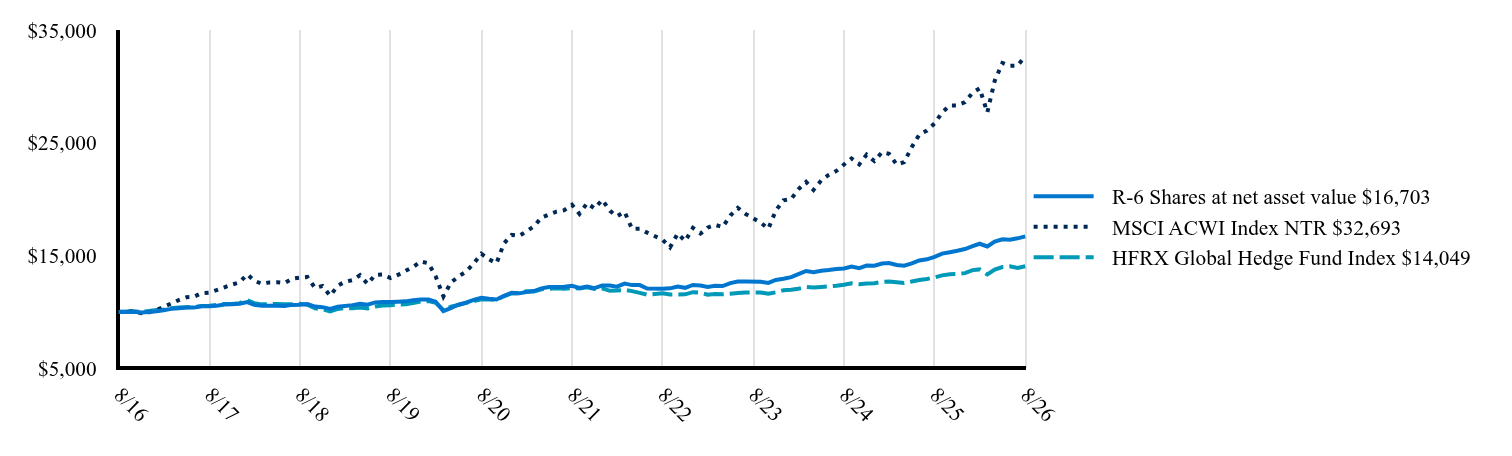 Table Summary | R-6 Shares at net asset value $16,703 | MSCI ACWI Index NTR $32,693 | HFRX Global Hedge Fund Index $14,049 |
|---|
8/16 | 10,000 | 10,000 | 10,000 |
|---|
10/16 | 10,018 | 10,061 | 10,055 |
|---|
11/16 | 9,954 | 9,891 | 9,998 |
|---|
12/16 | 9,991 | 9,966 | 10,085 |
|---|
1/17 | 10,061 | 10,181 | 10,171 |
|---|
2/17 | 10,153 | 10,459 | 10,223 |
|---|
3/17 | 10,273 | 10,753 | 10,337 |
|---|
4/17 | 10,319 | 11,054 | 10,384 |
|---|
5/17 | 10,393 | 11,298 | 10,409 |
|---|
6/17 | 10,384 | 11,349 | 10,432 |
|---|
7/17 | 10,495 | 11,667 | 10,528 |
|---|
8/17 | 10,513 | 11,711 | 10,559 |
|---|
9/17 | 10,559 | 11,938 | 10,622 |
|---|
10/17 | 10,651 | 12,185 | 10,696 |
|---|
11/17 | 10,679 | 12,421 | 10,703 |
|---|
12/17 | 10,721 | 12,622 | 10,781 |
|---|
1/18 | 10,873 | 13,334 | 11,045 |
|---|
2/18 | 10,626 | 12,774 | 10,777 |
|---|
3/18 | 10,550 | 12,491 | 10,672 |
|---|
4/18 | 10,560 | 12,620 | 10,681 |
|---|
5/18 | 10,541 | 12,635 | 10,710 |
|---|
6/18 | 10,531 | 12,567 | 10,690 |
|---|
7/18 | 10,626 | 12,946 | 10,674 |
|---|
8/18 | 10,645 | 13,048 | 10,722 |
|---|
9/18 | 10,702 | 13,104 | 10,648 |
|---|
10/18 | 10,474 | 12,122 | 10,318 |
|---|
11/18 | 10,427 | 12,300 | 10,254 |
|---|
12/18 | 10,270 | 11,433 | 10,057 |
|---|
1/19 | 10,473 | 12,336 | 10,270 |
|---|
2/19 | 10,534 | 12,666 | 10,335 |
|---|
3/19 | 10,604 | 12,825 | 10,318 |
|---|
4/19 | 10,716 | 13,258 | 10,386 |
|---|
5/19 | 10,645 | 12,472 | 10,315 |
|---|
6/19 | 10,848 | 13,289 | 10,481 |
|---|
7/19 | 10,888 | 13,327 | 10,562 |
|---|
8/19 | 10,888 | 13,011 | 10,602 |
|---|
9/19 | 10,908 | 13,285 | 10,650 |
|---|
10/19 | 10,939 | 13,649 | 10,682 |
|---|
11/19 | 11,030 | 13,982 | 10,792 |
|---|
12/19 | 11,111 | 14,474 | 10,923 |
|---|
1/20 | 11,101 | 14,314 | 10,968 |
|---|
2/20 | 10,908 | 13,158 | 10,811 |
|---|
3/20 | 10,068 | 11,382 | 10,175 |
|---|
4/20 | 10,331 | 12,601 | 10,468 |
|---|
5/20 | 10,655 | 13,149 | 10,619 |
|---|
6/20 | 10,817 | 13,569 | 10,805 |
|---|
7/20 | 11,070 | 14,287 | 10,951 |
|---|
8/20 | 11,263 | 15,161 | 11,120 |
|---|
9/20 | 11,172 | 14,672 | 11,101 |
|---|
10/20 | 11,111 | 14,316 | 11,077 |
|---|
11/20 | 11,435 | 16,080 | 11,389 |
|---|
12/20 | 11,690 | 16,827 | 11,668 |
|---|
1/21 | 11,649 | 16,751 | 11,648 |
|---|
2/21 | 11,762 | 17,138 | 11,825 |
|---|
3/21 | 11,855 | 17,596 | 11,818 |
|---|
4/21 | 12,092 | 18,366 | 12,011 |
|---|
5/21 | 12,205 | 18,651 | 12,057 |
|---|
6/21 | 12,216 | 18,897 | 12,103 |
|---|
7/21 | 12,226 | 19,027 | 12,049 |
|---|
8/21 | 12,319 | 19,504 | 12,131 |
|---|
9/21 | 12,133 | 18,698 | 12,085 |
|---|
10/21 | 12,257 | 19,652 | 12,194 |
|---|
11/21 | 12,113 | 19,179 | 12,036 |
|---|
12/21 | 12,349 | 19,946 | 12,094 |
|---|
1/22 | 12,338 | 18,967 | 11,875 |
|---|
2/22 | 12,242 | 18,477 | 11,903 |
|---|
3/22 | 12,510 | 18,877 | 11,948 |
|---|
4/22 | 12,381 | 17,366 | 11,846 |
|---|
5/22 | 12,381 | 17,386 | 11,693 |
|---|
6/22 | 12,081 | 17,033 | 11,538 |
|---|
8/22 | 12,060 | 16,406 | 11,654 |
|---|
9/22 | 12,092 | 15,730 | 11,544 |
|---|
10/22 | 12,252 | 16,950 | 11,555 |
|---|
11/22 | 12,139 | 16,283 | 11,562 |
|---|
12/22 | 12,392 | 17,451 | 11,754 |
|---|
1/23 | 12,344 | 16,950 | 11,705 |
|---|
2/23 | 12,224 | 17,473 | 11,533 |
|---|
3/23 | 12,332 | 17,724 | 11,592 |
|---|
4/23 | 12,296 | 17,534 | 11,560 |
|---|
5/23 | 12,560 | 18,553 | 11,618 |
|---|
6/23 | 12,704 | 19,232 | 11,681 |
|---|
7/23 | 12,704 | 18,694 | 11,733 |
|---|
9/23 | 12,680 | 17,921 | 11,728 |
|---|
10/23 | 12,572 | 17,382 | 11,623 |
|---|
11/23 | 12,837 | 18,987 | 11,743 |
|---|
12/23 | 12,937 | 19,898 | 11,921 |
|---|
1/24 | 13,087 | 20,015 | 11,962 |
|---|
2/24 | 13,348 | 20,874 | 12,058 |
|---|
3/24 | 13,634 | 21,529 | 12,214 |
|---|
4/24 | 13,522 | 20,819 | 12,169 |
|---|
5/24 | 13,659 | 21,665 | 12,219 |
|---|
6/24 | 13,721 | 22,147 | 12,258 |
|---|
7/24 | 13,808 | 22,504 | 12,320 |
|---|
8/24 | 13,858 | 23,076 | 12,407 |
|---|
9/24 | 14,032 | 23,612 | 12,536 |
|---|
10/24 | 13,883 | 23,082 | 12,464 |
|---|
11/24 | 14,119 | 23,945 | 12,531 |
|---|
12/24 | 14,096 | 23,379 | 12,541 |
|---|
1/25 | 14,298 | 24,163 | 12,670 |
|---|
2/25 | 14,336 | 24,018 | 12,702 |
|---|
3/25 | 14,159 | 23,069 | 12,634 |
|---|
4/25 | 14,096 | 23,284 | 12,559 |
|---|
5/25 | 14,298 | 24,622 | 12,701 |
|---|
6/25 | 14,563 | 25,728 | 12,827 |
|---|
7/25 | 14,664 | 26,077 | 12,920 |
|---|
8/25 | 14,879 | 26,721 | 13,065 |
|---|
9/25 | 15,170 | 27,689 | 13,246 |
|---|
10/25 | 15,296 | 28,309 | 13,347 |
|---|
11/25 | 15,423 | 28,305 | 13,365 |
|---|
12/25 | 15,581 | 28,601 | 13,443 |
|---|
1/26 | 15,835 | 29,449 | 13,711 |
|---|
2/26 | 16,048 | 29,827 | 13,772 |
|---|
3/26 | 15,808 | 27,685 | 13,325 |
|---|
4/26 | 16,235 | 30,502 | 13,758 |
|---|
5/26 | 16,436 | 32,075 | 13,987 |
|---|
6/26 | 16,395 | 31,818 | 14,040 |
|---|
7/26 | 16,529 | 31,842 | 13,900 |
|---|
8/26 | 16,703 | 32,693 | 14,049 |
|---|
|
|
| Average Annual Return [Table Text Block] |
|
Table SummaryName | 1-Year | 5-Year | 10-YearFootnote Reference* |
|---|
R-6 Shares | 12.25% | 6.28% | 5.26% |
|---|
MSCI ACWI Index NTR | 22.35% | 10.88% | 12.58% |
|---|
HFRX Global Hedge Fund Index | 7.53% | 2.98% | 3.46% |
|---|
|
|
| Performance Inception Date |
|
Oct. 24, 2011
|
|
| No Deduction of Taxes [Text Block] |
|
The graph above represents historical performance of a hypothetical investment of $10,000 in the Fund over the past ten years (or since inception if shorter). The table and graph above do not reflect the impact of taxes. If they did, performance would be lower.
|
|
| Performance Table Market Index Changed [Text Block] |
|
The MSCI ACWI Index NTR is the Fund's primary broad-based securities market index. The HFRX Global Hedge Fund Index is included as an additional index for the Fund as it shows how the Fund’s performance compares with the returns of an index of funds with similar investment objectives.
|
|
| Material Change Date |
|
|
Aug. 31, 2025
|
| Updated Performance Information Location [Text Block] |
|
Visit www.principalam.com/mutualfundperformance for more recent performance information.
|
|
| AssetsNet |
|
$ 637,164,000
|
|
| Holdings Count | Holding |
|
2,339
|
|
| Advisory Fees Paid, Amount |
|
$ 6,370,000
|
|
| InvestmentCompanyPortfolioTurnover |
|
182.10%
|
|
| Additional Fund Statistics [Text Block] |
|
- Net Assets (amount in thousands)$637,164
- Total Number of Portfolio Holdings2,339
- Portfolio Turnover Rate 182.1%
- Total Advisory Fees Paid (amount in thousands)$6,370
|
|
| Holdings [Text Block] |
|
Table SummaryAsset Weighting | Percent of Net Assets |
|---|
Common Stocks | 36.25% | Bonds | 26.93% | Investment Companies | 22.96% | U.S. Government & Government Agency Obligations | 8.17% | Senior Floating Rate Interests | 1.41% | Convertible Bonds | 0.08% | Preferred Stocks | 0.06% | Purchased Options | 0.04% | Convertible Preferred Stocks | 0.03% | Other Assets and LiabilitiesFootnote Reference*Footnote Reference† | 4.07% | Total Net Assets | 100.00% | | Footnote | Description | Footnote* | Includes derivatives | Footnote† | Includes short sales |
Table SummaryTop Locations | Percent of Net Assets |
|---|
United States | 39.44% | Japan | 7.75% | Canada | 2.25% | United Kingdom | 1.80% | Cayman Islands | 1.65% | Mexico | 1.58% | Netherlands | 1.46% | Australia | 0.93% | Czech Republic | 0.86% | Hungary | 0.73% | Supranational | 0.68% | Luxembourg | 0.68% | Brazil | 0.65% | Colombia | 0.62% | South Africa | 0.59% | Italy | 0.56% | Hong Kong | 0.55% | Peru | 0.55% | Israel | 0.48% | Argentina | 0.47% | Other LocationsFootnote Reference* | 31.65% | Other Assets and LiabilitiesFootnote Reference†Footnote Reference‡ | 4.07% | Total Net Assets | 100.00% | | Footnote | Description | Footnote* | Includes locations other than the top twenty and/or Investment Companies
| Footnote† | Includes derivatives | Footnote‡ | Includes short sales |
|
|
| Material Fund Change [Text Block] |
|
This is a summary of certain changes to the Fund since August 31, 2025. For more complete information, you may review the Fund's most recent prospectus, which we expect to be effective by December 31 or upon request at www.PrincipalAM.com/prospectuses. Effective January 15, 2026, Wellington Management Company LLP was terminated as a sub-advisor. Effective May 15, 2026, Gotham Asset Management, LLC was terminated as a sub-advisor. Additionally on that date, Parametric Portfolio Associates, LLC was hired as a sub-advisor. |
|
| Material Fund Change Adviser [Text Block] |
|
Effective January 15, 2026, Wellington Management Company LLP was terminated as a sub-advisor. Effective May 15, 2026, Gotham Asset Management, LLC was terminated as a sub-advisor. Additionally on that date, Parametric Portfolio Associates, LLC was hired as a sub-advisor.
|
|
| Summary of Change Legend [Text Block] |
|
This is a summary of certain changes to the Fund since August 31, 2025. For more complete information, you may review the Fund's most recent prospectus, which we expect to be effective by December 31 or upon request at www.PrincipalAM.com/prospectuses.
|
|
| Updated Prospectus Web Address |
|
www.PrincipalAM.com/prospectuses
|
|
| C000237990 |
|
|
|
| Shareholder Report [Line Items] |
|
|
|
| Fund Name |
|
Global Listed Infrastructure Fund
|
|
| Class Name |
|
Institutional
|
|
| Trading Symbol |
|
PGSLX
|
|
| Annual or Semi-Annual Statement [Text Block] |
|
This annual shareholder report contains important information about Global Listed Infrastructure Fund (the "Fund") for the period of September 1, 2025 to August 31, 2026.
|
|
| Shareholder Report Annual or Semi-Annual |
|
Annual Shareholder Report
|
|
| Additional Information [Text Block] |
|
You can find additional information about the Fund at www.PrincipalAM.com/prospectuses or you can request information by contacting us at 1-800-222-5852 or emailing prospectus@principalfunds.com.
|
|
| Material Fund Change Notice [Text Block] |
|
This report describes certain changes to the Fund that occurred during the reporting period.
|
|
| Additional Information Phone Number |
|
1-800-222-5852
|
|
| Additional Information Email |
|
<span style="box-sizing: border-box; color: rgb(0, 0, 0); display: inline; flex-wrap: nowrap; font-size: 10.6667px; font-weight: 400; grid-area: auto; line-height: 16px; margin: 0px; overflow: visible; text-align: left; text-align-last: auto; white-space-collapse: preserve-breaks;">prospectus@principalfunds.com</span>
|
|
| Additional Information Website |
|
<span style="box-sizing: border-box; color: rgb(0, 0, 0); display: inline; flex-wrap: nowrap; font-size: 10.6667px; font-weight: 400; grid-area: auto; line-height: 16px; margin: 0px; overflow: visible; text-align: left; text-align-last: auto; white-space-collapse: preserve-breaks;">www.PrincipalAM.com/prospectuses</span>
|
|
| Expenses [Text Block] |
|
What were the Fund costs for the last year? (based on a hypothetical $10,000 investment) Table SummaryClass Name | Costs of a $10,000 investment | Costs paid as a percentage of a $10,000 investment |
|---|
Institutional | $69 | 0.65% |
|---|
|
|
| Expenses Paid, Amount |
|
$ 69
|
|
| Expense Ratio, Percent |
|
0.65%
|
|
| Factors Affecting Performance [Text Block] |
|
Management’s Discussion of Fund PerformanceThe Fund seeks to achieve total return by investing, under normal circumstances, at least 80% of its net assets in securities issued by listed infrastructure companies. It invests primarily in equity securities regardless of market capitalization (small, medium, or large) and invests in both value and growth securities. The Fund also invests in Real Estate Investment Trusts ("REITs") but only those REITs that are engaged in the development, operation, or management of infrastructure assets. The Fund’s investments outperformed the FTSE Global Core Infrastructure 50/50 Net Tax Index (“Index”). Relative outperformance was driven primarily by strong security selection in North America and Europe, Middle East and Africa (EMEA), particularly within utilities. Among North American utilities, the Fund benefitted from its holdings in several companies that increased capital expenditures to support accelerating power demand coming from artificial intelligence (AI). In EMEA, the Fund’s position in a major European electricity transmission system operator benefitted from ongoing execution of its investment plan and favorable regulatory developments in one of its key markets, Germany. Security selection within North American energy infrastructure also contributed positively. These relative gains were partially offset by weak security selection in Asia and in the communications sector globally. Within Asia, the Fund’s wireless tower holdings were hurt by macroeconomic concerns and limited positive fundamental catalysts, and the transportation sector also detracted as the Fund was underweight in the strongly performing marine port subsector. Within U.S. communications, the Fund’s overweight to wireless towers and underweight to satellites both detracted from relative performance. Satellite stocks benefited from mergers and acquisitions as well as enthusiasm around the space economy. Towers sold off as the market assessed the risk satellite networks may pose to tower economics. |
|
| Performance Past Does Not Indicate Future [Text] |
|
Past performance is not a good predictor of the Fund's future performance.
|
|
| Line Graph [Table Text Block] |
|
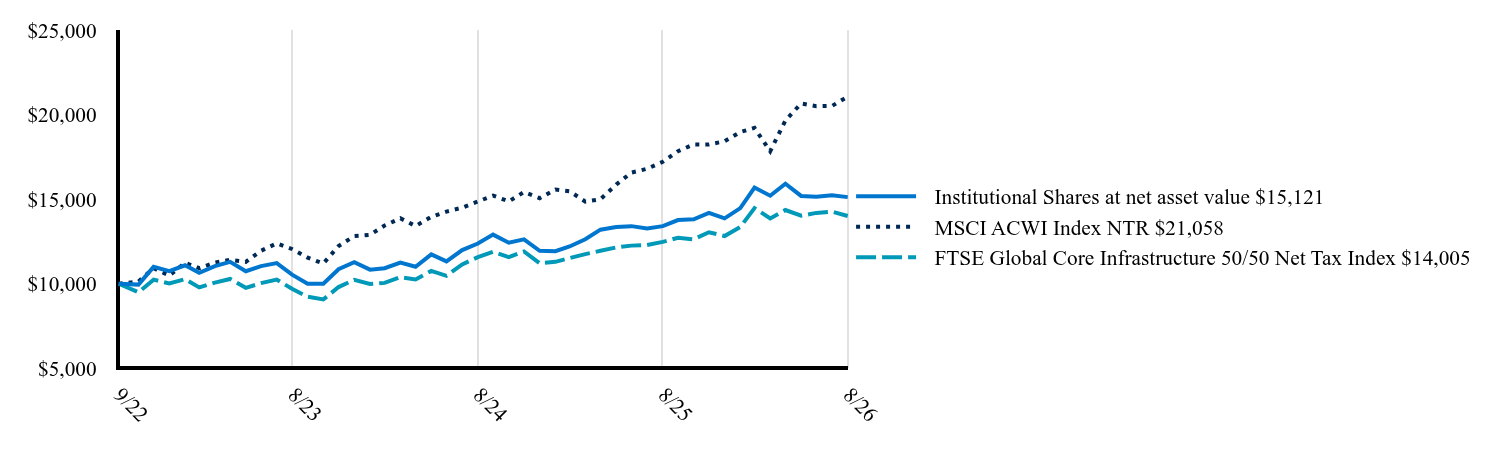 Table Summary | Institutional Shares at net asset value $15,121 | MSCI ACWI Index NTR $21,058 | FTSE Global Core Infrastructure 50/50 Net Tax Index $14,005 |
|---|
9/22 | 10,000 | 10,000 | 10,000 |
|---|
10/22 | 9,950 | 10,132 | 9,496 |
|---|
11/22 | 11,000 | 10,918 | 10,241 |
|---|
12/22 | 10,749 | 10,489 | 10,015 |
|---|
1/23 | 11,093 | 11,240 | 10,275 |
|---|
2/23 | 10,648 | 10,918 | 9,782 |
|---|
3/23 | 11,043 | 11,255 | 10,070 |
|---|
4/23 | 11,296 | 11,417 | 10,285 |
|---|
5/23 | 10,739 | 11,294 | 9,760 |
|---|
6/23 | 11,043 | 11,950 | 10,035 |
|---|
7/23 | 11,225 | 12,388 | 10,244 |
|---|
8/23 | 10,526 | 12,041 | 9,686 |
|---|
9/23 | 10,000 | 11,543 | 9,234 |
|---|
10/23 | 10,000 | 11,196 | 9,074 |
|---|
11/23 | 10,860 | 12,230 | 9,804 |
|---|
12/23 | 11,269 | 12,817 | 10,236 |
|---|
1/24 | 10,832 | 12,892 | 9,986 |
|---|
2/24 | 10,919 | 13,446 | 10,052 |
|---|
3/24 | 11,247 | 13,868 | 10,395 |
|---|
4/24 | 11,007 | 13,410 | 10,255 |
|---|
5/24 | 11,738 | 13,955 | 10,759 |
|---|
6/24 | 11,323 | 14,266 | 10,471 |
|---|
7/24 | 11,989 | 14,496 | 11,140 |
|---|
8/24 | 12,381 | 14,864 | 11,575 |
|---|
9/24 | 12,905 | 15,209 | 11,894 |
|---|
10/24 | 12,425 | 14,868 | 11,579 |
|---|
11/24 | 12,621 | 15,424 | 11,907 |
|---|
12/24 | 11,950 | 15,059 | 11,211 |
|---|
1/25 | 11,927 | 15,564 | 11,297 |
|---|
2/25 | 12,204 | 15,471 | 11,513 |
|---|
3/25 | 12,631 | 14,859 | 11,751 |
|---|
4/25 | 13,198 | 14,998 | 11,947 |
|---|
5/25 | 13,360 | 15,860 | 12,145 |
|---|
6/25 | 13,406 | 16,572 | 12,254 |
|---|
7/25 | 13,267 | 16,797 | 12,292 |
|---|
8/25 | 13,406 | 17,212 | 12,476 |
|---|
9/25 | 13,764 | 17,835 | 12,720 |
|---|
10/25 | 13,810 | 18,234 | 12,626 |
|---|
11/25 | 14,192 | 18,232 | 13,045 |
|---|
12/25 | 13,865 | 18,423 | 12,821 |
|---|
1/26 | 14,469 | 18,969 | 13,353 |
|---|
2/26 | 15,690 | 19,213 | 14,469 |
|---|
3/26 | 15,204 | 17,833 | 13,864 |
|---|
4/26 | 15,915 | 19,647 | 14,357 |
|---|
5/26 | 15,192 | 20,661 | 14,023 |
|---|
6/26 | 15,144 | 20,495 | 14,188 |
|---|
7/26 | 15,227 | 20,511 | 14,265 |
|---|
8/26 | 15,121 | 21,058 | 14,005 |
|---|
|
|
| Average Annual Return [Table Text Block] |
|
Table SummaryName | 1-Year | Since InceptionFootnote Reference* |
|---|
Institutional Shares | 12.79% | 11.07% |
|---|
MSCI ACWI Index NTR | 22.35% | 20.81% |
|---|
FTSE Global Core Infrastructure 50/50 Net Tax Index | 12.26% | 8.93% |
|---|
|
|
| Performance Inception Date |
|
Sep. 22, 2022
|
|
| No Deduction of Taxes [Text Block] |
|
The graph above represents historical performance of a hypothetical investment of $10,000 in the Fund over the past ten years (or since inception if shorter). The table and graph above do not reflect the impact of taxes. If they did, performance would be lower.
|
|
| Performance Table Market Index Changed [Text Block] |
|
The MSCI ACWI Index NTR is the Fund's primary broad-based securities market index. The FTSE Global Core Infrastructure 50/50 Net Tax Index is included as an additional index for the Fund as it shows how the Fund’s performance compares with the returns of an index of funds with similar investment objectives.
|
|
| Material Change Date |
|
|
Aug. 31, 2025
|
| Updated Performance Information Location [Text Block] |
|
Visit www.principalam.com/mutualfundperformance for more recent performance information.
|
|
| AssetsNet |
|
$ 107,807,000
|
|
| Holdings Count | Holding |
|
42
|
|
| Advisory Fees Paid, Amount |
|
$ 759,000
|
|
| InvestmentCompanyPortfolioTurnover |
|
48.10%
|
|
| Additional Fund Statistics [Text Block] |
|
- Net Assets (amount in thousands)$107,807
- Total Number of Portfolio Holdings42
- Portfolio Turnover Rate 48.1%
- Total Advisory Fees Paid (amount in thousands)$759
|
|
| Holdings [Text Block] |
|
Table SummaryAsset Weighting | Percent of Net Assets |
|---|
Common Stocks | 98.43% | Investment Companies | 1.79% | Other Assets and Liabilities | (0.22)% | Total Net Assets | 100.00% | Table SummaryTop Locations | Percent of Net Assets |
|---|
United States | 56.15% | Australia | 7.69% | United Kingdom | 6.27% | Canada | 5.41% | Brazil | 5.25% | France | 2.77% | Belgium | 2.72% | Spain | 2.56% | Hong Kong | 2.32% | China | 1.88% | Japan | 1.83% | India | 1.30% | Italy | 1.29% | Indonesia | 0.99% | Other LocationsFootnote Reference* | 1.79% | Other Assets and Liabilities | (0.22)% | Total Net Assets | 100.00% | | Footnote | Description | Footnote* | Includes locations other than the top twenty and/or Investment Companies
|
|
|
| Material Fund Change [Text Block] |
|
This is a summary of certain changes to the Fund since August 31, 2025. For more complete information, you may review the Fund's most recent prospectus, which we expect to be effective by December 31 or upon request at www.PrincipalAM.com/prospectuses. Effective September 23, 2025, the Fund changed from Non-Diversified to Diversified and updated its Principal Risks. Effective February 17, 2026, Principal Real Estate Investors, LLC was terminated as a sub-advisor. |
|
| Material Fund Change Risks Change [Text Block] |
|
Effective September 23, 2025, the Fund changed from Non-Diversified to Diversified and updated its Principal Risks.
|
|
| Material Fund Change Adviser [Text Block] |
|
Effective February 17, 2026, Principal Real Estate Investors, LLC was terminated as a sub-advisor.
|
|
| Summary of Change Legend [Text Block] |
|
This is a summary of certain changes to the Fund since August 31, 2025. For more complete information, you may review the Fund's most recent prospectus, which we expect to be effective by December 31 or upon request at www.PrincipalAM.com/prospectuses.
|
|
| Updated Prospectus Web Address |
|
www.PrincipalAM.com/prospectuses
|
|
| C000082035 |
|
|
|
| Shareholder Report [Line Items] |
|
|
|
| Fund Name |
|
International Equity Index Fund
|
|
| Class Name |
|
Institutional
|
|
| Trading Symbol |
|
PIDIX
|
|
| Annual or Semi-Annual Statement [Text Block] |
|
This annual shareholder report contains important information about International Equity Index Fund (the "Fund") for the period of September 1, 2025 to August 31, 2026.
|
|
| Shareholder Report Annual or Semi-Annual |
|
Annual Shareholder Report
|
|
| Additional Information [Text Block] |
|
You can find additional information about the Fund at www.PrincipalAM.com/prospectuses or you can request information by contacting us at 1-800-222-5852 or emailing prospectus@principalfunds.com.
|
|
| Additional Information Phone Number |
|
1-800-222-5852
|
|
| Additional Information Email |
|
<span style="box-sizing: border-box; color: rgb(0, 0, 0); display: inline; flex-wrap: nowrap; font-size: 10.6667px; font-weight: 400; grid-area: auto; line-height: 16px; margin: 0px; overflow: visible; text-align: left; text-align-last: auto; white-space-collapse: preserve-breaks;">prospectus@principalfunds.com</span>
|
|
| Additional Information Website |
|
<span style="box-sizing: border-box; color: rgb(0, 0, 0); display: inline; flex-wrap: nowrap; font-size: 10.6667px; font-weight: 400; grid-area: auto; line-height: 16px; margin: 0px; overflow: visible; text-align: left; text-align-last: auto; white-space-collapse: preserve-breaks;">www.PrincipalAM.com/prospectuses</span>
|
|
| Expenses [Text Block] |
|
What were the Fund costs for the last year? (based on a hypothetical $10,000 investment) Table SummaryClass Name | Costs of a $10,000 investment | Costs paid as a percentage of a $10,000 investment |
|---|
Institutional | $32 | 0.29% |
|---|
|
|
| Expenses Paid, Amount |
|
$ 32
|
|
| Expense Ratio, Percent |
|
0.29%
|
|
| Factors Affecting Performance [Text Block] |
|
Management’s Discussion of Fund PerformanceThe Fund seeks long-term growth of capital. The Fund invests at least 80% of its net assets in securities that compose the MSCI EAFE Index NTR ("Index"). The Index is a market-weighted equity index designed to measure the equity performance of developed markets, excluding the United States and Canada. The advisor employs a passive investment approach designed to attempt to track the performance of the Index. During the 12 months ending August 31, 2026, the Fund's investment performance was in line with the Index. The Fund uses an indexing strategy and does not attempt to manage market volatility, use defensive strategies, or reduce the effect of any long-term periods of negative stock market performance. Ten of the eleven economic sectors in the Index posted positive returns as information technology and energy posted the best returns for the year. The communication services and consumer discretionary sectors were the weakest performers. Advantest, Tokyo Electron Ltd., and ASML Holding contributed to performance. Sea Ltd., EssilorLuxottica SA, and Nintendo detracted from performance for the year. |
|
| Performance Past Does Not Indicate Future [Text] |
|
Past performance is not a good predictor of the Fund's future performance.
|
|
| Line Graph [Table Text Block] |
|
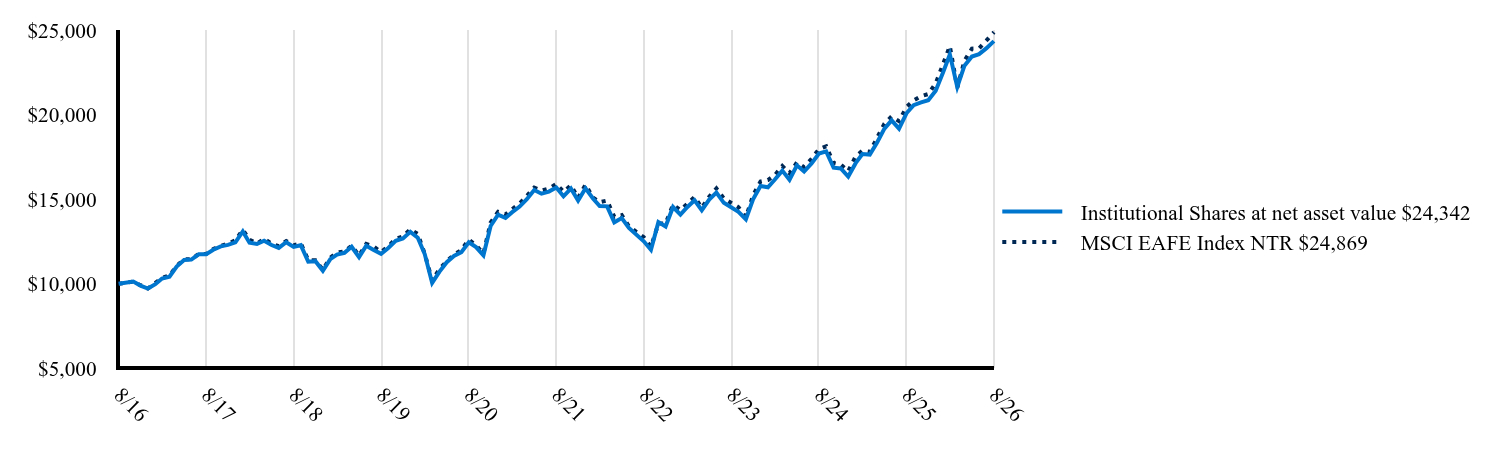 Table Summary | Institutional Shares at net asset value $24,342 | MSCI EAFE Index NTR $24,869 |
|---|
8/16 | 10,000 | 10,000 |
|---|
10/16 | 10,130 | 10,123 |
|---|
11/16 | 9,892 | 9,916 |
|---|
12/16 | 9,719 | 9,718 |
|---|
1/17 | 9,973 | 10,051 |
|---|
2/17 | 10,307 | 10,342 |
|---|
3/17 | 10,418 | 10,490 |
|---|
4/17 | 11,019 | 11,053 |
|---|
5/17 | 11,409 | 11,459 |
|---|
6/17 | 11,431 | 11,439 |
|---|
7/17 | 11,742 | 11,768 |
|---|
8/17 | 11,742 | 11,764 |
|---|
9/17 | 12,010 | 12,057 |
|---|
10/17 | 12,210 | 12,240 |
|---|
11/17 | 12,299 | 12,368 |
|---|
12/17 | 12,452 | 12,567 |
|---|
1/18 | 13,097 | 13,197 |
|---|
2/18 | 12,429 | 12,601 |
|---|
3/18 | 12,349 | 12,374 |
|---|
4/18 | 12,544 | 12,657 |
|---|
5/18 | 12,291 | 12,372 |
|---|
6/18 | 12,118 | 12,221 |
|---|
7/18 | 12,452 | 12,522 |
|---|
8/18 | 12,176 | 12,280 |
|---|
9/18 | 12,279 | 12,387 |
|---|
10/18 | 11,300 | 11,401 |
|---|
11/18 | 11,335 | 11,386 |
|---|
12/18 | 10,764 | 10,834 |
|---|
1/19 | 11,459 | 11,546 |
|---|
2/19 | 11,722 | 11,840 |
|---|
3/19 | 11,830 | 11,915 |
|---|
4/19 | 12,189 | 12,250 |
|---|
5/19 | 11,567 | 11,661 |
|---|
6/19 | 12,249 | 12,353 |
|---|
7/19 | 11,998 | 12,196 |
|---|
8/19 | 11,770 | 11,880 |
|---|
9/19 | 12,117 | 12,221 |
|---|
10/19 | 12,536 | 12,660 |
|---|
11/19 | 12,680 | 12,803 |
|---|
12/19 | 13,068 | 13,219 |
|---|
1/20 | 12,722 | 12,943 |
|---|
2/20 | 11,756 | 11,773 |
|---|
3/20 | 10,049 | 10,201 |
|---|
4/20 | 10,705 | 10,860 |
|---|
5/20 | 11,274 | 11,333 |
|---|
6/20 | 11,645 | 11,719 |
|---|
7/20 | 11,868 | 11,992 |
|---|
8/20 | 12,449 | 12,609 |
|---|
9/20 | 12,165 | 12,281 |
|---|
10/20 | 11,682 | 11,791 |
|---|
11/20 | 13,415 | 13,619 |
|---|
12/20 | 14,082 | 14,252 |
|---|
1/21 | 13,892 | 14,100 |
|---|
2/21 | 14,234 | 14,416 |
|---|
3/21 | 14,564 | 14,748 |
|---|
4/21 | 14,994 | 15,192 |
|---|
5/21 | 15,539 | 15,687 |
|---|
6/21 | 15,323 | 15,510 |
|---|
7/21 | 15,450 | 15,627 |
|---|
8/21 | 15,691 | 15,903 |
|---|
9/21 | 15,171 | 15,441 |
|---|
10/21 | 15,627 | 15,821 |
|---|
11/21 | 14,918 | 15,085 |
|---|
12/21 | 15,641 | 15,857 |
|---|
1/22 | 15,042 | 15,091 |
|---|
2/22 | 14,589 | 14,824 |
|---|
3/22 | 14,576 | 14,919 |
|---|
4/22 | 13,630 | 13,954 |
|---|
5/22 | 13,883 | 14,059 |
|---|
6/22 | 13,297 | 13,390 |
|---|
8/22 | 12,510 | 12,754 |
|---|
9/22 | 12,004 | 12,182 |
|---|
10/22 | 13,643 | 13,555 |
|---|
11/22 | 13,387 | 13,565 |
|---|
12/22 | 14,538 | 14,664 |
|---|
1/23 | 14,086 | 14,358 |
|---|
2/23 | 14,524 | 14,714 |
|---|
3/23 | 14,936 | 15,129 |
|---|
4/23 | 14,346 | 14,489 |
|---|
5/23 | 14,977 | 15,148 |
|---|
6/23 | 15,388 | 15,639 |
|---|
7/23 | 14,785 | 15,039 |
|---|
9/23 | 14,250 | 14,526 |
|---|
10/23 | 13,812 | 13,937 |
|---|
11/23 | 14,990 | 15,230 |
|---|
12/23 | 15,778 | 16,040 |
|---|
1/24 | 15,706 | 16,132 |
|---|
2/24 | 16,162 | 16,427 |
|---|
3/24 | 16,688 | 16,967 |
|---|
4/24 | 16,148 | 16,533 |
|---|
5/24 | 17,001 | 17,173 |
|---|
6/24 | 16,631 | 16,896 |
|---|
7/24 | 17,115 | 17,392 |
|---|
8/24 | 17,698 | 17,957 |
|---|
9/24 | 17,826 | 18,123 |
|---|
10/24 | 16,859 | 17,138 |
|---|
11/24 | 16,816 | 17,040 |
|---|
12/24 | 16,339 | 16,653 |
|---|
1/25 | 17,129 | 17,528 |
|---|
2/25 | 17,665 | 17,868 |
|---|
3/25 | 17,635 | 17,796 |
|---|
4/25 | 18,335 | 18,611 |
|---|
5/25 | 19,169 | 19,462 |
|---|
6/25 | 19,661 | 19,891 |
|---|
7/25 | 19,169 | 19,612 |
|---|
8/25 | 20,078 | 20,448 |
|---|
9/25 | 20,554 | 20,839 |
|---|
10/25 | 20,718 | 21,085 |
|---|
11/25 | 20,852 | 21,216 |
|---|
12/25 | 21,415 | 21,852 |
|---|
1/26 | 22,509 | 22,992 |
|---|
2/26 | 23,556 | 24,056 |
|---|
3/26 | 21,631 | 21,581 |
|---|
4/26 | 22,894 | 23,189 |
|---|
5/26 | 23,433 | 23,900 |
|---|
6/26 | 23,572 | 23,916 |
|---|
7/26 | 23,926 | 24,384 |
|---|
8/26 | 24,342 | 24,869 |
|---|
|
|
| Average Annual Return [Table Text Block] |
|
Table SummaryName | 1-Year | 5-Year | 10-Year |
|---|
Institutional Shares | 21.24% | 9.18% | 9.30% |
|---|
MSCI EAFE Index NTR | 21.62% | 9.35% | 9.54% |
|---|
|
|
| No Deduction of Taxes [Text Block] |
|
The graph above represents historical performance of a hypothetical investment of $10,000 in the Fund over the past ten years (or since inception if shorter). The table and graph above do not reflect the impact of taxes. If they did, performance would be lower.
|
|
| Updated Performance Information Location [Text Block] |
|
Visit www.principalam.com/mutualfundperformance for more recent performance information.
|
|
| AssetsNet |
|
$ 1,183,369,000
|
|
| Holdings Count | Holding |
|
662
|
|
| Advisory Fees Paid, Amount |
|
$ 2,675,000
|
|
| InvestmentCompanyPortfolioTurnover |
|
79.50%
|
|
| Additional Fund Statistics [Text Block] |
|
- Net Assets (amount in thousands)$1,183,369
- Total Number of Portfolio Holdings662
- Portfolio Turnover Rate 79.5%
- Total Advisory Fees Paid (amount in thousands)$2,675
|
|
| Holdings [Text Block] |
|
Table SummaryAsset Weighting | Percent of Net Assets |
|---|
Common Stocks | 97.18% | Investment Companies | 2.80% | Preferred Stocks | 0.22% | Other Assets and LiabilitiesFootnote Reference* | (0.20)% | Total Net Assets | 100.00% | | Footnote | Description | Footnote* | Includes derivatives |
Table SummaryTop Locations | Percent of Net Assets |
|---|
Japan | 23.11% | United Kingdom | 13.33% | Switzerland | 9.65% | Germany | 8.66% | France | 8.54% | Australia | 6.39% | Netherlands | 6.10% | Spain | 3.83% | Sweden | 3.38% | Italy | 3.16% | Hong Kong | 1.93% | Singapore | 1.78% | Denmark | 1.62% | Finland | 1.14% | Israel | 1.13% | Belgium | 1.11% | Ireland | 0.67% | Norway | 0.62% | Austria | 0.37% | Luxembourg | 0.28% | Other LocationsFootnote Reference* | 3.40% | Other Assets and LiabilitiesFootnote Reference† | (0.20)% | Total Net Assets | 100.00% | | Footnote | Description | Footnote* | Includes locations other than the top twenty and/or Investment Companies
| Footnote† | Includes derivatives |
|
|
| Material Fund Change [Text Block] |
|
There were no material changes to the Fund for the period September 1, 2025 to August 31, 2026. For more complete information, you may review the Fund's most recent prospectus at www.PrincipalAM.com/prospectuses. |
|
| C000082032 |
|
|
|
| Shareholder Report [Line Items] |
|
|
|
| Fund Name |
|
International Equity Index Fund
|
|
| Class Name |
|
R-3
|
|
| Trading Symbol |
|
PIIOX
|
|
| Annual or Semi-Annual Statement [Text Block] |
|
This annual shareholder report contains important information about International Equity Index Fund (the "Fund") for the period of September 1, 2025 to August 31, 2026.
|
|
| Shareholder Report Annual or Semi-Annual |
|
Annual Shareholder Report
|
|
| Additional Information [Text Block] |
|
You can find additional information about the Fund at www.PrincipalAM.com/prospectuses or you can request information by contacting us at 1-800-222-5852 or emailing prospectus@principalfunds.com.
|
|
| Additional Information Phone Number |
|
1-800-222-5852
|
|
| Additional Information Email |
|
<span style="box-sizing: border-box; color: rgb(0, 0, 0); display: inline; flex-wrap: nowrap; font-size: 10.6667px; font-weight: 400; grid-area: auto; line-height: 16px; margin: 0px; overflow: visible; text-align: left; text-align-last: auto; white-space-collapse: preserve-breaks;">prospectus@principalfunds.com</span>
|
|
| Additional Information Website |
|
<span style="box-sizing: border-box; color: rgb(0, 0, 0); display: inline; flex-wrap: nowrap; font-size: 10.6667px; font-weight: 400; grid-area: auto; line-height: 16px; margin: 0px; overflow: visible; text-align: left; text-align-last: auto; white-space-collapse: preserve-breaks;">www.PrincipalAM.com/prospectuses</span>
|
|
| Expenses [Text Block] |
|
What were the Fund costs for the last year? (based on a hypothetical $10,000 investment) Table SummaryClass Name | Costs of a $10,000 investment | Costs paid as a percentage of a $10,000 investment |
|---|
R-3 | $95 | 0.86% |
|---|
|
|
| Expenses Paid, Amount |
|
$ 95
|
|
| Expense Ratio, Percent |
|
0.86%
|
|
| Factors Affecting Performance [Text Block] |
|
Management’s Discussion of Fund PerformanceThe Fund seeks long-term growth of capital. The Fund invests at least 80% of its net assets in securities that compose the MSCI EAFE Index NTR ("Index"). The Index is a market-weighted equity index designed to measure the equity performance of developed markets, excluding the United States and Canada. The advisor employs a passive investment approach designed to attempt to track the performance of the Index. During the 12 months ending August 31, 2026, the Fund's investment performance was in line with the Index. The Fund uses an indexing strategy and does not attempt to manage market volatility, use defensive strategies, or reduce the effect of any long-term periods of negative stock market performance. Ten of the eleven economic sectors in the Index posted positive returns as information technology and energy posted the best returns for the year. The communication services and consumer discretionary sectors were the weakest performers. Advantest, Tokyo Electron Ltd., and ASML Holding contributed to performance. Sea Ltd., EssilorLuxottica SA, and Nintendo detracted from performance for the year. |
|
| Performance Past Does Not Indicate Future [Text] |
|
Past performance is not a good predictor of the Fund's future performance.
|
|
| Line Graph [Table Text Block] |
|
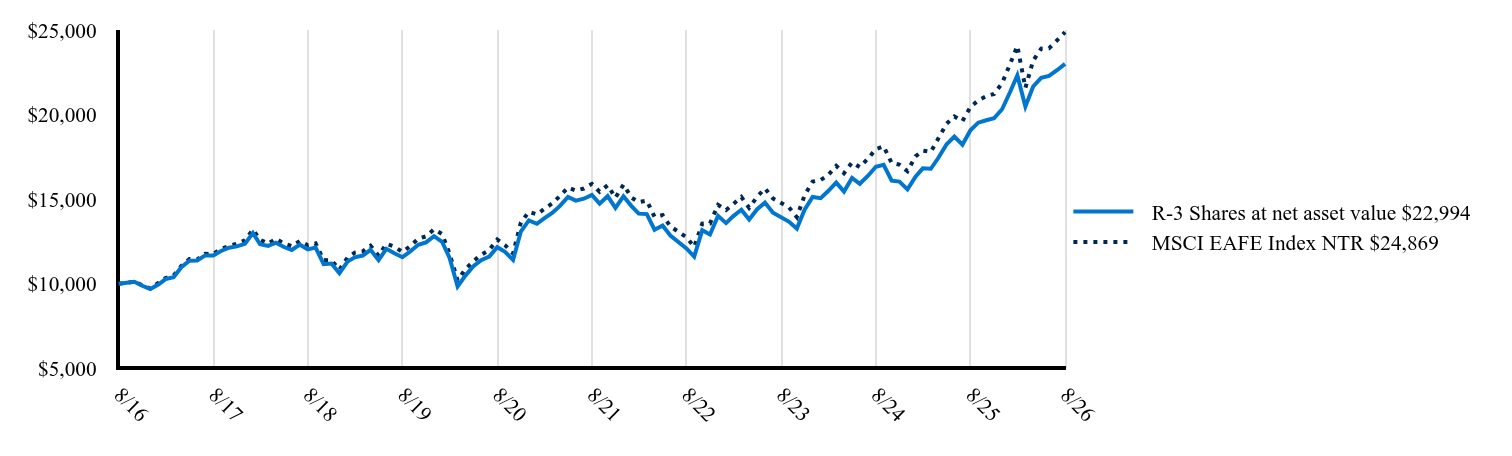 Table Summary | R-3 Shares at net asset value $22,994 | MSCI EAFE Index NTR $24,869 |
|---|
8/16 | 10,000 | 10,000 |
|---|
10/16 | 10,121 | 10,123 |
|---|
11/16 | 9,879 | 9,916 |
|---|
12/16 | 9,691 | 9,718 |
|---|
1/17 | 9,951 | 10,051 |
|---|
2/17 | 10,278 | 10,342 |
|---|
3/17 | 10,391 | 10,490 |
|---|
4/17 | 10,978 | 11,053 |
|---|
5/17 | 11,361 | 11,459 |
|---|
6/17 | 11,373 | 11,439 |
|---|
7/17 | 11,677 | 11,768 |
|---|
8/17 | 11,677 | 11,764 |
|---|
9/17 | 11,937 | 12,057 |
|---|
10/17 | 12,129 | 12,240 |
|---|
11/17 | 12,208 | 12,368 |
|---|
12/17 | 12,356 | 12,567 |
|---|
1/18 | 12,996 | 13,197 |
|---|
2/18 | 12,333 | 12,601 |
|---|
3/18 | 12,240 | 12,374 |
|---|
4/18 | 12,426 | 12,657 |
|---|
5/18 | 12,170 | 12,372 |
|---|
6/18 | 11,996 | 12,221 |
|---|
7/18 | 12,310 | 12,522 |
|---|
8/18 | 12,031 | 12,280 |
|---|
9/18 | 12,135 | 12,387 |
|---|
10/18 | 11,159 | 11,401 |
|---|
11/18 | 11,194 | 11,386 |
|---|
12/18 | 10,623 | 10,834 |
|---|
1/19 | 11,307 | 11,546 |
|---|
2/19 | 11,559 | 11,840 |
|---|
3/19 | 11,667 | 11,915 |
|---|
4/19 | 12,003 | 12,250 |
|---|
5/19 | 11,391 | 11,661 |
|---|
6/19 | 12,063 | 12,353 |
|---|
7/19 | 11,799 | 12,196 |
|---|
8/19 | 11,571 | 11,880 |
|---|
9/19 | 11,907 | 12,221 |
|---|
10/19 | 12,303 | 12,660 |
|---|
11/19 | 12,447 | 12,803 |
|---|
12/19 | 12,816 | 13,219 |
|---|
1/20 | 12,483 | 12,943 |
|---|
2/20 | 11,532 | 11,773 |
|---|
3/20 | 9,841 | 10,201 |
|---|
4/20 | 10,483 | 10,860 |
|---|
5/20 | 11,038 | 11,333 |
|---|
6/20 | 11,396 | 11,719 |
|---|
7/20 | 11,606 | 11,992 |
|---|
8/20 | 12,162 | 12,609 |
|---|
9/20 | 11,890 | 12,281 |
|---|
10/20 | 11,409 | 11,791 |
|---|
11/20 | 13,088 | 13,619 |
|---|
12/20 | 13,744 | 14,252 |
|---|
1/21 | 13,543 | 14,100 |
|---|
2/21 | 13,870 | 14,416 |
|---|
3/21 | 14,184 | 14,748 |
|---|
4/21 | 14,599 | 15,192 |
|---|
5/21 | 15,127 | 15,687 |
|---|
6/21 | 14,914 | 15,510 |
|---|
7/21 | 15,027 | 15,627 |
|---|
8/21 | 15,253 | 15,903 |
|---|
9/21 | 14,738 | 15,441 |
|---|
10/21 | 15,178 | 15,821 |
|---|
11/21 | 14,486 | 15,085 |
|---|
12/21 | 15,170 | 15,857 |
|---|
1/22 | 14,590 | 15,091 |
|---|
2/22 | 14,143 | 14,824 |
|---|
3/22 | 14,116 | 14,919 |
|---|
4/22 | 13,194 | 13,954 |
|---|
5/22 | 13,445 | 14,059 |
|---|
6/22 | 12,852 | 13,390 |
|---|
8/22 | 12,088 | 12,754 |
|---|
9/22 | 11,601 | 12,182 |
|---|
10/22 | 13,168 | 13,555 |
|---|
11/22 | 12,911 | 13,565 |
|---|
12/22 | 14,015 | 14,664 |
|---|
1/23 | 13,584 | 14,358 |
|---|
2/23 | 14,001 | 14,714 |
|---|
3/23 | 14,378 | 15,129 |
|---|
4/23 | 13,800 | 14,489 |
|---|
5/23 | 14,405 | 15,148 |
|---|
6/23 | 14,796 | 15,639 |
|---|
7/23 | 14,203 | 15,039 |
|---|
9/23 | 13,678 | 14,526 |
|---|
10/23 | 13,261 | 13,937 |
|---|
11/23 | 14,378 | 15,230 |
|---|
12/23 | 15,132 | 16,040 |
|---|
1/24 | 15,062 | 16,132 |
|---|
2/24 | 15,480 | 16,427 |
|---|
3/24 | 15,981 | 16,967 |
|---|
4/24 | 15,452 | 16,533 |
|---|
5/24 | 16,259 | 17,173 |
|---|
6/24 | 15,911 | 16,896 |
|---|
7/24 | 16,371 | 17,392 |
|---|
8/24 | 16,914 | 17,957 |
|---|
9/24 | 17,025 | 18,123 |
|---|
10/24 | 16,092 | 17,138 |
|---|
11/24 | 16,037 | 17,040 |
|---|
12/24 | 15,577 | 16,653 |
|---|
1/25 | 16,331 | 17,528 |
|---|
2/25 | 16,824 | 17,868 |
|---|
3/25 | 16,795 | 17,796 |
|---|
4/25 | 17,462 | 18,611 |
|---|
5/25 | 18,245 | 19,462 |
|---|
6/25 | 18,695 | 19,891 |
|---|
7/25 | 18,216 | 19,612 |
|---|
8/25 | 19,072 | 20,448 |
|---|
9/25 | 19,522 | 20,839 |
|---|
10/25 | 19,667 | 21,085 |
|---|
11/25 | 19,783 | 21,216 |
|---|
12/25 | 20,316 | 21,852 |
|---|
1/26 | 21,333 | 22,992 |
|---|
2/26 | 22,321 | 24,056 |
|---|
3/26 | 20,481 | 21,581 |
|---|
4/26 | 21,662 | 23,189 |
|---|
5/26 | 22,171 | 23,900 |
|---|
6/26 | 22,291 | 23,916 |
|---|
7/26 | 22,620 | 24,384 |
|---|
8/26 | 22,994 | 24,869 |
|---|
|
|
| Average Annual Return [Table Text Block] |
|
Table SummaryName | 1-Year | 5-Year | 10-Year |
|---|
R-3 Shares | 20.56% | 8.55% | 8.68% |
|---|
MSCI EAFE Index NTR | 21.62% | 9.35% | 9.54% |
|---|
|
|
| No Deduction of Taxes [Text Block] |
|
The graph above represents historical performance of a hypothetical investment of $10,000 in the Fund over the past ten years (or since inception if shorter). The table and graph above do not reflect the impact of taxes. If they did, performance would be lower.
|
|
| Updated Performance Information Location [Text Block] |
|
Visit www.principalam.com/mutualfundperformance for more recent performance information.
|
|
| AssetsNet |
|
$ 1,183,369,000
|
|
| Holdings Count | Holding |
|
662
|
|
| Advisory Fees Paid, Amount |
|
$ 2,675,000
|
|
| InvestmentCompanyPortfolioTurnover |
|
79.50%
|
|
| Additional Fund Statistics [Text Block] |
|
- Net Assets (amount in thousands)$1,183,369
- Total Number of Portfolio Holdings662
- Portfolio Turnover Rate 79.5%
- Total Advisory Fees Paid (amount in thousands)$2,675
|
|
| Holdings [Text Block] |
|
Table SummaryAsset Weighting | Percent of Net Assets |
|---|
Common Stocks | 97.18% | Investment Companies | 2.80% | Preferred Stocks | 0.22% | Other Assets and LiabilitiesFootnote Reference* | (0.20)% | Total Net Assets | 100.00% | | Footnote | Description | Footnote* | Includes derivatives |
Table SummaryTop Locations | Percent of Net Assets |
|---|
Japan | 23.11% | United Kingdom | 13.33% | Switzerland | 9.65% | Germany | 8.66% | France | 8.54% | Australia | 6.39% | Netherlands | 6.10% | Spain | 3.83% | Sweden | 3.38% | Italy | 3.16% | Hong Kong | 1.93% | Singapore | 1.78% | Denmark | 1.62% | Finland | 1.14% | Israel | 1.13% | Belgium | 1.11% | Ireland | 0.67% | Norway | 0.62% | Austria | 0.37% | Luxembourg | 0.28% | Other LocationsFootnote Reference* | 3.40% | Other Assets and LiabilitiesFootnote Reference† | (0.20)% | Total Net Assets | 100.00% | | Footnote | Description | Footnote* | Includes locations other than the top twenty and/or Investment Companies
| Footnote† | Includes derivatives |
|
|
| Material Fund Change [Text Block] |
|
There were no material changes to the Fund for the period September 1, 2025 to August 31, 2026. For more complete information, you may review the Fund's most recent prospectus at www.PrincipalAM.com/prospectuses. |
|
| C000082034 |
|
|
|
| Shareholder Report [Line Items] |
|
|
|
| Fund Name |
|
International Equity Index Fund
|
|
| Class Name |
|
R-5
|
|
| Trading Symbol |
|
PIIQX
|
|
| Annual or Semi-Annual Statement [Text Block] |
|
This annual shareholder report contains important information about International Equity Index Fund (the "Fund") for the period of September 1, 2025 to August 31, 2026.
|
|
| Shareholder Report Annual or Semi-Annual |
|
Annual Shareholder Report
|
|
| Additional Information [Text Block] |
|
You can find additional information about the Fund at www.PrincipalAM.com/prospectuses or you can request information by contacting us at 1-800-222-5852 or emailing prospectus@principalfunds.com.
|
|
| Additional Information Phone Number |
|
1-800-222-5852
|
|
| Additional Information Email |
|
<span style="box-sizing: border-box; color: rgb(0, 0, 0); display: inline; flex-wrap: nowrap; font-size: 10.6667px; font-weight: 400; grid-area: auto; line-height: 16px; margin: 0px; overflow: visible; text-align: left; text-align-last: auto; white-space-collapse: preserve-breaks;">prospectus@principalfunds.com</span>
|
|
| Additional Information Website |
|
<span style="box-sizing: border-box; color: rgb(0, 0, 0); display: inline; flex-wrap: nowrap; font-size: 10.6667px; font-weight: 400; grid-area: auto; line-height: 16px; margin: 0px; overflow: visible; text-align: left; text-align-last: auto; white-space-collapse: preserve-breaks;">www.PrincipalAM.com/prospectuses</span>
|
|
| Expenses [Text Block] |
|
What were the Fund costs for the last year? (based on a hypothetical $10,000 investment) Table SummaryClass Name | Costs of a $10,000 investment | Costs paid as a percentage of a $10,000 investment |
|---|
R-5 | $61 | 0.55% |
|---|
|
|
| Expenses Paid, Amount |
|
$ 61
|
|
| Expense Ratio, Percent |
|
0.55%
|
|
| Factors Affecting Performance [Text Block] |
|
Management’s Discussion of Fund PerformanceThe Fund seeks long-term growth of capital. The Fund invests at least 80% of its net assets in securities that compose the MSCI EAFE Index NTR ("Index"). The Index is a market-weighted equity index designed to measure the equity performance of developed markets, excluding the United States and Canada. The advisor employs a passive investment approach designed to attempt to track the performance of the Index. During the 12 months ending August 31, 2026, the Fund's investment performance was in line with the Index. The Fund uses an indexing strategy and does not attempt to manage market volatility, use defensive strategies, or reduce the effect of any long-term periods of negative stock market performance. Ten of the eleven economic sectors in the Index posted positive returns as information technology and energy posted the best returns for the year. The communication services and consumer discretionary sectors were the weakest performers. Advantest, Tokyo Electron Ltd., and ASML Holding contributed to performance. Sea Ltd., EssilorLuxottica SA, and Nintendo detracted from performance for the year. |
|
| Performance Past Does Not Indicate Future [Text] |
|
Past performance is not a good predictor of the Fund's future performance.
|
|
| Line Graph [Table Text Block] |
|
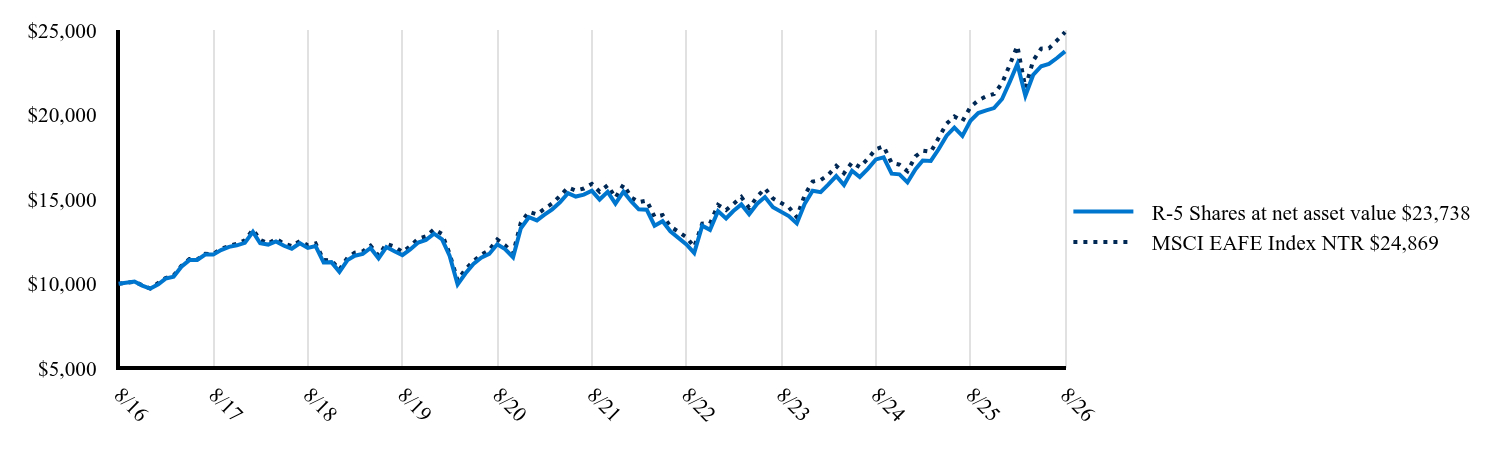 Table Summary | R-5 Shares at net asset value $23,738 | MSCI EAFE Index NTR $24,869 |
|---|
8/16 | 10,000 | 10,000 |
|---|
10/16 | 10,131 | 10,123 |
|---|
11/16 | 9,891 | 9,916 |
|---|
12/16 | 9,717 | 9,718 |
|---|
1/17 | 9,969 | 10,051 |
|---|
2/17 | 10,304 | 10,342 |
|---|
3/17 | 10,416 | 10,490 |
|---|
4/17 | 11,008 | 11,053 |
|---|
5/17 | 11,399 | 11,459 |
|---|
6/17 | 11,410 | 11,439 |
|---|
7/17 | 11,723 | 11,768 |
|---|
8/17 | 11,723 | 11,764 |
|---|
9/17 | 11,991 | 12,057 |
|---|
10/17 | 12,181 | 12,240 |
|---|
11/17 | 12,271 | 12,368 |
|---|
12/17 | 12,419 | 12,567 |
|---|
1/18 | 13,066 | 13,197 |
|---|
2/18 | 12,396 | 12,601 |
|---|
3/18 | 12,315 | 12,374 |
|---|
4/18 | 12,500 | 12,657 |
|---|
5/18 | 12,246 | 12,372 |
|---|
6/18 | 12,073 | 12,221 |
|---|
7/18 | 12,396 | 12,522 |
|---|
8/18 | 12,119 | 12,280 |
|---|
9/18 | 12,223 | 12,387 |
|---|
10/18 | 11,253 | 11,401 |
|---|
11/18 | 11,277 | 11,386 |
|---|
12/18 | 10,702 | 10,834 |
|---|
1/19 | 11,395 | 11,546 |
|---|
2/19 | 11,658 | 11,840 |
|---|
3/19 | 11,766 | 11,915 |
|---|
4/19 | 12,113 | 12,250 |
|---|
5/19 | 11,503 | 11,661 |
|---|
6/19 | 12,173 | 12,353 |
|---|
7/19 | 11,922 | 12,196 |
|---|
8/19 | 11,694 | 11,880 |
|---|
9/19 | 12,029 | 12,221 |
|---|
10/19 | 12,436 | 12,660 |
|---|
11/19 | 12,591 | 12,803 |
|---|
12/19 | 12,960 | 13,219 |
|---|
1/20 | 12,627 | 12,943 |
|---|
2/20 | 11,665 | 11,773 |
|---|
3/20 | 9,964 | 10,201 |
|---|
4/20 | 10,605 | 10,860 |
|---|
5/20 | 11,172 | 11,333 |
|---|
6/20 | 11,542 | 11,719 |
|---|
7/20 | 11,764 | 11,992 |
|---|
8/20 | 12,331 | 12,609 |
|---|
9/20 | 12,048 | 12,281 |
|---|
10/20 | 11,567 | 11,791 |
|---|
11/20 | 13,281 | 13,619 |
|---|
12/20 | 13,934 | 14,252 |
|---|
1/21 | 13,745 | 14,100 |
|---|
2/21 | 14,072 | 14,416 |
|---|
3/21 | 14,400 | 14,748 |
|---|
4/21 | 14,815 | 15,192 |
|---|
5/21 | 15,356 | 15,687 |
|---|
6/21 | 15,155 | 15,510 |
|---|
7/21 | 15,268 | 15,627 |
|---|
8/21 | 15,495 | 15,903 |
|---|
9/21 | 14,979 | 15,441 |
|---|
10/21 | 15,432 | 15,821 |
|---|
11/21 | 14,740 | 15,085 |
|---|
12/21 | 15,443 | 15,857 |
|---|
1/22 | 14,849 | 15,091 |
|---|
2/22 | 14,399 | 14,824 |
|---|
3/22 | 14,373 | 14,919 |
|---|
4/22 | 13,435 | 13,954 |
|---|
5/22 | 13,699 | 14,059 |
|---|
6/22 | 13,105 | 13,390 |
|---|
8/22 | 12,325 | 12,754 |
|---|
9/22 | 11,823 | 12,182 |
|---|
10/22 | 13,435 | 13,555 |
|---|
11/22 | 13,187 | 13,565 |
|---|
12/22 | 14,298 | 14,664 |
|---|
1/23 | 13,864 | 14,358 |
|---|
2/23 | 14,298 | 14,714 |
|---|
3/23 | 14,691 | 15,129 |
|---|
4/23 | 14,108 | 14,489 |
|---|
5/23 | 14,732 | 15,148 |
|---|
6/23 | 15,125 | 15,639 |
|---|
7/23 | 14,528 | 15,039 |
|---|
9/23 | 14,000 | 14,526 |
|---|
10/23 | 13,566 | 13,937 |
|---|
11/23 | 14,718 | 15,230 |
|---|
12/23 | 15,498 | 16,040 |
|---|
1/24 | 15,413 | 16,132 |
|---|
2/24 | 15,863 | 16,427 |
|---|
3/24 | 16,368 | 16,967 |
|---|
4/24 | 15,834 | 16,533 |
|---|
5/24 | 16,677 | 17,173 |
|---|
6/24 | 16,312 | 16,896 |
|---|
7/24 | 16,789 | 17,392 |
|---|
8/24 | 17,351 | 17,957 |
|---|
9/24 | 17,477 | 18,123 |
|---|
10/24 | 16,508 | 17,138 |
|---|
11/24 | 16,466 | 17,040 |
|---|
12/24 | 15,997 | 16,653 |
|---|
1/25 | 16,774 | 17,528 |
|---|
2/25 | 17,288 | 17,868 |
|---|
3/25 | 17,259 | 17,796 |
|---|
4/25 | 17,948 | 18,611 |
|---|
5/25 | 18,756 | 19,462 |
|---|
6/25 | 19,225 | 19,891 |
|---|
7/25 | 18,741 | 19,612 |
|---|
8/25 | 19,636 | 20,448 |
|---|
9/25 | 20,091 | 20,839 |
|---|
10/25 | 20,252 | 21,085 |
|---|
11/25 | 20,385 | 21,216 |
|---|
12/25 | 20,920 | 21,852 |
|---|
1/26 | 21,981 | 22,992 |
|---|
2/26 | 22,996 | 24,056 |
|---|
3/26 | 21,117 | 21,581 |
|---|
4/26 | 22,344 | 23,189 |
|---|
5/26 | 22,859 | 23,900 |
|---|
6/26 | 22,996 | 23,916 |
|---|
7/26 | 23,344 | 24,384 |
|---|
8/26 | 23,738 | 24,869 |
|---|
|
|
| Average Annual Return [Table Text Block] |
|
Table SummaryName | 1-Year | 5-Year | 10-Year |
|---|
R-5 Shares | 20.89% | 8.91% | 9.03% |
|---|
MSCI EAFE Index NTR | 21.62% | 9.35% | 9.54% |
|---|
|
|
| No Deduction of Taxes [Text Block] |
|
The graph above represents historical performance of a hypothetical investment of $10,000 in the Fund over the past ten years (or since inception if shorter). The table and graph above do not reflect the impact of taxes. If they did, performance would be lower.
|
|
| Updated Performance Information Location [Text Block] |
|
Visit www.principalam.com/mutualfundperformance for more recent performance information.
|
|
| AssetsNet |
|
$ 1,183,369,000
|
|
| Holdings Count | Holding |
|
662
|
|
| Advisory Fees Paid, Amount |
|
$ 2,675,000
|
|
| InvestmentCompanyPortfolioTurnover |
|
79.50%
|
|
| Additional Fund Statistics [Text Block] |
|
- Net Assets (amount in thousands)$1,183,369
- Total Number of Portfolio Holdings662
- Portfolio Turnover Rate 79.5%
- Total Advisory Fees Paid (amount in thousands)$2,675
|
|
| Holdings [Text Block] |
|
Table SummaryAsset Weighting | Percent of Net Assets |
|---|
Common Stocks | 97.18% | Investment Companies | 2.80% | Preferred Stocks | 0.22% | Other Assets and LiabilitiesFootnote Reference* | (0.20)% | Total Net Assets | 100.00% | | Footnote | Description | Footnote* | Includes derivatives |
Table SummaryTop Locations | Percent of Net Assets |
|---|
Japan | 23.11% | United Kingdom | 13.33% | Switzerland | 9.65% | Germany | 8.66% | France | 8.54% | Australia | 6.39% | Netherlands | 6.10% | Spain | 3.83% | Sweden | 3.38% | Italy | 3.16% | Hong Kong | 1.93% | Singapore | 1.78% | Denmark | 1.62% | Finland | 1.14% | Israel | 1.13% | Belgium | 1.11% | Ireland | 0.67% | Norway | 0.62% | Austria | 0.37% | Luxembourg | 0.28% | Other LocationsFootnote Reference* | 3.40% | Other Assets and LiabilitiesFootnote Reference† | (0.20)% | Total Net Assets | 100.00% | | Footnote | Description | Footnote* | Includes locations other than the top twenty and/or Investment Companies
| Footnote† | Includes derivatives |
|
|
| Material Fund Change [Text Block] |
|
There were no material changes to the Fund for the period September 1, 2025 to August 31, 2026. For more complete information, you may review the Fund's most recent prospectus at www.PrincipalAM.com/prospectuses. |
|
| C000176329 |
|
|
|
| Shareholder Report [Line Items] |
|
|
|
| Fund Name |
|
International Equity Index Fund
|
|
| Class Name |
|
R-6
|
|
| Trading Symbol |
|
PFIEX
|
|
| Annual or Semi-Annual Statement [Text Block] |
|
This annual shareholder report contains important information about International Equity Index Fund (the "Fund") for the period of September 1, 2025 to August 31, 2026.
|
|
| Shareholder Report Annual or Semi-Annual |
|
Annual Shareholder Report
|
|
| Additional Information [Text Block] |
|
You can find additional information about the Fund at www.PrincipalAM.com/prospectuses or you can request information by contacting us at 1-800-222-5852 or emailing prospectus@principalfunds.com.
|
|
| Additional Information Phone Number |
|
1-800-222-5852
|
|
| Additional Information Email |
|
<span style="box-sizing: border-box; color: rgb(0, 0, 0); display: inline; flex-wrap: nowrap; font-size: 10.6667px; font-weight: 400; grid-area: auto; line-height: 16px; margin: 0px; overflow: visible; text-align: left; text-align-last: auto; white-space-collapse: preserve-breaks;">prospectus@principalfunds.com</span>
|
|
| Additional Information Website |
|
<span style="box-sizing: border-box; color: rgb(0, 0, 0); display: inline; flex-wrap: nowrap; font-size: 10.6667px; font-weight: 400; grid-area: auto; line-height: 16px; margin: 0px; overflow: visible; text-align: left; text-align-last: auto; white-space-collapse: preserve-breaks;">www.PrincipalAM.com/prospectuses</span>
|
|
| Expenses [Text Block] |
|
What were the Fund costs for the last year? (based on a hypothetical $10,000 investment) Table SummaryClass Name | Costs of a $10,000 investment | Costs paid as a percentage of a $10,000 investment |
|---|
R-6 | $30 | 0.27% |
|---|
|
|
| Expenses Paid, Amount |
|
$ 30
|
|
| Expense Ratio, Percent |
|
0.27%
|
|
| Factors Affecting Performance [Text Block] |
|
Management’s Discussion of Fund PerformanceThe Fund seeks long-term growth of capital. The Fund invests at least 80% of its net assets in securities that compose the MSCI EAFE Index NTR ("Index"). The Index is a market-weighted equity index designed to measure the equity performance of developed markets, excluding the United States and Canada. The advisor employs a passive investment approach designed to attempt to track the performance of the Index. During the 12 months ending August 31, 2026, the Fund's investment performance was in line with the Index. The Fund uses an indexing strategy and does not attempt to manage market volatility, use defensive strategies, or reduce the effect of any long-term periods of negative stock market performance. Ten of the eleven economic sectors in the Index posted positive returns as information technology and energy posted the best returns for the year. The communication services and consumer discretionary sectors were the weakest performers. Advantest, Tokyo Electron Ltd., and ASML Holding contributed to performance. Sea Ltd., EssilorLuxottica SA, and Nintendo detracted from performance for the year. |
|
| Performance Past Does Not Indicate Future [Text] |
|
Past performance is not a good predictor of the Fund's future performance.
|
|
| Line Graph [Table Text Block] |
|
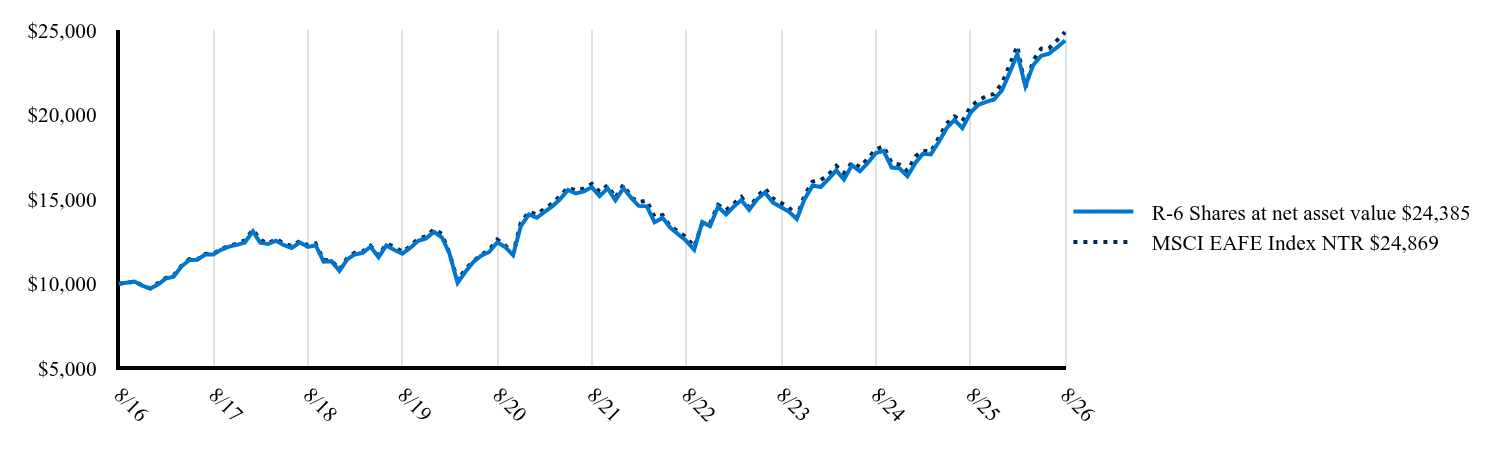 Table Summary | R-6 Shares at net asset value $24,385 | MSCI EAFE Index NTR $24,869 |
|---|
8/16 | 10,000 | 10,000 |
|---|
10/16 | 10,129 | 10,123 |
|---|
11/16 | 9,891 | 9,916 |
|---|
12/16 | 9,717 | 9,718 |
|---|
1/17 | 9,971 | 10,051 |
|---|
2/17 | 10,305 | 10,342 |
|---|
3/17 | 10,416 | 10,490 |
|---|
4/17 | 11,017 | 11,053 |
|---|
5/17 | 11,407 | 11,459 |
|---|
6/17 | 11,418 | 11,439 |
|---|
7/17 | 11,729 | 11,768 |
|---|
8/17 | 11,729 | 11,764 |
|---|
9/17 | 12,008 | 12,057 |
|---|
10/17 | 12,197 | 12,240 |
|---|
11/17 | 12,297 | 12,368 |
|---|
12/17 | 12,440 | 12,567 |
|---|
1/18 | 13,097 | 13,197 |
|---|
2/18 | 12,429 | 12,601 |
|---|
3/18 | 12,348 | 12,374 |
|---|
4/18 | 12,544 | 12,657 |
|---|
5/18 | 12,279 | 12,372 |
|---|
6/18 | 12,118 | 12,221 |
|---|
7/18 | 12,452 | 12,522 |
|---|
8/18 | 12,175 | 12,280 |
|---|
9/18 | 12,279 | 12,387 |
|---|
10/18 | 11,300 | 11,401 |
|---|
11/18 | 11,334 | 11,386 |
|---|
12/18 | 10,764 | 10,834 |
|---|
1/19 | 11,458 | 11,546 |
|---|
2/19 | 11,734 | 11,840 |
|---|
3/19 | 11,830 | 11,915 |
|---|
4/19 | 12,189 | 12,250 |
|---|
5/19 | 11,566 | 11,661 |
|---|
6/19 | 12,261 | 12,353 |
|---|
7/19 | 11,997 | 12,196 |
|---|
8/19 | 11,782 | 11,880 |
|---|
9/19 | 12,117 | 12,221 |
|---|
10/19 | 12,536 | 12,660 |
|---|
11/19 | 12,680 | 12,803 |
|---|
12/19 | 13,068 | 13,219 |
|---|
1/20 | 12,734 | 12,943 |
|---|
2/20 | 11,768 | 11,773 |
|---|
3/20 | 10,048 | 10,201 |
|---|
4/20 | 10,704 | 10,860 |
|---|
5/20 | 11,286 | 11,333 |
|---|
6/20 | 11,657 | 11,719 |
|---|
7/20 | 11,880 | 11,992 |
|---|
8/20 | 12,449 | 12,609 |
|---|
9/20 | 12,177 | 12,281 |
|---|
10/20 | 11,694 | 11,791 |
|---|
11/20 | 13,414 | 13,619 |
|---|
12/20 | 14,094 | 14,252 |
|---|
1/21 | 13,904 | 14,100 |
|---|
2/21 | 14,234 | 14,416 |
|---|
3/21 | 14,576 | 14,748 |
|---|
4/21 | 14,993 | 15,192 |
|---|
5/21 | 15,551 | 15,687 |
|---|
6/21 | 15,335 | 15,510 |
|---|
7/21 | 15,462 | 15,627 |
|---|
8/21 | 15,703 | 15,903 |
|---|
9/21 | 15,183 | 15,441 |
|---|
10/21 | 15,639 | 15,821 |
|---|
11/21 | 14,930 | 15,085 |
|---|
12/21 | 15,654 | 15,857 |
|---|
1/22 | 15,054 | 15,091 |
|---|
2/22 | 14,601 | 14,824 |
|---|
3/22 | 14,575 | 14,919 |
|---|
4/22 | 13,642 | 13,954 |
|---|
5/22 | 13,895 | 14,059 |
|---|
6/22 | 13,309 | 13,390 |
|---|
8/22 | 12,523 | 12,754 |
|---|
9/22 | 12,017 | 12,182 |
|---|
10/22 | 13,655 | 13,555 |
|---|
11/22 | 13,400 | 13,565 |
|---|
12/22 | 14,551 | 14,664 |
|---|
1/23 | 14,099 | 14,358 |
|---|
2/23 | 14,537 | 14,714 |
|---|
3/23 | 14,948 | 15,129 |
|---|
4/23 | 14,359 | 14,489 |
|---|
5/23 | 14,989 | 15,148 |
|---|
6/23 | 15,400 | 15,639 |
|---|
7/23 | 14,797 | 15,039 |
|---|
9/23 | 14,263 | 14,526 |
|---|
10/23 | 13,825 | 13,937 |
|---|
11/23 | 15,003 | 15,230 |
|---|
12/23 | 15,804 | 16,040 |
|---|
1/24 | 15,719 | 16,132 |
|---|
2/24 | 16,174 | 16,427 |
|---|
3/24 | 16,701 | 16,967 |
|---|
4/24 | 16,160 | 16,533 |
|---|
5/24 | 17,014 | 17,173 |
|---|
6/24 | 16,644 | 16,896 |
|---|
7/24 | 17,142 | 17,392 |
|---|
8/24 | 17,725 | 17,957 |
|---|
9/24 | 17,853 | 18,123 |
|---|
10/24 | 16,871 | 17,138 |
|---|
11/24 | 16,829 | 17,040 |
|---|
12/24 | 16,353 | 16,653 |
|---|
1/25 | 17,157 | 17,528 |
|---|
2/25 | 17,678 | 17,868 |
|---|
3/25 | 17,648 | 17,796 |
|---|
4/25 | 18,363 | 18,611 |
|---|
5/25 | 19,197 | 19,462 |
|---|
6/25 | 19,689 | 19,891 |
|---|
7/25 | 19,197 | 19,612 |
|---|
8/25 | 20,106 | 20,448 |
|---|
9/25 | 20,582 | 20,839 |
|---|
10/25 | 20,746 | 21,085 |
|---|
11/25 | 20,895 | 21,216 |
|---|
12/25 | 21,443 | 21,852 |
|---|
1/26 | 22,537 | 22,992 |
|---|
2/26 | 23,584 | 24,056 |
|---|
3/26 | 21,674 | 21,581 |
|---|
4/26 | 22,922 | 23,189 |
|---|
5/26 | 23,477 | 23,900 |
|---|
6/26 | 23,600 | 23,916 |
|---|
7/26 | 23,970 | 24,384 |
|---|
8/26 | 24,385 | 24,869 |
|---|
|
|
| Average Annual Return [Table Text Block] |
|
Table SummaryName | 1-Year | 5-Year | 10-YearFootnote Reference* |
|---|
R-6 Shares | 21.29% | 9.20% | 9.32% |
|---|
MSCI EAFE Index NTR | 21.62% | 9.35% | 9.54% |
|---|
|
|
| Performance Inception Date |
|
Dec. 30, 2009
|
|
| No Deduction of Taxes [Text Block] |
|
The graph above represents historical performance of a hypothetical investment of $10,000 in the Fund over the past ten years (or since inception if shorter). The table and graph above do not reflect the impact of taxes. If they did, performance would be lower.
|
|
| Updated Performance Information Location [Text Block] |
|
Visit www.principalam.com/mutualfundperformance for more recent performance information.
|
|
| AssetsNet |
|
$ 1,183,369,000
|
|
| Holdings Count | Holding |
|
662
|
|
| Advisory Fees Paid, Amount |
|
$ 2,675,000
|
|
| InvestmentCompanyPortfolioTurnover |
|
79.50%
|
|
| Additional Fund Statistics [Text Block] |
|
- Net Assets (amount in thousands)$1,183,369
- Total Number of Portfolio Holdings662
- Portfolio Turnover Rate 79.5%
- Total Advisory Fees Paid (amount in thousands)$2,675
|
|
| Holdings [Text Block] |
|
Table SummaryAsset Weighting | Percent of Net Assets |
|---|
Common Stocks | 97.18% | Investment Companies | 2.80% | Preferred Stocks | 0.22% | Other Assets and LiabilitiesFootnote Reference* | (0.20)% | Total Net Assets | 100.00% | | Footnote | Description | Footnote* | Includes derivatives |
Table SummaryTop Locations | Percent of Net Assets |
|---|
Japan | 23.11% | United Kingdom | 13.33% | Switzerland | 9.65% | Germany | 8.66% | France | 8.54% | Australia | 6.39% | Netherlands | 6.10% | Spain | 3.83% | Sweden | 3.38% | Italy | 3.16% | Hong Kong | 1.93% | Singapore | 1.78% | Denmark | 1.62% | Finland | 1.14% | Israel | 1.13% | Belgium | 1.11% | Ireland | 0.67% | Norway | 0.62% | Austria | 0.37% | Luxembourg | 0.28% | Other LocationsFootnote Reference* | 3.40% | Other Assets and LiabilitiesFootnote Reference† | (0.20)% | Total Net Assets | 100.00% | | Footnote | Description | Footnote* | Includes locations other than the top twenty and/or Investment Companies
| Footnote† | Includes derivatives |
|
|
| Material Fund Change [Text Block] |
|
There were no material changes to the Fund for the period September 1, 2025 to August 31, 2026. For more complete information, you may review the Fund's most recent prospectus at www.PrincipalAM.com/prospectuses. |
|
| C000150254 |
|
|
|
| Shareholder Report [Line Items] |
|
|
|
| Fund Name |
|
International Small Company Fund
|
|
| Class Name |
|
Institutional
|
|
| Trading Symbol |
|
PISMX
|
|
| Annual or Semi-Annual Statement [Text Block] |
|
This annual shareholder report contains important information about International Small Company Fund (the "Fund") for the period of September 1, 2025 to August 31, 2026.
|
|
| Shareholder Report Annual or Semi-Annual |
|
Annual Shareholder Report
|
|
| Additional Information [Text Block] |
|
You can find additional information about the Fund at www.PrincipalAM.com/prospectuses or you can request information by contacting us at 1-800-222-5852 or emailing prospectus@principalfunds.com.
|
|
| Additional Information Phone Number |
|
1-800-222-5852
|
|
| Additional Information Email |
|
<span style="box-sizing: border-box; color: rgb(0, 0, 0); display: inline; flex-wrap: nowrap; font-size: 10.6667px; font-weight: 400; grid-area: auto; line-height: 16px; margin: 0px; overflow: visible; text-align: left; text-align-last: auto; white-space-collapse: preserve-breaks;">prospectus@principalfunds.com</span>
|
|
| Additional Information Website |
|
<span style="box-sizing: border-box; color: rgb(0, 0, 0); display: inline; flex-wrap: nowrap; font-size: 10.6667px; font-weight: 400; grid-area: auto; line-height: 16px; margin: 0px; overflow: visible; text-align: left; text-align-last: auto; white-space-collapse: preserve-breaks;">www.PrincipalAM.com/prospectuses</span>
|
|
| Expenses [Text Block] |
|
What were the Fund costs for the last year? (based on a hypothetical $10,000 investment) Table SummaryClass Name | Costs of a $10,000 investment | Costs paid as a percentage of a $10,000 investment |
|---|
Institutional | $115 | 1.09% |
|---|
|
|
| Expenses Paid, Amount |
|
$ 115
|
|
| Expense Ratio, Percent |
|
1.09%
|
|
| Factors Affecting Performance [Text Block] |
|
Management’s Discussion of Fund PerformanceThe Fund seeks long-term growth of capital. Under normal circumstances, the Fund invests at least 80% of its net assets in equity securities of companies with small market capitalizations. It invests primarily in foreign equity securities. The Fund typically invests in foreign securities of more than 10 countries but has no limitation on the percentage of assets that is invested in each country or denominated in any currency. The Fund’s investments underperformed the MSCI World Ex USA Small Cap Net Index ("Index") for the trailing year. Stock selection amongst the material sector stood out as a key detractor from relative performance led by metals and mining companies. The Fund’s investments in gold companies generally performed well amid rising underlying spot prices but lagged even stronger performing, higher beta, and earlier stage gold companies in the Index. Silver companies within the Index also performed well during the year, which was a relative headwind to the Fund. Stock selection among consumer discretionary companies was a headwind driven primarily by underperformance within sports data and betting technology companies amid investor concerns around the emergence of prediction markets, normalization of U.S. growth, and a broader derating across data providers amid perceived AI-driven substitution risks. Financials stood out as an area of positive relative performance led by insurance and financial services holdings who benefited from strong earnings growth, capital generation, and increasing assets under management. Holdings focused on wealth management performed well amid robust asset and wealth management flows and improving profitability, while insurance holdings delivered record operating results and organic capital generation following successful acquisition integrations. |
|
| Performance Past Does Not Indicate Future [Text] |
|
Past performance is not a good predictor of the Fund's future performance.
|
|
| Line Graph [Table Text Block] |
|
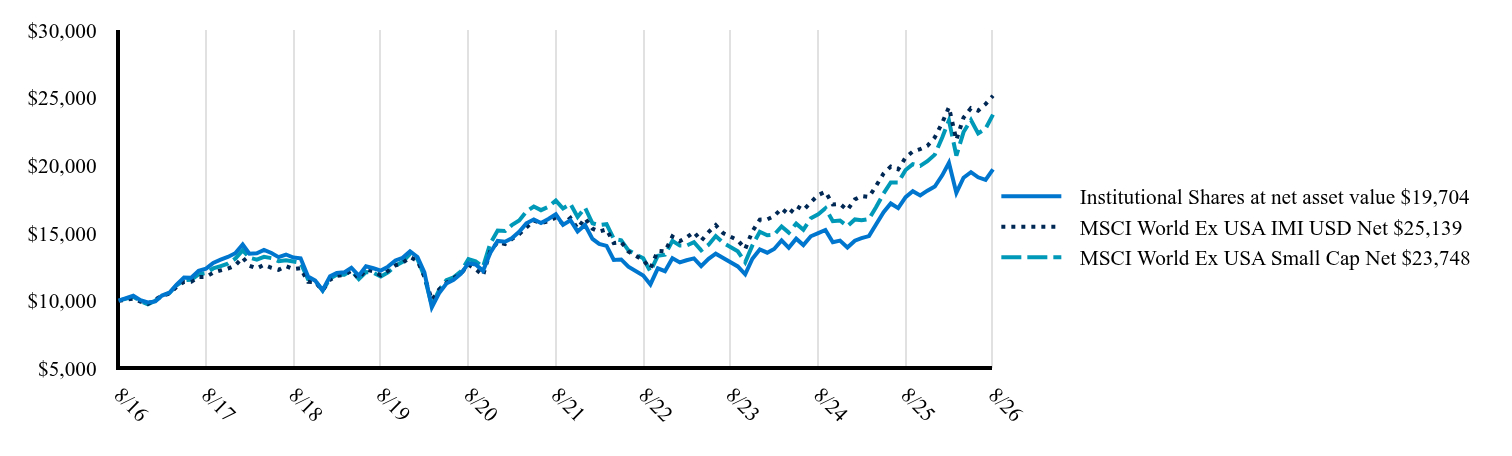 Table Summary | Institutional Shares at net asset value $19,704 | MSCI World Ex USA IMI USD Net $25,139 | MSCI World Ex USA Small Cap Net $23,748 |
|---|
8/16 | 10,000 | 10,000 | 10,000 |
|---|
10/16 | 10,365 | 10,144 | 10,281 |
|---|
11/16 | 10,030 | 9,932 | 9,976 |
|---|
12/16 | 9,868 | 9,761 | 9,729 |
|---|
1/17 | 9,948 | 10,073 | 9,999 |
|---|
2/17 | 10,375 | 10,381 | 10,358 |
|---|
3/17 | 10,588 | 10,512 | 10,558 |
|---|
4/17 | 11,178 | 11,020 | 11,141 |
|---|
5/17 | 11,716 | 11,387 | 11,506 |
|---|
6/17 | 11,696 | 11,401 | 11,543 |
|---|
7/17 | 12,204 | 11,750 | 11,950 |
|---|
8/17 | 12,366 | 11,762 | 12,050 |
|---|
9/17 | 12,793 | 12,069 | 12,381 |
|---|
10/17 | 13,027 | 12,235 | 12,555 |
|---|
11/17 | 13,230 | 12,366 | 12,733 |
|---|
12/17 | 13,506 | 12,608 | 13,102 |
|---|
1/18 | 14,147 | 13,196 | 13,713 |
|---|
2/18 | 13,464 | 12,586 | 13,180 |
|---|
3/18 | 13,506 | 12,380 | 13,036 |
|---|
4/18 | 13,752 | 12,650 | 13,235 |
|---|
5/18 | 13,528 | 12,432 | 13,141 |
|---|
6/18 | 13,218 | 12,284 | 12,914 |
|---|
7/18 | 13,410 | 12,551 | 12,987 |
|---|
8/18 | 13,186 | 12,336 | 12,897 |
|---|
9/18 | 13,133 | 12,404 | 12,804 |
|---|
10/18 | 11,778 | 11,390 | 11,583 |
|---|
11/18 | 11,479 | 11,365 | 11,469 |
|---|
12/18 | 10,773 | 10,757 | 10,734 |
|---|
1/19 | 11,802 | 11,545 | 11,645 |
|---|
2/19 | 12,047 | 11,837 | 11,913 |
|---|
3/19 | 12,094 | 11,888 | 11,907 |
|---|
4/19 | 12,433 | 12,223 | 12,232 |
|---|
5/19 | 11,848 | 11,636 | 11,590 |
|---|
6/19 | 12,538 | 12,304 | 12,117 |
|---|
7/19 | 12,397 | 12,169 | 12,063 |
|---|
8/19 | 12,222 | 11,872 | 11,783 |
|---|
9/19 | 12,514 | 12,201 | 12,084 |
|---|
10/19 | 12,970 | 12,611 | 12,580 |
|---|
11/19 | 13,169 | 12,786 | 12,866 |
|---|
12/19 | 13,648 | 13,221 | 13,461 |
|---|
1/20 | 13,228 | 12,946 | 13,072 |
|---|
2/20 | 12,087 | 11,781 | 11,797 |
|---|
3/20 | 9,503 | 10,048 | 9,640 |
|---|
4/20 | 10,549 | 10,813 | 10,768 |
|---|
5/20 | 11,270 | 11,315 | 11,523 |
|---|
6/20 | 11,534 | 11,676 | 11,728 |
|---|
7/20 | 12,002 | 12,006 | 12,178 |
|---|
8/20 | 12,771 | 12,662 | 13,067 |
|---|
9/20 | 12,675 | 12,335 | 12,916 |
|---|
10/20 | 12,207 | 11,863 | 12,498 |
|---|
11/20 | 13,528 | 13,656 | 14,219 |
|---|
12/20 | 14,411 | 14,321 | 15,182 |
|---|
1/21 | 14,351 | 14,186 | 15,144 |
|---|
2/21 | 14,606 | 14,555 | 15,582 |
|---|
3/21 | 15,092 | 14,918 | 15,922 |
|---|
4/21 | 15,713 | 15,409 | 16,582 |
|---|
5/21 | 16,005 | 15,917 | 16,955 |
|---|
6/21 | 15,737 | 15,741 | 16,688 |
|---|
7/21 | 16,041 | 15,866 | 16,940 |
|---|
8/21 | 16,382 | 16,148 | 17,395 |
|---|
9/21 | 15,603 | 15,671 | 16,808 |
|---|
10/21 | 15,944 | 16,114 | 17,147 |
|---|
11/21 | 15,117 | 15,337 | 16,187 |
|---|
12/21 | 15,595 | 16,096 | 16,873 |
|---|
1/22 | 14,567 | 15,326 | 15,719 |
|---|
2/22 | 14,193 | 15,103 | 15,579 |
|---|
3/22 | 14,046 | 15,263 | 15,653 |
|---|
4/22 | 13,005 | 14,252 | 14,566 |
|---|
5/22 | 13,045 | 14,338 | 14,468 |
|---|
6/22 | 12,511 | 13,630 | 13,723 |
|---|
8/22 | 11,857 | 13,000 | 13,129 |
|---|
9/22 | 11,202 | 12,385 | 12,152 |
|---|
10/22 | 12,391 | 13,686 | 13,320 |
|---|
11/22 | 12,177 | 13,640 | 13,400 |
|---|
12/22 | 13,136 | 14,748 | 14,425 |
|---|
1/23 | 12,825 | 14,401 | 14,071 |
|---|
2/23 | 12,987 | 14,675 | 14,068 |
|---|
3/23 | 13,123 | 15,070 | 14,316 |
|---|
4/23 | 12,555 | 14,417 | 13,722 |
|---|
5/23 | 13,096 | 15,068 | 14,136 |
|---|
6/23 | 13,474 | 15,582 | 14,775 |
|---|
7/23 | 13,150 | 14,990 | 14,280 |
|---|
9/23 | 12,528 | 14,462 | 13,645 |
|---|
10/23 | 11,947 | 13,819 | 12,839 |
|---|
11/23 | 13,096 | 15,123 | 14,084 |
|---|
12/23 | 13,779 | 15,984 | 15,091 |
|---|
1/24 | 13,545 | 16,006 | 14,833 |
|---|
2/24 | 13,821 | 16,249 | 14,876 |
|---|
3/24 | 14,455 | 16,812 | 15,480 |
|---|
4/24 | 13,903 | 16,361 | 15,033 |
|---|
5/24 | 14,579 | 16,999 | 15,692 |
|---|
6/24 | 14,110 | 16,688 | 15,240 |
|---|
7/24 | 14,758 | 17,267 | 16,087 |
|---|
8/24 | 14,992 | 17,808 | 16,388 |
|---|
9/24 | 15,226 | 18,045 | 16,832 |
|---|
10/24 | 14,317 | 17,109 | 15,869 |
|---|
11/24 | 14,441 | 17,153 | 15,925 |
|---|
12/24 | 13,929 | 16,694 | 15,508 |
|---|
1/25 | 14,431 | 17,482 | 16,001 |
|---|
2/25 | 14,617 | 17,738 | 15,937 |
|---|
3/25 | 14,775 | 17,665 | 16,035 |
|---|
4/25 | 15,649 | 18,493 | 16,919 |
|---|
5/25 | 16,537 | 19,394 | 17,916 |
|---|
6/25 | 17,182 | 19,909 | 18,733 |
|---|
7/25 | 16,838 | 19,701 | 18,726 |
|---|
8/25 | 17,655 | 20,584 | 19,655 |
|---|
9/25 | 18,085 | 21,024 | 20,089 |
|---|
10/25 | 17,770 | 21,199 | 19,955 |
|---|
11/25 | 18,128 | 21,440 | 20,301 |
|---|
12/25 | 18,435 | 22,066 | 20,792 |
|---|
1/26 | 19,261 | 23,150 | 22,061 |
|---|
2/26 | 20,191 | 24,292 | 23,323 |
|---|
3/26 | 17,964 | 21,876 | 20,715 |
|---|
4/26 | 19,084 | 23,525 | 22,458 |
|---|
5/26 | 19,497 | 24,224 | 23,344 |
|---|
6/26 | 19,114 | 24,042 | 22,359 |
|---|
7/26 | 18,922 | 24,521 | 22,706 |
|---|
8/26 | 19,704 | 25,139 | 23,748 |
|---|
|
|
| Average Annual Return [Table Text Block] |
|
Table SummaryName | 1-Year | 5-Year | 10-Year |
|---|
Institutional Shares | 11.60% | 3.76% | 7.02% |
|---|
MSCI World Ex USA IMI USD Net | 22.13% | 9.26% | 9.66% |
|---|
MSCI World Ex USA Small Cap Net | 20.82% | 6.42% | 9.03% |
|---|
|
|
| No Deduction of Taxes [Text Block] |
|
The graph above represents historical performance of a hypothetical investment of $10,000 in the Fund over the past ten years (or since inception if shorter). The table and graph above do not reflect the impact of taxes. If they did, performance would be lower.
|
|
| Performance Table Market Index Changed [Text Block] |
|
The MSCI World Ex USA IMI USD Net is the Fund's primary broad-based securities market index. The MSCI World Ex USA Small Cap Net is included as an additional index for the Fund as it shows how the Fund’s performance compares with the returns of an index of funds with similar investment objectives.
|
|
| Updated Performance Information Location [Text Block] |
|
Visit www.principalam.com/mutualfundperformance for more recent performance information.
|
|
| AssetsNet |
|
$ 300,617,000
|
|
| Holdings Count | Holding |
|
108
|
|
| Advisory Fees Paid, Amount |
|
$ 4,275,000
|
|
| InvestmentCompanyPortfolioTurnover |
|
56.50%
|
|
| Additional Fund Statistics [Text Block] |
|
- Net Assets (amount in thousands)$300,617
- Total Number of Portfolio Holdings108
- Portfolio Turnover Rate 56.5%
- Total Advisory Fees Paid (amount in thousands)$4,275
|
|
| Holdings [Text Block] |
|
Table SummaryAsset Weighting | Percent of Net Assets |
|---|
Common Stocks | 98.86% | Investment Companies | 1.84% | Other Assets and Liabilities | (0.70)% | Total Net Assets | 100.00% | Table SummaryTop Locations | Percent of Net Assets |
|---|
Japan | 32.09% | Canada | 13.54% | United Kingdom | 10.28% | Australia | 6.32% | Germany | 6.32% | Netherlands | 4.16% | Italy | 4.13% | France | 3.26% | Denmark | 3.17% | Israel | 2.55% | Sweden | 2.37% | Austria | 1.34% | Portugal | 1.28% | Ireland | 1.24% | Finland | 1.24% | Spain | 1.07% | Macao | 0.93% | Singapore | 0.93% | United States | 0.75% | Switzerland | 0.75% | Other LocationsFootnote Reference* | 2.98% | Other Assets and Liabilities | (0.70)% | Total Net Assets | 100.00% | | Footnote | Description | Footnote* | Includes locations other than the top twenty and/or Investment Companies
|
|
|
| Material Fund Change [Text Block] |
|
There were no material changes to the Fund for the period September 1, 2025 to August 31, 2026. For more complete information, you may review the Fund's most recent prospectus at www.PrincipalAM.com/prospectuses. |
|
| C000176332 |
|
|
|
| Shareholder Report [Line Items] |
|
|
|
| Fund Name |
|
International Small Company Fund
|
|
| Class Name |
|
R-6
|
|
| Trading Symbol |
|
PFISX
|
|
| Annual or Semi-Annual Statement [Text Block] |
|
This annual shareholder report contains important information about International Small Company Fund (the "Fund") for the period of September 1, 2025 to August 31, 2026.
|
|
| Shareholder Report Annual or Semi-Annual |
|
Annual Shareholder Report
|
|
| Additional Information [Text Block] |
|
You can find additional information about the Fund at www.PrincipalAM.com/prospectuses or you can request information by contacting us at 1-800-222-5852 or emailing prospectus@principalfunds.com.
|
|
| Additional Information Phone Number |
|
1-800-222-5852
|
|
| Additional Information Email |
|
<span style="box-sizing: border-box; color: rgb(0, 0, 0); display: inline; flex-wrap: nowrap; font-size: 10.6667px; font-weight: 400; grid-area: auto; line-height: 16px; margin: 0px; overflow: visible; text-align: left; text-align-last: auto; white-space-collapse: preserve-breaks;">prospectus@principalfunds.com</span>
|
|
| Additional Information Website |
|
<span style="box-sizing: border-box; color: rgb(0, 0, 0); display: inline; flex-wrap: nowrap; font-size: 10.6667px; font-weight: 400; grid-area: auto; line-height: 16px; margin: 0px; overflow: visible; text-align: left; text-align-last: auto; white-space-collapse: preserve-breaks;">www.PrincipalAM.com/prospectuses</span>
|
|
| Expenses [Text Block] |
|
What were the Fund costs for the last year? (based on a hypothetical $10,000 investment) Table SummaryClass Name | Costs of a $10,000 investment | Costs paid as a percentage of a $10,000 investment |
|---|
R-6 | $111 | 1.05% |
|---|
|
|
| Expenses Paid, Amount |
|
$ 111
|
|
| Expense Ratio, Percent |
|
1.05%
|
|
| Factors Affecting Performance [Text Block] |
|
Management’s Discussion of Fund PerformanceThe Fund seeks long-term growth of capital. Under normal circumstances, the Fund invests at least 80% of its net assets in equity securities of companies with small market capitalizations. It invests primarily in foreign equity securities. The Fund typically invests in foreign securities of more than 10 countries but has no limitation on the percentage of assets that is invested in each country or denominated in any currency. The Fund’s investments underperformed the MSCI World Ex USA Small Cap Net Index ("Index") for the trailing year. Stock selection amongst the material sector stood out as a key detractor from relative performance led by metals and mining companies. The Fund’s investments in gold companies generally performed well amid rising underlying spot prices but lagged even stronger performing, higher beta, and earlier stage gold companies in the Index. Silver companies within the Index also performed well during the year, which was a relative headwind to the Fund. Stock selection among consumer discretionary companies was a headwind driven primarily by underperformance within sports data and betting technology companies amid investor concerns around the emergence of prediction markets, normalization of U.S. growth, and a broader derating across data providers amid perceived AI-driven substitution risks. Financials stood out as an area of positive relative performance led by insurance and financial services holdings who benefited from strong earnings growth, capital generation, and increasing assets under management. Holdings focused on wealth management performed well amid robust asset and wealth management flows and improving profitability, while insurance holdings delivered record operating results and organic capital generation following successful acquisition integrations. |
|
| Performance Past Does Not Indicate Future [Text] |
|
Past performance is not a good predictor of the Fund's future performance.
|
|
| Line Graph [Table Text Block] |
|
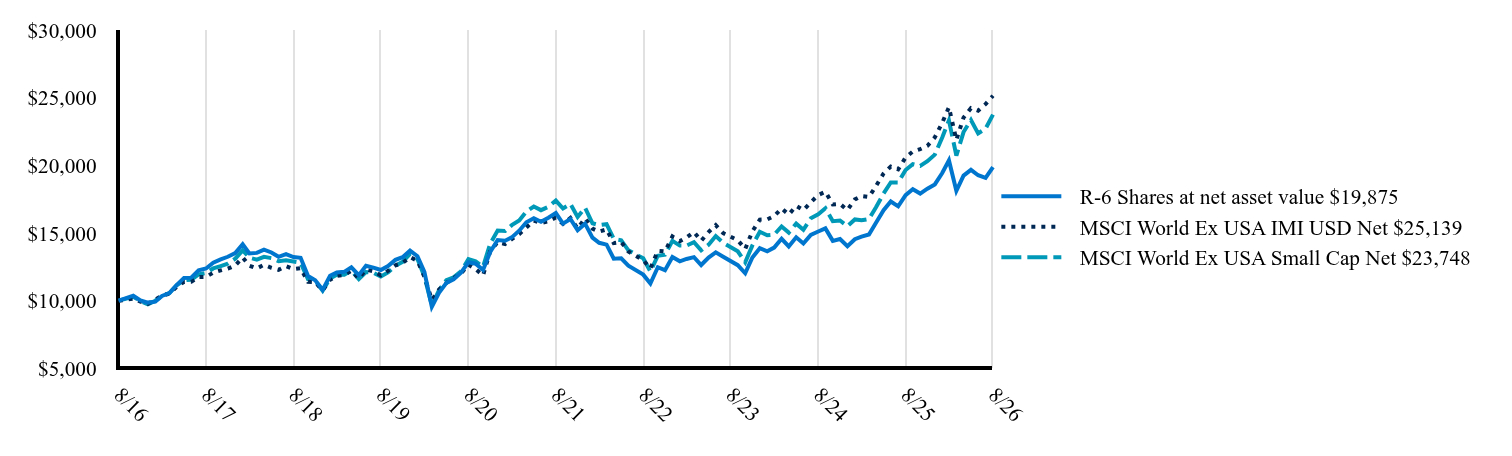 Table Summary | R-6 Shares at net asset value $19,875 | MSCI World Ex USA IMI USD Net $25,139 | MSCI World Ex USA Small Cap Net $23,748 |
|---|
8/16 | 10,000 | 10,000 | 10,000 |
|---|
10/16 | 10,367 | 10,144 | 10,281 |
|---|
11/16 | 10,020 | 9,932 | 9,976 |
|---|
12/16 | 9,857 | 9,761 | 9,729 |
|---|
1/17 | 9,927 | 10,073 | 9,999 |
|---|
2/17 | 10,353 | 10,381 | 10,358 |
|---|
3/17 | 10,566 | 10,512 | 10,558 |
|---|
4/17 | 11,154 | 11,020 | 11,141 |
|---|
5/17 | 11,682 | 11,387 | 11,506 |
|---|
6/17 | 11,702 | 11,401 | 11,543 |
|---|
7/17 | 12,239 | 11,750 | 11,950 |
|---|
8/17 | 12,381 | 11,762 | 12,050 |
|---|
9/17 | 12,807 | 12,069 | 12,381 |
|---|
10/17 | 13,051 | 12,235 | 12,555 |
|---|
11/17 | 13,243 | 12,366 | 12,733 |
|---|
12/17 | 13,520 | 12,608 | 13,102 |
|---|
1/18 | 14,169 | 13,196 | 13,713 |
|---|
2/18 | 13,488 | 12,586 | 13,180 |
|---|
3/18 | 13,531 | 12,380 | 13,036 |
|---|
4/18 | 13,776 | 12,650 | 13,235 |
|---|
5/18 | 13,563 | 12,432 | 13,141 |
|---|
6/18 | 13,243 | 12,284 | 12,914 |
|---|
7/18 | 13,435 | 12,551 | 12,987 |
|---|
8/18 | 13,222 | 12,336 | 12,897 |
|---|
9/18 | 13,169 | 12,404 | 12,804 |
|---|
10/18 | 11,817 | 11,390 | 11,583 |
|---|
11/18 | 11,508 | 11,365 | 11,469 |
|---|
12/18 | 10,800 | 10,757 | 10,734 |
|---|
1/19 | 11,838 | 11,545 | 11,645 |
|---|
2/19 | 12,083 | 11,837 | 11,913 |
|---|
3/19 | 12,129 | 11,888 | 11,907 |
|---|
4/19 | 12,468 | 12,223 | 12,232 |
|---|
5/19 | 11,885 | 11,636 | 11,590 |
|---|
6/19 | 12,573 | 12,304 | 12,117 |
|---|
7/19 | 12,444 | 12,169 | 12,063 |
|---|
8/19 | 12,269 | 11,872 | 11,783 |
|---|
9/19 | 12,561 | 12,201 | 12,084 |
|---|
10/19 | 13,016 | 12,611 | 12,580 |
|---|
11/19 | 13,214 | 12,786 | 12,866 |
|---|
12/19 | 13,695 | 13,221 | 13,461 |
|---|
1/20 | 13,287 | 12,946 | 13,072 |
|---|
2/20 | 12,134 | 11,781 | 11,797 |
|---|
3/20 | 9,542 | 10,048 | 9,640 |
|---|
4/20 | 10,586 | 10,813 | 10,768 |
|---|
5/20 | 11,318 | 11,315 | 11,523 |
|---|
6/20 | 11,582 | 11,676 | 11,728 |
|---|
7/20 | 12,062 | 12,006 | 12,178 |
|---|
8/20 | 12,842 | 12,662 | 13,067 |
|---|
9/20 | 12,734 | 12,335 | 12,916 |
|---|
10/20 | 12,266 | 11,863 | 12,498 |
|---|
11/20 | 13,599 | 13,656 | 14,219 |
|---|
12/20 | 14,479 | 14,321 | 15,182 |
|---|
1/21 | 14,431 | 14,186 | 15,144 |
|---|
2/21 | 14,674 | 14,555 | 15,582 |
|---|
3/21 | 15,172 | 14,918 | 15,922 |
|---|
4/21 | 15,792 | 15,409 | 16,582 |
|---|
5/21 | 16,096 | 15,917 | 16,955 |
|---|
6/21 | 15,829 | 15,741 | 16,688 |
|---|
7/21 | 16,133 | 15,866 | 16,940 |
|---|
8/21 | 16,473 | 16,148 | 17,395 |
|---|
9/21 | 15,695 | 15,671 | 16,808 |
|---|
10/21 | 16,036 | 16,114 | 17,147 |
|---|
11/21 | 15,209 | 15,337 | 16,187 |
|---|
12/21 | 15,690 | 16,096 | 16,873 |
|---|
1/22 | 14,662 | 15,326 | 15,719 |
|---|
2/22 | 14,275 | 15,103 | 15,579 |
|---|
3/22 | 14,141 | 15,263 | 15,653 |
|---|
4/22 | 13,100 | 14,252 | 14,566 |
|---|
5/22 | 13,126 | 14,338 | 14,468 |
|---|
6/22 | 12,592 | 13,630 | 13,723 |
|---|
8/22 | 11,925 | 13,000 | 13,129 |
|---|
9/22 | 11,270 | 12,385 | 12,152 |
|---|
10/22 | 12,472 | 13,686 | 13,320 |
|---|
11/22 | 12,256 | 13,640 | 13,400 |
|---|
12/22 | 13,230 | 14,748 | 14,425 |
|---|
1/23 | 12,906 | 14,401 | 14,071 |
|---|
2/23 | 13,081 | 14,675 | 14,068 |
|---|
3/23 | 13,217 | 15,070 | 14,316 |
|---|
4/23 | 12,635 | 14,417 | 13,722 |
|---|
5/23 | 13,190 | 15,068 | 14,136 |
|---|
6/23 | 13,568 | 15,582 | 14,775 |
|---|
7/23 | 13,244 | 14,990 | 14,280 |
|---|
9/23 | 12,621 | 14,462 | 13,645 |
|---|
10/23 | 12,026 | 13,819 | 12,839 |
|---|
11/23 | 13,190 | 15,123 | 14,084 |
|---|
12/23 | 13,880 | 15,984 | 15,091 |
|---|
1/24 | 13,645 | 16,006 | 14,833 |
|---|
2/24 | 13,921 | 16,249 | 14,876 |
|---|
3/24 | 14,570 | 16,812 | 15,480 |
|---|
4/24 | 14,004 | 16,361 | 15,033 |
|---|
5/24 | 14,680 | 16,999 | 15,692 |
|---|
6/24 | 14,225 | 16,688 | 15,240 |
|---|
7/24 | 14,859 | 17,267 | 16,087 |
|---|
8/24 | 15,108 | 17,808 | 16,388 |
|---|
9/24 | 15,342 | 18,045 | 16,832 |
|---|
10/24 | 14,418 | 17,109 | 15,869 |
|---|
11/24 | 14,556 | 17,153 | 15,925 |
|---|
12/24 | 14,026 | 16,694 | 15,508 |
|---|
1/25 | 14,543 | 17,482 | 16,001 |
|---|
2/25 | 14,729 | 17,738 | 15,937 |
|---|
3/25 | 14,887 | 17,665 | 16,035 |
|---|
4/25 | 15,777 | 18,493 | 16,919 |
|---|
5/25 | 16,682 | 19,394 | 17,916 |
|---|
6/25 | 17,328 | 19,909 | 18,733 |
|---|
7/25 | 16,969 | 19,701 | 18,726 |
|---|
8/25 | 17,802 | 20,584 | 19,655 |
|---|
9/25 | 18,232 | 21,024 | 20,089 |
|---|
10/25 | 17,916 | 21,199 | 19,955 |
|---|
11/25 | 18,275 | 21,440 | 20,301 |
|---|
12/25 | 18,590 | 22,066 | 20,792 |
|---|
1/26 | 19,432 | 23,150 | 22,061 |
|---|
2/26 | 20,363 | 24,292 | 23,323 |
|---|
3/26 | 18,117 | 21,876 | 20,715 |
|---|
4/26 | 19,240 | 23,525 | 22,458 |
|---|
5/26 | 19,668 | 24,224 | 23,344 |
|---|
6/26 | 19,269 | 24,042 | 22,359 |
|---|
7/26 | 19,077 | 24,521 | 22,706 |
|---|
8/26 | 19,875 | 25,139 | 23,748 |
|---|
|
|
| Average Annual Return [Table Text Block] |
|
Table SummaryName | 1-Year | 5-Year | 10-YearFootnote Reference* |
|---|
R-6 Shares | 11.65% | 3.83% | 7.11% |
|---|
MSCI World Ex USA IMI USD Net | 22.13% | 9.26% | 9.66% |
|---|
MSCI World Ex USA Small Cap Net | 20.82% | 6.42% | 9.03% |
|---|
|
|
| Performance Inception Date |
|
Jun. 11, 2014
|
|
| No Deduction of Taxes [Text Block] |
|
The graph above represents historical performance of a hypothetical investment of $10,000 in the Fund over the past ten years (or since inception if shorter). The table and graph above do not reflect the impact of taxes. If they did, performance would be lower.
|
|
| Performance Table Market Index Changed [Text Block] |
|
The MSCI World Ex USA IMI USD Net is the Fund's primary broad-based securities market index. The MSCI World Ex USA Small Cap Net is included as an additional index for the Fund as it shows how the Fund’s performance compares with the returns of an index of funds with similar investment objectives.
|
|
| Updated Performance Information Location [Text Block] |
|
Visit www.principalam.com/mutualfundperformance for more recent performance information.
|
|
| AssetsNet |
|
$ 300,617,000
|
|
| Holdings Count | Holding |
|
108
|
|
| Advisory Fees Paid, Amount |
|
$ 4,275,000
|
|
| InvestmentCompanyPortfolioTurnover |
|
56.50%
|
|
| Additional Fund Statistics [Text Block] |
|
- Net Assets (amount in thousands)$300,617
- Total Number of Portfolio Holdings108
- Portfolio Turnover Rate 56.5%
- Total Advisory Fees Paid (amount in thousands)$4,275
|
|
| Holdings [Text Block] |
|
Table SummaryAsset Weighting | Percent of Net Assets |
|---|
Common Stocks | 98.86% | Investment Companies | 1.84% | Other Assets and Liabilities | (0.70)% | Total Net Assets | 100.00% | Table SummaryTop Locations | Percent of Net Assets |
|---|
Japan | 32.09% | Canada | 13.54% | United Kingdom | 10.28% | Australia | 6.32% | Germany | 6.32% | Netherlands | 4.16% | Italy | 4.13% | France | 3.26% | Denmark | 3.17% | Israel | 2.55% | Sweden | 2.37% | Austria | 1.34% | Portugal | 1.28% | Ireland | 1.24% | Finland | 1.24% | Spain | 1.07% | Macao | 0.93% | Singapore | 0.93% | United States | 0.75% | Switzerland | 0.75% | Other LocationsFootnote Reference* | 2.98% | Other Assets and Liabilities | (0.70)% | Total Net Assets | 100.00% | | Footnote | Description | Footnote* | Includes locations other than the top twenty and/or Investment Companies
|
|
|
| Material Fund Change [Text Block] |
|
There were no material changes to the Fund for the period September 1, 2025 to August 31, 2026. For more complete information, you may review the Fund's most recent prospectus at www.PrincipalAM.com/prospectuses. |
|
| C000115414 |
|
|
|
| Shareholder Report [Line Items] |
|
|
|
| Fund Name |
|
Opportunistic Municipal Fund
|
|
| Class Name |
|
Class A
|
|
| Trading Symbol |
|
PMOAX
|
|
| Annual or Semi-Annual Statement [Text Block] |
|
This annual shareholder report contains important information about Opportunistic Municipal Fund (the "Fund") for the period of September 1, 2025 to August 31, 2026.
|
|
| Shareholder Report Annual or Semi-Annual |
|
Annual Shareholder Report
|
|
| Additional Information [Text Block] |
|
You can find additional information about the Fund at www.PrincipalAM.com/prospectuses or you can request information by contacting us at 1-800-222-5852 or emailing prospectus@principalfunds.com.
|
|
| Additional Information Phone Number |
|
1-800-222-5852
|
|
| Additional Information Email |
|
<span style="box-sizing: border-box; color: rgb(0, 0, 0); display: inline; flex-wrap: nowrap; font-size: 10.6667px; font-weight: 400; grid-area: auto; line-height: 16px; margin: 0px; overflow: visible; text-align: left; text-align-last: auto; white-space-collapse: preserve-breaks;">prospectus@principalfunds.com</span>
|
|
| Additional Information Website |
|
<span style="box-sizing: border-box; color: rgb(0, 0, 0); display: inline; flex-wrap: nowrap; font-size: 10.6667px; font-weight: 400; grid-area: auto; line-height: 16px; margin: 0px; overflow: visible; text-align: left; text-align-last: auto; white-space-collapse: preserve-breaks;">www.PrincipalAM.com/prospectuses</span>
|
|
| Expenses [Text Block] |
|
What were the Fund costs for the last year? (based on a hypothetical $10,000 investment) Table SummaryClass Name | Costs of a $10,000 investment | Costs paid as a percentage of a $10,000 investment |
|---|
Class A | $109 | 1.05% |
|---|
|
|
| Expenses Paid, Amount |
|
$ 109
|
|
| Expense Ratio, Percent |
|
1.05%
|
|
| Factors Affecting Performance [Text Block] |
|
Management’s Discussion of Fund PerformanceThe Fund seeks to provide a high level of income that is exempt from federal income tax while protecting investors' capital. The Fund invests at least 80% of its net assets in municipal obligations, which are securities issued by or on behalf of state or local governments and other public authorities. The Fund also invests in inverse floating rate instruments, which are generally more volatile than other types of municipal obligations and may involve leverage, to enhance investment income. During the year, the municipal market experienced volatility across multiple fronts yet still generated positive returns. As in 2025, the market absorbed record levels of new-issue supply, although the elevated issuance continued to exert pressure on valuations. The municipal yield curve underwent a meaningful transformation during the year, with significant steepening driven by weakness in longer-dated maturities. Geopolitical developments represented one of the most significant influences on market conditions. The conflict involving Iran contributed to heightened inflation concerns and increased risk aversion among investors. In response, the Fund continued to be managed conservatively, maintaining a shorter duration profile to help mitigate interest rate risk. The portfolio's construction effectively combined above-average income generation with favorable convexity characteristics. Total return prospects were further supported by a dynamic credit allocation strategy. Higher-rated holdings were maintained to provide liquidity and portfolio stability, while select speculative positions offered enhanced coupon income and wider credit spreads that contributed to performance and helped reduce overall interest rate sensitivity. Throughout the year, the portfolio successfully navigated interest rate challenges while maintaining a compelling risk-return profile. |
|
| Performance Past Does Not Indicate Future [Text] |
|
Past performance is not a good predictor of the Fund's future performance.
|
|
| Line Graph [Table Text Block] |
|
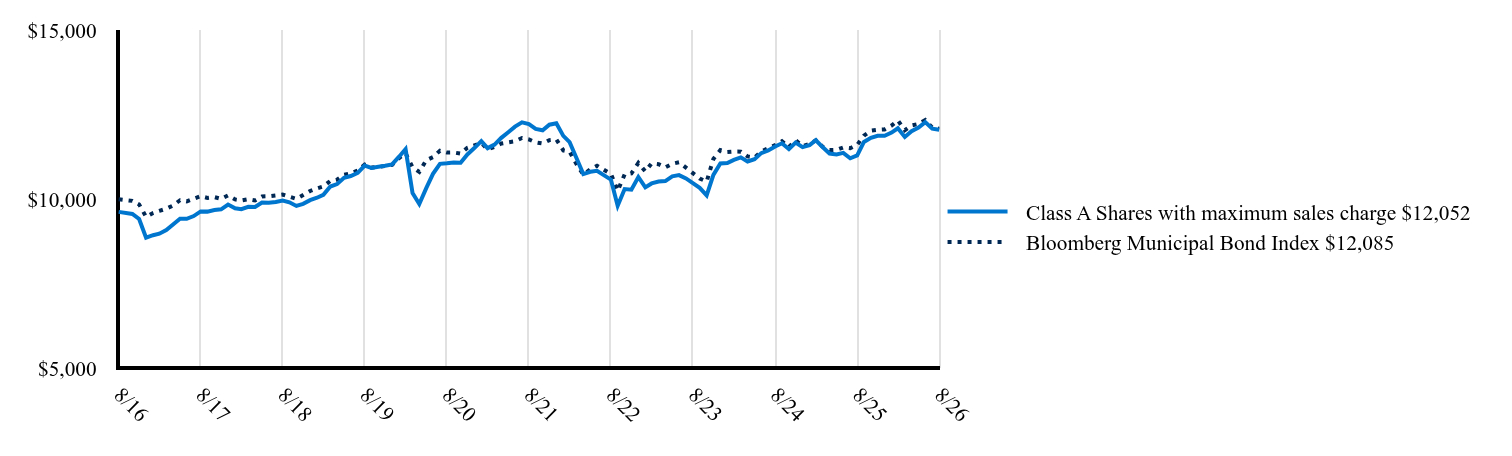 Table Summary | Class A Shares with maximum sales charge $12,052 | Bloomberg Municipal Bond Index $12,085 |
|---|
8/16 | 9,625 | 10,000 |
|---|
10/16 | 9,564 | 9,950 |
|---|
11/16 | 9,414 | 9,846 |
|---|
12/16 | 8,861 | 9,478 |
|---|
1/17 | 8,935 | 9,590 |
|---|
2/17 | 8,980 | 9,653 |
|---|
3/17 | 9,086 | 9,720 |
|---|
4/17 | 9,252 | 9,812 |
|---|
5/17 | 9,424 | 9,968 |
|---|
6/17 | 9,418 | 9,932 |
|---|
7/17 | 9,500 | 10,012 |
|---|
8/17 | 9,637 | 10,088 |
|---|
9/17 | 9,632 | 10,037 |
|---|
10/17 | 9,679 | 10,061 |
|---|
11/17 | 9,699 | 10,008 |
|---|
12/17 | 9,840 | 10,112 |
|---|
1/18 | 9,732 | 9,993 |
|---|
2/18 | 9,705 | 9,963 |
|---|
3/18 | 9,774 | 10,000 |
|---|
4/18 | 9,767 | 9,964 |
|---|
5/18 | 9,900 | 10,079 |
|---|
6/18 | 9,894 | 10,087 |
|---|
7/18 | 9,916 | 10,112 |
|---|
8/18 | 9,962 | 10,138 |
|---|
9/18 | 9,907 | 10,072 |
|---|
10/18 | 9,800 | 10,010 |
|---|
11/18 | 9,863 | 10,121 |
|---|
12/18 | 9,971 | 10,242 |
|---|
1/19 | 10,042 | 10,319 |
|---|
2/19 | 10,129 | 10,375 |
|---|
3/19 | 10,373 | 10,539 |
|---|
4/19 | 10,445 | 10,578 |
|---|
5/19 | 10,634 | 10,724 |
|---|
6/19 | 10,684 | 10,764 |
|---|
7/19 | 10,775 | 10,850 |
|---|
8/19 | 10,994 | 11,022 |
|---|
9/19 | 10,925 | 10,933 |
|---|
10/19 | 10,956 | 10,953 |
|---|
11/19 | 10,986 | 10,980 |
|---|
12/19 | 11,027 | 11,014 |
|---|
1/20 | 11,255 | 11,212 |
|---|
2/20 | 11,479 | 11,356 |
|---|
3/20 | 10,178 | 10,944 |
|---|
4/20 | 9,858 | 10,807 |
|---|
5/20 | 10,328 | 11,151 |
|---|
6/20 | 10,749 | 11,242 |
|---|
7/20 | 11,044 | 11,432 |
|---|
8/20 | 11,062 | 11,378 |
|---|
9/20 | 11,085 | 11,381 |
|---|
10/20 | 11,078 | 11,346 |
|---|
11/20 | 11,322 | 11,518 |
|---|
12/20 | 11,510 | 11,588 |
|---|
1/21 | 11,714 | 11,662 |
|---|
2/21 | 11,508 | 11,476 |
|---|
3/21 | 11,614 | 11,547 |
|---|
4/21 | 11,813 | 11,644 |
|---|
5/21 | 11,979 | 11,679 |
|---|
6/21 | 12,145 | 11,711 |
|---|
7/21 | 12,271 | 11,808 |
|---|
8/21 | 12,217 | 11,765 |
|---|
9/21 | 12,078 | 11,680 |
|---|
10/21 | 12,036 | 11,645 |
|---|
11/21 | 12,201 | 11,745 |
|---|
12/21 | 12,243 | 11,764 |
|---|
1/22 | 11,871 | 11,442 |
|---|
2/22 | 11,685 | 11,401 |
|---|
3/22 | 11,208 | 11,031 |
|---|
4/22 | 10,743 | 10,726 |
|---|
5/22 | 10,811 | 10,885 |
|---|
6/22 | 10,841 | 10,990 |
|---|
8/22 | 10,577 | 10,749 |
|---|
9/22 | 9,806 | 10,250 |
|---|
10/22 | 10,298 | 10,730 |
|---|
11/22 | 10,282 | 10,761 |
|---|
12/22 | 10,656 | 11,070 |
|---|
1/23 | 10,349 | 10,819 |
|---|
2/23 | 10,465 | 11,059 |
|---|
3/23 | 10,521 | 11,034 |
|---|
4/23 | 10,536 | 10,939 |
|---|
5/23 | 10,675 | 11,048 |
|---|
6/23 | 10,711 | 11,092 |
|---|
7/23 | 10,612 | 10,932 |
|---|
9/23 | 10,335 | 10,612 |
|---|
10/23 | 10,114 | 10,521 |
|---|
11/23 | 10,718 | 11,189 |
|---|
12/23 | 11,053 | 11,449 |
|---|
1/24 | 11,068 | 11,391 |
|---|
2/24 | 11,161 | 11,406 |
|---|
3/24 | 11,236 | 11,405 |
|---|
4/24 | 11,114 | 11,264 |
|---|
5/24 | 11,182 | 11,231 |
|---|
6/24 | 11,361 | 11,403 |
|---|
7/24 | 11,440 | 11,507 |
|---|
8/24 | 11,556 | 11,598 |
|---|
9/24 | 11,651 | 11,712 |
|---|
10/24 | 11,480 | 11,542 |
|---|
11/24 | 11,674 | 11,741 |
|---|
12/24 | 11,539 | 11,570 |
|---|
1/25 | 11,596 | 11,628 |
|---|
2/25 | 11,742 | 11,743 |
|---|
3/25 | 11,532 | 11,544 |
|---|
4/25 | 11,348 | 11,451 |
|---|
5/25 | 11,324 | 11,459 |
|---|
6/25 | 11,367 | 11,530 |
|---|
7/25 | 11,208 | 11,507 |
|---|
8/25 | 11,294 | 11,607 |
|---|
9/25 | 11,691 | 11,876 |
|---|
10/25 | 11,812 | 12,023 |
|---|
11/25 | 11,875 | 12,050 |
|---|
12/25 | 11,872 | 12,061 |
|---|
1/26 | 11,967 | 12,174 |
|---|
2/26 | 12,096 | 12,326 |
|---|
3/26 | 11,839 | 12,040 |
|---|
4/26 | 12,009 | 12,178 |
|---|
5/26 | 12,119 | 12,223 |
|---|
6/26 | 12,277 | 12,341 |
|---|
7/26 | 12,085 | 12,113 |
|---|
8/26 | 12,052 | 12,085 |
|---|
|
|
| Average Annual Return [Table Text Block] |
|
Table SummaryName | 1-Year | 5-Year | 10-Year |
|---|
Class A Shares Excluding Sales Charge | 6.71% | -0.27% | 2.27% |
|---|
Class A Shares Including Sales Charge | 2.68% | -1.04% | 1.88% |
|---|
Bloomberg Municipal Bond Index | 4.12% | 0.54% | 1.91% |
|---|
|
|
| No Deduction of Taxes [Text Block] |
|
The graph above represents historical performance of a hypothetical investment of $10,000 in the Fund over the past ten years (or since inception if shorter). The table and graph above do not reflect the impact of taxes. If they did, performance would be lower.
|
|
| Updated Performance Information Location [Text Block] |
|
Visit www.principalam.com/mutualfundperformance for more recent performance information.
|
|
| AssetsNet |
|
$ 183,441,000
|
|
| Holdings Count | Holding |
|
157
|
|
| Advisory Fees Paid, Amount |
|
$ 801,000
|
|
| InvestmentCompanyPortfolioTurnover |
|
45.20%
|
|
| Additional Fund Statistics [Text Block] |
|
- Net Assets (amount in thousands)$183,441
- Total Number of Portfolio Holdings157
- Portfolio Turnover Rate 45.2%
- Total Advisory Fees Paid (amount in thousands)$801
|
|
| Holdings [Text Block] |
|
Table SummaryAsset Weighting | Percent of Net Assets |
|---|
Municipal Bonds | 104.80% | Investment Companies | 0.82% | Common Stocks | 0.01% | Other Assets and LiabilitiesFootnote Reference* | (5.63)% | Total Net Assets | 100.00% | | Footnote | Description | Footnote* | Includes inverse floating rate obligations |
Table SummaryTop States/Territories | Percent of Net Assets |
|---|
New York | 16.12% | Florida | 14.43% | California | 9.58% | Texas | 7.95% | Alabama | 7.79% | Pennsylvania | 5.82% | Georgia | 3.95% | Utah | 3.74% | Illinois | 3.70% | Wisconsin | 3.57% | Ohio | 3.37% | Louisiana | 3.23% | Arkansas | 2.88% | Puerto Rico | 2.43% | Arizona | 1.91% | Nevada | 1.12% | Connecticut | 1.01% | Virginia | 1.00% | Tennessee | 0.97% | Maryland | 0.85% | Other StatesFootnote Reference* | 10.21% | Other Assets and LiabilitiesFootnote Reference† | (5.63)% | Total Net Assets | 100.00% | | Footnote | Description | Footnote* | Includes states other than the top twenty and/or Investment Companies | Footnote† | Includes inverse floating rate obligations |
|
|
| Material Fund Change [Text Block] |
|
There were no material changes to the Fund for the period September 1, 2025 to August 31, 2026. For more complete information, you may review the Fund's most recent prospectus at www.PrincipalAM.com/prospectuses. |
|
| C000153266 |
|
|
|
| Shareholder Report [Line Items] |
|
|
|
| Fund Name |
|
Opportunistic Municipal Fund
|
|
| Class Name |
|
Institutional
|
|
| Trading Symbol |
|
POMFX
|
|
| Annual or Semi-Annual Statement [Text Block] |
|
This annual shareholder report contains important information about Opportunistic Municipal Fund (the "Fund") for the period of September 1, 2025 to August 31, 2026.
|
|
| Shareholder Report Annual or Semi-Annual |
|
Annual Shareholder Report
|
|
| Additional Information [Text Block] |
|
You can find additional information about the Fund at www.PrincipalAM.com/prospectuses or you can request information by contacting us at 1-800-222-5852 or emailing prospectus@principalfunds.com.
|
|
| Additional Information Phone Number |
|
1-800-222-5852
|
|
| Additional Information Email |
|
<span style="box-sizing: border-box; color: rgb(0, 0, 0); display: inline; flex-wrap: nowrap; font-size: 10.6667px; font-weight: 400; grid-area: auto; line-height: 16px; margin: 0px; overflow: visible; text-align: left; text-align-last: auto; white-space-collapse: preserve-breaks;">prospectus@principalfunds.com</span>
|
|
| Additional Information Website |
|
<span style="box-sizing: border-box; color: rgb(0, 0, 0); display: inline; flex-wrap: nowrap; font-size: 10.6667px; font-weight: 400; grid-area: auto; line-height: 16px; margin: 0px; overflow: visible; text-align: left; text-align-last: auto; white-space-collapse: preserve-breaks;">www.PrincipalAM.com/prospectuses</span>
|
|
| Expenses [Text Block] |
|
What were the Fund costs for the last year? (based on a hypothetical $10,000 investment) Table SummaryClass Name | Costs of a $10,000 investment | Costs paid as a percentage of a $10,000 investment |
|---|
Institutional | $80 | 0.77% |
|---|
|
|
| Expenses Paid, Amount |
|
$ 80
|
|
| Expense Ratio, Percent |
|
0.77%
|
|
| Factors Affecting Performance [Text Block] |
|
Management’s Discussion of Fund PerformanceThe Fund seeks to provide a high level of income that is exempt from federal income tax while protecting investors' capital. The Fund invests at least 80% of its net assets in municipal obligations, which are securities issued by or on behalf of state or local governments and other public authorities. The Fund also invests in inverse floating rate instruments, which are generally more volatile than other types of municipal obligations and may involve leverage, to enhance investment income. During the year, the municipal market experienced volatility across multiple fronts yet still generated positive returns. As in 2025, the market absorbed record levels of new-issue supply, although the elevated issuance continued to exert pressure on valuations. The municipal yield curve underwent a meaningful transformation during the year, with significant steepening driven by weakness in longer-dated maturities. Geopolitical developments represented one of the most significant influences on market conditions. The conflict involving Iran contributed to heightened inflation concerns and increased risk aversion among investors. In response, the Fund continued to be managed conservatively, maintaining a shorter duration profile to help mitigate interest rate risk. The portfolio's construction effectively combined above-average income generation with favorable convexity characteristics. Total return prospects were further supported by a dynamic credit allocation strategy. Higher-rated holdings were maintained to provide liquidity and portfolio stability, while select speculative positions offered enhanced coupon income and wider credit spreads that contributed to performance and helped reduce overall interest rate sensitivity. Throughout the year, the portfolio successfully navigated interest rate challenges while maintaining a compelling risk-return profile. |
|
| Performance Past Does Not Indicate Future [Text] |
|
Past performance is not a good predictor of the Fund's future performance.
|
|
| Line Graph [Table Text Block] |
|
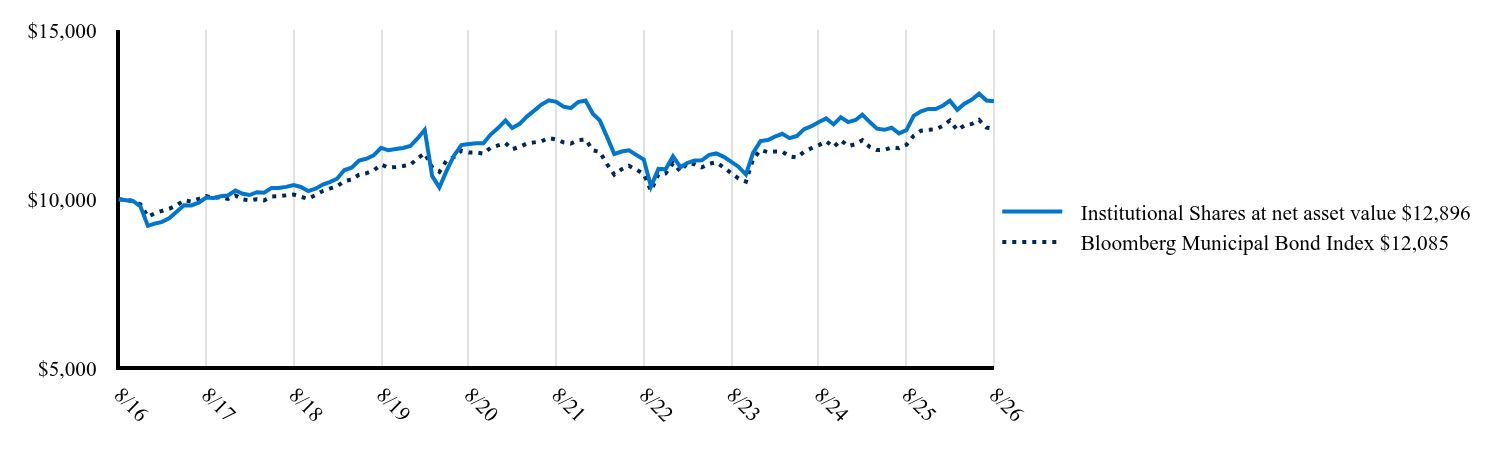 Table Summary | Institutional Shares at net asset value $12,896 | Bloomberg Municipal Bond Index $12,085 |
|---|
8/16 | 10,000 | 10,000 |
|---|
10/16 | 9,939 | 9,950 |
|---|
11/16 | 9,785 | 9,846 |
|---|
12/16 | 9,211 | 9,478 |
|---|
1/17 | 9,282 | 9,590 |
|---|
2/17 | 9,330 | 9,653 |
|---|
3/17 | 9,443 | 9,720 |
|---|
4/17 | 9,629 | 9,812 |
|---|
5/17 | 9,820 | 9,968 |
|---|
6/17 | 9,816 | 9,932 |
|---|
7/17 | 9,894 | 10,012 |
|---|
8/17 | 10,048 | 10,088 |
|---|
9/17 | 10,035 | 10,037 |
|---|
10/17 | 10,086 | 10,061 |
|---|
11/17 | 10,109 | 10,008 |
|---|
12/17 | 10,258 | 10,112 |
|---|
1/18 | 10,158 | 9,993 |
|---|
2/18 | 10,122 | 9,963 |
|---|
3/18 | 10,206 | 10,000 |
|---|
4/18 | 10,191 | 9,964 |
|---|
5/18 | 10,333 | 10,079 |
|---|
6/18 | 10,329 | 10,087 |
|---|
7/18 | 10,364 | 10,112 |
|---|
8/18 | 10,416 | 10,138 |
|---|
9/18 | 10,360 | 10,072 |
|---|
10/18 | 10,240 | 10,010 |
|---|
11/18 | 10,309 | 10,121 |
|---|
12/18 | 10,434 | 10,242 |
|---|
1/19 | 10,510 | 10,319 |
|---|
2/19 | 10,604 | 10,375 |
|---|
3/19 | 10,862 | 10,539 |
|---|
4/19 | 10,929 | 10,578 |
|---|
5/19 | 11,141 | 10,724 |
|---|
6/19 | 11,195 | 10,764 |
|---|
7/19 | 11,293 | 10,850 |
|---|
8/19 | 11,515 | 11,022 |
|---|
9/19 | 11,445 | 10,933 |
|---|
10/19 | 11,480 | 10,953 |
|---|
11/19 | 11,514 | 10,980 |
|---|
12/19 | 11,570 | 11,014 |
|---|
1/20 | 11,802 | 11,212 |
|---|
2/20 | 12,050 | 11,356 |
|---|
3/20 | 10,687 | 10,944 |
|---|
4/20 | 10,344 | 10,807 |
|---|
5/20 | 10,851 | 11,151 |
|---|
6/20 | 11,285 | 11,242 |
|---|
7/20 | 11,597 | 11,432 |
|---|
8/20 | 11,629 | 11,378 |
|---|
9/20 | 11,655 | 11,381 |
|---|
10/20 | 11,651 | 11,346 |
|---|
11/20 | 11,910 | 11,518 |
|---|
12/20 | 12,100 | 11,588 |
|---|
1/21 | 12,328 | 11,662 |
|---|
2/21 | 12,103 | 11,476 |
|---|
3/21 | 12,228 | 11,547 |
|---|
4/21 | 12,441 | 11,644 |
|---|
5/21 | 12,618 | 11,679 |
|---|
6/21 | 12,796 | 11,711 |
|---|
7/21 | 12,921 | 11,808 |
|---|
8/21 | 12,877 | 11,765 |
|---|
9/21 | 12,735 | 11,680 |
|---|
10/21 | 12,693 | 11,645 |
|---|
11/21 | 12,870 | 11,745 |
|---|
12/21 | 12,917 | 11,764 |
|---|
1/22 | 12,516 | 11,442 |
|---|
2/22 | 12,335 | 11,401 |
|---|
3/22 | 11,834 | 11,031 |
|---|
4/22 | 11,335 | 10,726 |
|---|
5/22 | 11,409 | 10,885 |
|---|
6/22 | 11,446 | 10,990 |
|---|
8/22 | 11,171 | 10,749 |
|---|
9/22 | 10,373 | 10,250 |
|---|
10/22 | 10,895 | 10,730 |
|---|
11/22 | 10,881 | 10,761 |
|---|
12/22 | 11,267 | 11,070 |
|---|
1/23 | 10,944 | 10,819 |
|---|
2/23 | 11,070 | 11,059 |
|---|
3/23 | 11,143 | 11,034 |
|---|
4/23 | 11,150 | 10,939 |
|---|
5/23 | 11,312 | 11,048 |
|---|
6/23 | 11,352 | 11,092 |
|---|
7/23 | 11,251 | 10,932 |
|---|
9/23 | 10,960 | 10,612 |
|---|
10/23 | 10,728 | 10,521 |
|---|
11/23 | 11,370 | 11,189 |
|---|
12/23 | 11,717 | 11,449 |
|---|
1/24 | 11,747 | 11,391 |
|---|
2/24 | 11,848 | 11,406 |
|---|
3/24 | 11,931 | 11,405 |
|---|
4/24 | 11,804 | 11,264 |
|---|
5/24 | 11,867 | 11,231 |
|---|
6/24 | 12,071 | 11,403 |
|---|
7/24 | 12,158 | 11,507 |
|---|
8/24 | 12,284 | 11,598 |
|---|
9/24 | 12,388 | 11,712 |
|---|
10/24 | 12,209 | 11,542 |
|---|
11/24 | 12,419 | 11,741 |
|---|
12/24 | 12,277 | 11,570 |
|---|
1/25 | 12,341 | 11,628 |
|---|
2/25 | 12,499 | 11,743 |
|---|
3/25 | 12,278 | 11,544 |
|---|
4/25 | 12,085 | 11,451 |
|---|
5/25 | 12,050 | 11,459 |
|---|
6/25 | 12,112 | 11,530 |
|---|
7/25 | 11,945 | 11,507 |
|---|
8/25 | 12,039 | 11,607 |
|---|
9/25 | 12,464 | 11,876 |
|---|
10/25 | 12,596 | 12,023 |
|---|
11/25 | 12,667 | 12,050 |
|---|
12/25 | 12,666 | 12,061 |
|---|
1/26 | 12,770 | 12,174 |
|---|
2/26 | 12,910 | 12,326 |
|---|
3/26 | 12,640 | 12,040 |
|---|
4/26 | 12,824 | 12,178 |
|---|
5/26 | 12,944 | 12,223 |
|---|
6/26 | 13,116 | 12,341 |
|---|
7/26 | 12,914 | 12,113 |
|---|
8/26 | 12,896 | 12,085 |
|---|
|
|
| Average Annual Return [Table Text Block] |
|
Table SummaryName | 1-Year | 5-Year | 10-Year |
|---|
Institutional Shares | 7.11% | 0.03% | 2.58% |
|---|
Bloomberg Municipal Bond Index | 4.12% | 0.54% | 1.91% |
|---|
|
|
| No Deduction of Taxes [Text Block] |
|
The graph above represents historical performance of a hypothetical investment of $10,000 in the Fund over the past ten years (or since inception if shorter). The table and graph above do not reflect the impact of taxes. If they did, performance would be lower.
|
|
| Updated Performance Information Location [Text Block] |
|
Visit www.principalam.com/mutualfundperformance for more recent performance information.
|
|
| AssetsNet |
|
$ 183,441,000
|
|
| Holdings Count | Holding |
|
157
|
|
| Advisory Fees Paid, Amount |
|
$ 801,000
|
|
| InvestmentCompanyPortfolioTurnover |
|
45.20%
|
|
| Additional Fund Statistics [Text Block] |
|
- Net Assets (amount in thousands)$183,441
- Total Number of Portfolio Holdings157
- Portfolio Turnover Rate 45.2%
- Total Advisory Fees Paid (amount in thousands)$801
|
|
| Holdings [Text Block] |
|
Table SummaryAsset Weighting | Percent of Net Assets |
|---|
Municipal Bonds | 104.80% | Investment Companies | 0.82% | Common Stocks | 0.01% | Other Assets and LiabilitiesFootnote Reference* | (5.63)% | Total Net Assets | 100.00% | | Footnote | Description | Footnote* | Includes inverse floating rate obligations |
Table SummaryTop States/Territories | Percent of Net Assets |
|---|
New York | 16.12% | Florida | 14.43% | California | 9.58% | Texas | 7.95% | Alabama | 7.79% | Pennsylvania | 5.82% | Georgia | 3.95% | Utah | 3.74% | Illinois | 3.70% | Wisconsin | 3.57% | Ohio | 3.37% | Louisiana | 3.23% | Arkansas | 2.88% | Puerto Rico | 2.43% | Arizona | 1.91% | Nevada | 1.12% | Connecticut | 1.01% | Virginia | 1.00% | Tennessee | 0.97% | Maryland | 0.85% | Other StatesFootnote Reference* | 10.21% | Other Assets and LiabilitiesFootnote Reference† | (5.63)% | Total Net Assets | 100.00% | | Footnote | Description | Footnote* | Includes states other than the top twenty and/or Investment Companies | Footnote† | Includes inverse floating rate obligations |
|
|
| Material Fund Change [Text Block] |
|
There were no material changes to the Fund for the period September 1, 2025 to August 31, 2026. For more complete information, you may review the Fund's most recent prospectus at www.PrincipalAM.com/prospectuses. |
|
| C000101659 |
|
|
|
| Shareholder Report [Line Items] |
|
|
|
| Fund Name |
|
Small-MidCap Dividend Income Fund
|
|
| Class Name |
|
Class A
|
|
| Trading Symbol |
|
PMDAX
|
|
| Annual or Semi-Annual Statement [Text Block] |
|
This annual shareholder report contains important information about Small-MidCap Dividend Income Fund (the "Fund") for the period of September 1, 2025 to August 31, 2026.
|
|
| Shareholder Report Annual or Semi-Annual |
|
Annual Shareholder Report
|
|
| Additional Information [Text Block] |
|
You can find additional information about the Fund at www.PrincipalAM.com/prospectuses or you can request information by contacting us at 1-800-222-5852 or emailing prospectus@principalfunds.com.
|
|
| Additional Information Phone Number |
|
1-800-222-5852
|
|
| Additional Information Email |
|
<span style="box-sizing: border-box; color: rgb(0, 0, 0); display: inline; flex-wrap: nowrap; font-size: 10.6667px; font-weight: 400; grid-area: auto; line-height: 16px; margin: 0px; overflow: visible; text-align: left; text-align-last: auto; white-space-collapse: preserve-breaks;">prospectus@principalfunds.com</span>
|
|
| Additional Information Website |
|
<span style="box-sizing: border-box; color: rgb(0, 0, 0); display: inline; flex-wrap: nowrap; font-size: 10.6667px; font-weight: 400; grid-area: auto; line-height: 16px; margin: 0px; overflow: visible; text-align: left; text-align-last: auto; white-space-collapse: preserve-breaks;">www.PrincipalAM.com/prospectuses</span>
|
|
| Expenses [Text Block] |
|
What were the Fund costs for the last year? (based on a hypothetical $10,000 investment) Table SummaryClass Name | Costs of a $10,000 investment | Costs paid as a percentage of a $10,000 investment |
|---|
Class A | $121 | 1.12% |
|---|
|
|
| Expenses Paid, Amount |
|
$ 121
|
|
| Expense Ratio, Percent |
|
1.12%
|
|
| Factors Affecting Performance [Text Block] |
|
Management’s Discussion of Fund PerformanceThe Fund seeks to provide current income and long-term growth of income and capital. The Fund invests at least 80% of its net assets in dividend-paying equity securities of companies with small-to-medium market capitalizations. Its investments include the securities of foreign issuers and real estate investment trusts. MKS, Inc. (MKSI) contributed to relative performance as investors continue to be encouraged by signs that its cyclically weaker markets are rebounding and demand for semiconductor capital equipment subsystems and advanced packaging chemistries are rising due to artificial intelligence and data center growth. Western Digital Corp. (WDC) develops, manufactures, and sells data storage devices and solutions and is one of only two major pure-play hard disk drive (HDD) manufacturers. As inferencing and storage demand continued to ramp, memory and storage-related names posted a strong year, including WDC. Amkor Technology, Inc. (AMKR) is the second largest outsourced semiconductor assembly and test supplier (OSAT) focused on advanced packaging solutions. AMKR outperformed following earnings that beat expectations and guidance that was raised. Not owning SanDisk Corp. (SNDK) detracted from performance as shares rallied meaningfully along with other memory-related names. Hamilton Lane Inc. (HLNE) lagged during the year as investors became concerned about private debt and private equity exposure to businesses that may be disrupted by AI. Not owning Ciena Corp. (CIEN) detracted from performance. |
|
| Performance Past Does Not Indicate Future [Text] |
|
Past performance is not a good predictor of the Fund's future performance.
|
|
| Line Graph [Table Text Block] |
|
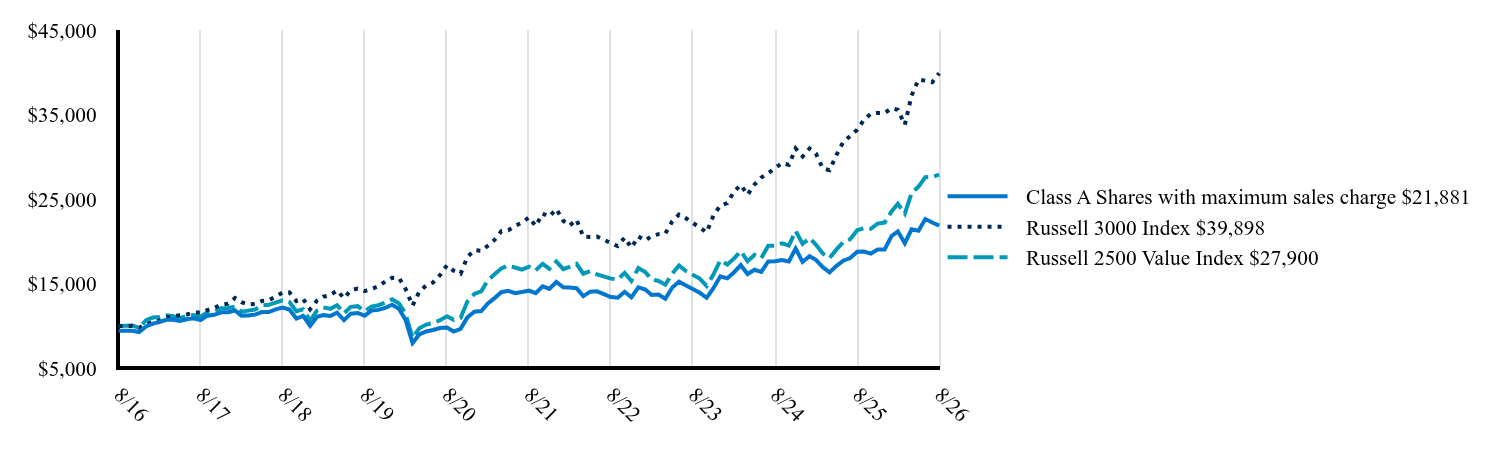 Table Summary | Class A Shares with maximum sales charge $21,881 | Russell 3000 Index $39,898 | Russell 2500 Value Index $27,900 |
|---|
8/16 | 9,450 | 10,000 | 10,000 |
|---|
10/16 | 9,431 | 10,016 | 10,066 |
|---|
11/16 | 9,291 | 9,799 | 9,764 |
|---|
12/16 | 9,957 | 10,238 | 10,701 |
|---|
1/17 | 10,295 | 10,437 | 11,006 |
|---|
2/17 | 10,476 | 10,634 | 11,066 |
|---|
3/17 | 10,733 | 11,029 | 11,272 |
|---|
4/17 | 10,734 | 11,154 | 11,173 |
|---|
5/17 | 10,592 | 11,268 | 10,930 |
|---|
6/17 | 10,798 | 11,370 | 11,221 |
|---|
7/17 | 10,914 | 11,584 | 11,308 |
|---|
8/17 | 10,695 | 11,606 | 11,112 |
|---|
9/17 | 11,226 | 11,889 | 11,651 |
|---|
10/17 | 11,323 | 12,149 | 11,714 |
|---|
11/17 | 11,621 | 12,518 | 12,098 |
|---|
12/17 | 11,628 | 12,643 | 12,146 |
|---|
1/18 | 11,845 | 13,309 | 12,299 |
|---|
2/18 | 11,234 | 12,819 | 11,695 |
|---|
3/18 | 11,260 | 12,561 | 11,824 |
|---|
4/18 | 11,349 | 12,609 | 11,952 |
|---|
5/18 | 11,669 | 12,965 | 12,444 |
|---|
6/18 | 11,651 | 13,050 | 12,510 |
|---|
7/18 | 11,979 | 13,483 | 12,758 |
|---|
8/18 | 12,184 | 13,956 | 13,048 |
|---|
9/18 | 11,948 | 13,979 | 12,844 |
|---|
10/18 | 10,886 | 12,950 | 11,746 |
|---|
11/18 | 11,194 | 13,209 | 11,968 |
|---|
12/18 | 10,014 | 11,980 | 10,645 |
|---|
1/19 | 11,098 | 13,008 | 11,835 |
|---|
2/19 | 11,289 | 13,466 | 12,204 |
|---|
3/19 | 11,182 | 13,662 | 12,041 |
|---|
4/19 | 11,575 | 14,208 | 12,464 |
|---|
5/19 | 10,702 | 13,289 | 11,524 |
|---|
6/19 | 11,463 | 14,222 | 12,269 |
|---|
7/19 | 11,552 | 14,433 | 12,349 |
|---|
8/19 | 11,230 | 14,139 | 11,748 |
|---|
9/19 | 11,830 | 14,387 | 12,285 |
|---|
10/19 | 11,911 | 14,697 | 12,462 |
|---|
11/19 | 12,137 | 15,256 | 12,768 |
|---|
12/19 | 12,518 | 15,696 | 13,153 |
|---|
1/20 | 12,027 | 15,679 | 12,674 |
|---|
2/20 | 10,725 | 14,395 | 11,452 |
|---|
3/20 | 8,001 | 12,416 | 8,597 |
|---|
4/20 | 9,007 | 14,060 | 9,734 |
|---|
5/20 | 9,361 | 14,812 | 10,178 |
|---|
6/20 | 9,540 | 15,151 | 10,368 |
|---|
7/20 | 9,763 | 16,011 | 10,679 |
|---|
8/20 | 9,820 | 17,171 | 11,165 |
|---|
9/20 | 9,351 | 16,546 | 10,735 |
|---|
10/20 | 9,674 | 16,189 | 10,977 |
|---|
11/20 | 11,023 | 18,158 | 12,898 |
|---|
12/20 | 11,696 | 18,975 | 13,795 |
|---|
1/21 | 11,771 | 18,890 | 14,100 |
|---|
2/21 | 12,635 | 19,481 | 15,354 |
|---|
3/21 | 13,302 | 20,179 | 16,117 |
|---|
4/21 | 14,002 | 21,219 | 16,808 |
|---|
5/21 | 14,161 | 21,316 | 17,150 |
|---|
6/21 | 13,891 | 21,842 | 16,923 |
|---|
7/21 | 14,033 | 22,211 | 16,675 |
|---|
8/21 | 14,183 | 22,845 | 17,027 |
|---|
9/21 | 13,881 | 21,820 | 16,573 |
|---|
10/21 | 14,699 | 23,295 | 17,360 |
|---|
11/21 | 14,399 | 22,941 | 16,756 |
|---|
12/21 | 15,209 | 23,844 | 17,627 |
|---|
1/22 | 14,573 | 22,441 | 16,731 |
|---|
2/22 | 14,547 | 21,876 | 17,004 |
|---|
3/22 | 14,478 | 22,585 | 17,363 |
|---|
4/22 | 13,538 | 20,558 | 16,186 |
|---|
5/22 | 14,067 | 20,531 | 16,496 |
|---|
6/22 | 14,104 | 20,578 | 16,112 |
|---|
8/22 | 13,430 | 19,810 | 15,607 |
|---|
9/22 | 13,348 | 19,447 | 15,510 |
|---|
10/22 | 14,050 | 20,462 | 16,289 |
|---|
11/22 | 13,395 | 19,264 | 15,321 |
|---|
12/22 | 14,573 | 20,591 | 16,852 |
|---|
1/23 | 14,324 | 20,110 | 16,375 |
|---|
2/23 | 13,678 | 20,647 | 15,535 |
|---|
3/23 | 13,732 | 20,867 | 15,328 |
|---|
4/23 | 13,221 | 20,949 | 14,890 |
|---|
5/23 | 14,563 | 22,379 | 16,214 |
|---|
6/23 | 15,237 | 23,181 | 17,164 |
|---|
7/23 | 14,788 | 22,734 | 16,503 |
|---|
9/23 | 13,935 | 21,651 | 15,620 |
|---|
10/23 | 13,340 | 21,077 | 14,744 |
|---|
11/23 | 14,476 | 23,042 | 16,082 |
|---|
12/23 | 15,878 | 24,265 | 17,769 |
|---|
1/24 | 15,641 | 24,534 | 17,271 |
|---|
2/24 | 16,335 | 25,862 | 17,963 |
|---|
3/24 | 17,195 | 26,696 | 18,848 |
|---|
4/24 | 16,150 | 25,521 | 17,663 |
|---|
5/24 | 16,654 | 26,727 | 18,407 |
|---|
6/24 | 16,410 | 27,554 | 18,037 |
|---|
7/24 | 17,633 | 28,066 | 19,497 |
|---|
8/24 | 17,651 | 28,677 | 19,496 |
|---|
9/24 | 17,809 | 29,271 | 19,773 |
|---|
10/24 | 17,634 | 29,056 | 19,524 |
|---|
11/24 | 19,165 | 30,989 | 21,246 |
|---|
12/24 | 17,586 | 30,041 | 19,721 |
|---|
1/25 | 18,253 | 30,990 | 20,392 |
|---|
2/25 | 17,824 | 30,396 | 19,638 |
|---|
3/25 | 16,960 | 28,623 | 18,571 |
|---|
4/25 | 16,338 | 28,431 | 18,033 |
|---|
5/25 | 17,112 | 30,233 | 19,063 |
|---|
6/25 | 17,719 | 31,769 | 19,925 |
|---|
7/25 | 18,036 | 32,469 | 20,271 |
|---|
8/25 | 18,784 | 33,220 | 21,334 |
|---|
9/25 | 18,812 | 34,366 | 21,553 |
|---|
10/25 | 18,571 | 35,103 | 21,497 |
|---|
11/25 | 19,052 | 35,199 | 22,116 |
|---|
12/25 | 19,058 | 35,192 | 22,232 |
|---|
1/26 | 20,647 | 35,738 | 23,547 |
|---|
2/26 | 21,196 | 35,568 | 24,457 |
|---|
3/26 | 19,795 | 33,800 | 23,293 |
|---|
4/26 | 21,429 | 37,248 | 25,707 |
|---|
5/26 | 21,271 | 39,135 | 26,490 |
|---|
6/26 | 22,650 | 39,015 | 27,603 |
|---|
7/26 | 22,246 | 38,833 | 27,623 |
|---|
8/26 | 21,881 | 39,898 | 27,900 |
|---|
|
|
| Average Annual Return [Table Text Block] |
|
Table SummaryName | 1-Year | 5-Year | 10-Year |
|---|
Class A Shares Excluding Sales Charge | 16.48% | 9.06% | 8.76% |
|---|
Class A Shares Including Sales Charge | 10.08% | 7.83% | 8.14% |
|---|
Russell 3000 Index | 20.10% | 11.80% | 14.84% |
|---|
Russell 2500 Value Index | 30.78% | 10.38% | 10.81% |
|---|
|
|
| No Deduction of Taxes [Text Block] |
|
The graph above represents historical performance of a hypothetical investment of $10,000 in the Fund over the past ten years (or since inception if shorter). The table and graph above do not reflect the impact of taxes. If they did, performance would be lower.
|
|
| Performance Table Market Index Changed [Text Block] |
|
The Russell 3000 Index is the Fund's primary broad-based securities market index. The Russell 2500 Value Index is included as an additional index for the Fund as it shows how the Fund’s performance compares with the returns of an index of funds with similar investment objectives.
|
|
| Updated Performance Information Location [Text Block] |
|
Visit www.principalam.com/mutualfundperformance for more recent performance information.
|
|
| AssetsNet |
|
$ 1,097,151,000
|
|
| Holdings Count | Holding |
|
80
|
|
| Advisory Fees Paid, Amount |
|
$ 12,122,000
|
|
| InvestmentCompanyPortfolioTurnover |
|
24.00%
|
|
| Additional Fund Statistics [Text Block] |
|
- Net Assets (amount in thousands)$1,097,151
- Total Number of Portfolio Holdings80
- Portfolio Turnover Rate 24.0%
- Total Advisory Fees Paid (amount in thousands)$12,122
|
|
| Holdings [Text Block] |
|
Table SummaryAsset Weighting | Percent of Net Assets |
|---|
Common Stocks | 99.57% | Investment Companies | 0.36% | Other Assets and Liabilities | 0.07% | Total Net Assets | 100.00% | Table SummarySector | Percent of Net Assets |
|---|
Financial | 29.59% | Industrial | 22.94% | Consumer, Non-cyclical | 14.33% | Consumer, Cyclical | 9.67% | Technology | 8.43% | Energy | 5.65% | Utilities | 4.27% | Basic Materials | 2.94% | Communications | 1.75% | Money Market Funds | 0.36% | Other Assets and Liabilities | 0.07% | Total Net Assets | 100.00% | |
|
| Material Fund Change [Text Block] |
|
There were no material changes to the Fund for the period September 1, 2025 to August 31, 2026. For more complete information, you may review the Fund's most recent prospectus at www.PrincipalAM.com/prospectuses. |
|
| C000115416 |
|
|
|
| Shareholder Report [Line Items] |
|
|
|
| Fund Name |
|
Small-MidCap Dividend Income Fund
|
|
| Class Name |
|
Class C
|
|
| Trading Symbol |
|
PMDDX
|
|
| Annual or Semi-Annual Statement [Text Block] |
|
This annual shareholder report contains important information about Small-MidCap Dividend Income Fund (the "Fund") for the period of September 1, 2025 to August 31, 2026.
|
|
| Shareholder Report Annual or Semi-Annual |
|
Annual Shareholder Report
|
|
| Additional Information [Text Block] |
|
You can find additional information about the Fund at www.PrincipalAM.com/prospectuses or you can request information by contacting us at 1-800-222-5852 or emailing prospectus@principalfunds.com.
|
|
| Additional Information Phone Number |
|
1-800-222-5852
|
|
| Additional Information Email |
|
<span style="box-sizing: border-box; color: rgb(0, 0, 0); display: inline; flex-wrap: nowrap; font-size: 10.6667px; font-weight: 400; grid-area: auto; line-height: 16px; margin: 0px; overflow: visible; text-align: left; text-align-last: auto; white-space-collapse: preserve-breaks;">prospectus@principalfunds.com</span>
|
|
| Additional Information Website |
|
<span style="box-sizing: border-box; color: rgb(0, 0, 0); display: inline; flex-wrap: nowrap; font-size: 10.6667px; font-weight: 400; grid-area: auto; line-height: 16px; margin: 0px; overflow: visible; text-align: left; text-align-last: auto; white-space-collapse: preserve-breaks;">www.PrincipalAM.com/prospectuses</span>
|
|
| Expenses [Text Block] |
|
What were the Fund costs for the last year? (based on a hypothetical $10,000 investment) Table SummaryClass Name | Costs of a $10,000 investment | Costs paid as a percentage of a $10,000 investment |
|---|
Class C | $202 | 1.87% |
|---|
|
|
| Expenses Paid, Amount |
|
$ 202
|
|
| Expense Ratio, Percent |
|
1.87%
|
|
| Factors Affecting Performance [Text Block] |
|
Management’s Discussion of Fund PerformanceThe Fund seeks to provide current income and long-term growth of income and capital. The Fund invests at least 80% of its net assets in dividend-paying equity securities of companies with small-to-medium market capitalizations. Its investments include the securities of foreign issuers and real estate investment trusts. MKS, Inc. (MKSI) contributed to relative performance as investors continue to be encouraged by signs that its cyclically weaker markets are rebounding and demand for semiconductor capital equipment subsystems and advanced packaging chemistries are rising due to artificial intelligence and data center growth. Western Digital Corp. (WDC) develops, manufactures, and sells data storage devices and solutions and is one of only two major pure-play hard disk drive (HDD) manufacturers. As inferencing and storage demand continued to ramp, memory and storage-related names posted a strong year, including WDC. Amkor Technology, Inc. (AMKR) is the second largest outsourced semiconductor assembly and test supplier (OSAT) focused on advanced packaging solutions. AMKR outperformed following earnings that beat expectations and guidance that was raised. Not owning SanDisk Corp. (SNDK) detracted from performance as shares rallied meaningfully along with other memory-related names. Hamilton Lane Inc. (HLNE) lagged during the year as investors became concerned about private debt and private equity exposure to businesses that may be disrupted by AI. Not owning Ciena Corp. (CIEN) detracted from performance. |
|
| Performance Past Does Not Indicate Future [Text] |
|
Past performance is not a good predictor of the Fund's future performance.
|
|
| Line Graph [Table Text Block] |
|
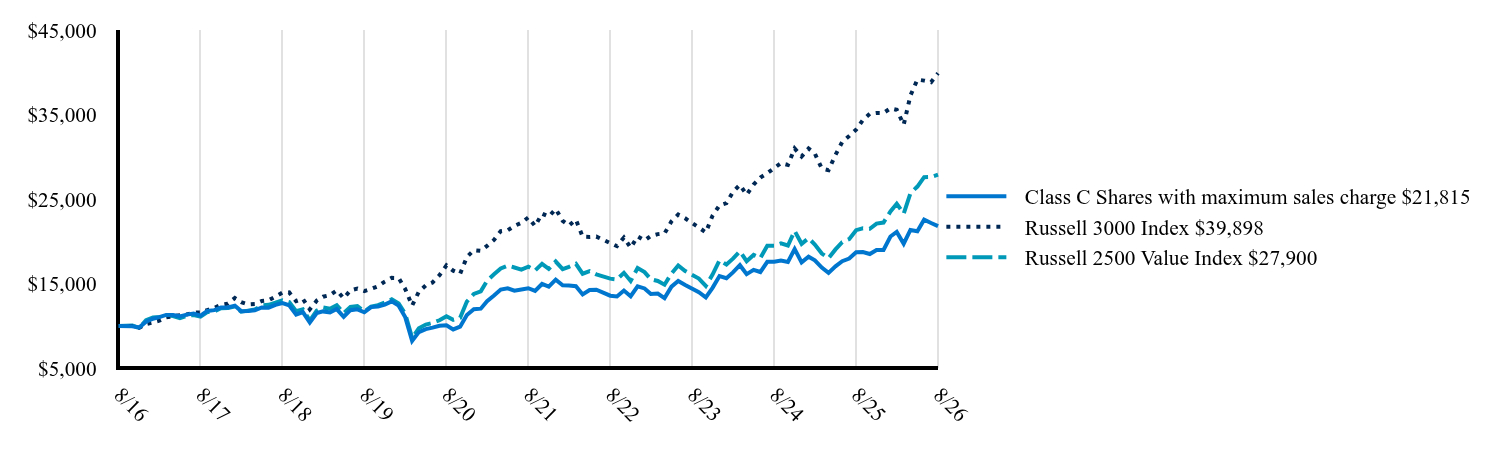 Table Summary | Class C Shares with maximum sales charge $21,815 | Russell 3000 Index $39,898 | Russell 2500 Value Index $27,900 |
|---|
8/16 | 10,000 | 10,000 | 10,000 |
|---|
10/16 | 9,981 | 10,016 | 10,066 |
|---|
11/16 | 9,819 | 9,799 | 9,764 |
|---|
12/16 | 10,520 | 10,238 | 10,701 |
|---|
1/17 | 10,868 | 10,437 | 11,006 |
|---|
2/17 | 11,052 | 10,634 | 11,066 |
|---|
3/17 | 11,319 | 11,029 | 11,272 |
|---|
4/17 | 11,306 | 11,154 | 11,173 |
|---|
5/17 | 11,148 | 11,268 | 10,930 |
|---|
6/17 | 11,353 | 11,370 | 11,221 |
|---|
7/17 | 11,470 | 11,584 | 11,308 |
|---|
8/17 | 11,237 | 11,606 | 11,112 |
|---|
9/17 | 11,787 | 11,889 | 11,651 |
|---|
10/17 | 11,883 | 12,149 | 11,714 |
|---|
11/17 | 12,184 | 12,518 | 12,098 |
|---|
12/17 | 12,188 | 12,643 | 12,146 |
|---|
1/18 | 12,410 | 13,309 | 12,299 |
|---|
2/18 | 11,764 | 12,819 | 11,695 |
|---|
3/18 | 11,787 | 12,561 | 11,824 |
|---|
4/18 | 11,866 | 12,609 | 11,952 |
|---|
5/18 | 12,196 | 12,965 | 12,444 |
|---|
6/18 | 12,168 | 13,050 | 12,510 |
|---|
7/18 | 12,499 | 13,483 | 12,758 |
|---|
8/18 | 12,707 | 13,956 | 13,048 |
|---|
9/18 | 12,457 | 13,979 | 12,844 |
|---|
10/18 | 11,342 | 12,950 | 11,746 |
|---|
11/18 | 11,658 | 13,209 | 11,968 |
|---|
12/18 | 10,418 | 11,980 | 10,645 |
|---|
1/19 | 11,539 | 13,008 | 11,835 |
|---|
2/19 | 11,732 | 13,466 | 12,204 |
|---|
3/19 | 11,608 | 13,662 | 12,041 |
|---|
4/19 | 12,011 | 14,208 | 12,464 |
|---|
5/19 | 11,097 | 13,289 | 11,524 |
|---|
6/19 | 11,879 | 14,222 | 12,269 |
|---|
7/19 | 11,972 | 14,433 | 12,349 |
|---|
8/19 | 11,627 | 14,139 | 11,748 |
|---|
9/19 | 12,240 | 14,387 | 12,285 |
|---|
10/19 | 12,307 | 14,697 | 12,462 |
|---|
11/19 | 12,544 | 15,256 | 12,768 |
|---|
12/19 | 12,924 | 15,696 | 13,153 |
|---|
1/20 | 12,412 | 15,679 | 12,674 |
|---|
2/20 | 11,065 | 14,395 | 11,452 |
|---|
3/20 | 8,254 | 12,416 | 8,597 |
|---|
4/20 | 9,281 | 14,060 | 9,734 |
|---|
5/20 | 9,632 | 14,812 | 10,178 |
|---|
6/20 | 9,812 | 15,151 | 10,368 |
|---|
7/20 | 10,035 | 16,011 | 10,679 |
|---|
8/20 | 10,086 | 17,171 | 11,165 |
|---|
9/20 | 9,596 | 16,546 | 10,735 |
|---|
10/20 | 9,930 | 16,189 | 10,977 |
|---|
11/20 | 11,302 | 18,158 | 12,898 |
|---|
12/20 | 11,984 | 18,975 | 13,795 |
|---|
1/21 | 12,052 | 18,890 | 14,100 |
|---|
2/21 | 12,928 | 19,481 | 15,354 |
|---|
3/21 | 13,607 | 20,179 | 16,117 |
|---|
4/21 | 14,312 | 21,219 | 16,808 |
|---|
5/21 | 14,467 | 21,316 | 17,150 |
|---|
6/21 | 14,183 | 21,842 | 16,923 |
|---|
7/21 | 14,321 | 22,211 | 16,675 |
|---|
8/21 | 14,467 | 22,845 | 17,027 |
|---|
9/21 | 14,149 | 21,820 | 16,573 |
|---|
10/21 | 14,975 | 23,295 | 17,360 |
|---|
11/21 | 14,657 | 22,941 | 16,756 |
|---|
12/21 | 15,479 | 23,844 | 17,627 |
|---|
1/22 | 14,816 | 22,441 | 16,731 |
|---|
2/22 | 14,782 | 21,876 | 17,004 |
|---|
3/22 | 14,703 | 22,585 | 17,363 |
|---|
4/22 | 13,737 | 20,558 | 16,186 |
|---|
5/22 | 14,263 | 20,531 | 16,496 |
|---|
6/22 | 14,295 | 20,578 | 16,112 |
|---|
8/22 | 13,587 | 19,810 | 15,607 |
|---|
9/22 | 13,493 | 19,447 | 15,510 |
|---|
10/22 | 14,193 | 20,462 | 16,289 |
|---|
11/22 | 13,529 | 19,264 | 15,321 |
|---|
12/22 | 14,704 | 20,591 | 16,852 |
|---|
1/23 | 14,449 | 20,110 | 16,375 |
|---|
2/23 | 13,791 | 20,647 | 15,535 |
|---|
3/23 | 13,836 | 20,867 | 15,328 |
|---|
4/23 | 13,307 | 20,949 | 14,890 |
|---|
5/23 | 14,655 | 22,379 | 16,214 |
|---|
6/23 | 15,322 | 23,181 | 17,164 |
|---|
7/23 | 14,856 | 22,734 | 16,503 |
|---|
9/23 | 13,995 | 21,651 | 15,620 |
|---|
10/23 | 13,391 | 21,077 | 14,744 |
|---|
11/23 | 14,517 | 23,042 | 16,082 |
|---|
12/23 | 15,911 | 24,265 | 17,769 |
|---|
1/24 | 15,661 | 24,534 | 17,271 |
|---|
2/24 | 16,346 | 25,862 | 17,963 |
|---|
3/24 | 17,196 | 26,696 | 18,848 |
|---|
4/24 | 16,140 | 25,521 | 17,663 |
|---|
5/24 | 16,640 | 26,727 | 18,407 |
|---|
6/24 | 16,387 | 27,554 | 18,037 |
|---|
7/24 | 17,594 | 28,066 | 19,497 |
|---|
8/24 | 17,603 | 28,677 | 19,496 |
|---|
9/24 | 17,756 | 29,271 | 19,773 |
|---|
10/24 | 17,581 | 29,056 | 19,524 |
|---|
11/24 | 19,108 | 30,989 | 21,246 |
|---|
12/24 | 17,533 | 30,041 | 19,721 |
|---|
1/25 | 18,199 | 30,990 | 20,392 |
|---|
2/25 | 17,771 | 30,396 | 19,638 |
|---|
3/25 | 16,909 | 28,623 | 18,571 |
|---|
4/25 | 16,289 | 28,431 | 18,033 |
|---|
5/25 | 17,061 | 30,233 | 19,063 |
|---|
6/25 | 17,666 | 31,769 | 19,925 |
|---|
7/25 | 17,982 | 32,469 | 20,271 |
|---|
8/25 | 18,728 | 33,220 | 21,334 |
|---|
9/25 | 18,755 | 34,366 | 21,553 |
|---|
10/25 | 18,516 | 35,103 | 21,497 |
|---|
11/25 | 18,995 | 35,199 | 22,116 |
|---|
12/25 | 19,001 | 35,192 | 22,232 |
|---|
1/26 | 20,585 | 35,738 | 23,547 |
|---|
2/26 | 21,133 | 35,568 | 24,457 |
|---|
3/26 | 19,736 | 33,800 | 23,293 |
|---|
4/26 | 21,364 | 37,248 | 25,707 |
|---|
5/26 | 21,207 | 39,135 | 26,490 |
|---|
6/26 | 22,582 | 39,015 | 27,603 |
|---|
7/26 | 22,179 | 38,833 | 27,623 |
|---|
8/26 | 21,815 | 39,898 | 27,900 |
|---|
|
|
| Average Annual Return [Table Text Block] |
|
Table SummaryName | 1-Year | 5-Year | 10-Year |
|---|
Class C Shares Excluding Sales Charge | 15.59% | 8.24% | 8.11% |
|---|
Class C Shares Including Sales Charge | 14.59% | 8.24% | 8.11% |
|---|
Russell 3000 Index | 20.10% | 11.80% | 14.84% |
|---|
Russell 2500 Value Index | 30.78% | 10.38% | 10.81% |
|---|
|
|
| No Deduction of Taxes [Text Block] |
|
The graph above represents historical performance of a hypothetical investment of $10,000 in the Fund over the past ten years (or since inception if shorter). The table and graph above do not reflect the impact of taxes. If they did, performance would be lower.
|
|
| Performance Table Market Index Changed [Text Block] |
|
The Russell 3000 Index is the Fund's primary broad-based securities market index. The Russell 2500 Value Index is included as an additional index for the Fund as it shows how the Fund’s performance compares with the returns of an index of funds with similar investment objectives.
|
|
| Updated Performance Information Location [Text Block] |
|
Visit www.principalam.com/mutualfundperformance for more recent performance information.
|
|
| AssetsNet |
|
$ 1,097,151,000
|
|
| Holdings Count | Holding |
|
80
|
|
| Advisory Fees Paid, Amount |
|
$ 12,122,000
|
|
| InvestmentCompanyPortfolioTurnover |
|
24.00%
|
|
| Additional Fund Statistics [Text Block] |
|
- Net Assets (amount in thousands)$1,097,151
- Total Number of Portfolio Holdings80
- Portfolio Turnover Rate 24.0%
- Total Advisory Fees Paid (amount in thousands)$12,122
|
|
| Holdings [Text Block] |
|
Table SummaryAsset Weighting | Percent of Net Assets |
|---|
Common Stocks | 99.57% | Investment Companies | 0.36% | Other Assets and Liabilities | 0.07% | Total Net Assets | 100.00% | Table SummarySector | Percent of Net Assets |
|---|
Financial | 29.59% | Industrial | 22.94% | Consumer, Non-cyclical | 14.33% | Consumer, Cyclical | 9.67% | Technology | 8.43% | Energy | 5.65% | Utilities | 4.27% | Basic Materials | 2.94% | Communications | 1.75% | Money Market Funds | 0.36% | Other Assets and Liabilities | 0.07% | Total Net Assets | 100.00% | |
|
| Material Fund Change [Text Block] |
|
There were no material changes to the Fund for the period September 1, 2025 to August 31, 2026. For more complete information, you may review the Fund's most recent prospectus at www.PrincipalAM.com/prospectuses. |
|
| C000101661 |
|
|
|
| Shareholder Report [Line Items] |
|
|
|
| Fund Name |
|
Small-MidCap Dividend Income Fund
|
|
| Class Name |
|
Institutional
|
|
| Trading Symbol |
|
PMDIX
|
|
| Annual or Semi-Annual Statement [Text Block] |
|
This annual shareholder report contains important information about Small-MidCap Dividend Income Fund (the "Fund") for the period of September 1, 2025 to August 31, 2026.
|
|
| Shareholder Report Annual or Semi-Annual |
|
Annual Shareholder Report
|
|
| Additional Information [Text Block] |
|
You can find additional information about the Fund at www.PrincipalAM.com/prospectuses or you can request information by contacting us at 1-800-222-5852 or emailing prospectus@principalfunds.com.
|
|
| Additional Information Phone Number |
|
1-800-222-5852
|
|
| Additional Information Email |
|
<span style="box-sizing: border-box; color: rgb(0, 0, 0); display: inline; flex-wrap: nowrap; font-size: 10.6667px; font-weight: 400; grid-area: auto; line-height: 16px; margin: 0px; overflow: visible; text-align: left; text-align-last: auto; white-space-collapse: preserve-breaks;">prospectus@principalfunds.com</span>
|
|
| Additional Information Website |
|
<span style="box-sizing: border-box; color: rgb(0, 0, 0); display: inline; flex-wrap: nowrap; font-size: 10.6667px; font-weight: 400; grid-area: auto; line-height: 16px; margin: 0px; overflow: visible; text-align: left; text-align-last: auto; white-space-collapse: preserve-breaks;">www.PrincipalAM.com/prospectuses</span>
|
|
| Expenses [Text Block] |
|
What were the Fund costs for the last year? (based on a hypothetical $10,000 investment) Table SummaryClass Name | Costs of a $10,000 investment | Costs paid as a percentage of a $10,000 investment |
|---|
Institutional | $92 | 0.85% |
|---|
|
|
| Expenses Paid, Amount |
|
$ 92
|
|
| Expense Ratio, Percent |
|
0.85%
|
|
| Factors Affecting Performance [Text Block] |
|
Management’s Discussion of Fund PerformanceThe Fund seeks to provide current income and long-term growth of income and capital. The Fund invests at least 80% of its net assets in dividend-paying equity securities of companies with small-to-medium market capitalizations. Its investments include the securities of foreign issuers and real estate investment trusts. MKS, Inc. (MKSI) contributed to relative performance as investors continue to be encouraged by signs that its cyclically weaker markets are rebounding and demand for semiconductor capital equipment subsystems and advanced packaging chemistries are rising due to artificial intelligence and data center growth. Western Digital Corp. (WDC) develops, manufactures, and sells data storage devices and solutions and is one of only two major pure-play hard disk drive (HDD) manufacturers. As inferencing and storage demand continued to ramp, memory and storage-related names posted a strong year, including WDC. Amkor Technology, Inc. (AMKR) is the second largest outsourced semiconductor assembly and test supplier (OSAT) focused on advanced packaging solutions. AMKR outperformed following earnings that beat expectations and guidance that was raised. Not owning SanDisk Corp. (SNDK) detracted from performance as shares rallied meaningfully along with other memory-related names. Hamilton Lane Inc. (HLNE) lagged during the year as investors became concerned about private debt and private equity exposure to businesses that may be disrupted by AI. Not owning Ciena Corp. (CIEN) detracted from performance. |
|
| Performance Past Does Not Indicate Future [Text] |
|
Past performance is not a good predictor of the Fund's future performance.
|
|
| Line Graph [Table Text Block] |
|
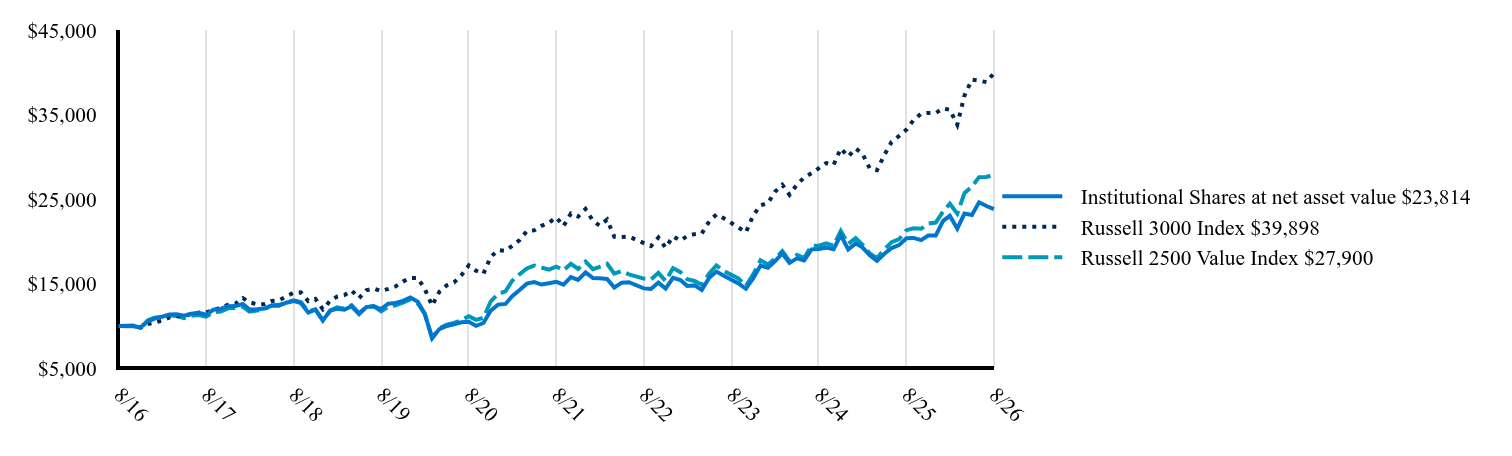 Table Summary | Institutional Shares at net asset value $23,814 | Russell 3000 Index $39,898 | Russell 2500 Value Index $27,900 |
|---|
8/16 | 10,000 | 10,000 | 10,000 |
|---|
10/16 | 9,986 | 10,016 | 10,066 |
|---|
11/16 | 9,839 | 9,799 | 9,764 |
|---|
12/16 | 10,548 | 10,238 | 10,701 |
|---|
1/17 | 10,905 | 10,437 | 11,006 |
|---|
2/17 | 11,102 | 10,634 | 11,066 |
|---|
3/17 | 11,374 | 11,029 | 11,272 |
|---|
4/17 | 11,382 | 11,154 | 11,173 |
|---|
5/17 | 11,232 | 11,268 | 10,930 |
|---|
6/17 | 11,452 | 11,370 | 11,221 |
|---|
7/17 | 11,581 | 11,584 | 11,308 |
|---|
8/17 | 11,356 | 11,606 | 11,112 |
|---|
9/17 | 11,921 | 11,889 | 11,651 |
|---|
10/17 | 12,030 | 12,149 | 11,714 |
|---|
11/17 | 12,346 | 12,518 | 12,098 |
|---|
12/17 | 12,356 | 12,643 | 12,146 |
|---|
1/18 | 12,600 | 13,309 | 12,299 |
|---|
2/18 | 11,953 | 12,819 | 11,695 |
|---|
3/18 | 11,981 | 12,561 | 11,824 |
|---|
4/18 | 12,075 | 12,609 | 11,952 |
|---|
5/18 | 12,421 | 12,965 | 12,444 |
|---|
6/18 | 12,397 | 13,050 | 12,510 |
|---|
7/18 | 12,752 | 13,483 | 12,758 |
|---|
8/18 | 12,969 | 13,956 | 13,048 |
|---|
9/18 | 12,727 | 13,979 | 12,844 |
|---|
10/18 | 11,601 | 12,950 | 11,746 |
|---|
11/18 | 11,935 | 13,209 | 11,968 |
|---|
12/18 | 10,669 | 11,980 | 10,645 |
|---|
1/19 | 11,835 | 13,008 | 11,835 |
|---|
2/19 | 12,038 | 13,466 | 12,204 |
|---|
3/19 | 11,923 | 13,662 | 12,041 |
|---|
4/19 | 12,339 | 14,208 | 12,464 |
|---|
5/19 | 11,414 | 13,289 | 11,524 |
|---|
6/19 | 12,238 | 14,222 | 12,269 |
|---|
7/19 | 12,332 | 14,433 | 12,349 |
|---|
8/19 | 11,991 | 14,139 | 11,748 |
|---|
9/19 | 12,636 | 14,387 | 12,285 |
|---|
10/19 | 12,722 | 14,697 | 12,462 |
|---|
11/19 | 12,970 | 15,256 | 12,768 |
|---|
12/19 | 13,377 | 15,696 | 13,153 |
|---|
1/20 | 12,863 | 15,679 | 12,674 |
|---|
2/20 | 11,471 | 14,395 | 11,452 |
|---|
3/20 | 8,558 | 12,416 | 8,597 |
|---|
4/20 | 9,636 | 14,060 | 9,734 |
|---|
5/20 | 10,013 | 14,812 | 10,178 |
|---|
6/20 | 10,210 | 15,151 | 10,368 |
|---|
7/20 | 10,447 | 16,011 | 10,679 |
|---|
8/20 | 10,509 | 17,171 | 11,165 |
|---|
9/20 | 10,017 | 16,546 | 10,735 |
|---|
10/20 | 10,360 | 16,189 | 10,977 |
|---|
11/20 | 11,806 | 18,158 | 12,898 |
|---|
12/20 | 12,533 | 18,975 | 13,795 |
|---|
1/21 | 12,612 | 18,890 | 14,100 |
|---|
2/21 | 13,542 | 19,481 | 15,354 |
|---|
3/21 | 14,259 | 20,179 | 16,117 |
|---|
4/21 | 15,014 | 21,219 | 16,808 |
|---|
5/21 | 15,192 | 21,316 | 17,150 |
|---|
6/21 | 14,906 | 21,842 | 16,923 |
|---|
7/21 | 15,057 | 22,211 | 16,675 |
|---|
8/21 | 15,226 | 22,845 | 17,027 |
|---|
9/21 | 14,905 | 21,820 | 16,573 |
|---|
10/21 | 15,788 | 23,295 | 17,360 |
|---|
11/21 | 15,467 | 22,941 | 16,756 |
|---|
12/21 | 16,344 | 23,844 | 17,627 |
|---|
1/22 | 15,664 | 22,441 | 16,731 |
|---|
2/22 | 15,637 | 21,876 | 17,004 |
|---|
3/22 | 15,572 | 22,585 | 17,363 |
|---|
4/22 | 14,557 | 20,558 | 16,186 |
|---|
5/22 | 15,132 | 20,531 | 16,496 |
|---|
6/22 | 15,183 | 20,578 | 16,112 |
|---|
8/22 | 14,453 | 19,810 | 15,607 |
|---|
9/22 | 14,375 | 19,447 | 15,510 |
|---|
10/22 | 15,136 | 20,462 | 16,289 |
|---|
11/22 | 14,437 | 19,264 | 15,321 |
|---|
12/22 | 15,699 | 20,591 | 16,852 |
|---|
1/23 | 15,441 | 20,110 | 16,375 |
|---|
2/23 | 14,749 | 20,647 | 15,535 |
|---|
3/23 | 14,806 | 20,867 | 15,328 |
|---|
4/23 | 14,259 | 20,949 | 14,890 |
|---|
5/23 | 15,708 | 22,379 | 16,214 |
|---|
6/23 | 16,441 | 23,181 | 17,164 |
|---|
7/23 | 15,959 | 22,734 | 16,503 |
|---|
9/23 | 15,045 | 21,651 | 15,620 |
|---|
10/23 | 14,406 | 21,077 | 14,744 |
|---|
11/23 | 15,635 | 23,042 | 16,082 |
|---|
12/23 | 17,151 | 24,265 | 17,769 |
|---|
1/24 | 16,896 | 24,534 | 17,271 |
|---|
2/24 | 17,651 | 25,862 | 17,963 |
|---|
3/24 | 18,586 | 26,696 | 18,848 |
|---|
4/24 | 17,464 | 25,521 | 17,663 |
|---|
5/24 | 18,005 | 26,727 | 18,407 |
|---|
6/24 | 17,754 | 27,554 | 18,037 |
|---|
7/24 | 19,070 | 28,066 | 19,497 |
|---|
8/24 | 19,109 | 28,677 | 19,496 |
|---|
9/24 | 19,282 | 29,271 | 19,773 |
|---|
10/24 | 19,093 | 29,056 | 19,524 |
|---|
11/24 | 20,760 | 30,989 | 21,246 |
|---|
12/24 | 19,055 | 30,041 | 19,721 |
|---|
1/25 | 19,774 | 30,990 | 20,392 |
|---|
2/25 | 19,312 | 30,396 | 19,638 |
|---|
3/25 | 18,382 | 28,623 | 18,571 |
|---|
4/25 | 17,713 | 28,431 | 18,033 |
|---|
5/25 | 18,547 | 30,233 | 19,063 |
|---|
6/25 | 19,224 | 31,769 | 19,925 |
|---|
7/25 | 19,565 | 32,469 | 20,271 |
|---|
8/25 | 20,382 | 33,220 | 21,334 |
|---|
9/25 | 20,415 | 34,366 | 21,553 |
|---|
10/25 | 20,155 | 35,103 | 21,497 |
|---|
11/25 | 20,695 | 35,199 | 22,116 |
|---|
12/25 | 20,695 | 35,192 | 22,232 |
|---|
1/26 | 22,431 | 35,738 | 23,547 |
|---|
2/26 | 23,034 | 35,568 | 24,457 |
|---|
3/26 | 21,514 | 33,800 | 23,293 |
|---|
4/26 | 23,299 | 37,248 | 25,707 |
|---|
5/26 | 23,129 | 39,135 | 26,490 |
|---|
6/26 | 24,634 | 39,015 | 27,603 |
|---|
7/26 | 24,197 | 38,833 | 27,623 |
|---|
8/26 | 23,814 | 39,898 | 27,900 |
|---|
|
|
| Average Annual Return [Table Text Block] |
|
Table SummaryName | 1-Year | 5-Year | 10-Year |
|---|
Institutional Shares | 16.84% | 9.36% | 9.06% |
|---|
Russell 3000 Index | 20.10% | 11.80% | 14.84% |
|---|
Russell 2500 Value Index | 30.78% | 10.38% | 10.81% |
|---|
|
|
| No Deduction of Taxes [Text Block] |
|
The graph above represents historical performance of a hypothetical investment of $10,000 in the Fund over the past ten years (or since inception if shorter). The table and graph above do not reflect the impact of taxes. If they did, performance would be lower.
|
|
| Performance Table Market Index Changed [Text Block] |
|
The Russell 3000 Index is the Fund's primary broad-based securities market index. The Russell 2500 Value Index is included as an additional index for the Fund as it shows how the Fund’s performance compares with the returns of an index of funds with similar investment objectives.
|
|
| Updated Performance Information Location [Text Block] |
|
Visit www.principalam.com/mutualfundperformance for more recent performance information.
|
|
| AssetsNet |
|
$ 1,097,151,000
|
|
| Holdings Count | Holding |
|
80
|
|
| Advisory Fees Paid, Amount |
|
$ 12,122,000
|
|
| InvestmentCompanyPortfolioTurnover |
|
24.00%
|
|
| Additional Fund Statistics [Text Block] |
|
- Net Assets (amount in thousands)$1,097,151
- Total Number of Portfolio Holdings80
- Portfolio Turnover Rate 24.0%
- Total Advisory Fees Paid (amount in thousands)$12,122
|
|
| Holdings [Text Block] |
|
Table SummaryAsset Weighting | Percent of Net Assets |
|---|
Common Stocks | 99.57% | Investment Companies | 0.36% | Other Assets and Liabilities | 0.07% | Total Net Assets | 100.00% | Table SummarySector | Percent of Net Assets |
|---|
Financial | 29.59% | Industrial | 22.94% | Consumer, Non-cyclical | 14.33% | Consumer, Cyclical | 9.67% | Technology | 8.43% | Energy | 5.65% | Utilities | 4.27% | Basic Materials | 2.94% | Communications | 1.75% | Money Market Funds | 0.36% | Other Assets and Liabilities | 0.07% | Total Net Assets | 100.00% | |
|
| Material Fund Change [Text Block] |
|
There were no material changes to the Fund for the period September 1, 2025 to August 31, 2026. For more complete information, you may review the Fund's most recent prospectus at www.PrincipalAM.com/prospectuses. |
|
| C000176330 |
|
|
|
| Shareholder Report [Line Items] |
|
|
|
| Fund Name |
|
Small-MidCap Dividend Income Fund
|
|
| Class Name |
|
R-6
|
|
| Trading Symbol |
|
PMDHX
|
|
| Annual or Semi-Annual Statement [Text Block] |
|
This annual shareholder report contains important information about Small-MidCap Dividend Income Fund (the "Fund") for the period of September 1, 2025 to August 31, 2026.
|
|
| Shareholder Report Annual or Semi-Annual |
|
Annual Shareholder Report
|
|
| Additional Information [Text Block] |
|
You can find additional information about the Fund at www.PrincipalAM.com/prospectuses or you can request information by contacting us at 1-800-222-5852 or emailing prospectus@principalfunds.com.
|
|
| Material Fund Change Notice [Text Block] |
|
This report describes certain changes to the Fund that occurred during the reporting period.
|
|
| Additional Information Phone Number |
|
1-800-222-5852
|
|
| Additional Information Email |
|
<span style="box-sizing: border-box; color: rgb(0, 0, 0); display: inline; flex-wrap: nowrap; font-size: 10.6667px; font-weight: 400; grid-area: auto; line-height: 16px; margin: 0px; overflow: visible; text-align: left; text-align-last: auto; white-space-collapse: preserve-breaks;">prospectus@principalfunds.com</span>
|
|
| Additional Information Website |
|
<span style="box-sizing: border-box; color: rgb(0, 0, 0); display: inline; flex-wrap: nowrap; font-size: 10.6667px; font-weight: 400; grid-area: auto; line-height: 16px; margin: 0px; overflow: visible; text-align: left; text-align-last: auto; white-space-collapse: preserve-breaks;">www.PrincipalAM.com/prospectuses</span>
|
|
| Expenses [Text Block] |
|
What were the Fund costs for the last year? (based on a hypothetical $10,000 investment) Table SummaryClass Name | Costs of a $10,000 investment | Costs paid as a percentage of a $10,000 investment |
|---|
R-6 | $85 | 0.78% |
|---|
|
|
| Expenses Paid, Amount |
|
$ 85
|
|
| Expense Ratio, Percent |
|
0.78%
|
|
| Factors Affecting Performance [Text Block] |
|
Management’s Discussion of Fund PerformanceThe Fund seeks to provide current income and long-term growth of income and capital. The Fund invests at least 80% of its net assets in dividend-paying equity securities of companies with small-to-medium market capitalizations. Its investments include the securities of foreign issuers and real estate investment trusts. MKS, Inc. (MKSI) contributed to relative performance as investors continue to be encouraged by signs that its cyclically weaker markets are rebounding and demand for semiconductor capital equipment subsystems and advanced packaging chemistries are rising due to artificial intelligence and data center growth. Western Digital Corp. (WDC) develops, manufactures, and sells data storage devices and solutions and is one of only two major pure-play hard disk drive (HDD) manufacturers. As inferencing and storage demand continued to ramp, memory and storage-related names posted a strong year, including WDC. Amkor Technology, Inc. (AMKR) is the second largest outsourced semiconductor assembly and test supplier (OSAT) focused on advanced packaging solutions. AMKR outperformed following earnings that beat expectations and guidance that was raised. Not owning SanDisk Corp. (SNDK) detracted from performance as shares rallied meaningfully along with other memory-related names. Hamilton Lane Inc. (HLNE) lagged during the year as investors became concerned about private debt and private equity exposure to businesses that may be disrupted by AI. Not owning Ciena Corp. (CIEN) detracted from performance. |
|
| Performance Past Does Not Indicate Future [Text] |
|
Past performance is not a good predictor of the Fund's future performance.
|
|
| Line Graph [Table Text Block] |
|
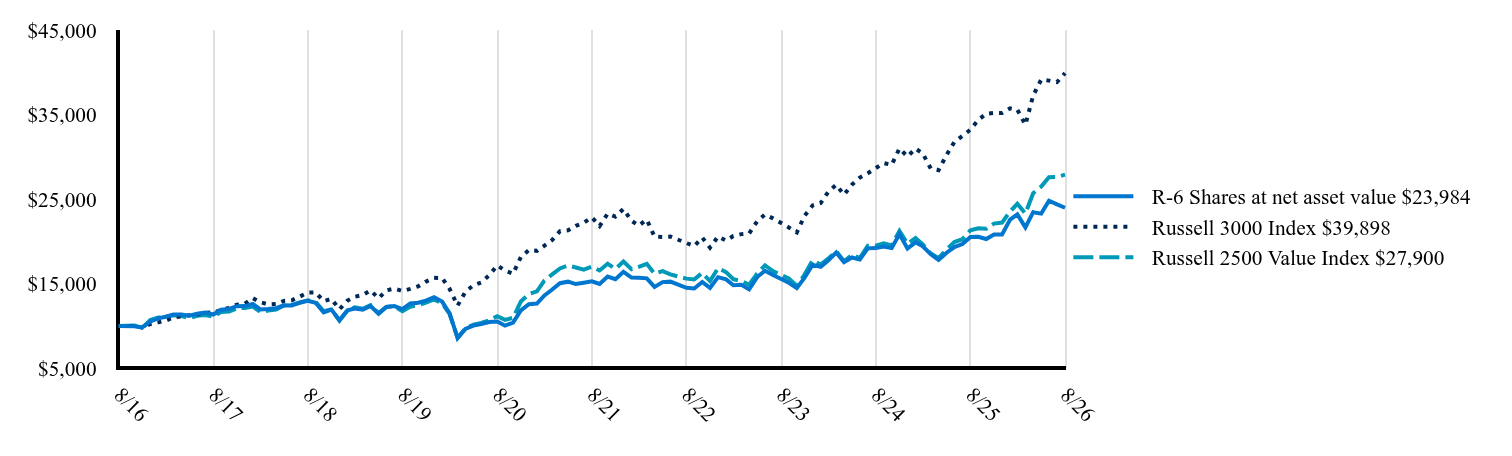 Table Summary | R-6 Shares at net asset value $23,984 | Russell 3000 Index $39,898 | Russell 2500 Value Index $27,900 |
|---|
8/16 | 10,000 | 10,000 | 10,000 |
|---|
10/16 | 9,986 | 10,016 | 10,066 |
|---|
11/16 | 9,838 | 9,799 | 9,764 |
|---|
12/16 | 10,546 | 10,238 | 10,701 |
|---|
1/17 | 10,902 | 10,437 | 11,006 |
|---|
2/17 | 11,099 | 10,634 | 11,066 |
|---|
3/17 | 11,371 | 11,029 | 11,272 |
|---|
4/17 | 11,379 | 11,154 | 11,173 |
|---|
5/17 | 11,229 | 11,268 | 10,930 |
|---|
6/17 | 11,456 | 11,370 | 11,221 |
|---|
7/17 | 11,586 | 11,584 | 11,308 |
|---|
8/17 | 11,361 | 11,606 | 11,112 |
|---|
9/17 | 11,921 | 11,889 | 11,651 |
|---|
10/17 | 12,030 | 12,149 | 11,714 |
|---|
11/17 | 12,352 | 12,518 | 12,098 |
|---|
12/17 | 12,358 | 12,643 | 12,146 |
|---|
1/18 | 12,603 | 13,309 | 12,299 |
|---|
2/18 | 11,962 | 12,819 | 11,695 |
|---|
3/18 | 12,018 | 12,561 | 11,824 |
|---|
4/18 | 12,112 | 12,609 | 11,952 |
|---|
5/18 | 12,451 | 12,965 | 12,444 |
|---|
6/18 | 12,432 | 13,050 | 12,510 |
|---|
7/18 | 12,779 | 13,483 | 12,758 |
|---|
8/18 | 12,995 | 13,956 | 13,048 |
|---|
9/18 | 12,751 | 13,979 | 12,844 |
|---|
10/18 | 11,620 | 12,950 | 11,746 |
|---|
11/18 | 11,953 | 13,209 | 11,968 |
|---|
12/18 | 10,692 | 11,980 | 10,645 |
|---|
1/19 | 11,856 | 13,008 | 11,835 |
|---|
2/19 | 12,067 | 13,466 | 12,204 |
|---|
3/19 | 11,946 | 13,662 | 12,041 |
|---|
4/19 | 12,369 | 14,208 | 12,464 |
|---|
5/19 | 11,446 | 13,289 | 11,524 |
|---|
6/19 | 12,262 | 14,222 | 12,269 |
|---|
7/19 | 12,365 | 14,433 | 12,349 |
|---|
8/19 | 12,015 | 14,139 | 11,748 |
|---|
9/19 | 12,670 | 14,387 | 12,285 |
|---|
10/19 | 12,755 | 14,697 | 12,462 |
|---|
11/19 | 13,004 | 15,256 | 12,768 |
|---|
12/19 | 13,412 | 15,696 | 13,153 |
|---|
1/20 | 12,890 | 15,679 | 12,674 |
|---|
2/20 | 11,501 | 14,395 | 11,452 |
|---|
3/20 | 8,587 | 12,416 | 8,597 |
|---|
4/20 | 9,664 | 14,060 | 9,734 |
|---|
5/20 | 10,049 | 14,812 | 10,178 |
|---|
6/20 | 10,247 | 15,151 | 10,368 |
|---|
7/20 | 10,483 | 16,011 | 10,679 |
|---|
8/20 | 10,545 | 17,171 | 11,165 |
|---|
9/20 | 10,046 | 16,546 | 10,735 |
|---|
10/20 | 10,398 | 16,189 | 10,977 |
|---|
11/20 | 11,851 | 18,158 | 12,898 |
|---|
12/20 | 12,578 | 18,975 | 13,795 |
|---|
1/21 | 12,658 | 18,890 | 14,100 |
|---|
2/21 | 13,596 | 19,481 | 15,354 |
|---|
3/21 | 14,315 | 20,179 | 16,117 |
|---|
4/21 | 15,070 | 21,219 | 16,808 |
|---|
5/21 | 15,247 | 21,316 | 17,150 |
|---|
6/21 | 14,964 | 21,842 | 16,923 |
|---|
7/21 | 15,124 | 22,211 | 16,675 |
|---|
8/21 | 15,293 | 22,845 | 17,027 |
|---|
9/21 | 14,974 | 21,820 | 16,573 |
|---|
10/21 | 15,856 | 23,295 | 17,360 |
|---|
11/21 | 15,535 | 22,941 | 16,756 |
|---|
12/21 | 16,414 | 23,844 | 17,627 |
|---|
1/22 | 15,735 | 22,441 | 16,731 |
|---|
2/22 | 15,699 | 21,876 | 17,004 |
|---|
3/22 | 15,636 | 22,585 | 17,363 |
|---|
4/22 | 14,622 | 20,558 | 16,186 |
|---|
5/22 | 15,196 | 20,531 | 16,496 |
|---|
6/22 | 15,250 | 20,578 | 16,112 |
|---|
8/22 | 14,520 | 19,810 | 15,607 |
|---|
9/22 | 14,444 | 19,447 | 15,510 |
|---|
10/22 | 15,205 | 20,462 | 16,289 |
|---|
11/22 | 14,507 | 19,264 | 15,321 |
|---|
12/22 | 15,778 | 20,591 | 16,852 |
|---|
1/23 | 15,511 | 20,110 | 16,375 |
|---|
2/23 | 14,821 | 20,647 | 15,535 |
|---|
3/23 | 14,879 | 20,867 | 15,328 |
|---|
4/23 | 14,332 | 20,949 | 14,890 |
|---|
5/23 | 15,792 | 22,379 | 16,214 |
|---|
6/23 | 16,534 | 23,181 | 17,164 |
|---|
7/23 | 16,042 | 22,734 | 16,503 |
|---|
9/23 | 15,122 | 21,651 | 15,620 |
|---|
10/23 | 14,483 | 21,077 | 14,744 |
|---|
11/23 | 15,722 | 23,042 | 16,082 |
|---|
12/23 | 17,250 | 24,265 | 17,769 |
|---|
1/24 | 16,995 | 24,534 | 17,271 |
|---|
2/24 | 17,750 | 25,862 | 17,963 |
|---|
3/24 | 18,688 | 26,696 | 18,848 |
|---|
4/24 | 17,555 | 25,521 | 17,663 |
|---|
5/24 | 18,107 | 26,727 | 18,407 |
|---|
6/24 | 17,859 | 27,554 | 18,037 |
|---|
7/24 | 19,185 | 28,066 | 19,497 |
|---|
8/24 | 19,214 | 28,677 | 19,496 |
|---|
9/24 | 19,390 | 29,271 | 19,773 |
|---|
10/24 | 19,211 | 29,056 | 19,524 |
|---|
11/24 | 20,879 | 30,989 | 21,246 |
|---|
12/24 | 19,167 | 30,041 | 19,721 |
|---|
1/25 | 19,896 | 30,990 | 20,392 |
|---|
2/25 | 19,434 | 30,396 | 19,638 |
|---|
3/25 | 18,497 | 28,623 | 18,571 |
|---|
4/25 | 17,827 | 28,431 | 18,033 |
|---|
5/25 | 18,672 | 30,233 | 19,063 |
|---|
6/25 | 19,342 | 31,769 | 19,925 |
|---|
7/25 | 19,694 | 32,469 | 20,271 |
|---|
8/25 | 20,522 | 33,220 | 21,334 |
|---|
9/25 | 20,558 | 34,366 | 21,553 |
|---|
10/25 | 20,288 | 35,103 | 21,497 |
|---|
11/25 | 20,828 | 35,199 | 22,116 |
|---|
12/25 | 20,832 | 35,192 | 22,232 |
|---|
1/26 | 22,591 | 35,738 | 23,547 |
|---|
2/26 | 23,195 | 35,568 | 24,457 |
|---|
3/26 | 21,667 | 33,800 | 23,293 |
|---|
4/26 | 23,464 | 37,248 | 25,707 |
|---|
5/26 | 23,294 | 39,135 | 26,490 |
|---|
6/26 | 24,816 | 39,015 | 27,603 |
|---|
7/26 | 24,378 | 38,833 | 27,623 |
|---|
8/26 | 23,984 | 39,898 | 27,900 |
|---|
|
|
| Average Annual Return [Table Text Block] |
|
Table SummaryName | 1-Year | 5-Year | 10-YearFootnote Reference* |
|---|
R-6 Shares | 16.87% | 9.42% | 9.14% |
|---|
Russell 3000 Index | 20.10% | 11.80% | 14.84% |
|---|
Russell 2500 Value Index | 30.78% | 10.38% | 10.81% |
|---|
|
|
| Performance Inception Date |
|
Jun. 06, 2011
|
|
| No Deduction of Taxes [Text Block] |
|
The graph above represents historical performance of a hypothetical investment of $10,000 in the Fund over the past ten years (or since inception if shorter). The table and graph above do not reflect the impact of taxes. If they did, performance would be lower.
|
|
| Performance Table Market Index Changed [Text Block] |
|
The Russell 3000 Index is the Fund's primary broad-based securities market index. The Russell 2500 Value Index is included as an additional index for the Fund as it shows how the Fund’s performance compares with the returns of an index of funds with similar investment objectives.
|
|
| Material Change Date |
|
|
Aug. 31, 2025
|
| Updated Performance Information Location [Text Block] |
|
Visit www.principalam.com/mutualfundperformance for more recent performance information.
|
|
| AssetsNet |
|
$ 1,097,151,000
|
|
| Holdings Count | Holding |
|
80
|
|
| Advisory Fees Paid, Amount |
|
$ 12,122,000
|
|
| InvestmentCompanyPortfolioTurnover |
|
24.00%
|
|
| Additional Fund Statistics [Text Block] |
|
- Net Assets (amount in thousands)$1,097,151
- Total Number of Portfolio Holdings80
- Portfolio Turnover Rate 24.0%
- Total Advisory Fees Paid (amount in thousands)$12,122
|
|
| Holdings [Text Block] |
|
Table SummaryAsset Weighting | Percent of Net Assets |
|---|
Common Stocks | 99.57% | Investment Companies | 0.36% | Other Assets and Liabilities | 0.07% | Total Net Assets | 100.00% | Table SummarySector | Percent of Net Assets |
|---|
Financial | 29.59% | Industrial | 22.94% | Consumer, Non-cyclical | 14.33% | Consumer, Cyclical | 9.67% | Technology | 8.43% | Energy | 5.65% | Utilities | 4.27% | Basic Materials | 2.94% | Communications | 1.75% | Money Market Funds | 0.36% | Other Assets and Liabilities | 0.07% | Total Net Assets | 100.00% | |
|
| Material Fund Change [Text Block] |
|
This is a summary of certain changes to the Fund since August 31, 2025. For more complete information, you may review the Fund's most recent prospectus, which we expect to be effective by December 31 or upon request at www.PrincipalAM.com/prospectuses. Effective December 30, 2025, the Fund's Class R-6 contractual expense limit of 0.02% on "Other Expenses" expired. |
|
| Material Fund Change Expenses [Text Block] |
|
Effective December 30, 2025, the Fund's Class R-6 contractual expense limit of 0.02% on "Other Expenses" expired.
|
|
| Summary of Change Legend [Text Block] |
|
This is a summary of certain changes to the Fund since August 31, 2025. For more complete information, you may review the Fund's most recent prospectus, which we expect to be effective by December 31 or upon request at www.PrincipalAM.com/prospectuses.
|
|
| Updated Prospectus Web Address |
|
www.PrincipalAM.com/prospectuses
|
|
| C000019597 |
|
|
|
| Shareholder Report [Line Items] |
|
|
|
| Fund Name |
|
Spectrum Preferred and Capital Securities Income Fund
|
|
| Class Name |
|
Class A
|
|
| Trading Symbol |
|
PPSAX
|
|
| Annual or Semi-Annual Statement [Text Block] |
|
This annual shareholder report contains important information about Spectrum Preferred and Capital Securities Income Fund (the "Fund") for the period of September 1, 2025 to August 31, 2026.
|
|
| Shareholder Report Annual or Semi-Annual |
|
Annual Shareholder Report
|
|
| Additional Information [Text Block] |
|
You can find additional information about the Fund at www.PrincipalAM.com/prospectuses or you can request information by contacting us at 1-800-222-5852 or emailing prospectus@principalfunds.com.
|
|
| Additional Information Phone Number |
|
1-800-222-5852
|
|
| Additional Information Email |
|
<span style="box-sizing: border-box; color: rgb(0, 0, 0); display: inline; flex-wrap: nowrap; font-size: 10.6667px; font-weight: 400; grid-area: auto; line-height: 16px; margin: 0px; overflow: visible; text-align: left; text-align-last: auto; white-space-collapse: preserve-breaks;">prospectus@principalfunds.com</span>
|
|
| Additional Information Website |
|
<span style="box-sizing: border-box; color: rgb(0, 0, 0); display: inline; flex-wrap: nowrap; font-size: 10.6667px; font-weight: 400; grid-area: auto; line-height: 16px; margin: 0px; overflow: visible; text-align: left; text-align-last: auto; white-space-collapse: preserve-breaks;">www.PrincipalAM.com/prospectuses</span>
|
|
| Expenses [Text Block] |
|
What were the Fund costs for the last year? (based on a hypothetical $10,000 investment) Table SummaryClass Name | Costs of a $10,000 investment | Costs paid as a percentage of a $10,000 investment |
|---|
Class A | $107 | 1.05% |
|---|
|
|
| Expenses Paid, Amount |
|
$ 107
|
|
| Expense Ratio, Percent |
|
1.05%
|
|
| Factors Affecting Performance [Text Block] |
|
Management’s Discussion of Fund PerformanceThe Fund seeks to provide current income. The Fund invests at least 80% of its net assets in preferred securities and capital securities. Preferred securities typically include preferred stock and various types of junior subordinated debt and trust preferred securities. It also invests up to 55% of its assets in below-investment-grade preferred securities and bonds (sometimes called “high yield bonds” or “junk bonds”), which are rated at the time of purchase Ba1 or lower by Moody’s and BB+ or lower by S&P Global. The bond market spent the first four months of the fiscal year in an easing cycle and the final eight in a pause. The Fed cut rates by 25 basis points (bps) in September, October, and December bringing the target rate to 3.50%-3.75%, with the September move described as a "risk management cut" in response to sharply revised payrolls. Policy remained on hold through August, even as the bond market began pricing in hikes. Rates did not follow the Fed lower: the 5 year U.S. Treasury yield rose about 75bps to 4.50%, driven primarily by real rates, which climbed from 1.29% to 2.15%, while 5 year breakevens edged lower to 2.35%. Supply and term premium, rather than inflation expectations, drove the move. Spreads tightened into January, widened sharply in March when conflict with Iran pushed oil over $100 and the CBOE Volatility Index above 30. Hybrid prices had their worst month in two and a half years, then snapped back in April on a 10% equity rally and re-tightened through the summer. Allocation and security selection in banking and insurance industries were primary contributors to Fund investment performance in absolute terms and relative to the ICE BofA US All Capital Securities Index. Pipelines and utilities contributed positively but underweighted allocation in these sectors detracted from relative index performance. Telecommunications and an out-of-index allocation to ETFs also detracted. |
|
| Performance Past Does Not Indicate Future [Text] |
|
Past performance is not a good predictor of the Fund's future performance.
|
|
| Line Graph [Table Text Block] |
|
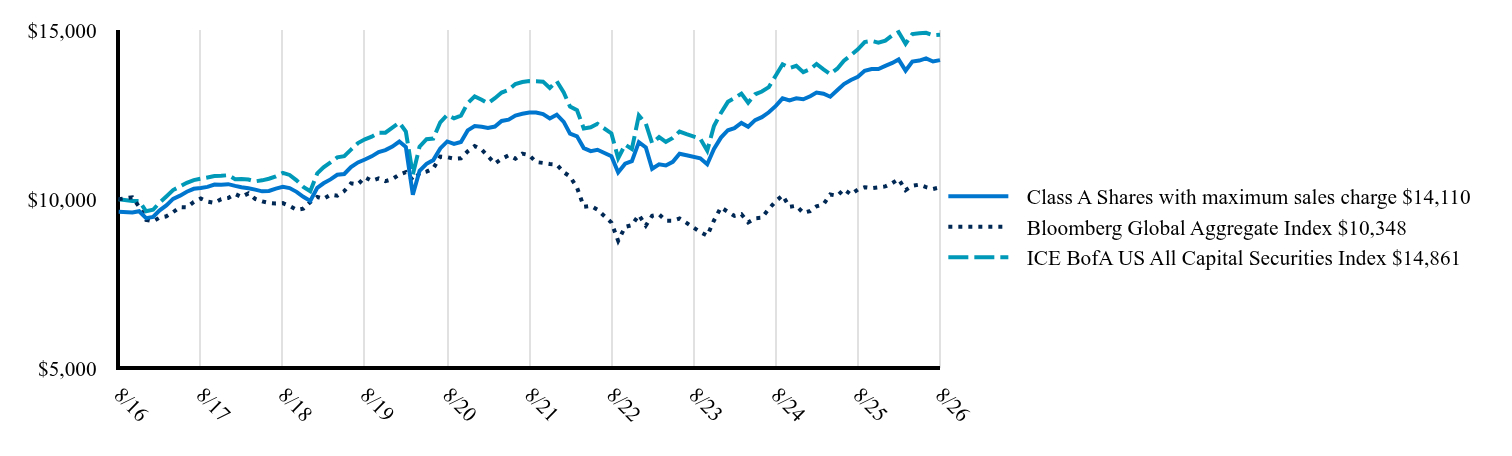 Table Summary | Class A Shares with maximum sales charge $14,110 | Bloomberg Global Aggregate Index $10,348 | ICE BofA US All Capital Securities Index $14,861 |
|---|
8/16 | 9,628 | 10,000 | 10,000 |
|---|
10/16 | 9,607 | 10,055 | 9,949 |
|---|
11/16 | 9,644 | 9,776 | 9,948 |
|---|
12/16 | 9,439 | 9,388 | 9,642 |
|---|
1/17 | 9,475 | 9,344 | 9,686 |
|---|
2/17 | 9,664 | 9,450 | 9,892 |
|---|
3/17 | 9,814 | 9,494 | 10,080 |
|---|
4/17 | 10,007 | 9,616 | 10,269 |
|---|
5/17 | 10,104 | 9,765 | 10,376 |
|---|
6/17 | 10,219 | 9,757 | 10,485 |
|---|
7/17 | 10,306 | 9,921 | 10,565 |
|---|
8/17 | 10,332 | 10,019 | 10,605 |
|---|
9/17 | 10,362 | 9,929 | 10,642 |
|---|
10/17 | 10,431 | 9,891 | 10,682 |
|---|
11/17 | 10,429 | 10,001 | 10,690 |
|---|
12/17 | 10,444 | 10,035 | 10,709 |
|---|
1/18 | 10,393 | 10,155 | 10,592 |
|---|
2/18 | 10,352 | 10,065 | 10,595 |
|---|
3/18 | 10,322 | 10,172 | 10,580 |
|---|
4/18 | 10,283 | 10,009 | 10,527 |
|---|
5/18 | 10,232 | 9,933 | 10,557 |
|---|
6/18 | 10,242 | 9,889 | 10,604 |
|---|
7/18 | 10,314 | 9,872 | 10,671 |
|---|
8/18 | 10,365 | 9,883 | 10,775 |
|---|
9/18 | 10,327 | 9,798 | 10,716 |
|---|
10/18 | 10,217 | 9,688 | 10,556 |
|---|
11/18 | 10,069 | 9,718 | 10,364 |
|---|
12/18 | 9,947 | 9,915 | 10,233 |
|---|
1/19 | 10,334 | 10,066 | 10,761 |
|---|
2/19 | 10,469 | 10,008 | 10,941 |
|---|
3/19 | 10,585 | 10,133 | 11,084 |
|---|
4/19 | 10,722 | 10,103 | 11,236 |
|---|
5/19 | 10,744 | 10,240 | 11,273 |
|---|
6/19 | 10,949 | 10,467 | 11,465 |
|---|
7/19 | 11,086 | 10,438 | 11,657 |
|---|
8/19 | 11,173 | 10,650 | 11,769 |
|---|
9/19 | 11,266 | 10,542 | 11,847 |
|---|
10/19 | 11,393 | 10,612 | 11,965 |
|---|
11/19 | 11,451 | 10,532 | 11,966 |
|---|
12/19 | 11,554 | 10,593 | 12,114 |
|---|
1/20 | 11,703 | 10,728 | 12,261 |
|---|
2/20 | 11,542 | 10,801 | 11,998 |
|---|
3/20 | 10,132 | 10,559 | 10,725 |
|---|
4/20 | 10,839 | 10,766 | 11,553 |
|---|
5/20 | 11,047 | 10,813 | 11,773 |
|---|
6/20 | 11,154 | 10,909 | 11,792 |
|---|
7/20 | 11,499 | 11,257 | 12,273 |
|---|
8/20 | 11,706 | 11,240 | 12,491 |
|---|
9/20 | 11,635 | 11,199 | 12,391 |
|---|
10/20 | 11,689 | 11,210 | 12,469 |
|---|
11/20 | 12,032 | 11,414 | 12,838 |
|---|
12/20 | 12,161 | 11,567 | 13,038 |
|---|
1/21 | 12,140 | 11,465 | 12,941 |
|---|
2/21 | 12,108 | 11,268 | 12,835 |
|---|
3/21 | 12,146 | 11,051 | 12,984 |
|---|
4/21 | 12,313 | 11,191 | 13,151 |
|---|
5/21 | 12,352 | 11,296 | 13,228 |
|---|
6/21 | 12,473 | 11,196 | 13,405 |
|---|
7/21 | 12,523 | 11,345 | 13,463 |
|---|
8/21 | 12,562 | 11,298 | 13,489 |
|---|
9/21 | 12,560 | 11,097 | 13,486 |
|---|
10/21 | 12,514 | 11,071 | 13,474 |
|---|
11/21 | 12,385 | 11,038 | 13,287 |
|---|
12/21 | 12,496 | 11,023 | 13,484 |
|---|
1/22 | 12,285 | 10,797 | 13,153 |
|---|
2/22 | 11,936 | 10,669 | 12,736 |
|---|
3/22 | 11,856 | 10,344 | 12,630 |
|---|
4/22 | 11,509 | 9,777 | 12,090 |
|---|
5/22 | 11,419 | 9,804 | 12,124 |
|---|
6/22 | 11,460 | 9,691 | 12,227 |
|---|
8/22 | 11,270 | 9,308 | 11,945 |
|---|
9/22 | 10,790 | 8,769 | 11,209 |
|---|
10/22 | 11,047 | 9,182 | 11,614 |
|---|
11/22 | 11,123 | 9,232 | 11,482 |
|---|
12/22 | 11,685 | 9,535 | 12,474 |
|---|
1/23 | 11,526 | 9,218 | 12,235 |
|---|
2/23 | 10,898 | 9,509 | 11,654 |
|---|
3/23 | 11,030 | 9,551 | 11,833 |
|---|
4/23 | 10,996 | 9,365 | 11,695 |
|---|
5/23 | 11,103 | 9,364 | 11,811 |
|---|
6/23 | 11,341 | 9,429 | 12,000 |
|---|
7/23 | 11,296 | 9,300 | 11,923 |
|---|
9/23 | 11,209 | 9,028 | 11,787 |
|---|
10/23 | 11,031 | 8,920 | 11,432 |
|---|
11/23 | 11,483 | 9,370 | 12,161 |
|---|
12/23 | 11,820 | 9,759 | 12,549 |
|---|
1/24 | 12,038 | 9,625 | 12,876 |
|---|
2/24 | 12,098 | 9,504 | 12,986 |
|---|
3/24 | 12,252 | 9,556 | 13,119 |
|---|
4/24 | 12,139 | 9,315 | 12,849 |
|---|
5/24 | 12,335 | 9,437 | 13,100 |
|---|
6/24 | 12,424 | 9,451 | 13,181 |
|---|
7/24 | 12,568 | 9,712 | 13,312 |
|---|
8/24 | 12,756 | 9,941 | 13,658 |
|---|
9/24 | 12,981 | 10,111 | 13,986 |
|---|
10/24 | 12,920 | 9,772 | 13,878 |
|---|
11/24 | 12,983 | 9,805 | 13,940 |
|---|
12/24 | 12,952 | 9,595 | 13,755 |
|---|
1/25 | 13,043 | 9,649 | 13,844 |
|---|
2/25 | 13,150 | 9,787 | 13,995 |
|---|
3/25 | 13,116 | 9,847 | 13,835 |
|---|
4/25 | 13,028 | 10,137 | 13,698 |
|---|
5/25 | 13,220 | 10,101 | 13,856 |
|---|
6/25 | 13,404 | 10,292 | 14,090 |
|---|
7/25 | 13,522 | 10,139 | 14,257 |
|---|
8/25 | 13,615 | 10,286 | 14,428 |
|---|
9/25 | 13,792 | 10,354 | 14,644 |
|---|
10/25 | 13,844 | 10,327 | 14,677 |
|---|
11/25 | 13,846 | 10,351 | 14,627 |
|---|
12/25 | 13,940 | 10,378 | 14,686 |
|---|
1/26 | 14,028 | 10,475 | 14,845 |
|---|
2/26 | 14,129 | 10,593 | 14,939 |
|---|
3/26 | 13,800 | 10,267 | 14,593 |
|---|
4/26 | 14,068 | 10,395 | 14,881 |
|---|
5/26 | 14,097 | 10,430 | 14,906 |
|---|
6/26 | 14,161 | 10,356 | 14,919 |
|---|
7/26 | 14,069 | 10,301 | 14,848 |
|---|
8/26 | 14,110 | 10,348 | 14,861 |
|---|
|
|
| Average Annual Return [Table Text Block] |
|
Table SummaryName | 1-Year | 5-Year | 10-Year |
|---|
Class A Shares Excluding Sales Charge | 3.64% | 2.35% | 3.90% |
|---|
Class A Shares Including Sales Charge | -0.27% | 1.58% | 3.50% |
|---|
Bloomberg Global Aggregate Index | 0.60% | -1.74% | 0.34% |
|---|
ICE BofA US All Capital Securities Index | 3.00% | 1.96% | 4.04% |
|---|
|
|
| No Deduction of Taxes [Text Block] |
|
The graph above represents historical performance of a hypothetical investment of $10,000 in the Fund over the past ten years (or since inception if shorter). The table and graph above do not reflect the impact of taxes. If they did, performance would be lower.
|
|
| Performance Table Market Index Changed [Text Block] |
|
The Bloomberg Global Aggregate Index is the Fund's primary broad-based securities market index. The ICE BofA US All Capital Securities Index is included as an additional index for the Fund as it shows how the Fund’s performance compares with the returns of an index of funds with similar investment objectives.
|
|
| Updated Performance Information Location [Text Block] |
|
Visit www.principalam.com/mutualfundperformance for more recent performance information.
|
|
| AssetsNet |
|
$ 5,440,999,000
|
|
| Holdings Count | Holding |
|
349
|
|
| Advisory Fees Paid, Amount |
|
$ 35,578,000
|
|
| InvestmentCompanyPortfolioTurnover |
|
48.40%
|
|
| Additional Fund Statistics [Text Block] |
|
- Net Assets (amount in thousands)$5,440,999
- Total Number of Portfolio Holdings349
- Portfolio Turnover Rate 48.4%
- Total Advisory Fees Paid (amount in thousands)$35,578
|
|
| Holdings [Text Block] |
|
Table SummaryAsset Weighting | Percent of Net Assets |
|---|
Bonds | 82.14% | Preferred Stocks | 11.08% | Investment Companies | 8.34% | Convertible Preferred Stocks | 0.05% | Other Assets and Liabilities | (1.61)% | Total Net Assets | 100.00% | Table SummarySector | Percent of Net Assets |
|---|
Financial | 74.49% | Utilities | 10.14% | Money Market Funds | 6.95% | Energy | 5.09% | Communications | 2.29% | Government | 1.06% | Fixed Income Funds | 0.73% | Exchange-Traded Funds | 0.66% | Consumer, Non-cyclical | 0.20% | Other Assets and Liabilities | (1.61)% | Total Net Assets | 100.00% | |
|
| Material Fund Change [Text Block] |
|
There were no material changes to the Fund for the period September 1, 2025 to August 31, 2026. For more complete information, you may review the Fund's most recent prospectus at www.PrincipalAM.com/prospectuses. |
|
| C000038790 |
|
|
|
| Shareholder Report [Line Items] |
|
|
|
| Fund Name |
|
Spectrum Preferred and Capital Securities Income Fund
|
|
| Class Name |
|
Class C
|
|
| Trading Symbol |
|
PRFCX
|
|
| Annual or Semi-Annual Statement [Text Block] |
|
This annual shareholder report contains important information about Spectrum Preferred and Capital Securities Income Fund (the "Fund") for the period of September 1, 2025 to August 31, 2026.
|
|
| Shareholder Report Annual or Semi-Annual |
|
Annual Shareholder Report
|
|
| Additional Information [Text Block] |
|
You can find additional information about the Fund at www.PrincipalAM.com/prospectuses or you can request information by contacting us at 1-800-222-5852 or emailing prospectus@principalfunds.com.
|
|
| Additional Information Phone Number |
|
1-800-222-5852
|
|
| Additional Information Email |
|
<span style="box-sizing: border-box; color: rgb(0, 0, 0); display: inline; flex-wrap: nowrap; font-size: 10.6667px; font-weight: 400; grid-area: auto; line-height: 16px; margin: 0px; overflow: visible; text-align: left; text-align-last: auto; white-space-collapse: preserve-breaks;">prospectus@principalfunds.com</span>
|
|
| Additional Information Website |
|
<span style="box-sizing: border-box; color: rgb(0, 0, 0); display: inline; flex-wrap: nowrap; font-size: 10.6667px; font-weight: 400; grid-area: auto; line-height: 16px; margin: 0px; overflow: visible; text-align: left; text-align-last: auto; white-space-collapse: preserve-breaks;">www.PrincipalAM.com/prospectuses</span>
|
|
| Expenses [Text Block] |
|
What were the Fund costs for the last year? (based on a hypothetical $10,000 investment) Table SummaryClass Name | Costs of a $10,000 investment | Costs paid as a percentage of a $10,000 investment |
|---|
Class C | $184 | 1.81% |
|---|
|
|
| Expenses Paid, Amount |
|
$ 184
|
|
| Expense Ratio, Percent |
|
1.81%
|
|
| Factors Affecting Performance [Text Block] |
|
Management’s Discussion of Fund PerformanceThe Fund seeks to provide current income. The Fund invests at least 80% of its net assets in preferred securities and capital securities. Preferred securities typically include preferred stock and various types of junior subordinated debt and trust preferred securities. It also invests up to 55% of its assets in below-investment-grade preferred securities and bonds (sometimes called “high yield bonds” or “junk bonds”), which are rated at the time of purchase Ba1 or lower by Moody’s and BB+ or lower by S&P Global. The bond market spent the first four months of the fiscal year in an easing cycle and the final eight in a pause. The Fed cut rates by 25 basis points (bps) in September, October, and December bringing the target rate to 3.50%-3.75%, with the September move described as a "risk management cut" in response to sharply revised payrolls. Policy remained on hold through August, even as the bond market began pricing in hikes. Rates did not follow the Fed lower: the 5 year U.S. Treasury yield rose about 75bps to 4.50%, driven primarily by real rates, which climbed from 1.29% to 2.15%, while 5 year breakevens edged lower to 2.35%. Supply and term premium, rather than inflation expectations, drove the move. Spreads tightened into January, widened sharply in March when conflict with Iran pushed oil over $100 and the CBOE Volatility Index above 30. Hybrid prices had their worst month in two and a half years, then snapped back in April on a 10% equity rally and re-tightened through the summer. Allocation and security selection in banking and insurance industries were primary contributors to Fund investment performance in absolute terms and relative to the ICE BofA US All Capital Securities Index. Pipelines and utilities contributed positively but underweighted allocation in these sectors detracted from relative index performance. Telecommunications and an out-of-index allocation to ETFs also detracted. |
|
| Performance Past Does Not Indicate Future [Text] |
|
Past performance is not a good predictor of the Fund's future performance.
|
|
| Line Graph [Table Text Block] |
|
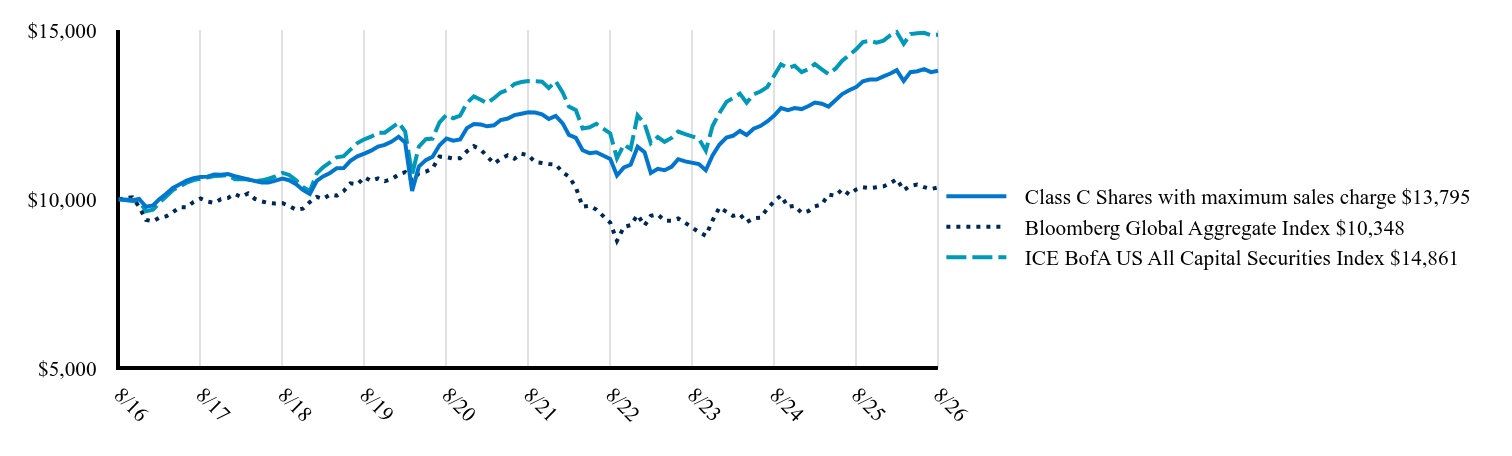 Table Summary | Class C Shares with maximum sales charge $13,795 | Bloomberg Global Aggregate Index $10,348 | ICE BofA US All Capital Securities Index $14,861 |
|---|
8/16 | 10,000 | 10,000 | 10,000 |
|---|
10/16 | 9,972 | 10,055 | 9,949 |
|---|
11/16 | 10,005 | 9,776 | 9,948 |
|---|
12/16 | 9,776 | 9,388 | 9,642 |
|---|
1/17 | 9,817 | 9,344 | 9,686 |
|---|
2/17 | 9,997 | 9,450 | 9,892 |
|---|
3/17 | 10,158 | 9,494 | 10,080 |
|---|
4/17 | 10,334 | 9,616 | 10,269 |
|---|
5/17 | 10,438 | 9,765 | 10,376 |
|---|
6/17 | 10,549 | 9,757 | 10,485 |
|---|
7/17 | 10,623 | 9,921 | 10,565 |
|---|
8/17 | 10,653 | 10,019 | 10,605 |
|---|
9/17 | 10,666 | 9,929 | 10,642 |
|---|
10/17 | 10,731 | 9,891 | 10,682 |
|---|
11/17 | 10,723 | 10,001 | 10,690 |
|---|
12/17 | 10,741 | 10,035 | 10,709 |
|---|
1/18 | 10,682 | 10,155 | 10,592 |
|---|
2/18 | 10,634 | 10,065 | 10,595 |
|---|
3/18 | 10,586 | 10,172 | 10,580 |
|---|
4/18 | 10,538 | 10,009 | 10,527 |
|---|
5/18 | 10,490 | 9,933 | 10,557 |
|---|
6/18 | 10,494 | 9,889 | 10,604 |
|---|
7/18 | 10,550 | 9,872 | 10,671 |
|---|
8/18 | 10,606 | 9,883 | 10,775 |
|---|
9/18 | 10,561 | 9,798 | 10,716 |
|---|
10/18 | 10,442 | 9,688 | 10,556 |
|---|
11/18 | 10,273 | 9,718 | 10,364 |
|---|
12/18 | 10,153 | 9,915 | 10,233 |
|---|
1/19 | 10,541 | 10,066 | 10,761 |
|---|
2/19 | 10,673 | 10,008 | 10,941 |
|---|
3/19 | 10,774 | 10,133 | 11,084 |
|---|
4/19 | 10,917 | 10,103 | 11,236 |
|---|
5/19 | 10,921 | 10,240 | 11,273 |
|---|
6/19 | 11,134 | 10,467 | 11,465 |
|---|
7/19 | 11,266 | 10,438 | 11,657 |
|---|
8/19 | 11,346 | 10,650 | 11,769 |
|---|
9/19 | 11,433 | 10,542 | 11,847 |
|---|
10/19 | 11,554 | 10,612 | 11,965 |
|---|
11/19 | 11,606 | 10,532 | 11,966 |
|---|
12/19 | 11,702 | 10,593 | 12,114 |
|---|
1/20 | 11,846 | 10,728 | 12,261 |
|---|
2/20 | 11,676 | 10,801 | 11,998 |
|---|
3/20 | 10,240 | 10,559 | 10,725 |
|---|
4/20 | 10,961 | 10,766 | 11,553 |
|---|
5/20 | 11,153 | 10,813 | 11,773 |
|---|
6/20 | 11,254 | 10,909 | 11,792 |
|---|
7/20 | 11,593 | 11,257 | 12,273 |
|---|
8/20 | 11,794 | 11,240 | 12,491 |
|---|
9/20 | 11,727 | 11,199 | 12,391 |
|---|
10/20 | 11,762 | 11,210 | 12,469 |
|---|
11/20 | 12,100 | 11,414 | 12,838 |
|---|
12/20 | 12,219 | 11,567 | 13,038 |
|---|
1/21 | 12,204 | 11,465 | 12,941 |
|---|
2/21 | 12,153 | 11,268 | 12,835 |
|---|
3/21 | 12,183 | 11,051 | 12,984 |
|---|
4/21 | 12,340 | 11,191 | 13,151 |
|---|
5/21 | 12,384 | 11,296 | 13,228 |
|---|
6/21 | 12,485 | 11,196 | 13,405 |
|---|
7/21 | 12,527 | 11,345 | 13,463 |
|---|
8/21 | 12,570 | 11,298 | 13,489 |
|---|
9/21 | 12,560 | 11,097 | 13,486 |
|---|
10/21 | 12,506 | 11,071 | 13,474 |
|---|
11/21 | 12,369 | 11,038 | 13,287 |
|---|
12/21 | 12,460 | 11,023 | 13,484 |
|---|
1/22 | 12,241 | 10,797 | 13,153 |
|---|
2/22 | 11,898 | 10,669 | 12,736 |
|---|
3/22 | 11,810 | 10,344 | 12,630 |
|---|
4/22 | 11,445 | 9,777 | 12,090 |
|---|
5/22 | 11,360 | 9,804 | 12,124 |
|---|
6/22 | 11,386 | 9,691 | 12,227 |
|---|
8/22 | 11,191 | 9,308 | 11,945 |
|---|
9/22 | 10,699 | 8,769 | 11,209 |
|---|
10/22 | 10,936 | 9,182 | 11,614 |
|---|
11/22 | 11,015 | 9,232 | 11,482 |
|---|
12/22 | 11,552 | 9,535 | 12,474 |
|---|
1/23 | 11,389 | 9,218 | 12,235 |
|---|
2/23 | 10,772 | 9,509 | 11,654 |
|---|
3/23 | 10,896 | 9,551 | 11,833 |
|---|
4/23 | 10,855 | 9,365 | 11,695 |
|---|
5/23 | 10,954 | 9,364 | 11,811 |
|---|
6/23 | 11,181 | 9,429 | 12,000 |
|---|
7/23 | 11,117 | 9,300 | 11,923 |
|---|
9/23 | 11,036 | 9,028 | 11,787 |
|---|
10/23 | 10,854 | 8,920 | 11,432 |
|---|
11/23 | 11,292 | 9,370 | 12,161 |
|---|
12/23 | 11,616 | 9,759 | 12,549 |
|---|
1/24 | 11,822 | 9,625 | 12,876 |
|---|
2/24 | 11,873 | 9,504 | 12,986 |
|---|
3/24 | 12,017 | 9,556 | 13,119 |
|---|
4/24 | 11,898 | 9,315 | 12,849 |
|---|
5/24 | 12,082 | 9,437 | 13,100 |
|---|
6/24 | 12,161 | 9,451 | 13,181 |
|---|
7/24 | 12,296 | 9,712 | 13,312 |
|---|
8/24 | 12,471 | 9,941 | 13,658 |
|---|
9/24 | 12,691 | 10,111 | 13,986 |
|---|
10/24 | 12,631 | 9,772 | 13,878 |
|---|
11/24 | 12,693 | 9,805 | 13,940 |
|---|
12/24 | 12,663 | 9,595 | 13,755 |
|---|
1/25 | 12,752 | 9,649 | 13,844 |
|---|
2/25 | 12,856 | 9,787 | 13,995 |
|---|
3/25 | 12,823 | 9,847 | 13,835 |
|---|
4/25 | 12,737 | 10,137 | 13,698 |
|---|
5/25 | 12,925 | 10,101 | 13,856 |
|---|
6/25 | 13,105 | 10,292 | 14,090 |
|---|
7/25 | 13,220 | 10,139 | 14,257 |
|---|
8/25 | 13,311 | 10,286 | 14,428 |
|---|
9/25 | 13,484 | 10,354 | 14,644 |
|---|
10/25 | 13,535 | 10,327 | 14,677 |
|---|
11/25 | 13,536 | 10,351 | 14,627 |
|---|
12/25 | 13,629 | 10,378 | 14,686 |
|---|
1/26 | 13,714 | 10,475 | 14,845 |
|---|
2/26 | 13,813 | 10,593 | 14,939 |
|---|
3/26 | 13,492 | 10,267 | 14,593 |
|---|
4/26 | 13,754 | 10,395 | 14,881 |
|---|
5/26 | 13,782 | 10,430 | 14,906 |
|---|
6/26 | 13,844 | 10,356 | 14,919 |
|---|
7/26 | 13,755 | 10,301 | 14,848 |
|---|
8/26 | 13,795 | 10,348 | 14,861 |
|---|
|
|
| Average Annual Return [Table Text Block] |
|
Table SummaryName | 1-Year | 5-Year | 10-Year |
|---|
Class C Shares Excluding Sales Charge | 2.84% | 1.56% | 3.27% |
|---|
Class C Shares Including Sales Charge | 1.86% | 1.56% | 3.27% |
|---|
Bloomberg Global Aggregate Index | 0.60% | -1.74% | 0.34% |
|---|
ICE BofA US All Capital Securities Index | 3.00% | 1.96% | 4.04% |
|---|
|
|
| No Deduction of Taxes [Text Block] |
|
The graph above represents historical performance of a hypothetical investment of $10,000 in the Fund over the past ten years (or since inception if shorter). The table and graph above do not reflect the impact of taxes. If they did, performance would be lower.
|
|
| Performance Table Market Index Changed [Text Block] |
|
The Bloomberg Global Aggregate Index is the Fund's primary broad-based securities market index. The ICE BofA US All Capital Securities Index is included as an additional index for the Fund as it shows how the Fund’s performance compares with the returns of an index of funds with similar investment objectives.
|
|
| Updated Performance Information Location [Text Block] |
|
Visit www.principalam.com/mutualfundperformance for more recent performance information.
|
|
| AssetsNet |
|
$ 5,440,999,000
|
|
| Holdings Count | Holding |
|
349
|
|
| Advisory Fees Paid, Amount |
|
$ 35,578,000
|
|
| InvestmentCompanyPortfolioTurnover |
|
48.40%
|
|
| Additional Fund Statistics [Text Block] |
|
- Net Assets (amount in thousands)$5,440,999
- Total Number of Portfolio Holdings349
- Portfolio Turnover Rate 48.4%
- Total Advisory Fees Paid (amount in thousands)$35,578
|
|
| Holdings [Text Block] |
|
Table SummaryAsset Weighting | Percent of Net Assets |
|---|
Bonds | 82.14% | Preferred Stocks | 11.08% | Investment Companies | 8.34% | Convertible Preferred Stocks | 0.05% | Other Assets and Liabilities | (1.61)% | Total Net Assets | 100.00% | Table SummarySector | Percent of Net Assets |
|---|
Financial | 74.49% | Utilities | 10.14% | Money Market Funds | 6.95% | Energy | 5.09% | Communications | 2.29% | Government | 1.06% | Fixed Income Funds | 0.73% | Exchange-Traded Funds | 0.66% | Consumer, Non-cyclical | 0.20% | Other Assets and Liabilities | (1.61)% | Total Net Assets | 100.00% | |
|
| Material Fund Change [Text Block] |
|
There were no material changes to the Fund for the period September 1, 2025 to August 31, 2026. For more complete information, you may review the Fund's most recent prospectus at www.PrincipalAM.com/prospectuses. |
|
| C000019596 |
|
|
|
| Shareholder Report [Line Items] |
|
|
|
| Fund Name |
|
Spectrum Preferred and Capital Securities Income Fund
|
|
| Class Name |
|
Class J
|
|
| Trading Symbol |
|
PPSJX
|
|
| Annual or Semi-Annual Statement [Text Block] |
|
This annual shareholder report contains important information about Spectrum Preferred and Capital Securities Income Fund (the "Fund") for the period of September 1, 2025 to August 31, 2026.
|
|
| Shareholder Report Annual or Semi-Annual |
|
Annual Shareholder Report
|
|
| Additional Information [Text Block] |
|
You can find additional information about the Fund at www.PrincipalAM.com/prospectuses or you can request information by contacting us at 1-800-222-5852 or emailing prospectus@principalfunds.com.
|
|
| Additional Information Phone Number |
|
1-800-222-5852
|
|
| Additional Information Email |
|
<span style="box-sizing: border-box; color: rgb(0, 0, 0); display: inline; flex-wrap: nowrap; font-size: 10.6667px; font-weight: 400; grid-area: auto; line-height: 16px; margin: 0px; overflow: visible; text-align: left; text-align-last: auto; white-space-collapse: preserve-breaks;">prospectus@principalfunds.com</span>
|
|
| Additional Information Website |
|
<span style="box-sizing: border-box; color: rgb(0, 0, 0); display: inline; flex-wrap: nowrap; font-size: 10.6667px; font-weight: 400; grid-area: auto; line-height: 16px; margin: 0px; overflow: visible; text-align: left; text-align-last: auto; white-space-collapse: preserve-breaks;">www.PrincipalAM.com/prospectuses</span>
|
|
| Expenses [Text Block] |
|
What were the Fund costs for the last year? (based on a hypothetical $10,000 investment) Table SummaryClass Name | Costs of a $10,000 investment | Costs paid as a percentage of a $10,000 investment |
|---|
Class J | $103 | 1.01% |
|---|
|
|
| Expenses Paid, Amount |
|
$ 103
|
|
| Expense Ratio, Percent |
|
1.01%
|
|
| Factors Affecting Performance [Text Block] |
|
Management’s Discussion of Fund PerformanceThe Fund seeks to provide current income. The Fund invests at least 80% of its net assets in preferred securities and capital securities. Preferred securities typically include preferred stock and various types of junior subordinated debt and trust preferred securities. It also invests up to 55% of its assets in below-investment-grade preferred securities and bonds (sometimes called “high yield bonds” or “junk bonds”), which are rated at the time of purchase Ba1 or lower by Moody’s and BB+ or lower by S&P Global. The bond market spent the first four months of the fiscal year in an easing cycle and the final eight in a pause. The Fed cut rates by 25 basis points (bps) in September, October, and December bringing the target rate to 3.50%-3.75%, with the September move described as a "risk management cut" in response to sharply revised payrolls. Policy remained on hold through August, even as the bond market began pricing in hikes. Rates did not follow the Fed lower: the 5 year U.S. Treasury yield rose about 75bps to 4.50%, driven primarily by real rates, which climbed from 1.29% to 2.15%, while 5 year breakevens edged lower to 2.35%. Supply and term premium, rather than inflation expectations, drove the move. Spreads tightened into January, widened sharply in March when conflict with Iran pushed oil over $100 and the CBOE Volatility Index above 30. Hybrid prices had their worst month in two and a half years, then snapped back in April on a 10% equity rally and re-tightened through the summer. Allocation and security selection in banking and insurance industries were primary contributors to Fund investment performance in absolute terms and relative to the ICE BofA US All Capital Securities Index. Pipelines and utilities contributed positively but underweighted allocation in these sectors detracted from relative index performance. Telecommunications and an out-of-index allocation to ETFs also detracted. |
|
| Performance Past Does Not Indicate Future [Text] |
|
Past performance is not a good predictor of the Fund's future performance.
|
|
| Line Graph [Table Text Block] |
|
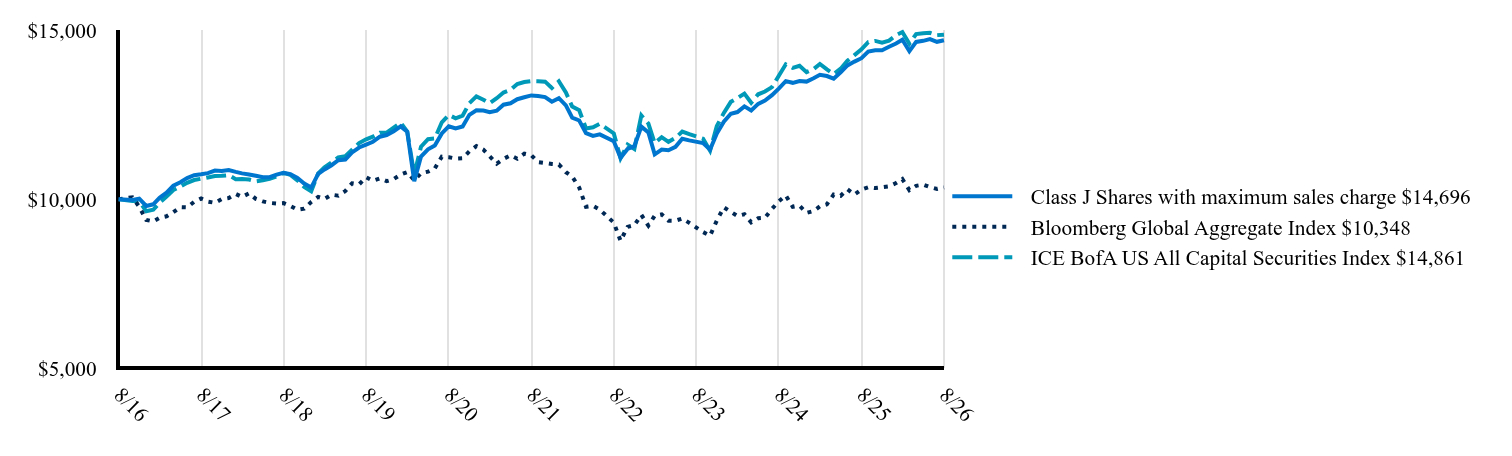 Table Summary | Class J Shares with maximum sales charge $14,696 | Bloomberg Global Aggregate Index $10,348 | ICE BofA US All Capital Securities Index $14,861 |
|---|
8/16 | 10,000 | 10,000 | 10,000 |
|---|
10/16 | 9,978 | 10,055 | 9,949 |
|---|
11/16 | 10,017 | 9,776 | 9,948 |
|---|
12/16 | 9,800 | 9,388 | 9,642 |
|---|
1/17 | 9,848 | 9,344 | 9,686 |
|---|
2/17 | 10,040 | 9,450 | 9,892 |
|---|
3/17 | 10,191 | 9,494 | 10,080 |
|---|
4/17 | 10,397 | 9,616 | 10,269 |
|---|
5/17 | 10,501 | 9,765 | 10,376 |
|---|
6/17 | 10,625 | 9,757 | 10,485 |
|---|
7/17 | 10,708 | 9,921 | 10,565 |
|---|
8/17 | 10,737 | 10,019 | 10,605 |
|---|
9/17 | 10,770 | 9,929 | 10,642 |
|---|
10/17 | 10,844 | 9,891 | 10,682 |
|---|
11/17 | 10,833 | 10,001 | 10,690 |
|---|
12/17 | 10,859 | 10,035 | 10,709 |
|---|
1/18 | 10,806 | 10,155 | 10,592 |
|---|
2/18 | 10,763 | 10,065 | 10,595 |
|---|
3/18 | 10,731 | 10,172 | 10,580 |
|---|
4/18 | 10,690 | 10,009 | 10,527 |
|---|
5/18 | 10,647 | 9,933 | 10,557 |
|---|
6/18 | 10,648 | 9,889 | 10,604 |
|---|
7/18 | 10,724 | 9,872 | 10,671 |
|---|
8/18 | 10,777 | 9,883 | 10,775 |
|---|
9/18 | 10,737 | 9,798 | 10,716 |
|---|
10/18 | 10,631 | 9,688 | 10,556 |
|---|
11/18 | 10,462 | 9,718 | 10,364 |
|---|
12/18 | 10,343 | 9,915 | 10,233 |
|---|
1/19 | 10,746 | 10,066 | 10,761 |
|---|
2/19 | 10,879 | 10,008 | 10,941 |
|---|
3/19 | 11,003 | 10,133 | 11,084 |
|---|
4/19 | 11,150 | 10,103 | 11,236 |
|---|
5/19 | 11,173 | 10,240 | 11,273 |
|---|
6/19 | 11,380 | 10,467 | 11,465 |
|---|
7/19 | 11,527 | 10,438 | 11,657 |
|---|
8/19 | 11,612 | 10,650 | 11,769 |
|---|
9/19 | 11,698 | 10,542 | 11,847 |
|---|
10/19 | 11,846 | 10,612 | 11,965 |
|---|
11/19 | 11,895 | 10,532 | 11,966 |
|---|
12/19 | 12,005 | 10,593 | 12,114 |
|---|
1/20 | 12,152 | 10,728 | 12,261 |
|---|
2/20 | 11,991 | 10,801 | 11,998 |
|---|
3/20 | 10,529 | 10,559 | 10,725 |
|---|
4/20 | 11,262 | 10,766 | 11,553 |
|---|
5/20 | 11,472 | 10,813 | 11,773 |
|---|
6/20 | 11,587 | 10,909 | 11,792 |
|---|
7/20 | 11,944 | 11,257 | 12,273 |
|---|
8/20 | 12,155 | 11,240 | 12,491 |
|---|
9/20 | 12,092 | 11,199 | 12,391 |
|---|
10/20 | 12,150 | 11,210 | 12,469 |
|---|
11/20 | 12,492 | 11,414 | 12,838 |
|---|
12/20 | 12,629 | 11,567 | 13,038 |
|---|
1/21 | 12,620 | 11,465 | 12,941 |
|---|
2/21 | 12,573 | 11,268 | 12,835 |
|---|
3/21 | 12,613 | 11,051 | 12,984 |
|---|
4/21 | 12,792 | 11,191 | 13,151 |
|---|
5/21 | 12,835 | 11,296 | 13,228 |
|---|
6/21 | 12,954 | 11,196 | 13,405 |
|---|
7/21 | 13,011 | 11,345 | 13,463 |
|---|
8/21 | 13,067 | 11,298 | 13,489 |
|---|
9/21 | 13,052 | 11,097 | 13,486 |
|---|
10/21 | 13,017 | 11,071 | 13,474 |
|---|
11/21 | 12,879 | 11,038 | 13,287 |
|---|
12/21 | 12,986 | 11,023 | 13,484 |
|---|
1/22 | 12,772 | 10,797 | 13,153 |
|---|
2/22 | 12,411 | 10,669 | 12,736 |
|---|
3/22 | 12,325 | 10,344 | 12,630 |
|---|
4/22 | 11,953 | 9,777 | 12,090 |
|---|
5/22 | 11,869 | 9,804 | 12,124 |
|---|
6/22 | 11,915 | 9,691 | 12,227 |
|---|
8/22 | 11,711 | 9,308 | 11,945 |
|---|
9/22 | 11,221 | 8,769 | 11,209 |
|---|
10/22 | 11,485 | 9,182 | 11,614 |
|---|
11/22 | 11,567 | 9,232 | 11,482 |
|---|
12/22 | 12,144 | 9,535 | 12,474 |
|---|
1/23 | 11,974 | 9,218 | 12,235 |
|---|
2/23 | 11,325 | 9,509 | 11,654 |
|---|
3/23 | 11,467 | 9,551 | 11,833 |
|---|
4/23 | 11,444 | 9,365 | 11,695 |
|---|
5/23 | 11,546 | 9,364 | 11,811 |
|---|
6/23 | 11,787 | 9,429 | 12,000 |
|---|
7/23 | 11,738 | 9,300 | 11,923 |
|---|
9/23 | 11,658 | 9,028 | 11,787 |
|---|
10/23 | 11,468 | 8,920 | 11,432 |
|---|
11/23 | 11,940 | 9,370 | 12,161 |
|---|
12/23 | 12,289 | 9,759 | 12,549 |
|---|
1/24 | 12,525 | 9,625 | 12,876 |
|---|
2/24 | 12,575 | 9,504 | 12,986 |
|---|
3/24 | 12,742 | 9,556 | 13,119 |
|---|
4/24 | 12,621 | 9,315 | 12,849 |
|---|
5/24 | 12,818 | 9,437 | 13,100 |
|---|
6/24 | 12,915 | 9,451 | 13,181 |
|---|
7/24 | 13,074 | 9,712 | 13,312 |
|---|
8/24 | 13,275 | 9,941 | 13,658 |
|---|
9/24 | 13,489 | 10,111 | 13,986 |
|---|
10/24 | 13,439 | 9,772 | 13,878 |
|---|
11/24 | 13,493 | 9,805 | 13,940 |
|---|
12/24 | 13,475 | 9,595 | 13,755 |
|---|
1/25 | 13,574 | 9,649 | 13,844 |
|---|
2/25 | 13,675 | 9,787 | 13,995 |
|---|
3/25 | 13,639 | 9,847 | 13,835 |
|---|
4/25 | 13,561 | 10,137 | 13,698 |
|---|
5/25 | 13,753 | 10,101 | 13,856 |
|---|
6/25 | 13,953 | 10,292 | 14,090 |
|---|
7/25 | 14,066 | 10,139 | 14,257 |
|---|
8/25 | 14,167 | 10,286 | 14,428 |
|---|
9/25 | 14,360 | 10,354 | 14,644 |
|---|
10/25 | 14,401 | 10,327 | 14,677 |
|---|
11/25 | 14,403 | 10,351 | 14,627 |
|---|
12/25 | 14,506 | 10,378 | 14,686 |
|---|
1/26 | 14,602 | 10,475 | 14,845 |
|---|
2/26 | 14,712 | 10,593 | 14,939 |
|---|
3/26 | 14,373 | 10,267 | 14,593 |
|---|
4/26 | 14,647 | 10,395 | 14,881 |
|---|
5/26 | 14,680 | 10,430 | 14,906 |
|---|
6/26 | 14,733 | 10,356 | 14,919 |
|---|
7/26 | 14,651 | 10,301 | 14,848 |
|---|
8/26 | 14,696 | 10,348 | 14,861 |
|---|
|
|
| Average Annual Return [Table Text Block] |
|
Table SummaryName | 1-Year | 5-Year | 10-Year |
|---|
Class J Shares Excluding Sales Charge | 3.73% | 2.38% | 3.93% |
|---|
Class J Shares Including Sales Charge | 2.75% | 2.38% | 3.93% |
|---|
Bloomberg Global Aggregate Index | 0.60% | -1.74% | 0.34% |
|---|
ICE BofA US All Capital Securities Index | 3.00% | 1.96% | 4.04% |
|---|
|
|
| No Deduction of Taxes [Text Block] |
|
The graph above represents historical performance of a hypothetical investment of $10,000 in the Fund over the past ten years (or since inception if shorter). The table and graph above do not reflect the impact of taxes. If they did, performance would be lower.
|
|
| Performance Table Market Index Changed [Text Block] |
|
The Bloomberg Global Aggregate Index is the Fund's primary broad-based securities market index. The ICE BofA US All Capital Securities Index is included as an additional index for the Fund as it shows how the Fund’s performance compares with the returns of an index of funds with similar investment objectives.
|
|
| Updated Performance Information Location [Text Block] |
|
Visit www.principalam.com/mutualfundperformance for more recent performance information.
|
|
| AssetsNet |
|
$ 5,440,999,000
|
|
| Holdings Count | Holding |
|
349
|
|
| Advisory Fees Paid, Amount |
|
$ 35,578,000
|
|
| InvestmentCompanyPortfolioTurnover |
|
48.40%
|
|
| Additional Fund Statistics [Text Block] |
|
- Net Assets (amount in thousands)$5,440,999
- Total Number of Portfolio Holdings349
- Portfolio Turnover Rate 48.4%
- Total Advisory Fees Paid (amount in thousands)$35,578
|
|
| Holdings [Text Block] |
|
Table SummaryAsset Weighting | Percent of Net Assets |
|---|
Bonds | 82.14% | Preferred Stocks | 11.08% | Investment Companies | 8.34% | Convertible Preferred Stocks | 0.05% | Other Assets and Liabilities | (1.61)% | Total Net Assets | 100.00% | Table SummarySector | Percent of Net Assets |
|---|
Financial | 74.49% | Utilities | 10.14% | Money Market Funds | 6.95% | Energy | 5.09% | Communications | 2.29% | Government | 1.06% | Fixed Income Funds | 0.73% | Exchange-Traded Funds | 0.66% | Consumer, Non-cyclical | 0.20% | Other Assets and Liabilities | (1.61)% | Total Net Assets | 100.00% | |
|
| Material Fund Change [Text Block] |
|
There were no material changes to the Fund for the period September 1, 2025 to August 31, 2026. For more complete information, you may review the Fund's most recent prospectus at www.PrincipalAM.com/prospectuses. |
|
| C000019595 |
|
|
|
| Shareholder Report [Line Items] |
|
|
|
| Fund Name |
|
Spectrum Preferred and Capital Securities Income Fund
|
|
| Class Name |
|
Institutional
|
|
| Trading Symbol |
|
PPSIX
|
|
| Annual or Semi-Annual Statement [Text Block] |
|
This annual shareholder report contains important information about Spectrum Preferred and Capital Securities Income Fund (the "Fund") for the period of September 1, 2025 to August 31, 2026.
|
|
| Shareholder Report Annual or Semi-Annual |
|
Annual Shareholder Report
|
|
| Additional Information [Text Block] |
|
You can find additional information about the Fund at www.PrincipalAM.com/prospectuses or you can request information by contacting us at 1-800-222-5852 or emailing prospectus@principalfunds.com.
|
|
| Additional Information Phone Number |
|
1-800-222-5852
|
|
| Additional Information Email |
|
<span style="box-sizing: border-box; color: rgb(0, 0, 0); display: inline; flex-wrap: nowrap; font-size: 10.6667px; font-weight: 400; grid-area: auto; line-height: 16px; margin: 0px; overflow: visible; text-align: left; text-align-last: auto; white-space-collapse: preserve-breaks;">prospectus@principalfunds.com</span>
|
|
| Additional Information Website |
|
<span style="box-sizing: border-box; color: rgb(0, 0, 0); display: inline; flex-wrap: nowrap; font-size: 10.6667px; font-weight: 400; grid-area: auto; line-height: 16px; margin: 0px; overflow: visible; text-align: left; text-align-last: auto; white-space-collapse: preserve-breaks;">www.PrincipalAM.com/prospectuses</span>
|
|
| Expenses [Text Block] |
|
What were the Fund costs for the last year? (based on a hypothetical $10,000 investment) Table SummaryClass Name | Costs of a $10,000 investment | Costs paid as a percentage of a $10,000 investment |
|---|
Institutional | $82 | 0.80% |
|---|
|
|
| Expenses Paid, Amount |
|
$ 82
|
|
| Expense Ratio, Percent |
|
0.80%
|
|
| Factors Affecting Performance [Text Block] |
|
Management’s Discussion of Fund PerformanceThe Fund seeks to provide current income. The Fund invests at least 80% of its net assets in preferred securities and capital securities. Preferred securities typically include preferred stock and various types of junior subordinated debt and trust preferred securities. It also invests up to 55% of its assets in below-investment-grade preferred securities and bonds (sometimes called “high yield bonds” or “junk bonds”), which are rated at the time of purchase Ba1 or lower by Moody’s and BB+ or lower by S&P Global. The bond market spent the first four months of the fiscal year in an easing cycle and the final eight in a pause. The Fed cut rates by 25 basis points (bps) in September, October, and December bringing the target rate to 3.50%-3.75%, with the September move described as a "risk management cut" in response to sharply revised payrolls. Policy remained on hold through August, even as the bond market began pricing in hikes. Rates did not follow the Fed lower: the 5 year U.S. Treasury yield rose about 75bps to 4.50%, driven primarily by real rates, which climbed from 1.29% to 2.15%, while 5 year breakevens edged lower to 2.35%. Supply and term premium, rather than inflation expectations, drove the move. Spreads tightened into January, widened sharply in March when conflict with Iran pushed oil over $100 and the CBOE Volatility Index above 30. Hybrid prices had their worst month in two and a half years, then snapped back in April on a 10% equity rally and re-tightened through the summer. Allocation and security selection in banking and insurance industries were primary contributors to Fund investment performance in absolute terms and relative to the ICE BofA US All Capital Securities Index. Pipelines and utilities contributed positively but underweighted allocation in these sectors detracted from relative index performance. Telecommunications and an out-of-index allocation to ETFs also detracted. |
|
| Performance Past Does Not Indicate Future [Text] |
|
Past performance is not a good predictor of the Fund's future performance.
|
|
| Line Graph [Table Text Block] |
|
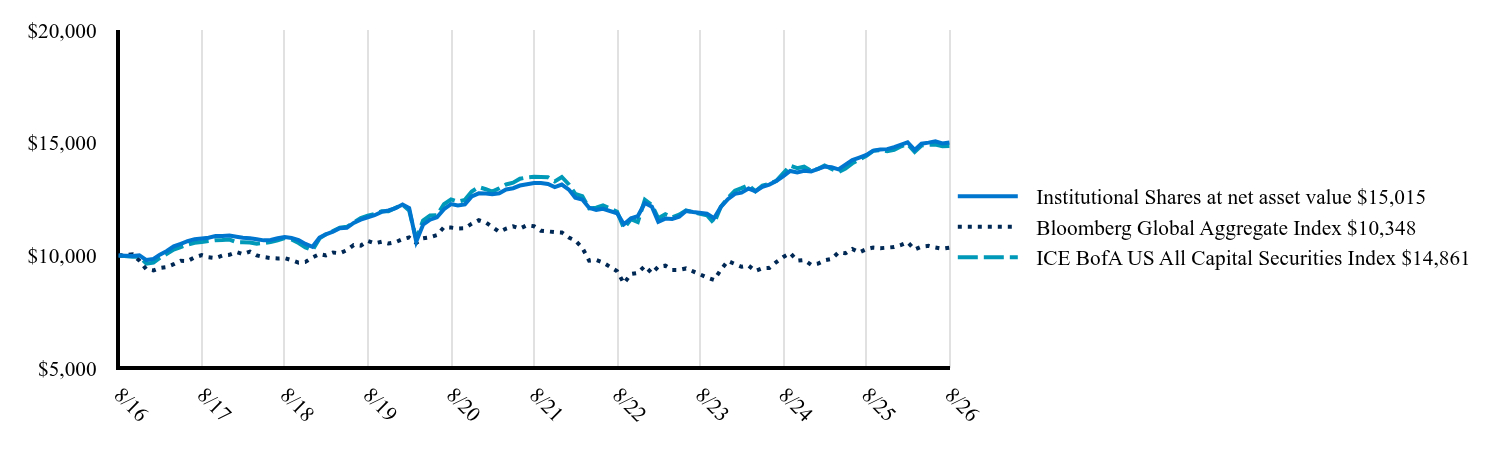 Table Summary | Institutional Shares at net asset value $15,015 | Bloomberg Global Aggregate Index $10,348 | ICE BofA US All Capital Securities Index $14,861 |
|---|
8/16 | 10,000 | 10,000 | 10,000 |
|---|
10/16 | 9,981 | 10,055 | 9,949 |
|---|
11/16 | 10,012 | 9,776 | 9,948 |
|---|
12/16 | 9,801 | 9,388 | 9,642 |
|---|
1/17 | 9,850 | 9,344 | 9,686 |
|---|
2/17 | 10,040 | 9,450 | 9,892 |
|---|
3/17 | 10,201 | 9,494 | 10,080 |
|---|
4/17 | 10,407 | 9,616 | 10,269 |
|---|
5/17 | 10,522 | 9,765 | 10,376 |
|---|
6/17 | 10,635 | 9,757 | 10,485 |
|---|
7/17 | 10,728 | 9,921 | 10,565 |
|---|
8/17 | 10,758 | 10,019 | 10,605 |
|---|
9/17 | 10,791 | 9,929 | 10,642 |
|---|
10/17 | 10,866 | 9,891 | 10,682 |
|---|
11/17 | 10,867 | 10,001 | 10,690 |
|---|
12/17 | 10,885 | 10,035 | 10,709 |
|---|
1/18 | 10,834 | 10,155 | 10,592 |
|---|
2/18 | 10,794 | 10,065 | 10,595 |
|---|
3/18 | 10,764 | 10,172 | 10,580 |
|---|
4/18 | 10,725 | 10,009 | 10,527 |
|---|
5/18 | 10,674 | 9,933 | 10,557 |
|---|
6/18 | 10,688 | 9,889 | 10,604 |
|---|
7/18 | 10,764 | 9,872 | 10,671 |
|---|
8/18 | 10,821 | 9,883 | 10,775 |
|---|
9/18 | 10,783 | 9,798 | 10,716 |
|---|
10/18 | 10,681 | 9,688 | 10,556 |
|---|
11/18 | 10,517 | 9,718 | 10,364 |
|---|
12/18 | 10,391 | 9,915 | 10,233 |
|---|
1/19 | 10,800 | 10,066 | 10,761 |
|---|
2/19 | 10,945 | 10,008 | 10,941 |
|---|
3/19 | 11,057 | 10,133 | 11,084 |
|---|
4/19 | 11,216 | 10,103 | 11,236 |
|---|
5/19 | 11,229 | 10,240 | 11,273 |
|---|
6/19 | 11,447 | 10,467 | 11,465 |
|---|
7/19 | 11,595 | 10,438 | 11,657 |
|---|
8/19 | 11,699 | 10,650 | 11,769 |
|---|
9/19 | 11,789 | 10,542 | 11,847 |
|---|
10/19 | 11,937 | 10,612 | 11,965 |
|---|
11/19 | 12,000 | 10,532 | 11,966 |
|---|
12/19 | 12,100 | 10,593 | 12,114 |
|---|
1/20 | 12,260 | 10,728 | 12,261 |
|---|
2/20 | 12,104 | 10,801 | 11,998 |
|---|
3/20 | 10,617 | 10,559 | 10,725 |
|---|
4/20 | 11,367 | 10,766 | 11,553 |
|---|
5/20 | 11,589 | 10,813 | 11,773 |
|---|
6/20 | 11,692 | 10,909 | 11,792 |
|---|
7/20 | 12,059 | 11,257 | 12,273 |
|---|
8/20 | 12,279 | 11,240 | 12,491 |
|---|
9/20 | 12,219 | 11,199 | 12,391 |
|---|
10/20 | 12,267 | 11,210 | 12,469 |
|---|
11/20 | 12,619 | 11,414 | 12,838 |
|---|
12/20 | 12,759 | 11,567 | 13,038 |
|---|
1/21 | 12,752 | 11,465 | 12,941 |
|---|
2/21 | 12,720 | 11,268 | 12,835 |
|---|
3/21 | 12,763 | 11,051 | 12,984 |
|---|
4/21 | 12,929 | 11,191 | 13,151 |
|---|
5/21 | 12,986 | 11,296 | 13,228 |
|---|
6/21 | 13,104 | 11,196 | 13,405 |
|---|
7/21 | 13,160 | 11,345 | 13,463 |
|---|
8/21 | 13,217 | 11,298 | 13,489 |
|---|
9/21 | 13,217 | 11,097 | 13,486 |
|---|
10/21 | 13,172 | 11,071 | 13,474 |
|---|
11/21 | 13,037 | 11,038 | 13,287 |
|---|
12/21 | 13,146 | 11,023 | 13,484 |
|---|
1/22 | 12,924 | 10,797 | 13,153 |
|---|
2/22 | 12,569 | 10,669 | 12,736 |
|---|
3/22 | 12,486 | 10,344 | 12,630 |
|---|
4/22 | 12,120 | 9,777 | 12,090 |
|---|
5/22 | 12,027 | 9,804 | 12,124 |
|---|
6/22 | 12,076 | 9,691 | 12,227 |
|---|
8/22 | 11,877 | 9,308 | 11,945 |
|---|
9/22 | 11,384 | 8,769 | 11,209 |
|---|
10/22 | 11,647 | 9,182 | 11,614 |
|---|
11/22 | 11,743 | 9,232 | 11,482 |
|---|
12/22 | 12,330 | 9,535 | 12,474 |
|---|
1/23 | 12,164 | 9,218 | 12,235 |
|---|
2/23 | 11,497 | 9,509 | 11,654 |
|---|
3/23 | 11,640 | 9,551 | 11,833 |
|---|
4/23 | 11,620 | 9,365 | 11,695 |
|---|
5/23 | 11,723 | 9,364 | 11,811 |
|---|
6/23 | 11,979 | 9,429 | 12,000 |
|---|
7/23 | 11,933 | 9,300 | 11,923 |
|---|
9/23 | 11,857 | 9,028 | 11,787 |
|---|
10/23 | 11,656 | 8,920 | 11,432 |
|---|
11/23 | 12,154 | 9,370 | 12,161 |
|---|
12/23 | 12,502 | 9,759 | 12,549 |
|---|
1/24 | 12,738 | 9,625 | 12,876 |
|---|
2/24 | 12,789 | 9,504 | 12,986 |
|---|
3/24 | 12,971 | 9,556 | 13,119 |
|---|
4/24 | 12,853 | 9,315 | 12,849 |
|---|
5/24 | 13,050 | 9,437 | 13,100 |
|---|
6/24 | 13,148 | 9,451 | 13,181 |
|---|
7/24 | 13,305 | 9,712 | 13,312 |
|---|
8/24 | 13,522 | 9,941 | 13,658 |
|---|
9/24 | 13,751 | 10,111 | 13,986 |
|---|
10/24 | 13,689 | 9,772 | 13,878 |
|---|
11/24 | 13,759 | 9,805 | 13,940 |
|---|
12/24 | 13,729 | 9,595 | 13,755 |
|---|
1/25 | 13,845 | 9,649 | 13,844 |
|---|
2/25 | 13,946 | 9,787 | 13,995 |
|---|
3/25 | 13,912 | 9,847 | 13,835 |
|---|
4/25 | 13,822 | 10,137 | 13,698 |
|---|
5/25 | 14,030 | 10,101 | 13,856 |
|---|
6/25 | 14,230 | 10,292 | 14,090 |
|---|
7/25 | 14,344 | 10,139 | 14,257 |
|---|
8/25 | 14,462 | 10,286 | 14,428 |
|---|
9/25 | 14,655 | 10,354 | 14,644 |
|---|
10/25 | 14,699 | 10,327 | 14,677 |
|---|
11/25 | 14,718 | 10,351 | 14,627 |
|---|
12/25 | 14,807 | 10,378 | 14,686 |
|---|
1/26 | 14,920 | 10,475 | 14,845 |
|---|
2/26 | 15,016 | 10,593 | 14,939 |
|---|
3/26 | 14,682 | 10,267 | 14,593 |
|---|
4/26 | 14,957 | 10,395 | 14,881 |
|---|
5/26 | 15,007 | 10,430 | 14,906 |
|---|
6/26 | 15,063 | 10,356 | 14,919 |
|---|
7/26 | 14,968 | 10,301 | 14,848 |
|---|
8/26 | 15,015 | 10,348 | 14,861 |
|---|
|
|
| Average Annual Return [Table Text Block] |
|
Table SummaryName | 1-Year | 5-Year | 10-Year |
|---|
Institutional Shares | 3.82% | 2.58% | 4.15% |
|---|
Bloomberg Global Aggregate Index | 0.60% | -1.74% | 0.34% |
|---|
ICE BofA US All Capital Securities Index | 3.00% | 1.96% | 4.04% |
|---|
|
|
| No Deduction of Taxes [Text Block] |
|
The graph above represents historical performance of a hypothetical investment of $10,000 in the Fund over the past ten years (or since inception if shorter). The table and graph above do not reflect the impact of taxes. If they did, performance would be lower.
|
|
| Performance Table Market Index Changed [Text Block] |
|
The Bloomberg Global Aggregate Index is the Fund's primary broad-based securities market index. The ICE BofA US All Capital Securities Index is included as an additional index for the Fund as it shows how the Fund’s performance compares with the returns of an index of funds with similar investment objectives.
|
|
| Updated Performance Information Location [Text Block] |
|
Visit www.principalam.com/mutualfundperformance for more recent performance information.
|
|
| AssetsNet |
|
$ 5,440,999,000
|
|
| Holdings Count | Holding |
|
349
|
|
| Advisory Fees Paid, Amount |
|
$ 35,578,000
|
|
| InvestmentCompanyPortfolioTurnover |
|
48.40%
|
|
| Additional Fund Statistics [Text Block] |
|
- Net Assets (amount in thousands)$5,440,999
- Total Number of Portfolio Holdings349
- Portfolio Turnover Rate 48.4%
- Total Advisory Fees Paid (amount in thousands)$35,578
|
|
| Holdings [Text Block] |
|
Table SummaryAsset Weighting | Percent of Net Assets |
|---|
Bonds | 82.14% | Preferred Stocks | 11.08% | Investment Companies | 8.34% | Convertible Preferred Stocks | 0.05% | Other Assets and Liabilities | (1.61)% | Total Net Assets | 100.00% | Table SummarySector | Percent of Net Assets |
|---|
Financial | 74.49% | Utilities | 10.14% | Money Market Funds | 6.95% | Energy | 5.09% | Communications | 2.29% | Government | 1.06% | Fixed Income Funds | 0.73% | Exchange-Traded Funds | 0.66% | Consumer, Non-cyclical | 0.20% | Other Assets and Liabilities | (1.61)% | Total Net Assets | 100.00% | |
|
| Material Fund Change [Text Block] |
|
There were no material changes to the Fund for the period September 1, 2025 to August 31, 2026. For more complete information, you may review the Fund's most recent prospectus at www.PrincipalAM.com/prospectuses. |
|
| C000019591 |
|
|
|
| Shareholder Report [Line Items] |
|
|
|
| Fund Name |
|
Spectrum Preferred and Capital Securities Income Fund
|
|
| Class Name |
|
R-3
|
|
| Trading Symbol |
|
PNARX
|
|
| Annual or Semi-Annual Statement [Text Block] |
|
This annual shareholder report contains important information about Spectrum Preferred and Capital Securities Income Fund (the "Fund") for the period of September 1, 2025 to August 31, 2026.
|
|
| Shareholder Report Annual or Semi-Annual |
|
Annual Shareholder Report
|
|
| Additional Information [Text Block] |
|
You can find additional information about the Fund at www.PrincipalAM.com/prospectuses or you can request information by contacting us at 1-800-222-5852 or emailing prospectus@principalfunds.com.
|
|
| Additional Information Phone Number |
|
1-800-222-5852
|
|
| Additional Information Email |
|
<span style="box-sizing: border-box; color: rgb(0, 0, 0); display: inline; flex-wrap: nowrap; font-size: 10.6667px; font-weight: 400; grid-area: auto; line-height: 16px; margin: 0px; overflow: visible; text-align: left; text-align-last: auto; white-space-collapse: preserve-breaks;">prospectus@principalfunds.com</span>
|
|
| Additional Information Website |
|
<span style="box-sizing: border-box; color: rgb(0, 0, 0); display: inline; flex-wrap: nowrap; font-size: 10.6667px; font-weight: 400; grid-area: auto; line-height: 16px; margin: 0px; overflow: visible; text-align: left; text-align-last: auto; white-space-collapse: preserve-breaks;">www.PrincipalAM.com/prospectuses</span>
|
|
| Expenses [Text Block] |
|
What were the Fund costs for the last year? (based on a hypothetical $10,000 investment) Table SummaryClass Name | Costs of a $10,000 investment | Costs paid as a percentage of a $10,000 investment |
|---|
R-3 | $129 | 1.27% |
|---|
|
|
| Expenses Paid, Amount |
|
$ 129
|
|
| Expense Ratio, Percent |
|
1.27%
|
|
| Factors Affecting Performance [Text Block] |
|
Management’s Discussion of Fund PerformanceThe Fund seeks to provide current income. The Fund invests at least 80% of its net assets in preferred securities and capital securities. Preferred securities typically include preferred stock and various types of junior subordinated debt and trust preferred securities. It also invests up to 55% of its assets in below-investment-grade preferred securities and bonds (sometimes called “high yield bonds” or “junk bonds”), which are rated at the time of purchase Ba1 or lower by Moody’s and BB+ or lower by S&P Global. The bond market spent the first four months of the fiscal year in an easing cycle and the final eight in a pause. The Fed cut rates by 25 basis points (bps) in September, October, and December bringing the target rate to 3.50%-3.75%, with the September move described as a "risk management cut" in response to sharply revised payrolls. Policy remained on hold through August, even as the bond market began pricing in hikes. Rates did not follow the Fed lower: the 5 year U.S. Treasury yield rose about 75bps to 4.50%, driven primarily by real rates, which climbed from 1.29% to 2.15%, while 5 year breakevens edged lower to 2.35%. Supply and term premium, rather than inflation expectations, drove the move. Spreads tightened into January, widened sharply in March when conflict with Iran pushed oil over $100 and the CBOE Volatility Index above 30. Hybrid prices had their worst month in two and a half years, then snapped back in April on a 10% equity rally and re-tightened through the summer. Allocation and security selection in banking and insurance industries were primary contributors to Fund investment performance in absolute terms and relative to the ICE BofA US All Capital Securities Index. Pipelines and utilities contributed positively but underweighted allocation in these sectors detracted from relative index performance. Telecommunications and an out-of-index allocation to ETFs also detracted. |
|
| Performance Past Does Not Indicate Future [Text] |
|
Past performance is not a good predictor of the Fund's future performance.
|
|
| Line Graph [Table Text Block] |
|
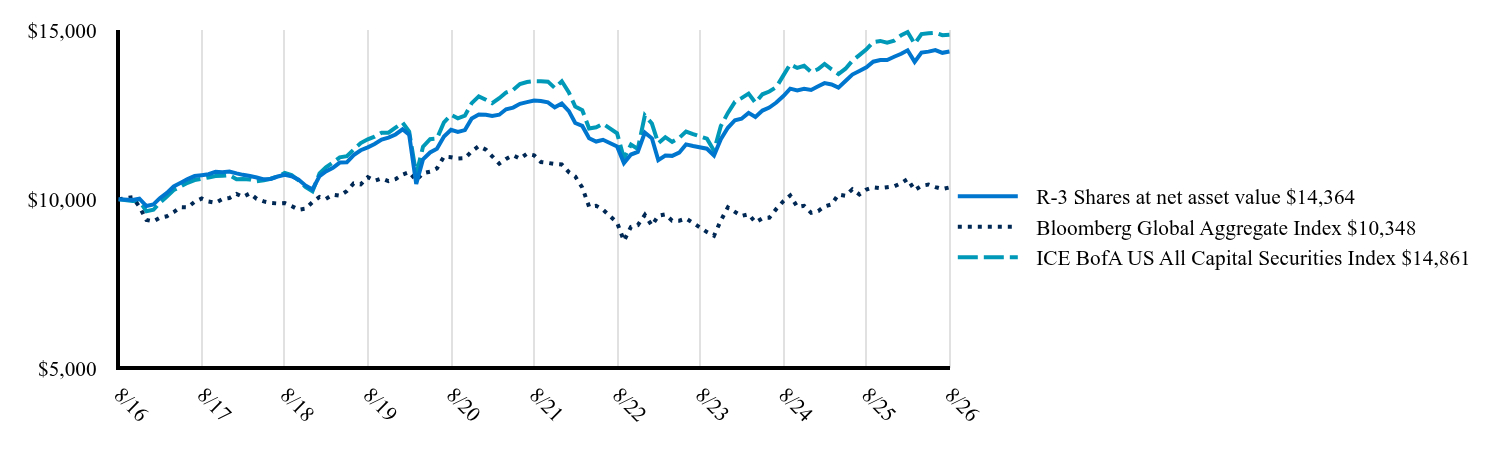 Table Summary | R-3 Shares at net asset value $14,364 | Bloomberg Global Aggregate Index $10,348 | ICE BofA US All Capital Securities Index $14,861 |
|---|
8/16 | 10,000 | 10,000 | 10,000 |
|---|
10/16 | 9,976 | 10,055 | 9,949 |
|---|
11/16 | 10,013 | 9,776 | 9,948 |
|---|
12/16 | 9,796 | 9,388 | 9,642 |
|---|
1/17 | 9,842 | 9,344 | 9,686 |
|---|
2/17 | 10,030 | 9,450 | 9,892 |
|---|
3/17 | 10,186 | 9,494 | 10,080 |
|---|
4/17 | 10,375 | 9,616 | 10,269 |
|---|
5/17 | 10,485 | 9,765 | 10,376 |
|---|
6/17 | 10,594 | 9,757 | 10,485 |
|---|
7/17 | 10,683 | 9,921 | 10,565 |
|---|
8/17 | 10,709 | 10,019 | 10,605 |
|---|
9/17 | 10,738 | 9,929 | 10,642 |
|---|
10/17 | 10,808 | 9,891 | 10,682 |
|---|
11/17 | 10,795 | 10,001 | 10,690 |
|---|
12/17 | 10,818 | 10,035 | 10,709 |
|---|
1/18 | 10,763 | 10,155 | 10,592 |
|---|
2/18 | 10,719 | 10,065 | 10,595 |
|---|
3/18 | 10,685 | 10,172 | 10,580 |
|---|
4/18 | 10,642 | 10,009 | 10,527 |
|---|
5/18 | 10,587 | 9,933 | 10,557 |
|---|
6/18 | 10,596 | 9,889 | 10,604 |
|---|
7/18 | 10,669 | 9,872 | 10,671 |
|---|
8/18 | 10,721 | 9,883 | 10,775 |
|---|
9/18 | 10,679 | 9,798 | 10,716 |
|---|
10/18 | 10,574 | 9,688 | 10,556 |
|---|
11/18 | 10,405 | 9,718 | 10,364 |
|---|
12/18 | 10,287 | 9,915 | 10,233 |
|---|
1/19 | 10,680 | 10,066 | 10,761 |
|---|
2/19 | 10,820 | 10,008 | 10,941 |
|---|
3/19 | 10,928 | 10,133 | 11,084 |
|---|
4/19 | 11,082 | 10,103 | 11,236 |
|---|
5/19 | 11,091 | 10,240 | 11,273 |
|---|
6/19 | 11,303 | 10,467 | 11,465 |
|---|
7/19 | 11,445 | 10,438 | 11,657 |
|---|
8/19 | 11,533 | 10,650 | 11,769 |
|---|
9/19 | 11,629 | 10,542 | 11,847 |
|---|
10/19 | 11,760 | 10,612 | 11,965 |
|---|
11/19 | 11,819 | 10,532 | 11,966 |
|---|
12/19 | 11,912 | 10,593 | 12,114 |
|---|
1/20 | 12,066 | 10,728 | 12,261 |
|---|
2/20 | 11,907 | 10,801 | 11,998 |
|---|
3/20 | 10,452 | 10,559 | 10,725 |
|---|
4/20 | 11,179 | 10,766 | 11,553 |
|---|
5/20 | 11,381 | 10,813 | 11,773 |
|---|
6/20 | 11,491 | 10,909 | 11,792 |
|---|
7/20 | 11,849 | 11,257 | 12,273 |
|---|
8/20 | 12,051 | 11,240 | 12,491 |
|---|
9/20 | 11,987 | 11,199 | 12,391 |
|---|
10/20 | 12,042 | 11,210 | 12,469 |
|---|
11/20 | 12,386 | 11,414 | 12,838 |
|---|
12/20 | 12,505 | 11,567 | 13,038 |
|---|
1/21 | 12,494 | 11,465 | 12,941 |
|---|
2/21 | 12,458 | 11,268 | 12,835 |
|---|
3/21 | 12,496 | 11,051 | 12,984 |
|---|
4/21 | 12,656 | 11,191 | 13,151 |
|---|
5/21 | 12,707 | 11,296 | 13,228 |
|---|
6/21 | 12,818 | 11,196 | 13,405 |
|---|
7/21 | 12,868 | 11,345 | 13,463 |
|---|
8/21 | 12,918 | 11,298 | 13,489 |
|---|
9/21 | 12,900 | 11,097 | 13,486 |
|---|
10/21 | 12,863 | 11,071 | 13,474 |
|---|
11/21 | 12,713 | 11,038 | 13,287 |
|---|
12/21 | 12,827 | 11,023 | 13,484 |
|---|
1/22 | 12,604 | 10,797 | 13,153 |
|---|
2/22 | 12,250 | 10,669 | 12,736 |
|---|
3/22 | 12,164 | 10,344 | 12,630 |
|---|
4/22 | 11,800 | 9,777 | 12,090 |
|---|
5/22 | 11,704 | 9,804 | 12,124 |
|---|
6/22 | 11,756 | 9,691 | 12,227 |
|---|
8/22 | 11,558 | 9,308 | 11,945 |
|---|
9/22 | 11,066 | 8,769 | 11,209 |
|---|
10/22 | 11,320 | 9,182 | 11,614 |
|---|
11/22 | 11,396 | 9,232 | 11,482 |
|---|
12/22 | 11,967 | 9,535 | 12,474 |
|---|
1/23 | 11,799 | 9,218 | 12,235 |
|---|
2/23 | 11,155 | 9,509 | 11,654 |
|---|
3/23 | 11,291 | 9,551 | 11,833 |
|---|
4/23 | 11,280 | 9,365 | 11,695 |
|---|
5/23 | 11,375 | 9,364 | 11,811 |
|---|
6/23 | 11,620 | 9,429 | 12,000 |
|---|
7/23 | 11,571 | 9,300 | 11,923 |
|---|
9/23 | 11,492 | 9,028 | 11,787 |
|---|
10/23 | 11,292 | 8,920 | 11,432 |
|---|
11/23 | 11,774 | 9,370 | 12,161 |
|---|
12/23 | 12,109 | 9,759 | 12,549 |
|---|
1/24 | 12,334 | 9,625 | 12,876 |
|---|
2/24 | 12,379 | 9,504 | 12,986 |
|---|
3/24 | 12,551 | 9,556 | 13,119 |
|---|
4/24 | 12,431 | 9,315 | 12,849 |
|---|
5/24 | 12,619 | 9,437 | 13,100 |
|---|
6/24 | 12,709 | 9,451 | 13,181 |
|---|
7/24 | 12,856 | 9,712 | 13,312 |
|---|
8/24 | 13,048 | 9,941 | 13,658 |
|---|
9/24 | 13,266 | 10,111 | 13,986 |
|---|
10/24 | 13,214 | 9,772 | 13,878 |
|---|
11/24 | 13,264 | 9,805 | 13,940 |
|---|
12/24 | 13,228 | 9,595 | 13,755 |
|---|
1/25 | 13,335 | 9,649 | 13,844 |
|---|
2/25 | 13,429 | 9,787 | 13,995 |
|---|
3/25 | 13,391 | 9,847 | 13,835 |
|---|
4/25 | 13,298 | 10,137 | 13,698 |
|---|
5/25 | 13,494 | 10,101 | 13,856 |
|---|
6/25 | 13,683 | 10,292 | 14,090 |
|---|
7/25 | 13,788 | 10,139 | 14,257 |
|---|
8/25 | 13,897 | 10,286 | 14,428 |
|---|
9/25 | 14,063 | 10,354 | 14,644 |
|---|
10/25 | 14,114 | 10,327 | 14,677 |
|---|
11/25 | 14,114 | 10,351 | 14,627 |
|---|
12/25 | 14,209 | 10,378 | 14,686 |
|---|
1/26 | 14,297 | 10,475 | 14,845 |
|---|
2/26 | 14,400 | 10,593 | 14,939 |
|---|
3/26 | 14,057 | 10,267 | 14,593 |
|---|
4/26 | 14,331 | 10,395 | 14,881 |
|---|
5/26 | 14,360 | 10,430 | 14,906 |
|---|
6/26 | 14,407 | 10,356 | 14,919 |
|---|
7/26 | 14,325 | 10,301 | 14,848 |
|---|
8/26 | 14,364 | 10,348 | 14,861 |
|---|
|
|
| Average Annual Return [Table Text Block] |
|
Table SummaryName | 1-Year | 5-Year | 10-Year |
|---|
R-3 Shares | 3.37% | 2.14% | 3.69% |
|---|
Bloomberg Global Aggregate Index | 0.60% | -1.74% | 0.34% |
|---|
ICE BofA US All Capital Securities Index | 3.00% | 1.96% | 4.04% |
|---|
|
|
| No Deduction of Taxes [Text Block] |
|
The graph above represents historical performance of a hypothetical investment of $10,000 in the Fund over the past ten years (or since inception if shorter). The table and graph above do not reflect the impact of taxes. If they did, performance would be lower.
|
|
| Performance Table Market Index Changed [Text Block] |
|
The Bloomberg Global Aggregate Index is the Fund's primary broad-based securities market index. The ICE BofA US All Capital Securities Index is included as an additional index for the Fund as it shows how the Fund’s performance compares with the returns of an index of funds with similar investment objectives.
|
|
| Updated Performance Information Location [Text Block] |
|
Visit www.principalam.com/mutualfundperformance for more recent performance information.
|
|
| AssetsNet |
|
$ 5,440,999,000
|
|
| Holdings Count | Holding |
|
349
|
|
| Advisory Fees Paid, Amount |
|
$ 35,578,000
|
|
| InvestmentCompanyPortfolioTurnover |
|
48.40%
|
|
| Additional Fund Statistics [Text Block] |
|
- Net Assets (amount in thousands)$5,440,999
- Total Number of Portfolio Holdings349
- Portfolio Turnover Rate 48.4%
- Total Advisory Fees Paid (amount in thousands)$35,578
|
|
| Holdings [Text Block] |
|
Table SummaryAsset Weighting | Percent of Net Assets |
|---|
Bonds | 82.14% | Preferred Stocks | 11.08% | Investment Companies | 8.34% | Convertible Preferred Stocks | 0.05% | Other Assets and Liabilities | (1.61)% | Total Net Assets | 100.00% | Table SummarySector | Percent of Net Assets |
|---|
Financial | 74.49% | Utilities | 10.14% | Money Market Funds | 6.95% | Energy | 5.09% | Communications | 2.29% | Government | 1.06% | Fixed Income Funds | 0.73% | Exchange-Traded Funds | 0.66% | Consumer, Non-cyclical | 0.20% | Other Assets and Liabilities | (1.61)% | Total Net Assets | 100.00% | |
|
| Material Fund Change [Text Block] |
|
There were no material changes to the Fund for the period September 1, 2025 to August 31, 2026. For more complete information, you may review the Fund's most recent prospectus at www.PrincipalAM.com/prospectuses. |
|
| C000019592 |
|
|
|
| Shareholder Report [Line Items] |
|
|
|
| Fund Name |
|
Spectrum Preferred and Capital Securities Income Fund
|
|
| Class Name |
|
R-5
|
|
| Trading Symbol |
|
PPARX
|
|
| Annual or Semi-Annual Statement [Text Block] |
|
This annual shareholder report contains important information about Spectrum Preferred and Capital Securities Income Fund (the "Fund") for the period of September 1, 2025 to August 31, 2026.
|
|
| Shareholder Report Annual or Semi-Annual |
|
Annual Shareholder Report
|
|
| Additional Information [Text Block] |
|
You can find additional information about the Fund at www.PrincipalAM.com/prospectuses or you can request information by contacting us at 1-800-222-5852 or emailing prospectus@principalfunds.com.
|
|
| Additional Information Phone Number |
|
1-800-222-5852
|
|
| Additional Information Email |
|
<span style="box-sizing: border-box; color: rgb(0, 0, 0); display: inline; flex-wrap: nowrap; font-size: 10.6667px; font-weight: 400; grid-area: auto; line-height: 16px; margin: 0px; overflow: visible; text-align: left; text-align-last: auto; white-space-collapse: preserve-breaks;">prospectus@principalfunds.com</span>
|
|
| Additional Information Website |
|
<span style="box-sizing: border-box; color: rgb(0, 0, 0); display: inline; flex-wrap: nowrap; font-size: 10.6667px; font-weight: 400; grid-area: auto; line-height: 16px; margin: 0px; overflow: visible; text-align: left; text-align-last: auto; white-space-collapse: preserve-breaks;">www.PrincipalAM.com/prospectuses</span>
|
|
| Expenses [Text Block] |
|
What were the Fund costs for the last year? (based on a hypothetical $10,000 investment) Table SummaryClass Name | Costs of a $10,000 investment | Costs paid as a percentage of a $10,000 investment |
|---|
R-5 | $98 | 0.96% |
|---|
|
|
| Expenses Paid, Amount |
|
$ 98
|
|
| Expense Ratio, Percent |
|
0.96%
|
|
| Factors Affecting Performance [Text Block] |
|
Management’s Discussion of Fund PerformanceThe Fund seeks to provide current income. The Fund invests at least 80% of its net assets in preferred securities and capital securities. Preferred securities typically include preferred stock and various types of junior subordinated debt and trust preferred securities. It also invests up to 55% of its assets in below-investment-grade preferred securities and bonds (sometimes called “high yield bonds” or “junk bonds”), which are rated at the time of purchase Ba1 or lower by Moody’s and BB+ or lower by S&P Global. The bond market spent the first four months of the fiscal year in an easing cycle and the final eight in a pause. The Fed cut rates by 25 basis points (bps) in September, October, and December bringing the target rate to 3.50%-3.75%, with the September move described as a "risk management cut" in response to sharply revised payrolls. Policy remained on hold through August, even as the bond market began pricing in hikes. Rates did not follow the Fed lower: the 5 year U.S. Treasury yield rose about 75bps to 4.50%, driven primarily by real rates, which climbed from 1.29% to 2.15%, while 5 year breakevens edged lower to 2.35%. Supply and term premium, rather than inflation expectations, drove the move. Spreads tightened into January, widened sharply in March when conflict with Iran pushed oil over $100 and the CBOE Volatility Index above 30. Hybrid prices had their worst month in two and a half years, then snapped back in April on a 10% equity rally and re-tightened through the summer. Allocation and security selection in banking and insurance industries were primary contributors to Fund investment performance in absolute terms and relative to the ICE BofA US All Capital Securities Index. Pipelines and utilities contributed positively but underweighted allocation in these sectors detracted from relative index performance. Telecommunications and an out-of-index allocation to ETFs also detracted. |
|
| Performance Past Does Not Indicate Future [Text] |
|
Past performance is not a good predictor of the Fund's future performance.
|
|
| Line Graph [Table Text Block] |
|
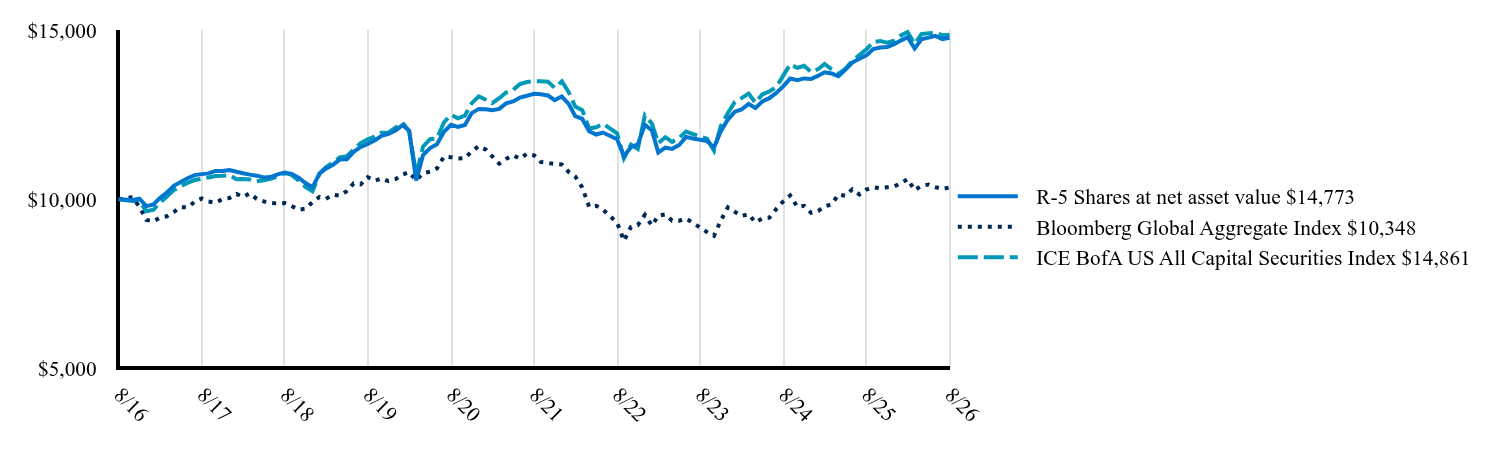 Table Summary | R-5 Shares at net asset value $14,773 | Bloomberg Global Aggregate Index $10,348 | ICE BofA US All Capital Securities Index $14,861 |
|---|
8/16 | 10,000 | 10,000 | 10,000 |
|---|
10/16 | 9,979 | 10,055 | 9,949 |
|---|
11/16 | 10,018 | 9,776 | 9,948 |
|---|
12/16 | 9,794 | 9,388 | 9,642 |
|---|
1/17 | 9,843 | 9,344 | 9,686 |
|---|
2/17 | 10,032 | 9,450 | 9,892 |
|---|
3/17 | 10,191 | 9,494 | 10,080 |
|---|
4/17 | 10,395 | 9,616 | 10,269 |
|---|
5/17 | 10,508 | 9,765 | 10,376 |
|---|
6/17 | 10,620 | 9,757 | 10,485 |
|---|
7/17 | 10,712 | 9,921 | 10,565 |
|---|
8/17 | 10,740 | 10,019 | 10,605 |
|---|
9/17 | 10,762 | 9,929 | 10,642 |
|---|
10/17 | 10,835 | 9,891 | 10,682 |
|---|
11/17 | 10,835 | 10,001 | 10,690 |
|---|
12/17 | 10,861 | 10,035 | 10,709 |
|---|
1/18 | 10,809 | 10,155 | 10,592 |
|---|
2/18 | 10,767 | 10,065 | 10,595 |
|---|
3/18 | 10,725 | 10,172 | 10,580 |
|---|
4/18 | 10,695 | 10,009 | 10,527 |
|---|
5/18 | 10,643 | 9,933 | 10,557 |
|---|
6/18 | 10,655 | 9,889 | 10,604 |
|---|
7/18 | 10,731 | 9,872 | 10,671 |
|---|
8/18 | 10,786 | 9,883 | 10,775 |
|---|
9/18 | 10,747 | 9,798 | 10,716 |
|---|
10/18 | 10,633 | 9,688 | 10,556 |
|---|
11/18 | 10,478 | 9,718 | 10,364 |
|---|
12/18 | 10,351 | 9,915 | 10,233 |
|---|
1/19 | 10,758 | 10,066 | 10,761 |
|---|
2/19 | 10,902 | 10,008 | 10,941 |
|---|
3/19 | 11,013 | 10,133 | 11,084 |
|---|
4/19 | 11,170 | 10,103 | 11,236 |
|---|
5/19 | 11,182 | 10,240 | 11,273 |
|---|
6/19 | 11,399 | 10,467 | 11,465 |
|---|
7/19 | 11,545 | 10,438 | 11,657 |
|---|
8/19 | 11,636 | 10,650 | 11,769 |
|---|
9/19 | 11,736 | 10,542 | 11,847 |
|---|
10/19 | 11,871 | 10,612 | 11,965 |
|---|
11/19 | 11,932 | 10,532 | 11,966 |
|---|
12/19 | 12,030 | 10,593 | 12,114 |
|---|
1/20 | 12,188 | 10,728 | 12,261 |
|---|
2/20 | 12,031 | 10,801 | 11,998 |
|---|
3/20 | 10,556 | 10,559 | 10,725 |
|---|
4/20 | 11,304 | 10,766 | 11,553 |
|---|
5/20 | 11,512 | 10,813 | 11,773 |
|---|
6/20 | 11,626 | 10,909 | 11,792 |
|---|
7/20 | 11,990 | 11,257 | 12,273 |
|---|
8/20 | 12,197 | 11,240 | 12,491 |
|---|
9/20 | 12,135 | 11,199 | 12,391 |
|---|
10/20 | 12,193 | 11,210 | 12,469 |
|---|
11/20 | 12,544 | 11,414 | 12,838 |
|---|
12/20 | 12,668 | 11,567 | 13,038 |
|---|
1/21 | 12,660 | 11,465 | 12,941 |
|---|
2/21 | 12,627 | 11,268 | 12,835 |
|---|
3/21 | 12,668 | 11,051 | 12,984 |
|---|
4/21 | 12,832 | 11,191 | 13,151 |
|---|
5/21 | 12,887 | 11,296 | 13,228 |
|---|
6/21 | 13,003 | 11,196 | 13,405 |
|---|
7/21 | 13,058 | 11,345 | 13,463 |
|---|
8/21 | 13,112 | 11,298 | 13,489 |
|---|
9/21 | 13,099 | 11,097 | 13,486 |
|---|
10/21 | 13,064 | 11,071 | 13,474 |
|---|
11/21 | 12,928 | 11,038 | 13,287 |
|---|
12/21 | 13,034 | 11,023 | 13,484 |
|---|
1/22 | 12,811 | 10,797 | 13,153 |
|---|
2/22 | 12,456 | 10,669 | 12,736 |
|---|
3/22 | 12,372 | 10,344 | 12,630 |
|---|
4/22 | 12,006 | 9,777 | 12,090 |
|---|
5/22 | 11,911 | 9,804 | 12,124 |
|---|
6/22 | 11,970 | 9,691 | 12,227 |
|---|
8/22 | 11,769 | 9,308 | 11,945 |
|---|
9/22 | 11,275 | 8,769 | 11,209 |
|---|
10/22 | 11,536 | 9,182 | 11,614 |
|---|
11/22 | 11,617 | 9,232 | 11,482 |
|---|
12/22 | 12,199 | 9,535 | 12,474 |
|---|
1/23 | 12,032 | 9,218 | 12,235 |
|---|
2/23 | 11,381 | 9,509 | 11,654 |
|---|
3/23 | 11,522 | 9,551 | 11,833 |
|---|
4/23 | 11,487 | 9,365 | 11,695 |
|---|
5/23 | 11,602 | 9,364 | 11,811 |
|---|
6/23 | 11,840 | 9,429 | 12,000 |
|---|
7/23 | 11,794 | 9,300 | 11,923 |
|---|
9/23 | 11,717 | 9,028 | 11,787 |
|---|
10/23 | 11,529 | 8,920 | 11,432 |
|---|
11/23 | 12,009 | 9,370 | 12,161 |
|---|
12/23 | 12,353 | 9,759 | 12,549 |
|---|
1/24 | 12,586 | 9,625 | 12,876 |
|---|
2/24 | 12,650 | 9,504 | 12,986 |
|---|
3/24 | 12,815 | 9,556 | 13,119 |
|---|
4/24 | 12,696 | 9,315 | 12,849 |
|---|
5/24 | 12,890 | 9,437 | 13,100 |
|---|
6/24 | 12,985 | 9,451 | 13,181 |
|---|
7/24 | 13,139 | 9,712 | 13,312 |
|---|
8/24 | 13,339 | 9,941 | 13,658 |
|---|
9/24 | 13,565 | 10,111 | 13,986 |
|---|
10/24 | 13,516 | 9,772 | 13,878 |
|---|
11/24 | 13,569 | 9,805 | 13,940 |
|---|
12/24 | 13,552 | 9,595 | 13,755 |
|---|
1/25 | 13,650 | 9,649 | 13,844 |
|---|
2/25 | 13,749 | 9,787 | 13,995 |
|---|
3/25 | 13,714 | 9,847 | 13,835 |
|---|
4/25 | 13,637 | 10,137 | 13,698 |
|---|
5/25 | 13,827 | 10,101 | 13,856 |
|---|
6/25 | 14,039 | 10,292 | 14,090 |
|---|
7/25 | 14,150 | 10,139 | 14,257 |
|---|
8/25 | 14,249 | 10,286 | 14,428 |
|---|
9/25 | 14,439 | 10,354 | 14,644 |
|---|
10/25 | 14,480 | 10,327 | 14,677 |
|---|
11/25 | 14,498 | 10,351 | 14,627 |
|---|
12/25 | 14,584 | 10,378 | 14,686 |
|---|
1/26 | 14,694 | 10,475 | 14,845 |
|---|
2/26 | 14,788 | 10,593 | 14,939 |
|---|
3/26 | 14,455 | 10,267 | 14,593 |
|---|
4/26 | 14,725 | 10,395 | 14,881 |
|---|
5/26 | 14,773 | 10,430 | 14,906 |
|---|
6/26 | 14,826 | 10,356 | 14,919 |
|---|
7/26 | 14,730 | 10,301 | 14,848 |
|---|
8/26 | 14,773 | 10,348 | 14,861 |
|---|
|
|
| Average Annual Return [Table Text Block] |
|
Table SummaryName | 1-Year | 5-Year | 10-Year |
|---|
R-5 Shares | 3.68% | 2.41% | 3.98% |
|---|
Bloomberg Global Aggregate Index | 0.60% | -1.74% | 0.34% |
|---|
ICE BofA US All Capital Securities Index | 3.00% | 1.96% | 4.04% |
|---|
|
|
| No Deduction of Taxes [Text Block] |
|
The graph above represents historical performance of a hypothetical investment of $10,000 in the Fund over the past ten years (or since inception if shorter). The table and graph above do not reflect the impact of taxes. If they did, performance would be lower.
|
|
| Performance Table Market Index Changed [Text Block] |
|
The Bloomberg Global Aggregate Index is the Fund's primary broad-based securities market index. The ICE BofA US All Capital Securities Index is included as an additional index for the Fund as it shows how the Fund’s performance compares with the returns of an index of funds with similar investment objectives.
|
|
| Updated Performance Information Location [Text Block] |
|
Visit www.principalam.com/mutualfundperformance for more recent performance information.
|
|
| AssetsNet |
|
$ 5,440,999,000
|
|
| Holdings Count | Holding |
|
349
|
|
| Advisory Fees Paid, Amount |
|
$ 35,578,000
|
|
| InvestmentCompanyPortfolioTurnover |
|
48.40%
|
|
| Additional Fund Statistics [Text Block] |
|
- Net Assets (amount in thousands)$5,440,999
- Total Number of Portfolio Holdings349
- Portfolio Turnover Rate 48.4%
- Total Advisory Fees Paid (amount in thousands)$35,578
|
|
| Holdings [Text Block] |
|
Table SummaryAsset Weighting | Percent of Net Assets |
|---|
Bonds | 82.14% | Preferred Stocks | 11.08% | Investment Companies | 8.34% | Convertible Preferred Stocks | 0.05% | Other Assets and Liabilities | (1.61)% | Total Net Assets | 100.00% | Table SummarySector | Percent of Net Assets |
|---|
Financial | 74.49% | Utilities | 10.14% | Money Market Funds | 6.95% | Energy | 5.09% | Communications | 2.29% | Government | 1.06% | Fixed Income Funds | 0.73% | Exchange-Traded Funds | 0.66% | Consumer, Non-cyclical | 0.20% | Other Assets and Liabilities | (1.61)% | Total Net Assets | 100.00% | |
|
| Material Fund Change [Text Block] |
|
There were no material changes to the Fund for the period September 1, 2025 to August 31, 2026. For more complete information, you may review the Fund's most recent prospectus at www.PrincipalAM.com/prospectuses. |
|
| C000176328 |
|
|
|
| Shareholder Report [Line Items] |
|
|
|
| Fund Name |
|
Spectrum Preferred and Capital Securities Income Fund
|
|
| Class Name |
|
R-6
|
|
| Trading Symbol |
|
PPREX
|
|
| Annual or Semi-Annual Statement [Text Block] |
|
This annual shareholder report contains important information about Spectrum Preferred and Capital Securities Income Fund (the "Fund") for the period of September 1, 2025 to August 31, 2026.
|
|
| Shareholder Report Annual or Semi-Annual |
|
Annual Shareholder Report
|
|
| Additional Information [Text Block] |
|
You can find additional information about the Fund at www.PrincipalAM.com/prospectuses or you can request information by contacting us at 1-800-222-5852 or emailing prospectus@principalfunds.com.
|
|
| Additional Information Phone Number |
|
1-800-222-5852
|
|
| Additional Information Email |
|
<span style="box-sizing: border-box; color: rgb(0, 0, 0); display: inline; flex-wrap: nowrap; font-size: 10.6667px; font-weight: 400; grid-area: auto; line-height: 16px; margin: 0px; overflow: visible; text-align: left; text-align-last: auto; white-space-collapse: preserve-breaks;">prospectus@principalfunds.com</span>
|
|
| Additional Information Website |
|
<span style="box-sizing: border-box; color: rgb(0, 0, 0); display: inline; flex-wrap: nowrap; font-size: 10.6667px; font-weight: 400; grid-area: auto; line-height: 16px; margin: 0px; overflow: visible; text-align: left; text-align-last: auto; white-space-collapse: preserve-breaks;">www.PrincipalAM.com/prospectuses</span>
|
|
| Expenses [Text Block] |
|
What were the Fund costs for the last year? (based on a hypothetical $10,000 investment) Table SummaryClass Name | Costs of a $10,000 investment | Costs paid as a percentage of a $10,000 investment |
|---|
R-6 | $72 | 0.71% |
|---|
|
|
| Expenses Paid, Amount |
|
$ 72
|
|
| Expense Ratio, Percent |
|
0.71%
|
|
| Factors Affecting Performance [Text Block] |
|
Management’s Discussion of Fund PerformanceThe Fund seeks to provide current income. The Fund invests at least 80% of its net assets in preferred securities and capital securities. Preferred securities typically include preferred stock and various types of junior subordinated debt and trust preferred securities. It also invests up to 55% of its assets in below-investment-grade preferred securities and bonds (sometimes called “high yield bonds” or “junk bonds”), which are rated at the time of purchase Ba1 or lower by Moody’s and BB+ or lower by S&P Global. The bond market spent the first four months of the fiscal year in an easing cycle and the final eight in a pause. The Fed cut rates by 25 basis points (bps) in September, October, and December bringing the target rate to 3.50%-3.75%, with the September move described as a "risk management cut" in response to sharply revised payrolls. Policy remained on hold through August, even as the bond market began pricing in hikes. Rates did not follow the Fed lower: the 5 year U.S. Treasury yield rose about 75bps to 4.50%, driven primarily by real rates, which climbed from 1.29% to 2.15%, while 5 year breakevens edged lower to 2.35%. Supply and term premium, rather than inflation expectations, drove the move. Spreads tightened into January, widened sharply in March when conflict with Iran pushed oil over $100 and the CBOE Volatility Index above 30. Hybrid prices had their worst month in two and a half years, then snapped back in April on a 10% equity rally and re-tightened through the summer. Allocation and security selection in banking and insurance industries were primary contributors to Fund investment performance in absolute terms and relative to the ICE BofA US All Capital Securities Index. Pipelines and utilities contributed positively but underweighted allocation in these sectors detracted from relative index performance. Telecommunications and an out-of-index allocation to ETFs also detracted. |
|
| Performance Past Does Not Indicate Future [Text] |
|
Past performance is not a good predictor of the Fund's future performance.
|
|
| Line Graph [Table Text Block] |
|
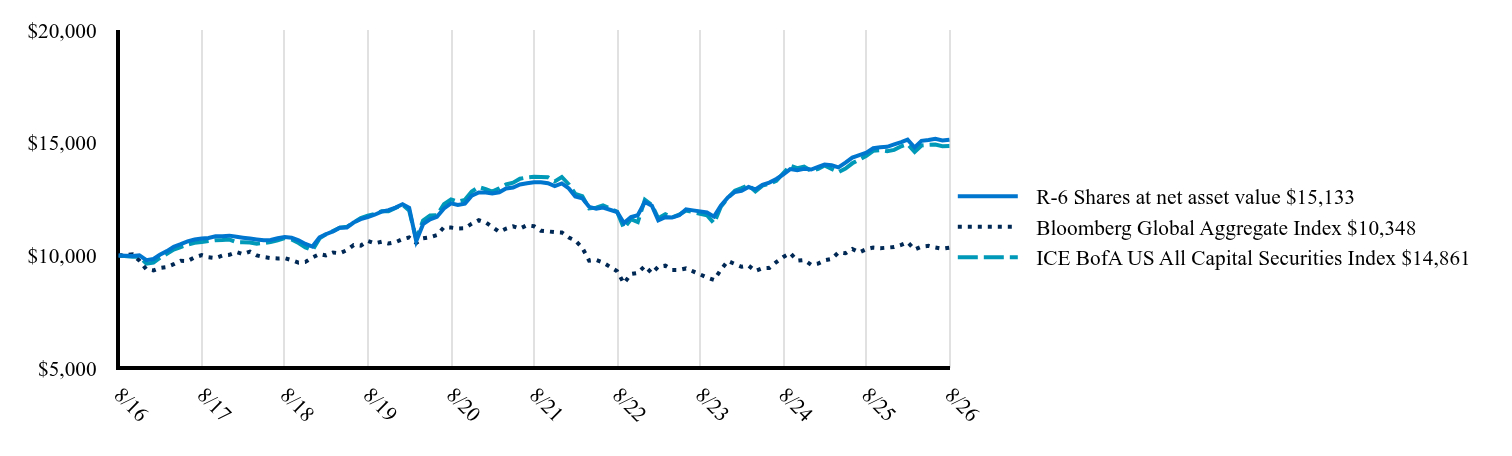 Table Summary | R-6 Shares at net asset value $15,133 | Bloomberg Global Aggregate Index $10,348 | ICE BofA US All Capital Securities Index $14,861 |
|---|
8/16 | 10,000 | 10,000 | 10,000 |
|---|
10/16 | 9,980 | 10,055 | 9,949 |
|---|
11/16 | 10,010 | 9,776 | 9,948 |
|---|
12/16 | 9,798 | 9,388 | 9,642 |
|---|
1/17 | 9,847 | 9,344 | 9,686 |
|---|
2/17 | 10,037 | 9,450 | 9,892 |
|---|
3/17 | 10,196 | 9,494 | 10,080 |
|---|
4/17 | 10,392 | 9,616 | 10,269 |
|---|
5/17 | 10,505 | 9,765 | 10,376 |
|---|
6/17 | 10,629 | 9,757 | 10,485 |
|---|
7/17 | 10,713 | 9,921 | 10,565 |
|---|
8/17 | 10,753 | 10,019 | 10,605 |
|---|
9/17 | 10,777 | 9,929 | 10,642 |
|---|
10/17 | 10,853 | 9,891 | 10,682 |
|---|
11/17 | 10,854 | 10,001 | 10,690 |
|---|
12/17 | 10,883 | 10,035 | 10,709 |
|---|
1/18 | 10,833 | 10,155 | 10,592 |
|---|
2/18 | 10,794 | 10,065 | 10,595 |
|---|
3/18 | 10,754 | 10,172 | 10,580 |
|---|
4/18 | 10,716 | 10,009 | 10,527 |
|---|
5/18 | 10,677 | 9,933 | 10,557 |
|---|
6/18 | 10,692 | 9,889 | 10,604 |
|---|
7/18 | 10,770 | 9,872 | 10,671 |
|---|
8/18 | 10,827 | 9,883 | 10,775 |
|---|
9/18 | 10,790 | 9,798 | 10,716 |
|---|
10/18 | 10,679 | 9,688 | 10,556 |
|---|
11/18 | 10,515 | 9,718 | 10,364 |
|---|
12/18 | 10,401 | 9,915 | 10,233 |
|---|
1/19 | 10,811 | 10,066 | 10,761 |
|---|
2/19 | 10,946 | 10,008 | 10,941 |
|---|
3/19 | 11,070 | 10,133 | 11,084 |
|---|
4/19 | 11,230 | 10,103 | 11,236 |
|---|
5/19 | 11,245 | 10,240 | 11,273 |
|---|
6/19 | 11,463 | 10,467 | 11,465 |
|---|
7/19 | 11,612 | 10,438 | 11,657 |
|---|
8/19 | 11,706 | 10,650 | 11,769 |
|---|
9/19 | 11,809 | 10,542 | 11,847 |
|---|
10/19 | 11,946 | 10,612 | 11,965 |
|---|
11/19 | 12,011 | 10,532 | 11,966 |
|---|
12/19 | 12,123 | 10,593 | 12,114 |
|---|
1/20 | 12,273 | 10,728 | 12,261 |
|---|
2/20 | 12,117 | 10,801 | 11,998 |
|---|
3/20 | 10,640 | 10,559 | 10,725 |
|---|
4/20 | 11,393 | 10,766 | 11,553 |
|---|
5/20 | 11,604 | 10,813 | 11,773 |
|---|
6/20 | 11,721 | 10,909 | 11,792 |
|---|
7/20 | 12,090 | 11,257 | 12,273 |
|---|
8/20 | 12,312 | 11,240 | 12,491 |
|---|
9/20 | 12,240 | 11,199 | 12,391 |
|---|
10/20 | 12,301 | 11,210 | 12,469 |
|---|
11/20 | 12,656 | 11,414 | 12,838 |
|---|
12/20 | 12,797 | 11,567 | 13,038 |
|---|
1/21 | 12,791 | 11,465 | 12,941 |
|---|
2/21 | 12,748 | 11,268 | 12,835 |
|---|
3/21 | 12,804 | 11,051 | 12,984 |
|---|
4/21 | 12,972 | 11,191 | 13,151 |
|---|
5/21 | 13,018 | 11,296 | 13,228 |
|---|
6/21 | 13,150 | 11,196 | 13,405 |
|---|
7/21 | 13,208 | 11,345 | 13,463 |
|---|
8/21 | 13,253 | 11,298 | 13,489 |
|---|
9/21 | 13,254 | 11,097 | 13,486 |
|---|
10/21 | 13,210 | 11,071 | 13,474 |
|---|
11/21 | 13,076 | 11,038 | 13,287 |
|---|
12/21 | 13,199 | 11,023 | 13,484 |
|---|
1/22 | 12,977 | 10,797 | 13,153 |
|---|
2/22 | 12,621 | 10,669 | 12,736 |
|---|
3/22 | 12,540 | 10,344 | 12,630 |
|---|
4/22 | 12,161 | 9,777 | 12,090 |
|---|
5/22 | 12,081 | 9,804 | 12,124 |
|---|
6/22 | 12,132 | 9,691 | 12,227 |
|---|
8/22 | 11,932 | 9,308 | 11,945 |
|---|
9/22 | 11,439 | 8,769 | 11,209 |
|---|
10/22 | 11,704 | 9,182 | 11,614 |
|---|
11/22 | 11,789 | 9,232 | 11,482 |
|---|
12/22 | 12,379 | 9,535 | 12,474 |
|---|
1/23 | 12,213 | 9,218 | 12,235 |
|---|
2/23 | 11,558 | 9,509 | 11,654 |
|---|
3/23 | 11,703 | 9,551 | 11,833 |
|---|
4/23 | 11,684 | 9,365 | 11,695 |
|---|
5/23 | 11,789 | 9,364 | 11,811 |
|---|
6/23 | 12,047 | 9,429 | 12,000 |
|---|
7/23 | 12,003 | 9,300 | 11,923 |
|---|
9/23 | 11,913 | 9,028 | 11,787 |
|---|
10/23 | 11,726 | 8,920 | 11,432 |
|---|
11/23 | 12,214 | 9,370 | 12,161 |
|---|
12/23 | 12,579 | 9,759 | 12,549 |
|---|
1/24 | 12,818 | 9,625 | 12,876 |
|---|
2/24 | 12,871 | 9,504 | 12,986 |
|---|
3/24 | 13,040 | 9,556 | 13,119 |
|---|
4/24 | 12,937 | 9,315 | 12,849 |
|---|
5/24 | 13,137 | 9,437 | 13,100 |
|---|
6/24 | 13,236 | 9,451 | 13,181 |
|---|
7/24 | 13,395 | 9,712 | 13,312 |
|---|
8/24 | 13,601 | 9,941 | 13,658 |
|---|
9/24 | 13,832 | 10,111 | 13,986 |
|---|
10/24 | 13,785 | 9,772 | 13,878 |
|---|
11/24 | 13,843 | 9,805 | 13,940 |
|---|
12/24 | 13,813 | 9,595 | 13,755 |
|---|
1/25 | 13,931 | 9,649 | 13,844 |
|---|
2/25 | 14,035 | 9,787 | 13,995 |
|---|
3/25 | 14,002 | 9,847 | 13,835 |
|---|
4/25 | 13,911 | 10,137 | 13,698 |
|---|
5/25 | 14,122 | 10,101 | 13,856 |
|---|
6/25 | 14,341 | 10,292 | 14,090 |
|---|
7/25 | 14,457 | 10,139 | 14,257 |
|---|
8/25 | 14,561 | 10,286 | 14,428 |
|---|
9/25 | 14,757 | 10,354 | 14,644 |
|---|
10/25 | 14,802 | 10,327 | 14,677 |
|---|
11/25 | 14,823 | 10,351 | 14,627 |
|---|
12/25 | 14,930 | 10,378 | 14,686 |
|---|
1/26 | 15,029 | 10,475 | 14,845 |
|---|
2/26 | 15,143 | 10,593 | 14,939 |
|---|
3/26 | 14,792 | 10,267 | 14,593 |
|---|
4/26 | 15,086 | 10,395 | 14,881 |
|---|
5/26 | 15,122 | 10,430 | 14,906 |
|---|
6/26 | 15,179 | 10,356 | 14,919 |
|---|
7/26 | 15,101 | 10,301 | 14,848 |
|---|
8/26 | 15,133 | 10,348 | 14,861 |
|---|
|
|
| Average Annual Return [Table Text Block] |
|
Table SummaryName | 1-Year | 5-Year | 10-YearFootnote Reference* |
|---|
R-6 Shares | 3.93% | 2.69% | 4.23% |
|---|
Bloomberg Global Aggregate Index | 0.60% | -1.74% | 0.34% |
|---|
ICE BofA US All Capital Securities Index | 3.00% | 1.96% | 4.04% |
|---|
|
|
| Performance Inception Date |
|
May 01, 2002
|
|
| No Deduction of Taxes [Text Block] |
|
The graph above represents historical performance of a hypothetical investment of $10,000 in the Fund over the past ten years (or since inception if shorter). The table and graph above do not reflect the impact of taxes. If they did, performance would be lower.
|
|
| Performance Table Market Index Changed [Text Block] |
|
The Bloomberg Global Aggregate Index is the Fund's primary broad-based securities market index. The ICE BofA US All Capital Securities Index is included as an additional index for the Fund as it shows how the Fund’s performance compares with the returns of an index of funds with similar investment objectives.
|
|
| Updated Performance Information Location [Text Block] |
|
Visit www.principalam.com/mutualfundperformance for more recent performance information.
|
|
| AssetsNet |
|
$ 5,440,999,000
|
|
| Holdings Count | Holding |
|
349
|
|
| Advisory Fees Paid, Amount |
|
$ 35,578,000
|
|
| InvestmentCompanyPortfolioTurnover |
|
48.40%
|
|
| Additional Fund Statistics [Text Block] |
|
- Net Assets (amount in thousands)$5,440,999
- Total Number of Portfolio Holdings349
- Portfolio Turnover Rate 48.4%
- Total Advisory Fees Paid (amount in thousands)$35,578
|
|
| Holdings [Text Block] |
|
Table SummaryAsset Weighting | Percent of Net Assets |
|---|
Bonds | 82.14% | Preferred Stocks | 11.08% | Investment Companies | 8.34% | Convertible Preferred Stocks | 0.05% | Other Assets and Liabilities | (1.61)% | Total Net Assets | 100.00% | Table SummarySector | Percent of Net Assets |
|---|
Financial | 74.49% | Utilities | 10.14% | Money Market Funds | 6.95% | Energy | 5.09% | Communications | 2.29% | Government | 1.06% | Fixed Income Funds | 0.73% | Exchange-Traded Funds | 0.66% | Consumer, Non-cyclical | 0.20% | Other Assets and Liabilities | (1.61)% | Total Net Assets | 100.00% | |
|
| Material Fund Change [Text Block] |
|
There were no material changes to the Fund for the period September 1, 2025 to August 31, 2026. For more complete information, you may review the Fund's most recent prospectus at www.PrincipalAM.com/prospectuses. |
|
|
|