Performance Management
|
Oct. 27, 2026 |
| UBS Emerging Markets Equity Opportunity Fund (Class A, Class P) | UBS Emerging Markets Equity Opportunity Fund |
|
| Prospectus [Line Items] |
|
| Bar Chart and Performance Table [Heading] |
Performance
|
| Performance Narrative [Text Block] |
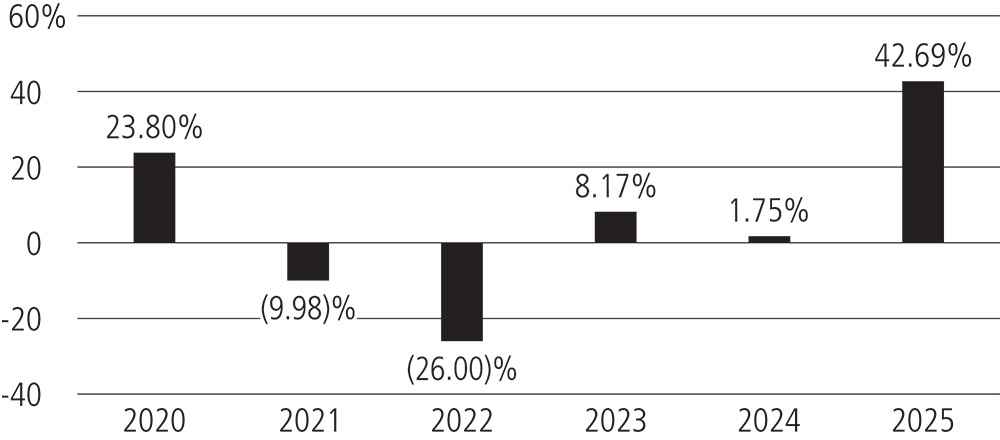
The performance information that follows shows the Fund’s Class P performance information in a bar chart and an average annual total returns table. There is no performance information quoted for the Class A shares of the Fund as the Class A shares have not completed a full calendar year of operations as of the date of this prospectus. Although the Class A shares are invested in the same portfolio of securities as the Class P shares, returns for the Class A shares will differ from the Class P shares to the extent that the Class A shares are subject to different expenses. The information provides some indication of the risks of investing in the Fund by showing changes in the Fund’s performance year to year and by showing how the Fund’s average annual total returns compare with those of a broad measure of market performance. The MSCI Emerging Markets Index (net) reflects no deduction for fees, expenses or taxes but is net of dividend tax withholding. The Fund’s past performance (before and after taxes) is not necessarily an indication of how the Fund will perform in the future. Updated performance for the Fund is available at www.ubs.com/us/en/assetmanagement/funds/mutual-fund-performance.
After-tax returns are calculated using the historical highest individual federal marginal income tax rates and do not reflect the impact of state and local taxes. Actual after-tax returns depend on an investor’s tax situation and may differ from those shown. In addition, the after-tax returns shown are not relevant to investors who hold Fund shares through tax-advantaged arrangements, such as 401(k) plans or individual retirement accounts. After-tax returns for other classes will vary from the Class P shares’ after-tax returns shown.
|
| Performance Past Does Not Indicate Future [Text] |
The Fund’s past performance (before and after taxes) is not necessarily an indication of how the Fund will perform in the future.
|
| Performance Information Illustrates Variability of Returns [Text] |
The information provides some indication of the risks of investing in the Fund by showing changes in the Fund’s performance year to year and by showing how the Fund’s average annual total returns compare with those of a broad measure of market performance.
|
| Bar Chart [Heading] |
Total return (Class P)*
|
| Bar Chart [Table] |
|
| Bar Chart Footnotes [Text Block] |
* 2020 is the Fund’s Class P shares’ first full year of operations
|
| Bar Chart Closing [Text Block] |
Total return January 1 - September 30, 2026: 25.02%
Best quarter during calendar years shown—4Q 2020: 22.32%
Worst quarter during calendar years shown—1Q 2020: (23.34)%
|
| Year to Date Return, Label [Optional Text] |
Total return
|
| Bar Chart, Year to Date Return |
25.02%
|
| Bar Chart, Year to Date Return, Date |
Sep. 30, 2026
|
| Highest Quarterly Return, Label [Optional Text] |
Best quarter
|
| Highest Quarterly Return |
22.32%
|
| Highest Quarterly Return, Date |
Dec. 31, 2020
|
| Lowest Quarterly Return, Label [Optional Text] |
Worst quarter
|
| Lowest Quarterly Return |
(23.34%)
|
| Lowest Quarterly Return, Date |
Mar. 31, 2020
|
| Performance Table Heading |
Average annual total returns (for the periods ended December 31, 2025)
|
| Performance Table Uses Highest Federal Rate |
After-tax returns are calculated using the historical highest individual federal marginal income tax rates and do not reflect the impact of state and local taxes.
|
| Performance Table Not Relevant to Tax Deferred |
Actual after-tax returns depend on an investor’s tax situation and may differ from those shown. In addition, the after-tax returns shown are not relevant to investors who hold Fund shares through tax-advantaged arrangements, such as 401(k) plans or individual retirement accounts.
|
| Performance [Table] |
Class (inception date)
| | | 1 year
| | | 5 years
| | | Life of class
| |
Class P (1/31/19)
Return before taxes
| | | 42.69
| %
| | | 0.91
| %
| | | 5.81
| %
| |
Return after taxes on distributions
| | | 42.17
| | | | 0.07
| | | | 5.07
| | |
Return after taxes on distributions
and sale of fund shares
| | | 25.88
| | | | 0.65
| | | | 4.56
| | |
MSCI Emerging Markets Index (net)
| | | 33.57
| | | | 4.20
| | | | 6.86
| | |
|
| Performance Table One Class of after Tax Shown [Text] |
After-tax returns for other classes will vary from the Class P shares’ after-tax returns shown.
|
| Index No Deduction for Fees, Expenses, or Taxes [Text] |
The MSCI Emerging Markets Index (net) reflects no deduction for fees, expenses or taxes but is net of dividend tax withholding.
|
| Performance Availability Website Address [Text] |
www.ubs.com/us/en/assetmanagement/funds/mutual-fund-performance
|
| UBS GLOBAL ALLOCATION FUND | UBS GLOBAL ALLOCATION FUND |
|
| Prospectus [Line Items] |
|
| Bar Chart and Performance Table [Heading] |
Performance
|
| Performance Narrative [Text Block] |
Risk/return bar chart and table
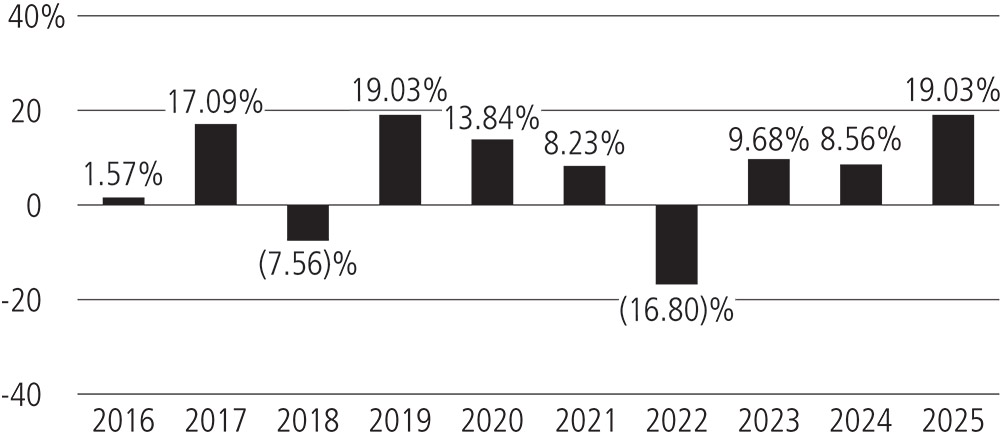
The performance information that follows shows the Fund’s performance information in a bar chart and an average annual total returns table. The information provides some indication of the risks of investing in the Fund by showing changes in the Fund’s performance year to year and by showing how the Fund’s average annual total returns compare with those of a broad measure of market performance. The table also shows the 60% MSCI All Country World Index (net)/40% FTSE World Government Bond Index (Hedged in USD) and FTSE World Government Bond Index (Hedged in USD), which are additional indices with characteristics relevant to the Fund. Indices reflect no deduction for fees, expenses or taxes, except for the MSCI All Country World Index (net) which reflects no deduction for fees, expenses or taxes but is net of dividend tax withholding. The Fund’s past performance (before and after taxes) is not necessarily an indication of how the Fund will perform in the future. Updated performance for the Fund is available at www.ubs.com/us/en/assetmanagement/funds/mutual-fund-performance.
After-tax returns are calculated using the historical highest individual federal marginal income tax rates and do not reflect the impact of state and local taxes. Actual after-tax returns depend on an investor’s tax situation and may differ from those shown. In addition, the after-tax returns shown are not relevant to investors who hold Fund shares through tax-advantaged arrangements, such as 401(k) plans or individual retirement accounts. After-tax returns for the other class will vary from the Class P shares’ after-tax returns shown.
|
| Performance Past Does Not Indicate Future [Text] |
The Fund’s past performance (before and after taxes) is not necessarily an indication of how the Fund will perform in the future.
|
| Performance Information Illustrates Variability of Returns [Text] |
The information provides some indication of the risks of investing in the Fund by showing changes in the Fund’s performance year to year and by showing how the Fund’s average annual total returns compare with those of a broad measure of market performance.
|
| Performance Additional Market Index [Text] |
The table also shows the 60% MSCI All Country World Index (net)/40% FTSE World Government Bond Index (Hedged in USD) and FTSE World Government Bond Index (Hedged in USD), which are additional indices with characteristics relevant to the Fund.
|
| Bar Chart [Heading] |
Total return (Class P)
|
| Bar Chart [Table] |
|
| Bar Chart Closing [Text Block] |
Total return January 1 - September 30, 2026: 7.40% Best quarter during calendar years shown—4Q 2020: 13.57%
Worst quarter during calendar years shown—1Q 2020: (14.97)%
|
| Year to Date Return, Label [Optional Text] |
Total return
|
| Bar Chart, Year to Date Return |
7.40%
|
| Bar Chart, Year to Date Return, Date |
Sep. 30, 2026
|
| Highest Quarterly Return, Label [Optional Text] |
Best quarter
|
| Highest Quarterly Return |
13.57%
|
| Highest Quarterly Return, Date |
Dec. 31, 2020
|
| Lowest Quarterly Return, Label [Optional Text] |
Worst quarter
|
| Lowest Quarterly Return |
(14.97%)
|
| Lowest Quarterly Return, Date |
Mar. 31, 2020
|
| Performance Table Heading |
Average annual total returns (figures reflect sales charges) (for the periods ended December 31, 2025)
|
| Performance Table Uses Highest Federal Rate |
After-tax returns are calculated using the historical highest individual federal marginal income tax rates and do not reflect the impact of state and local taxes.
|
| Performance Table Not Relevant to Tax Deferred |
Actual after-tax returns depend on an investor’s tax situation and may differ from those shown. In addition, the after-tax returns shown are not relevant to investors who hold Fund shares through tax-advantaged arrangements, such as 401(k) plans or individual retirement accounts.
|
| Performance [Table] |
Class (inception date)
| | | 1 year
| | | 5 years
| | | 10 years
|
Class A (6/30/97)
Return before taxes
| | | 12.22
| %
| | | 3.55
| %
| | | 5.77
| %
|
Class P (8/31/92)
Return before taxes
| | | 19.03
| | | | 5.00
| | | | 6.63
| |
Return after taxes on distributions
| | | 18.10
| | | | 3.21
| | | | 5.32
| |
Return after taxes on distributions
and sale of fund shares
| | | 11.33
| | | | 3.29
| | | | 4.87
| |
MSCI All Country World Index (net)
| | | 22.34
| | | | 11.19
| | | | 11.72
| |
FTSE World Government Bond
Index (Hedged in USD)
| | | 3.79
| | | | (0.76
| )
| | | 1.80
| |
60% MSCI All Country World Index
(net)/40% FTSE World Government
Bond Index (Hedged in USD)
| | | 14.68
| | | | 6.42
| | | | 7.90
| |
|
| Performance Table One Class of after Tax Shown [Text] |
After-tax returns for the other class will vary from the Class P shares’ after-tax returns shown.
|
| Index No Deduction for Fees, Expenses, or Taxes [Text] |
Indices reflect no deduction for fees, expenses or taxes, except for the MSCI All Country World Index (net) which reflects no deduction for fees, expenses or taxes but is net of dividend tax withholding.
|
| Performance Availability Website Address [Text] |
www.ubs.com/us/en/assetmanagement/funds/mutual-fund-performance
|
| UBS International Sustainable Aware Equity Fund (Class A, Class P) | UBS International Sustainable Aware Equity Fund |
|
| Prospectus [Line Items] |
|
| Bar Chart and Performance Table [Heading] |
Performance
|
| Performance Narrative [Text Block] |
Risk/return bar chart and table
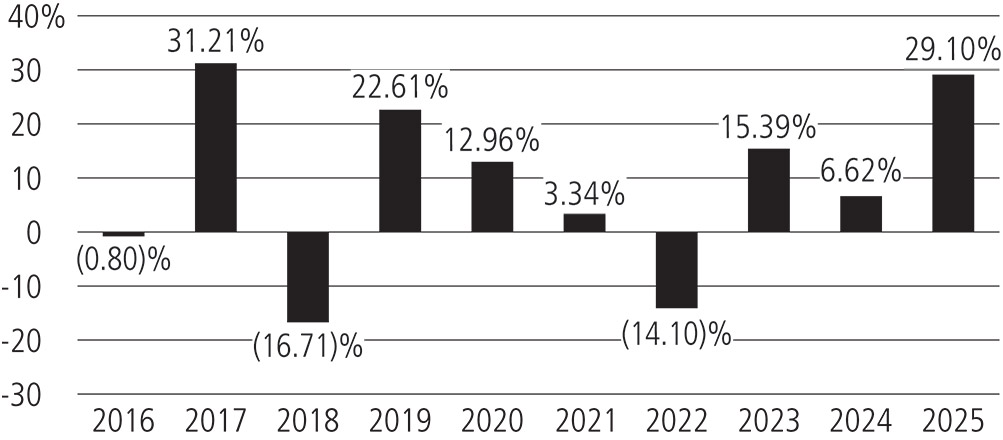
The performance information that follows shows the Fund’s performance information in a bar chart and an average annual total returns table.
The information provides some indication of the risks of investing in the Fund by showing changes in the Fund’s performance year to year and by showing how the Fund’s average annual total returns compare with those of a broad measure of market performance. The index reflects no deduction for fees, expenses or taxes but is net of dividend tax withholding. The Fund’s past performance (before and after taxes) is not necessarily an indication of how the Fund will perform in the future. Updated performance for the Fund is available at www.ubs.com/us/en/assetmanagement/funds/mutual‑fund-performance.
After-tax returns are calculated using the historical highest individual federal marginal income tax rates and do not reflect the impact of state and local taxes. Actual after-tax returns depend on an investor’s tax situation and may differ from those shown. In addition, the after-tax returns shown are not relevant to investors who hold Fund shares through tax-advantaged arrangements, such as 401(k) plans or individual retirement accounts. After-tax returns for other classes will vary from the Class P shares’ after-tax returns shown.
|
| Performance Past Does Not Indicate Future [Text] |
The Fund’s past performance (before and after taxes) is not necessarily an indication of how the Fund will perform in the future.
|
| Performance Information Illustrates Variability of Returns [Text] |
The information provides some indication of the risks of investing in the Fund by showing changes in the Fund’s performance year to year and by showing how the Fund’s average annual total returns compare with those of a broad measure of market performance.
|
| Bar Chart [Heading] |
Total return (Class P)
|
| Bar Chart [Table] |
|
| Bar Chart Closing [Text Block] |
Total return January 1 - September 30, 2026: 8.85% Best quarter during calendar years shown—2Q 2020: 17.80%
Worst quarter during calendar years shown—1Q 2020: (22.64)%
|
| Year to Date Return, Label [Optional Text] |
Total return
|
| Bar Chart, Year to Date Return |
8.85%
|
| Bar Chart, Year to Date Return, Date |
Sep. 30, 2026
|
| Highest Quarterly Return, Label [Optional Text] |
Best quarter
|
| Highest Quarterly Return |
17.80%
|
| Highest Quarterly Return, Date |
Jun. 30, 2020
|
| Lowest Quarterly Return, Label [Optional Text] |
Worst quarter
|
| Lowest Quarterly Return |
(22.64%)
|
| Lowest Quarterly Return, Date |
Mar. 31, 2020
|
| Performance Table Heading |
Average annual total returns (figures reflect sales charges) (for the periods ended December 31, 2025)
|
| Performance Table Uses Highest Federal Rate |
After-tax returns are calculated using the historical highest individual federal marginal income tax rates and do not reflect the impact of state and local taxes.
|
| Performance Table Not Relevant to Tax Deferred |
Actual after-tax returns depend on an investor’s tax situation and may differ from those shown. In addition, the after-tax returns shown are not relevant to investors who hold Fund shares through tax-advantaged arrangements, such as 401(k) plans or individual retirement accounts.
|
| Performance [Table] |
Class (inception date)
| | | 1 year
| | | 5 years
| | | 10 years
|
Class A (6/30/97)
Return before taxes
| | | 21.79
| %
| | | 5.65
| %
| | | 6.91
| %
|
Class P (8/31/93)
Return before taxes
| | | 29.10
| | | | 7.11
| | | | 7.79
| |
Return after taxes on distributions
| | | 28.77
| | | | 5.87
| | | | 7.02
| |
Return after taxes on distributions
and sale of fund shares
| | | 17.90
| | | | 5.36
| | | | 6.22
| |
MSCI World ex-USA Index Net (USD)
| | | 31.85
| | | | 9.46
| | | | 8.55
| |
|
| Performance Table One Class of after Tax Shown [Text] |
After-tax returns for other classes will vary from the Class P shares’ after-tax returns shown.
|
| Index No Deduction for Fees, Expenses, or Taxes [Text] |
The index reflects no deduction for fees, expenses or taxes but is net of dividend tax withholding.
|
| Performance Availability Website Address [Text] |
www.ubs.com/us/en/assetmanagement/funds/mutual‑fund-performance
|
| UBS Multi Income Bond Fund (Class A, Class P) | UBS Multi Income Bond Fund |
|
| Prospectus [Line Items] |
|
| Bar Chart and Performance Table [Heading] |
Performance
|
| Performance Narrative [Text Block] |
Risk/return bar chart and table
The Fund’s Class P shares acquired the assets and liabilities of Fort Dearborn Income Securities, Inc., a closed-end fund (the “Predecessor Fund”), prior to the opening of business on May 23, 2016 (the “Reorganization”). The Predecessor Fund was also managed by the Advisor, and, prior to June 13, 2022, the day-to-day management of, and investment decisions for, the Fund and the Predecessor Fund were made by the same portfolio management team. The Predecessor Fund and the Fund have substantially similar investment objectives and, prior to June 13, 2022, had substantially similar strategies. Therefore, the information shown below for Class P shares reflects the historical performance of the Predecessor Fund for periods prior to the Reorganization.
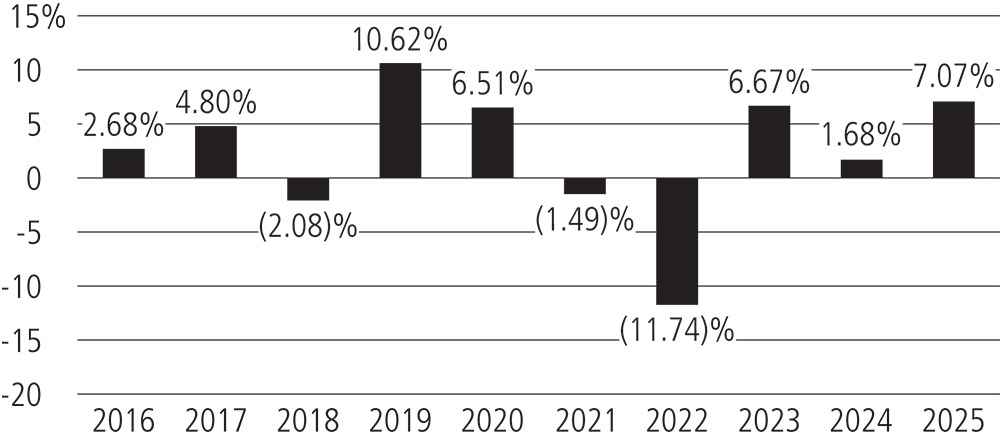
The performance information that follows shows the Fund’s performance information in a bar chart and an average annual total returns table. The bar chart and average annual total returns table show the performance of the Predecessor Fund’s performance adopted by the Class P shares of the Fund for periods prior to the Reorganization. The information provides some indication of the risks of investing in the Fund by showing changes in the Fund’s performance year to year and by showing how the Fund’s average annual total returns compare with those of a broad measure of market performance. The performance information shown for periods prior to the Reorganization is for the Predecessor Fund and may not be representative of performance of the Fund. In June 2022, the Fund’s investment strategies changed. The performance below for periods prior to that date is attributable to the Fund’s performance before the strategy change. The index reflects no deduction for fees, expenses or taxes. The Fund’s past performance (before and after taxes) is not necessarily an indication of how the Fund will perform in the future. Updated performance for the Fund is available at www.ubs.com/us/en/assetmanagement/funds/mutual‑fund‑performance.
After-tax returns are calculated using the historical highest individual federal marginal income tax rates and do not reflect the impact of state and local taxes. Actual after-tax returns depend on an investor’s tax situation and may differ from those shown. In addition, the after-tax returns shown are not relevant to investors who hold Fund shares through tax-advantaged arrangements, such as 401(k) plans or individual retirement accounts. After-tax returns for other classes will vary from the Class P shares’ after-tax returns shown.
|
| Performance Past Does Not Indicate Future [Text] |
The Fund’s past performance (before and after taxes) is not necessarily an indication of how the Fund will perform in the future.
|
| Performance Information Illustrates Variability of Returns [Text] |
The information provides some indication of the risks of investing in the Fund by showing changes in the Fund’s performance year to year and by showing how the Fund’s average annual total returns compare with those of a broad measure of market performance.
|
| Bar Chart [Heading] |
Total return (Class P)
|
| Bar Chart [Table] |
|
| Bar Chart Closing [Text Block] |
Total return January 1 - September 30, 2026: (2.81)%
Best quarter during calendar years shown—4Q 2023: 6.47%
Worst quarter during calendar years shown—2Q 2022: (7.69)%
|
| Year to Date Return, Label [Optional Text] |
Total return
|
| Bar Chart, Year to Date Return |
(2.81%)
|
| Bar Chart, Year to Date Return, Date |
Sep. 30, 2026
|
| Highest Quarterly Return, Label [Optional Text] |
Best quarter
|
| Highest Quarterly Return |
6.47%
|
| Highest Quarterly Return, Date |
Dec. 31, 2023
|
| Lowest Quarterly Return, Label [Optional Text] |
Worst quarter
|
| Lowest Quarterly Return |
(7.69%)
|
| Lowest Quarterly Return, Date |
Jun. 30, 2022
|
| Performance Table Heading |
Average annual total returns (figures reflect sales charges) (for the periods ended December 31, 2025)
|
| Performance Table Uses Highest Federal Rate |
After-tax returns are calculated using the historical highest individual federal marginal income tax rates and do not reflect the impact of state and local taxes.
|
| Performance Table Not Relevant to Tax Deferred |
Actual after-tax returns depend on an investor’s tax situation and may differ from those shown. In addition, the after-tax returns shown are not relevant to investors who hold Fund shares through tax-advantaged arrangements, such as 401(k) plans or individual retirement accounts.
|
| Performance [Table] |
Class (inception date)
| | | 1 year
| | | 5 years
| | | 10 years
| | | Life of class
|
Class A (09/29/16)
Return before taxes
| | | 2.85
| %
| | | (0.80
| )%
| | | N/A
| | | | 1.18
| %
|
Class P (12/19/72)
Return before taxes
| | | 7.07
| | | | 0.19
| | | | 2.29
| %
| | | N/A
| |
Return after taxes on distributions
| | | 5.05
| | | | (1.22
| )
| | | 1.01
| | | | N/A
| |
Return after taxes on distributions
and sale of fund shares
| | | 4.14
| | | | (0.47
| )
| | | 1.19
| | | | N/A
| |
Bloomberg US Aggregate
Bond Index
| | | 7.30
| | | | (0.36
| )
| | | 2.01
| | | | *
| |
* | Average annual total returns for the Bloomberg US Aggregate Bond Index for the life of Class A were 1.53%. |
|
| Performance Table One Class of after Tax Shown [Text] |
After-tax returns for other classes will vary from the Class P shares’ after-tax returns shown.
|
| Index No Deduction for Fees, Expenses, or Taxes [Text] |
The index reflects no deduction for fees, expenses or taxes.
|
| Performance Availability Website Address [Text] |
www.ubs.com/us/en/assetmanagement/funds/mutual‑fund‑performance
|
| UBS Sustainable Development Bank Bond Fund (Class A, Class P) | UBS Sustainable Development Bank Bond Fund |
|
| Prospectus [Line Items] |
|
| Bar Chart and Performance Table [Heading] |
Performance
|
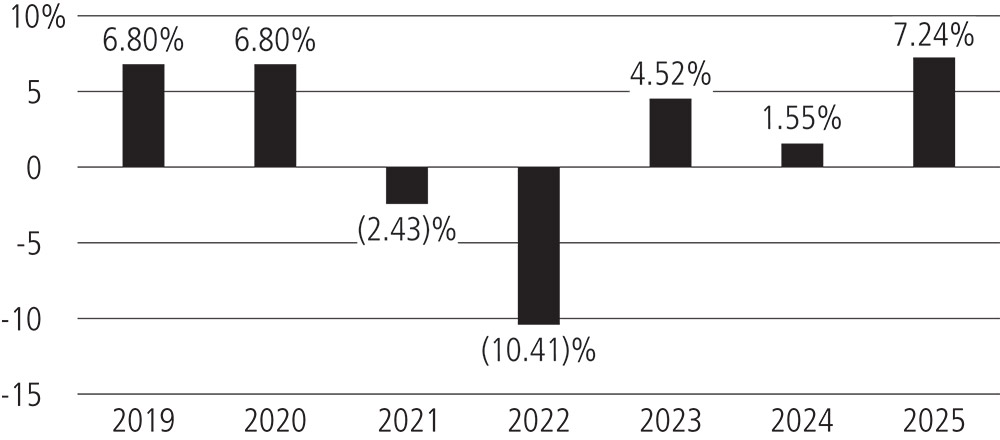
| Performance Narrative [Text Block] |
The performance information that follows shows the Fund’s performance information in a bar chart and an average annual total returns table. There is no performance information quoted for the Class A shares of the Fund as the Class A shares have not completed a full calendar year of operations as of the date of this prospectus. Returns for Class A shares will differ from the Class P shares to the extent that the Class A shares are subject to shareholder services fees and/or distribution fees.
The information provides some indication of the risks of investing in the Fund by showing changes in the Fund’s performance year to year and by showing how the Fund’s average annual total returns compare with those of a broad measure of market performance. The table also shows the Bloomberg U.S. Treasury Index and Solactive Global Multilateral Development Bank Bond USD 40% 1‑5 Year 60% 5‑10 Year Total Return Index, which are additional indices with characteristics relevant to the Fund. Indices reflect no deduction for fees, expenses or taxes. The Fund’s past performance (before and after taxes) is not necessarily an indication of how the Fund will perform in the future. Updated performance for the Fund is available at www.ubs.com/us/en/assetmanagement/funds/mutual-fund-performance.
After-tax returns are calculated using the historical highest individual federal marginal income tax rates and do not reflect the impact of state and local taxes. Actual after-tax returns depend on an investor’s tax situation and may differ from those shown. In addition, the after-tax returns shown are not relevant to investors who hold Fund shares through tax-advantaged arrangements, such as 401(k) plans or individual retirement accounts. After-tax returns for other classes will vary from the Class P shares’ after-tax returns shown.
|
| Performance Past Does Not Indicate Future [Text] |
The Fund’s past performance (before and after taxes) is not necessarily an indication of how the Fund will perform in the future.
|
| Performance Information Illustrates Variability of Returns [Text] |
The information provides some indication of the risks of investing in the Fund by showing changes in the Fund’s performance year to year and by showing how the Fund’s average annual total returns compare with those of a broad measure of market performance.
|
| Performance Additional Market Index [Text] |
The table also shows the Bloomberg U.S. Treasury Index and Solactive Global Multilateral Development Bank Bond USD 40% 1‑5 Year 60% 5‑10 Year Total Return Index, which are additional indices with characteristics relevant to the Fund.
|
| Bar Chart [Heading] |
Total return (Class P)*
|
| Bar Chart [Table] |
|
| Bar Chart Footnotes [Text Block] |
* 2019 is the Fund’s first full year of operations.
|
| Bar Chart Closing [Text Block] |
Total return January 1 - September 30, 2026: (2.61)%
Best quarter during calendar years shown—1Q 2020: 5.50%
Worst quarter during calendar years shown—1Q 2022: (5.12)%
|
| Year to Date Return, Label [Optional Text] |
Total return
|
| Bar Chart, Year to Date Return |
(2.61%)
|
| Bar Chart, Year to Date Return, Date |
Sep. 30, 2026
|
| Highest Quarterly Return, Label [Optional Text] |
Best quarter
|
| Highest Quarterly Return |
5.50%
|
| Highest Quarterly Return, Date |
Mar. 31, 2020
|
| Lowest Quarterly Return, Label [Optional Text] |
Worst quarter
|
| Lowest Quarterly Return |
(5.12%)
|
| Lowest Quarterly Return, Date |
Mar. 31, 2022
|
| Performance Table Heading |
Average annual total returns (for the periods ended December 31, 2025)
|
| Performance Table Uses Highest Federal Rate |
After-tax returns are calculated using the historical highest individual federal marginal income tax rates and do not reflect the impact of state and local taxes.
|
| Performance Table Not Relevant to Tax Deferred |
Actual after-tax returns depend on an investor’s tax situation and may differ from those shown. In addition, the after-tax returns shown are not relevant to investors who hold Fund shares through tax-advantaged arrangements, such as 401(k) plans or individual retirement accounts.
|
| Performance [Table] |
Class (inception date)
| | | 1 year
| | | 5 years
| | | Life of class
| |
Class P (10/24/18)
Return before taxes
| | | 7.24
| %
| | | (0.10
| )%
| | | 2.08
| %
| |
Return after taxes on distributions
| | | 5.76
| | | | (0.97
| )
| | | 1.07
| | |
Return after taxes on distributions
and sale of fund shares
| | | 4.26
| | | | (0.45
| )
| | | 1.18
| | |
Bloomberg U.S. Treasury Index
| | | 6.32
| | | | (0.99
| )
| | | 1.71
| | |
Bloomberg US Aggregate Bond Index
| | | 7.30
| | | | (0.36
| )
| | | 2.24
| | |
Solactive Global Multilateral Development Bank Bond USD 40%
1‑5 Year 60% 5‑10 Year Total Return Index
| | | 7.36
| | | | 0.11
| | | | 2.30
| | |
|
| Performance Table One Class of after Tax Shown [Text] |
After-tax returns for other classes will vary from the Class P shares’ after-tax returns shown.
|
| Index No Deduction for Fees, Expenses, or Taxes [Text] |
Indices reflect no deduction for fees, expenses or taxes.
|
| Performance Availability Website Address [Text] |
www.ubs.com/us/en/assetmanagement/funds/mutual-fund-performance
|
| UBS US Dividend Ruler Fund (Class P) | UBS US Dividend Ruler Fund |
|
| Prospectus [Line Items] |
|
| Bar Chart and Performance Table [Heading] |
Performance
|
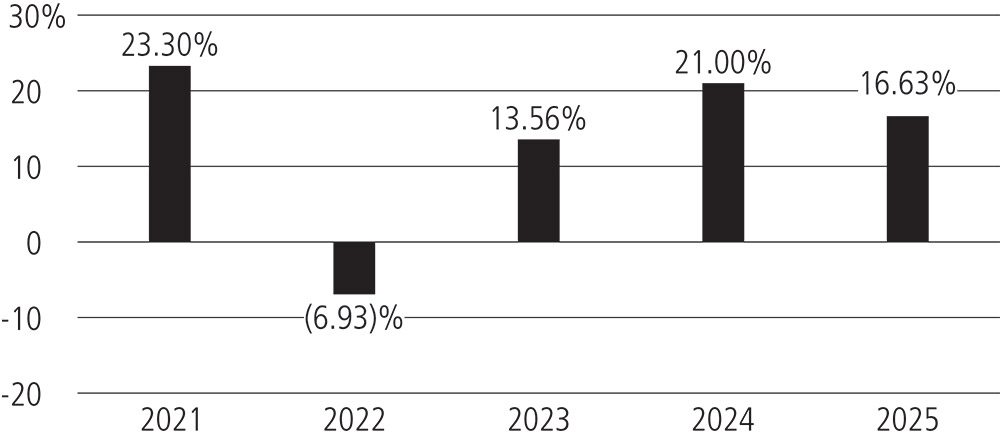
| Performance Narrative [Text Block] |
Risk/return bar chart and table
The performance information that follows shows the Fund’s performance information in a bar chart and an average annual total returns table. The information provides some indication of the risks of investing in the Fund by showing changes in the Fund’s performance year to year and by showing how the Fund’s average annual total returns compare with those of a broad measure of market performance. The index reflects no deduction for fees, expenses or taxes. The Fund’s past performance (before and after taxes) is not necessarily an indication of how the Fund will perform in the future. Updated performance for the Fund is available at www.ubs.com/us/en/assetmanagement/funds/mutual‑fund‑performance.
After-tax returns are calculated using the historical highest individual federal marginal income tax rates and do not reflect the impact of state and local taxes. Actual after-tax returns depend on an investor’s tax situation and may differ from those shown. In addition, the after-tax returns shown are not relevant to investors who hold Fund shares through tax-advantaged arrangements, such as 401(k) plans or individual retirement accounts.
|
| Performance Past Does Not Indicate Future [Text] |
The Fund’s past performance (before and after taxes) is not necessarily an indication of how the Fund will perform in the future.
|
| Performance Information Illustrates Variability of Returns [Text] |
The information provides some indication of the risks of investing in the Fund by showing changes in the Fund’s performance year to year and by showing how the Fund’s average annual total returns compare with those of a broad measure of market performance.
|
| Bar Chart [Heading] |
Total return (Class P)*
|
| Bar Chart [Table] |
|
| Bar Chart Footnotes [Text Block] |
* 2021 is the Fund’s first full calendar year of operations.
|
| Bar Chart Closing [Text Block] |
Total return January 1 - September 30, 2026: 8.14%
Best quarter during calendar years shown—4Q 2022: 14.07%
Worst quarter during calendar years shown—2Q 2022: (10.72)%
|
| Year to Date Return, Label [Optional Text] |
Total return
|
| Bar Chart, Year to Date Return |
8.14%
|
| Bar Chart, Year to Date Return, Date |
Sep. 30, 2026
|
| Highest Quarterly Return, Label [Optional Text] |
Best quarter
|
| Highest Quarterly Return |
14.07%
|
| Highest Quarterly Return, Date |
Dec. 31, 2022
|
| Lowest Quarterly Return, Label [Optional Text] |
Worst quarter
|
| Lowest Quarterly Return |
(10.72%)
|
| Lowest Quarterly Return, Date |
Jun. 30, 2022
|
| Performance Table Heading |
Average annual total returns (for the periods ended December 31, 2025)
|
| Performance Table Uses Highest Federal Rate |
After-tax returns are calculated using the historical highest individual federal marginal income tax rates and do not reflect the impact of state and local taxes.
|
| Performance Table Not Relevant to Tax Deferred |
Actual after-tax returns depend on an investor’s tax situation and may differ from those shown. In addition, the after-tax returns shown are not relevant to investors who hold Fund shares through tax-advantaged arrangements, such as 401(k) plans or individual retirement accounts.
|
| Performance [Table] |
Class (inception date)
| 1 year
| | 5 years
| | Life of class
| |
Class P (July 9, 2020)
Return before taxes
| 16.63
| %
| | 12.96
| %
| | 14.71
| %
| |
Return after taxes on distributions
| 14.60
| | | 11.75
| | | 13.53
| | |
Return after taxes on distributions
and sale of fund shares
| 11.26
| | | 10.11
| | | 11.63
| | |
S&P 500 Index
| 17.88
| | | 14.42
| | | 16.93
| | |
|
| Index No Deduction for Fees, Expenses, or Taxes [Text] |
The index reflects no deduction for fees, expenses or taxes.
|
| Performance Availability Website Address [Text] |
www.ubs.com/us/en/assetmanagement/funds/mutual‑fund‑performance
|
| UBS US Quality Growth At Reasonable Price Fund | UBS US Quality Growth At Reasonable Price Fund |
|
| Prospectus [Line Items] |
|
| Bar Chart and Performance Table [Heading] |
Performance
|
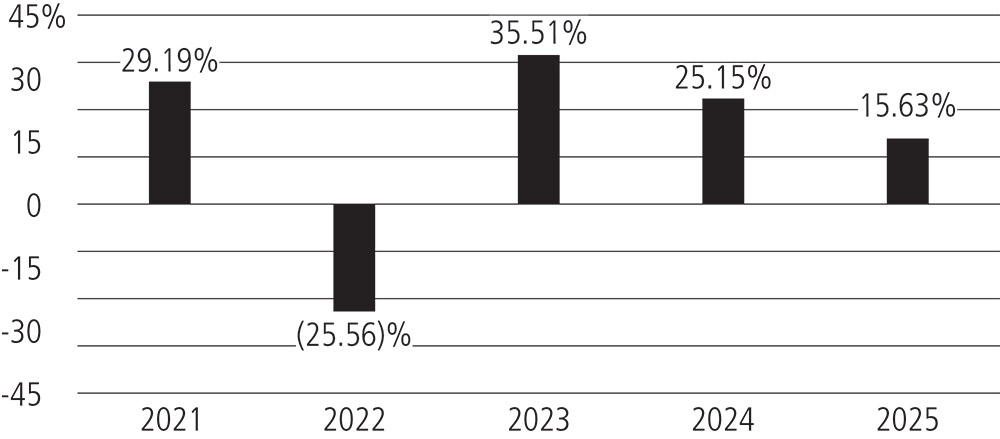
| Performance Narrative [Text Block] |
Risk/return bar chart and table
The performance information that follows shows the Fund’s performance information in a bar chart and an average annual total returns table. The information provides some indication of the risks of investing in the Fund by showing changes in the Fund’s performance year to year and by showing how the Fund’s average annual total returns compare with those of a broad measure of market performance. The table also shows the Russell 1000 Growth Index, which is an additional index with characteristics relevant to the Fund. The indices reflect no deduction for fees, expenses or taxes. The Fund’s past performance (before and after taxes) is not necessarily an indication of how the Fund will perform in the future. Updated performance for the Fund is available at www.ubs.com/us/en/assetmanagement/funds/mutual-fund-performance.
After-tax returns are calculated using the historical highest individual federal marginal income tax rates and do not reflect the impact of state and local taxes. Actual after-tax returns depend on an investor’s tax situation and may differ from those shown. In addition, the after-tax returns shown are not relevant to investors who hold Fund shares through tax-advantaged arrangements, such as 401(k) plans or individual retirement accounts.
|
| Performance Past Does Not Indicate Future [Text] |
The Fund’s past performance (before and after taxes) is not necessarily an indication of how the Fund will perform in the future.
|
| Performance Information Illustrates Variability of Returns [Text] |
The information provides some indication of the risks of investing in the Fund by showing changes in the Fund’s performance year to year and by showing how the Fund’s average annual total returns compare with those of a broad measure of market performance.
|
| Performance Additional Market Index [Text] |
The table also shows the Russell 1000 Growth Index, which is an additional index with characteristics relevant to the Fund.
|
| Bar Chart [Heading] |
Total return (Class P)*
|
| Bar Chart [Table] |
|
| Bar Chart Footnotes [Text Block] |
* 2021 is the Fund’s first full calendar year of operations.
|
| Bar Chart Closing [Text Block] |
Total return January 1—September 30, 2026: 5.02%
Best quarter during calendar years shown—2Q 2025: 16.28%
Worst quarter during calendar years shown—2Q 2022: (17.91)%
|
| Year to Date Return, Label [Optional Text] |
Total return
|
| Bar Chart, Year to Date Return |
5.02%
|
| Bar Chart, Year to Date Return, Date |
Sep. 30, 2026
|
| Highest Quarterly Return, Label [Optional Text] |
Best quarter
|
| Highest Quarterly Return |
16.28%
|
| Highest Quarterly Return, Date |
Jun. 30, 2025
|
| Lowest Quarterly Return, Label [Optional Text] |
Worst quarter
|
| Lowest Quarterly Return |
(17.91%)
|
| Lowest Quarterly Return, Date |
Jun. 30, 2022
|
| Performance Table Heading |
Average annual total returns (for the periods ended December 31, 2025)
|
| Performance Table Uses Highest Federal Rate |
After-tax returns are calculated using the historical highest individual federal marginal income tax rates and do not reflect the impact of state and local taxes.
|
| Performance Table Not Relevant to Tax Deferred |
Actual after-tax returns depend on an investor’s tax situation and may differ from those shown. In addition, the after-tax returns shown are not relevant to investors who hold Fund shares through tax-advantaged arrangements, such as 401(k) plans or individual retirement accounts.
|
| Performance [Table] |
Class (inception date)
| | | 1 year
| | 5 years
| | Life of class
|
Class P (July 9, 2020)
Return before taxes
| | | 15.63
| %
| | 13.53
| %
| | 15.11
| %
|
Return after taxes on distributions
| | | 13.98
| | | 12.68
| | | 14.30
| |
Return after taxes on distributions
and sale of fund shares
| | | 10.36
| | | 10.66
| | | 12.05
| |
Russell 1000 Growth Index
| | | 18.70
| | | 15.35
| | | 17.79
| |
S&P 500 Index
| | | 17.88
| | | 14.42
| | | 16.93
| |
|
| Index No Deduction for Fees, Expenses, or Taxes [Text] |
The indices reflect no deduction for fees, expenses or taxes.
|
| Performance Availability Website Address [Text] |
www.ubs.com/us/en/assetmanagement/funds/mutual-fund-performance
|
| UBS Emerging Markets Equity Opportunity Fund - Class P2 Prospectus | UBS Emerging Markets Equity Opportunity Fund |
|
| Prospectus [Line Items] |
|
| Bar Chart and Performance Table [Heading] |
Performance
|
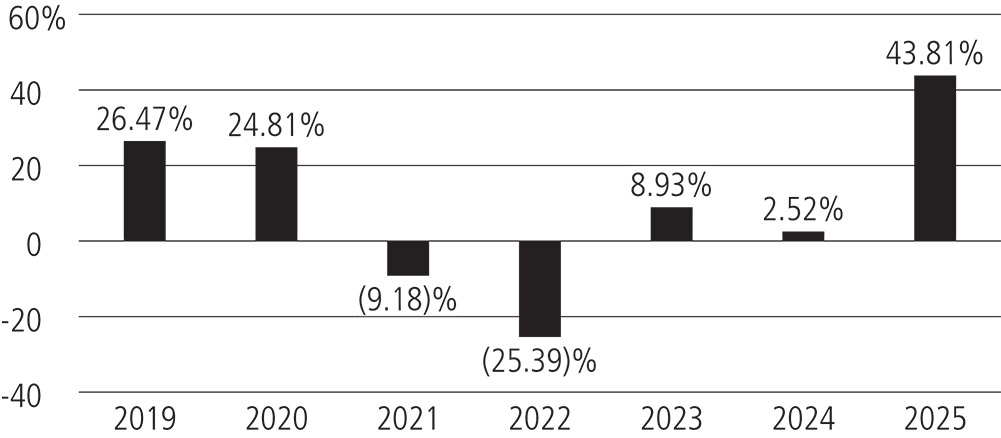
| Performance Narrative [Text Block] |
The performance information that follows shows the Fund’s performance information in a bar chart and an average annual total returns table. The information provides some indication of the risks of investing in the Fund by showing changes in the Fund’s performance year to year and by showing how the Fund’s average annual total returns compare with those of a broad measure of market performance. The MSCI Emerging Markets Index (net) reflects no deduction for fees, expenses or taxes but is net of dividend tax withholding. The Fund’s past performance (before and after taxes) is not necessarily an indication of how the Fund will perform in the future. Updated performance for the Fund is available at www.ubs.com/us/en/assetmanagement/funds/mutual-fund-performance. Class P2 shares do not bear initial or contingent deferred sales charges or ongoing 12b‑1 service and distribution fees, but Class P2 shares held through advisory programs may be subject to a program fee, advisory fee or other fees, which, if included, would have reduced performance.
After-tax returns are calculated using the historical highest individual federal marginal income tax rates and do not reflect the impact of state and local taxes. Actual after-tax returns depend on an investor’s tax situation and may differ from those shown. In addition, the after- tax returns shown are not relevant to investors who hold Fund shares through tax-advantaged arrangements, such as 401(k) plans or individual retirement accounts. After-tax returns for other classes will vary from the Class P2 shares’ after-tax returns shown.
|
| Performance Past Does Not Indicate Future [Text] |
The Fund’s past performance (before and after taxes) is not necessarily an indication of how the Fund will perform in the future.
|
| Performance Information Illustrates Variability of Returns [Text] |
The information provides some indication of the risks of investing in the Fund by showing changes in the Fund’s performance year to year and by showing how the Fund’s average annual total returns compare with those of a broad measure of market performance.
|
| Bar Chart [Heading] |
Total return (Class P2)*
|
| Bar Chart [Table] |
|
| Bar Chart Footnotes [Text Block] |
* 2019 is the Fund’s first full year of operations.
|
| Bar Chart Closing [Text Block] |
Total return January 1 - September 30, 2026: 25.67%
Best quarter during calendar years shown—4Q 2020: 22.60%
Worst quarter during calendar years shown—1Q 2020: (23.25)%
|
| Year to Date Return, Label [Optional Text] |
Total return
|
| Bar Chart, Year to Date Return |
25.67%
|
| Bar Chart, Year to Date Return, Date |
Sep. 30, 2026
|
| Highest Quarterly Return, Label [Optional Text] |
Best quarter
|
| Highest Quarterly Return |
22.60%
|
| Highest Quarterly Return, Date |
Dec. 31, 2020
|
| Lowest Quarterly Return, Label [Optional Text] |
Worst quarter
|
| Lowest Quarterly Return |
(23.25%)
|
| Lowest Quarterly Return, Date |
Mar. 31, 2020
|
| Performance Table Heading |
Average annual total returns (for the periods ended December 31, 2025)
|
| Performance Table Uses Highest Federal Rate |
After-tax returns are calculated using the historical highest individual federal marginal income tax rates and do not reflect the impact of state and local taxes.
|
| Performance Table Not Relevant to Tax Deferred |
Actual after-tax returns depend on an investor’s tax situation and may differ from those shown. In addition, the after-tax returns shown are not relevant to investors who hold Fund shares through tax-advantaged arrangements, such as 401(k) plans or individual retirement accounts.
|
| Performance [Table] |
Class (inception date)
| | 1 year
| | 5 years
| | Life of
class
| |
Class P2 (6/4/18)
Return before taxes
| | | 43.81
| %
| | | 1.71
| %
| | | 4.56
| %
| |
Return after taxes on distributions
| | | 43.31
| | | | 0.64
| | | | 3.71
| | |
Return after taxes on distributions
and sale of fund shares
| | | 26.54
| | | | 1.16
| | | | 3.48
| | |
MSCI Emerging Markets Index (net)
| | | 33.57
| | | | 4.20
| | | | 5.26
| | |
|
| Performance Table One Class of after Tax Shown [Text] |
After-tax returns for other classes will vary from the Class P2 shares’ after-tax returns shown.
|
| Index No Deduction for Fees, Expenses, or Taxes [Text] |
The MSCI Emerging Markets Index (net) reflects no deduction for fees, expenses or taxes but is net of dividend tax withholding.
|
| Performance Availability Website Address [Text] |
www.ubs.com/us/en/assetmanagement/funds/mutual-fund-performance
|
| UBS International Sustainable Aware Equity Fund - Class P2 Prospectus | UBS International Sustainable Aware Equity Fund |
|
| Prospectus [Line Items] |
|
| Bar Chart and Performance Table [Heading] |
Performance
|
| Performance Narrative [Text Block] |
Risk/return bar chart and table
The performance information that follows shows the Fund’s Class P2 performance information in a bar chart and an average annual total returns table.
The information provides some indication of the risks of investing in the Fund by showing changes in the Fund’s performance year to year and by showing how the Fund’s average annual total returns compare with those of a broad measure of market performance. The index reflects no deduction for fees, expenses or taxes but is net of dividend tax withholding. The Fund’s past performance (before and after taxes) is not necessarily an indication of how the Fund will perform in the future. Updated performance for the Fund is available at www.ubs.com/us/en/assetmanagement/funds/mutual‑fund-performance. Class P2 shares do not bear initial or contingent deferred sales charges or ongoing 12b‑1 service and distribution fees, but Class P2 shares held through advisory programs may be subject to a program fee, advisory fee or other fees, which, if included, would have reduced performance.
After-tax returns are calculated using the historical highest individual federal marginal income tax rates and do not reflect the impact of state and local taxes. Actual after-tax returns depend on an investor’s tax situation and may differ from those shown. In addition, the after-tax returns shown are not relevant to investors who hold Fund shares through tax-advantaged arrangements, such as 401(k) plans or individual retirement accounts. After-tax returns for other classes will vary from the Class P2 shares’ after-tax returns shown.
|
| Performance Past Does Not Indicate Future [Text] |
The Fund’s past performance (before and after taxes) is not necessarily an indication of how the Fund will perform in the future.
|
| Performance Information Illustrates Variability of Returns [Text] |
The information provides some indication of the risks of investing in the Fund by showing changes in the Fund’s performance year to year and by showing how the Fund’s average annual total returns compare with those of a broad measure of market performance.
|
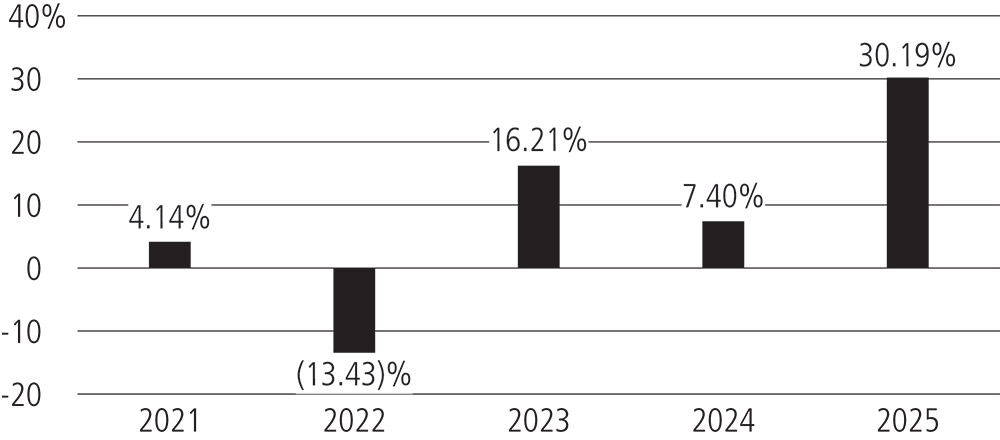
| Bar Chart [Heading] |
Total return (Class P2)*
|
| Bar Chart [Table] |
|
| Bar Chart Footnotes [Text Block] |
* 2021 is the Fund’s Class P2 shares’ first full year of operations
|
| Bar Chart Closing [Text Block] |
Total return January 1 - September 30, 2026: 9.37%
Best quarter during calendar years shown—4Q 2022: 17.41%
Worst quarter during calendar years shown—2Q 2022: (11.21)%
|
| Year to Date Return, Label [Optional Text] |
Total return
|
| Bar Chart, Year to Date Return |
9.37%
|
| Bar Chart, Year to Date Return, Date |
Sep. 30, 2026
|
| Highest Quarterly Return, Label [Optional Text] |
Best quarter
|
| Highest Quarterly Return |
17.41%
|
| Highest Quarterly Return, Date |
Dec. 31, 2022
|
| Lowest Quarterly Return, Label [Optional Text] |
Worst quarter
|
| Lowest Quarterly Return |
(11.21%)
|
| Lowest Quarterly Return, Date |
Jun. 30, 2022
|
| Performance Table Heading |
Average annual total returns (for the periods ended December 31, 2025)
|
| Performance Table Uses Highest Federal Rate |
After-tax returns are calculated using the historical highest individual federal marginal income tax rates and do not reflect the impact of state and local taxes.
|
| Performance Table Not Relevant to Tax Deferred |
Actual after-tax returns depend on an investor’s tax situation and may differ from those shown. In addition, the after-tax returns shown are not relevant to investors who hold Fund shares through tax-advantaged arrangements, such as 401(k) plans or individual retirement accounts.
|
| Performance [Table] |
Class (inception date)
| | 1 year
| | 5 years
| | Life of
Class
| |
Class P2 (10/30/20)
Return before taxes
| | | 30.19
| %
| | | 7.94
| %
| | | 11.39
| %
| |
Return after taxes on distributions
| | | 29.87
| | | | 6.53
| | | | 9.94
| | |
Return after taxes on distributions
and sale of fund shares
| | | 18.54
| | | | 5.94
| | | | 8.79
| | |
MSCI World ex-US Index
| | | 31.85
| | | | 9.46
| | | | 13.16
| | |
|
| Performance Table One Class of after Tax Shown [Text] |
After-tax returns for other classes will vary from the Class P2 shares’ after-tax returns shown.
|
| Index No Deduction for Fees, Expenses, or Taxes [Text] |
The index reflects no deduction for fees, expenses or taxes but is net of dividend tax withholding.
|
| Performance Availability Website Address [Text] |
www.ubs.com/us/en/assetmanagement/funds/mutual‑fund-performance
|
| UBS US Dividend Ruler Fund - Class P2 Prospectus | UBS US Dividend Ruler Fund |
|
| Prospectus [Line Items] |
|
| Bar Chart and Performance Table [Heading] |
Performance
|
| Performance Narrative [Text Block] |
Risk/return bar chart and table
The performance information that follows shows the Fund’s Class P2 performance information in a bar chart and an average annual total returns table.
The information provides some indication of the risks of investing in the Fund by showing changes in the Fund’s performance and by showing how the Fund’s average annual total returns compare with those of a broad measure of market performance. The index reflects no deduction for fees, expenses or taxes but is net of dividend tax withholding. The Fund’s past performance (before and after taxes) is not necessarily an indication of how the Fund will perform in the future. Updated performance for the Fund is available at www.ubs.com/us/en/assetmanagement/funds/mutual-fund-performance. Class P2 shares do not bear initial or contingent deferred sales charges or ongoing 12b‑1 service and distribution fees, but Class P2 shares held through advisory programs may be subject to a program fee, advisory fee or other fees, which, if included, would have reduced performance.
After-tax returns are calculated using the historical highest individual federal marginal income tax rates and do not reflect the impact of state and local taxes. Actual after-tax returns depend on an investor’s tax situation and may differ from those shown. In addition, the after-tax returns shown are not relevant to investors who hold Fund shares through tax-advantaged arrangements, such as 401(k) plans or individual retirement accounts. After-tax returns for other classes will vary from the Class P2 shares’ after-tax returns shown.
|
| Performance Past Does Not Indicate Future [Text] |
The Fund’s past performance (before and after taxes) is not necessarily an indication of how the Fund will perform in the future.
|
| Performance Information Illustrates Variability of Returns [Text] |
The information provides some indication of the risks of investing in the Fund by showing changes in the Fund’s performance and by showing how the Fund’s average annual total returns compare with those of a broad measure of market performance.
|
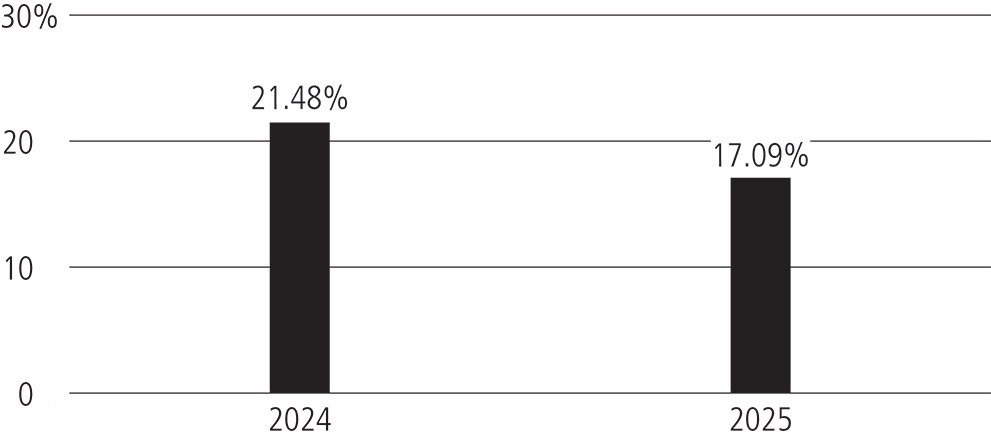
| Bar Chart [Heading] |
Total return (Class P2)*
|
| Bar Chart [Table] |
|
| Bar Chart Footnotes [Text Block] |
* 2024 is the Fund’s Class P2 shares’ first full year of operations.
|
| Bar Chart Closing [Text Block] |
Total return January 1 - September 30, 2026: 8.14%1
Best quarter during calendar year shown—2Q 2025: 11.48%
Worst quarter during calendar year shown—1Q 2025: (1.90)%
1 | Class P2 shares ceased operations as of January 30, 2026. Returns after January 30, 2026 are those of Class P shares. Although the Class P2 shares are invested in the same portfolio of securities as the Class P shares, returns for the Class P2 shares will differ from the Class P shares to the extent that the Class P2 shares are subject to different expenses. |
|
| Year to Date Return, Label [Optional Text] |
Total return
|
| Bar Chart, Year to Date Return |
8.14%
|
| Bar Chart, Year to Date Return, Date |
Sep. 30, 2026
|
| Highest Quarterly Return, Label [Optional Text] |
Best quarter
|
| Highest Quarterly Return |
11.48%
|
| Highest Quarterly Return, Date |
Jun. 30, 2025
|
| Lowest Quarterly Return, Label [Optional Text] |
Worst quarter
|
| Lowest Quarterly Return |
(1.90%)
|
| Lowest Quarterly Return, Date |
Mar. 31, 2025
|
| Performance Table Heading |
Average annual total returns (for the periods ended December 31, 2025)
|
| Performance Table Uses Highest Federal Rate |
After-tax returns are calculated using the historical highest individual federal marginal income tax rates and do not reflect the impact of state and local taxes.
|
| Performance Table Not Relevant to Tax Deferred |
Actual after-tax returns depend on an investor’s tax situation and may differ from those shown. In addition, the after-tax returns shown are not relevant to investors who hold Fund shares through tax-advantaged arrangements, such as 401(k) plans or individual retirement accounts.
|
| Performance [Table] |
Class (inception date)
| | 1 year
| | | Life of class
|
Class P2 (3/15/23)
Return before taxes
| | | 17.09
| %
| | | | 19.94
| %
|
Return after taxes on distributions
| | | 15.07
| | | | | 18.17
| |
Return after taxes on distributions
and sale of fund shares
| | | 11.53
| | | | | 15.40
| |
S&P 500 Index
| | | 17.88
| | | | | 24.09
| |
|
| Performance Table One Class of after Tax Shown [Text] |
After-tax returns for other classes will vary from the Class P2 shares’ after-tax returns shown.
|
| Index No Deduction for Fees, Expenses, or Taxes [Text] |
The index reflects no deduction for fees, expenses or taxes but is net of dividend tax withholding.
|
| Performance Availability Website Address [Text] |
www.ubs.com/us/en/assetmanagement/funds/mutual-fund-performance
|
| UBS Multi Income Bond Fund - Class P2 Prospectus | UBS Multi Income Bond Fund |
|
| Prospectus [Line Items] |
|
| Bar Chart and Performance Table [Heading] |
Performance
|
| Performance Narrative [Text Block] |
Risk/return bar chart and table
The performance information that follows shows the Fund’s Class P2 performance information in a bar chart and an average annual total returns table.
The information provides some indication of the risks of investing in the Fund by showing changes in the Fund’s performance and by showing how the Fund’s average annual total returns compare with those of a broad measure of market performance. The index reflects no deduction for fees, expenses or taxes but is net of dividend tax withholding. The Fund’s past performance (before and after taxes) is not necessarily an indication of how the Fund will perform in the future. Updated performance for the Fund is available at www.ubs.com/us/en/assetmanagement/funds/mutual-fund-performance. Class P2 shares do not bear initial or contingent deferred sales charges or ongoing 12b‑1 service and distribution fees, but Class P2 shares held through advisory programs may be subject to a program fee, advisory fee or other fees, which, if included, would have reduced performance.
After-tax returns are calculated using the historical highest individual federal marginal income tax rates and do not reflect the impact of state and local taxes. Actual after-tax returns depend on an investor’s tax situation and may differ from those shown. In addition, the after-tax returns shown are not relevant to investors who hold Fund shares through tax-advantaged arrangements, such as 401(k) plans or individual retirement accounts. After-tax returns for other classes will vary from the Class P2 shares’ after-tax returns shown.
|
| Performance Past Does Not Indicate Future [Text] |
The Fund’s past performance (before and after taxes) is not necessarily an indication of how the Fund will perform in the future.
|
| Performance Information Illustrates Variability of Returns [Text] |
The information provides some indication of the risks of investing in the Fund by showing changes in the Fund’s performance and by showing how the Fund’s average annual total returns compare with those of a broad measure of market performance.
|
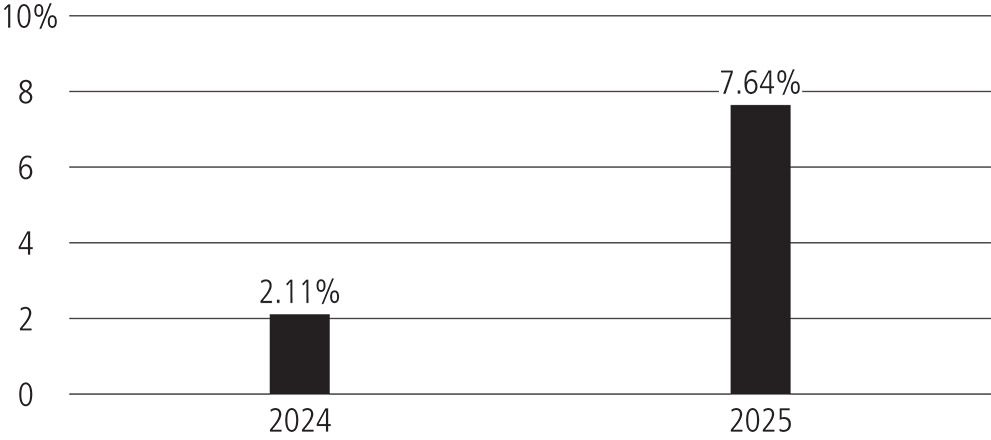
| Bar Chart [Heading] |
Total return (Class P2)*
|
| Bar Chart [Table] |
|
| Bar Chart Footnotes [Text Block] |
* 2024 is the Fund’s Class P2 shares’ first full year of operations.
|
| Bar Chart Closing [Text Block] |
Total return January 1 - September 30, 2026: (2.53)%
Best quarter during calendar year shown—3Q 2024: 4.83%
Worst quarter during calendar year shown—4Q 2024: (2.41)%
|
| Year to Date Return, Label [Optional Text] |
Total return
|
| Bar Chart, Year to Date Return |
(2.53%)
|
| Bar Chart, Year to Date Return, Date |
Sep. 30, 2026
|
| Highest Quarterly Return, Label [Optional Text] |
Best quarter
|
| Highest Quarterly Return |
4.83%
|
| Highest Quarterly Return, Date |
Sep. 30, 2024
|
| Lowest Quarterly Return, Label [Optional Text] |
Worst quarter
|
| Lowest Quarterly Return |
(2.41%)
|
| Lowest Quarterly Return, Date |
Dec. 31, 2024
|
| Performance Table Heading |
Average annual total returns (for the periods ended December 31, 2025)
|
| Performance Table Uses Highest Federal Rate |
After-tax returns are calculated using the historical highest individual federal marginal income tax rates and do not reflect the impact of state and local taxes.
|
| Performance Table Not Relevant to Tax Deferred |
Actual after-tax returns depend on an investor’s tax situation and may differ from those shown. In addition, the after-tax returns shown are not relevant to investors who hold Fund shares through tax-advantaged arrangements, such as 401(k) plans or individual retirement accounts.
|
| Performance [Table] |
Class (inception date)
| | 1 year
| | | Life of class
|
Class P2 (10/11/23)
Return before taxes
| | | 7.64
| %
| | | | 7.50
| %
|
Return after taxes on distributions
| | | 5.65
| | | | | 5.56
| |
Return after taxes on distributions
and sale of fund shares
| | | 4.47
| | | | | 4.91
| |
Bloomberg US Aggregate
Bond Index
| | | 7.30
| | | | | 6.85
| |
|
| Performance Table One Class of after Tax Shown [Text] |
After-tax returns for other classes will vary from the Class P2 shares’ after-tax returns shown.
|
| Index No Deduction for Fees, Expenses, or Taxes [Text] |
The index reflects no deduction for fees, expenses or taxes but is net of dividend tax withholding.
|
| Performance Availability Website Address [Text] |
www.ubs.com/us/en/assetmanagement/funds/mutual-fund-performance
|
| UBS Sustainable Development Bank Bond Fund - Class P2 Prospectus | UBS Sustainable Development Bank Bond Fund |
|
| Prospectus [Line Items] |
|
| Bar Chart and Performance Table [Heading] |
Performance
|
| Performance Narrative [Text Block] |
The performance information that follows shows the Fund’s Class P2 performance information in a bar chart and an average annual total returns table.
The information provides some indication of the risks of investing in the Fund by showing changes in the Fund’s performance year to year and by showing how the Fund’s average annual total returns compare with those of a broad measure of market performance. The table also shows the Bloomberg U.S. Treasury Index and Solactive Global Multilateral Development Bank Bond USD 40% 1‑5 Year 60% 5‑10 Year Total Return Index, which are additional indices with characteristics relevant to the Fund. Indices reflect no deduction for fees, expenses or taxes. The Fund’s past performance (before and after taxes) is not necessarily an indication of how the Fund will perform in the future. Updated performance for the Fund is available at www.ubs.com/us/en/assetmanagement/funds/mutual-fund-performance. Class P2 shares do not bear initial or contingent deferred sales charges or ongoing 12b‑1 service and distribution fees, but Class P2 shares held through advisory programs may be subject to a program fee, advisory fee or other fees, which, if included, would have reduced performance.
After-tax returns are calculated using the historical highest individual federal marginal income tax rates and do not reflect the impact of state and local taxes. Actual after-tax returns depend on an investor’s tax situation and may differ from those shown. In addition, the aftertax returns shown are not relevant to investors who hold Fund shares through tax-advantaged arrangements, such as 401(k) plans or individual retirement accounts. After-tax returns for other classes will vary from the Class P2 shares’ after-tax returns shown.
|
| Performance Past Does Not Indicate Future [Text] |
The Fund’s past performance (before and after taxes) is not necessarily an indication of how the Fund will perform in the future.
|
| Performance Information Illustrates Variability of Returns [Text] |
The information provides some indication of the risks of investing in the Fund by showing changes in the Fund’s performance year to year and by showing how the Fund’s average annual total returns compare with those of a broad measure of market performance.
|
| Performance Additional Market Index [Text] |
The table also shows the Bloomberg U.S. Treasury Index and Solactive Global Multilateral Development Bank Bond USD 40% 1‑5 Year 60% 5‑10 Year Total Return Index, which are additional indices with characteristics relevant to the Fund.
|
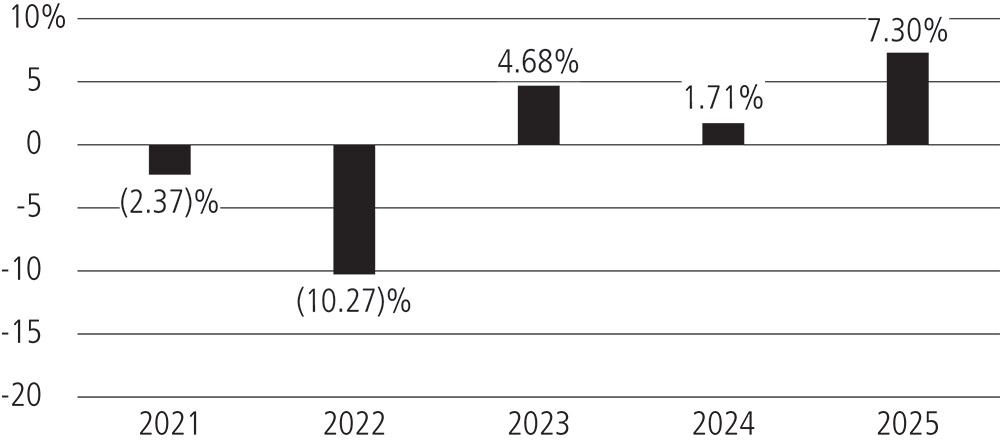
| Bar Chart [Heading] |
Total return (Class P2)*
|
| Bar Chart [Table] |
|
| Bar Chart Footnotes [Text Block] |
* 2021 is the Fund’s Class P2 shares’ first full year of operations
|
| Bar Chart Closing [Text Block] |
Total return January 1 - September 30, 2026: (2.50)%
Best quarter during calendar years shown—Q4 2023: 4.78%
Worst quarter during calendar years shown—1Q 2022: (4.99)%
|
| Year to Date Return, Label [Optional Text] |
Total return
|
| Bar Chart, Year to Date Return |
(2.50%)
|
| Bar Chart, Year to Date Return, Date |
Sep. 30, 2026
|
| Highest Quarterly Return, Label [Optional Text] |
Best quarter
|
| Highest Quarterly Return |
4.78%
|
| Highest Quarterly Return, Date |
Dec. 31, 2023
|
| Lowest Quarterly Return, Label [Optional Text] |
Worst quarter
|
| Lowest Quarterly Return |
(4.99%)
|
| Lowest Quarterly Return, Date |
Mar. 31, 2022
|
| Performance Table Heading |
Average annual total returns (for the periods ended December 31, 2025)
|
| Performance Table Uses Highest Federal Rate |
After-tax returns are calculated using the historical highest individual federal marginal income tax rates and do not reflect the impact of state and local taxes.
|
| Performance Table Not Relevant to Tax Deferred |
Actual after-tax returns depend on an investor’s tax situation and may differ from those shown. In addition, the aftertax returns shown are not relevant to investors who hold Fund shares through tax-advantaged arrangements, such as 401(k) plans or individual retirement accounts.
|
| Performance [Table] |
Class (inception date)
| | 1 year
| | 5 years
| | Life of
Class
| |
Class P2 (10/30/20)
Return before taxes
| | | 7.30
| %
| | | 0.02
| %
| | | 0.08
| %
| |
Return after taxes on distributions
| | | 5.75
| | | | (0.92
| )
| | | (1.00
| )
| |
Return after taxes on distributions and sale of fund shares
| | | 4.30
| | | | (0.39
| )
| | | (0.37
| )
| |
Bloomberg U.S. Treasury Index
| | | 6.32
| | | | (0.99
| )
| | | (0.94
| )
| |
Bloomberg US Aggregate Bond Index
| | | 7.30
| | | | (0.36
| )
| | | (0.14
| )
| |
Solactive Global Multilateral Development Bank Bond USD 40% 1‑5 Year 60% 5‑10 Year Total Return Index
| | | 7.36
| | | | 0.11
| | | | 0.16
| | |
|
| Performance Table One Class of after Tax Shown [Text] |
After-tax returns for other classes will vary from the Class P2 shares’ after-tax returns shown.
|
| Index No Deduction for Fees, Expenses, or Taxes [Text] |
Indices reflect no deduction for fees, expenses or taxes.
|
| Performance Availability Website Address [Text] |
www.ubs.com/us/en/assetmanagement/funds/mutual-fund-performance
|