The Fund seeks current income.
These tables describe the fees and expenses that you may pay if you buy, hold, and sell shares of the Fund. Shares of Class P2 are available for purchase on behalf of clients of a fee-based program or certain other advisory programs in which UBS Asset Management (Americas) LLC, the Fund’s investment advisor and administrator (“UBS AM (Americas)” or the “Advisor”) exercises investment discretion. Clients pay a wrap fee or a similar advisory fee to participate in such programs. Shares of Class P2 are also available for purchase on behalf of institutional clients with which the Advisor or its affiliates has signed a separate investment management agreement, pursuant to which such clients pay an advisory fee.
|
| Class P2 |
| |
Maximum front-end sales charge (load) imposed on purchases |
|
| None |
|
Maximum contingent deferred sales charge (load) (CDSC) (as a % of |
|
| None |
|
|
| Class P2 | ||
Management fees |
|
| 0.15 | % |
Distribution and/or service (12b‑1) fees |
|
| None |
|
Other expenses1 |
|
| 0.56 |
|
Total annual fund operating expenses |
|
| 0.71 |
|
Less management fee waiver/expense reimbursements2 |
|
| 0.56 |
|
Total annual fund operating expenses after management fee |
|
| 0.15 |
|
1 | “Other expenses” include “Acquired fund fees and expenses,” which were less than 0.01% of the average net assets of the Fund. |
2 | The Trust, with respect to the Fund, and the Advisor, have entered into a written agreement pursuant to which the Advisor has agreed to (i) waive its management fees and retained administration fees, and (ii) reimburse expenses (excluding expenses incurred through investment in other investment companies, interest, taxes, brokerage commissions, dividend expense and security loan fees for securities sold short, and extraordinary expenses, such as proxy-related expenses) to the extent necessary so that the Fund’s ordinary operating expenses (excluding expenses incurred through investment in other investment companies, interest, taxes, brokerage commissions, dividend expense and security loan fees for securities sold short, and extraordinary expenses, such as proxy-related expenses) through the period ending October 28, 2027 do not exceed 0.15% for Class P2 shares. Pursuant to the written agreement, the Advisor is entitled to be reimbursed for any fees it waives and expenses it reimburses to the extent such reimbursement can be made during the three years following the period during which such fee waivers and expense reimbursements were made, provided that the reimbursement of the Advisor by the Fund will not cause the Fund to exceed the lesser of any applicable expense limit that is in place for the Fund (i) at the time of the waiver or reimbursement or (ii) at the time of the recoupment. The fee waiver/expense reimbursement agreement may be terminated by the Fund’s Board of Trustees at any time and also will terminate automatically upon the expiration or termination of the Fund’s advisory contract with the Advisor. Upon termination of the fee waiver/expense reimbursement agreement, however, UBS AM (Americas)’s three year recoupment rights will survive. |
This example is intended to help you compare the cost of investing in the Fund with the cost of investing in other mutual funds. The example assumes that you invest $10,000 in the Fund for the time periods indicated and then sell all of your shares at the end of those periods unless otherwise stated. The example also assumes that your investment has a 5% return each year and that the Fund’s operating expenses remain the same. The costs described in the example reflect the expenses of the Fund that would result from the contractual fee waiver and expense reimbursement agreement with the Advisor for the first year only. Although your actual costs may be higher or lower, based on these assumptions, your costs would be:
|
| 1 year |
|
| 3 years |
|
| 5 years |
|
| 10 years |
| ||||
Class P2 |
|
| $15 |
|
|
| $171 |
|
|
| $340 |
|
|
| $830 |
|
The Fund pays transaction costs, such as commissions, when it buys and sells securities (or “turns over” its portfolio). A higher portfolio turnover rate may indicate higher transaction costs and may result in higher taxes when Fund shares are held in a taxable account. These costs, which are not reflected in annual fund operating expenses or in the example, affect the Fund’s performance. During the most recent fiscal year, the Fund’s portfolio turnover rate was 40% of the average value of its portfolio.
Principal investments
Under normal circumstances, the Fund invests at least 80% of its net assets (plus borrowings for investment purposes, if any) in bonds and/or instruments that provide exposure to bonds issued by development banks. Development banks are financial organizations formed by government entities to promote economic and social development. The Fund invests in multilateral development bank bonds but may also invest in regional or national development bank obligations. The Fund’s investment in obligations issued by the International Bank for Reconstruction and Development and the Inter-American Development Bank may be significant, but the Fund normally will not invest more than 25% of its net assets in either issuer.
Under normal circumstances, the Fund will invest in securities that, at the time of purchase, possess a minimum rating of A3 by Moody’s Ratings (“Moody’s”) or A- by Standard & Poor’s Financial Services LLC (“S&P”) or Fitch Ratings, Inc. (“Fitch”), comparably rated by another nationally recognized statistical rating organization, or, if unrated, are determined by the Advisor to be of comparable quality.
The Fund’s investments in fixed income securities may have all types of interest rate payment and reset terms. The Fund generally invests only in US dollar-denominated securities.
The Fund may, but is not required to, engage in derivatives transactions. Derivative instruments such as futures may be used for risk management purposes to hedge against a specific security or for investment (non-hedging) purposes to earn income or adjust portfolio duration. The Fund does not seek to use derivatives extensively. Derivative instruments that provide investment exposure to investments in the Fund’s 80% investment policy or provide investment exposure to one or more of the market risk factors associated with such securities may be counted towards the Fund’s 80% investment policy.
The Fund may invest in exchange-traded funds (“ETFs”) to gain exposure to certain asset classes.
The Fund is a non-diversified fund, which means that the Fund may invest more of its assets in a smaller number of issuers than a diversified investment company.
Management process
The Advisor seeks to invest in bonds issued by development banks. The Advisor constructs the portfolio consisting of multilateral and regional development banks. The Advisor focuses primarily on bonds issued by multilateral development banks which may include, but are not limited to, the International Bank for Reconstruction and Development and other member institutions of the World Bank Group, the Inter-American Development Bank, the Asian Development Bank, the African Development Bank, and the European Bank for Reconstruction and Development. Development banks are formed by their member states with the objective to provide financial and technical assistance to improve overall living standards through sustainable economic development and growth, and, as such, the Advisor considers investments in development bank bonds to be sustainable investments. While each development bank has a distinct focus, development banks generally use their capital for projects that seek to improve the state of the developing world, promote sustainable growth and raise living standards.
The Advisor selects investments for the Fund based on available supply and liquidity parameters (including, for example, such factors as evaluating amounts outstanding, available dealer inventory, and volumes traded in the secondary market) utilizing a stratified sampling approach (investing in a representative cross-section of the investment universe) to optimize tracking error and minimize transaction cost. The Fund will be managed relative to a composite index, which is a blend of two market indexes designed to measure the performance of the US dollar denominated multilateral development bank bond market. The Fund does not seek to directly replicate the index. The Fund’s composite index is the Solactive Global Multilateral Development Bank Bond USD 40% 1‑5 Year 60% 5‑10 Year Total Return Index. The index aims to represent exposure to bonds issued by entitled multilateral development banks, defined as international financial institutions created for the purpose of economic development. Eligible issuers must meet minimum thresholds for ESG ratings and controversy scores, as defined by the index provider. The index methodology excludes issuers assessed to be failing standards of the UN Global Compact and excludes UN country sanctions. These norms are reflected using assessments by Sustainalytics. Non-compliant issues will be removed from the index at the subsequent rebalance and will be reflected in the fund in line with the rebalancing of the index. Activity-based exclusions are not applied by the index. The Fund reserves the right in its discretion to change the index.
The Fund’s development bank bond investments may include issuers that are not part of the composite index. The Fund will seek to maintain a concentrated portfolio of development bank bonds emphasizing multilateral development banks. The portfolio management team will select the bonds in the market that meet their selection criteria with intention to provide similar risk/return characteristics as the broader development bank bond market.
The Fund may engage in active trading to adjust the portfolio in response to investor activity and to rebalance the portfolio as new development bank issuers come to the market and existing issuers enter the index or mature.
The performance information that follows shows the Fund’s Class P2 performance information in a bar chart and an average annual total returns table.
The information provides some indication of the risks of investing in the Fund by showing changes in the Fund’s performance year to year and by showing how the Fund’s average annual total returns compare with those of a broad measure of market performance. The table also shows the Bloomberg U.S. Treasury Index and Solactive Global Multilateral Development Bank Bond USD 40% 1‑5 Year 60% 5‑10 Year Total Return Index, which are additional indices with characteristics relevant to the Fund. Indices reflect no deduction for fees, expenses or taxes. The Fund’s past performance (before and after taxes) is not necessarily an indication of how the Fund will perform in the future. Updated performance for the Fund is available at www.ubs.com/us/en/assetmanagement/funds/mutual-fund-performance. Class P2 shares do not bear initial or contingent deferred sales charges or ongoing 12b‑1 service and distribution fees, but Class P2 shares held through advisory programs may be subject to a program fee, advisory fee or other fees, which, if included, would have reduced performance.
After-tax returns are calculated using the historical highest individual federal marginal income tax rates and do not reflect the impact of state and local taxes. Actual after-tax returns depend on an investor’s tax situation and may differ from those shown. In addition, the aftertax returns shown are not relevant to investors who hold Fund shares through tax-advantaged arrangements, such as 401(k) plans or individual retirement accounts. After-tax returns for other classes will vary from the Class P2 shares’ after-tax returns shown.
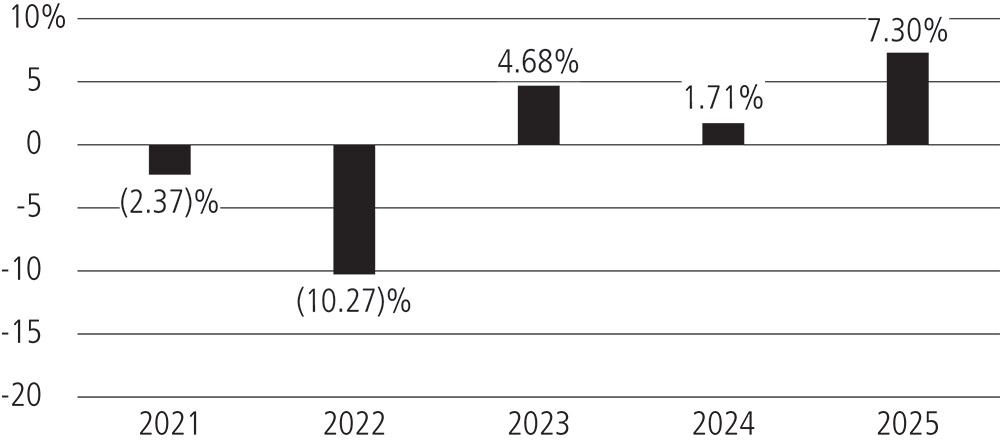
* 2021 is the Fund’s Class P2 shares’ first full year of operations
Total return January 1 - September 30, 2026: (2.50)%
Best quarter during calendar years shown—Q4 2023: 4.78%
Worst quarter during calendar years shown—1Q 2022: (4.99)%
Class (inception date) |
| 1 year |
| 5 years |
| Life of |
| ||||||
Class P2 (10/30/20) |
|
| 7.30 | % |
|
| 0.02 | % |
|
| 0.08 | % |
|
Return after taxes on distributions |
|
| 5.75 |
|
|
| (0.92 | ) |
|
| (1.00 | ) |
|
Return after taxes on distributions and sale of fund shares |
|
| 4.30 |
|
|
| (0.39 | ) |
|
| (0.37 | ) |
|
Bloomberg U.S. Treasury Index |
|
| 6.32 |
|
|
| (0.99 | ) |
|
| (0.94 | ) |
|
Bloomberg US Aggregate Bond Index |
|
| 7.30 |
|
|
| (0.36 | ) |
|
| (0.14 | ) |
|
Solactive Global Multilateral Development Bank Bond USD 40% 1‑5 Year 60% 5‑10 Year Total Return Index |
|
| 7.36 |
|
|
| 0.11 |
|
|
| 0.16 |
|
|