The Fund seeks to provide capital appreciation.
These tables describe the fees and expenses that you may pay if you buy, hold, and sell shares of the Fund. In addition to the fees and expenses described below, you also may be required to pay commissions or other fees to your broker for transactions in Class P shares.
| Class P |
Maximum front-end sales charge (load) imposed on purchases | None |
Maximum contingent deferred sales charge (load) (CDSC) | None |
| Class P | |
Management fees | 0.50 | % |
Distribution and/or service (12b-1) fees | None |
|
Other expenses1 | 0.25 |
|
Total annual fund operating expenses | 0.75 |
|
Less management fee waiver/expense reimbursements2 | 0.10 |
|
Total annual fund operating expenses after management fee | 0.65 |
|
1 | “Other expenses” include “Acquired fund fees and expenses,” which were less than 0.01% of the average net assets of the Fund. |
2 | The Trust, with respect to the Fund, and UBS Asset Management (Americas) LLC, the Fund’s investment advisor and administrator (“UBS AM (Americas)” or the “Advisor”), have entered into a written agreement pursuant to which the Advisor has agreed to waive a portion of its management fees and/or to reimburse expenses (excluding expenses incurred through investment in other investment companies, interest, taxes, brokerage commissions, dividend expense and security loan fees for securities sold short, and extraordinary expenses, such as proxy-related expenses) to the extent necessary so that the Fund’s ordinary operating expenses (excluding expenses incurred through investment in other investment companies, interest, taxes, brokerage commissions, dividend expense and security loan fees for securities sold short, and extraordinary expenses, such as proxy-related expenses), through the period ending October 28, 2027, do not exceed 0.65% for Class P shares. Pursuant to the written agreement, the Advisor is |
entitled to be reimbursed for any fees it waives and expenses it reimburses to the extent such reimbursement can be made during the three years following the period during which such fee waivers and expense reimbursements were made, provided that the reimbursement of the Advisor by the Fund will not cause the Fund to exceed the lesser of any applicable expense limit that is in place for the Fund (i) at the time of the waiver or reimbursement or (ii) at the time of the recoupment. The fee waiver/expense reimbursement agreement may be terminated by the Fund’s Board of Trustees at any time and also will terminate automatically upon the expiration or termination of the Fund’s advisory contract with the Advisor. Upon termination of the fee waiver/expense reimbursement agreement, however, UBS AM (Americas)’s three year recoupment rights will survive. |
This example is intended to help you compare the cost of investing in the Fund with the cost of investing in other mutual funds. The example assumes that you invest $10,000 in the Fund for the time periods indicated and then sell all of your shares at the end of those periods unless otherwise stated. The example also assumes that your investment has a 5% return each year and that the Fund’s operating expenses remain the same. The costs described in the example reflect the expenses of the Fund that would result from the contractual fee waiver and expense reimbursement agreement with the Advisor for the first year only. Although your actual costs may be higher or lower, based on these assumptions, your costs would be:
|
| 1 year |
|
| 3 years |
|
| 5 years |
|
| 10 years |
| ||||||||
Class P |
|
| $ | 66 |
|
|
| $ | 230 |
|
|
| $ | 407 |
|
|
| $ | 921 |
|
The Fund pays transaction costs, such as commissions, when it buys and sells securities (or “turns over” its portfolio). A higher portfolio turnover rate may indicate higher transaction costs and may result in higher taxes when Fund shares are held in a taxable account. These costs, which are not reflected in annual fund operating expenses or in the example, affect the Fund’s performance. During the most recent fiscal year, the Fund’s portfolio turnover rate was 36% of the average value of its portfolio.
Principal investments
To achieve its investment objective, the Fund invests in, or seeks exposure to, stocks with attractive growth, quality, and valuation profiles.
Under normal circumstances, the Fund invests at least 80% of its net assets (plus borrowings for investment purposes, if any) in US growth companies. The Fund invests primarily in stocks of companies that are believed to have substantial potential for capital growth. The Fund defines a company as a growth company if it is (i) included in an index that is representative of growth companies; (ii) classified as a growth company by an independent third party financial data provider; or (iii) considered by the advisor to exhibit characteristics of a growth company, considering metrics such as historical and/or projected growth rates relative to the applicable equity market.
The Advisor considers a number of factors to determine whether an investment is tied to the United States, including whether the issuer is listed in the United States, the issuer is organized in the United States, the issuer derives at least 50% of its revenues in the United States, the issuer has at least 50% of its assets in the United States, the investment is included in an index representative of the United States, and the investment is exposed to the economic fortunes and risks of the United States.
Under normal circumstances, the Fund invests a substantial portion of its net assets in large-capitalization equities traded in the United States. Investments in equity securities may include but are not limited to common stock (including REITs) of issuers located throughout the world, and American Depositary Receipts. The Fund may invest in issuers from both developed markets (including the United States) and emerging markets.
Under normal market conditions, the Advisor intends to invest the Fund’s portfolio under the following guidelines, but reserves the right to deviate if economic and business conditions warrant:
• | 20‑50 stocks in the portfolio |
• | Companies with a market capitalization of $2.5 billion or greater |
• | Typical allocation to American Depository Receipts (ADRs) of 15% or less |
• | Minimum of 6 sectors included in the portfolio for diversification purposes |
• | The Fund aims to be fully invested but may allow for a cash allocation—with a range of 0.50‑10% of net assets—for liquidity purposes. |
The Fund is a non-diversified fund, which means that the Fund may invest more of its assets in a smaller number of issuers than a diversified investment company.
Under certain market conditions, the Fund may, but is not required to, use exchange traded derivative instruments for risk management purposes or as part of the Fund’s investment strategies. Generally, derivatives are financial contracts whose value depends upon, or is derived from, the value of an underlying asset, reference rate, index or other market factor and may relate to stocks, bonds, interest rates, credit, currencies or currency exchange rates, commodities and related indices. The derivatives in which the Fund may invest include futures, forward currency agreements and equity participation notes. All of these derivatives may be used for risk management purposes to manage or adjust the risk profile of the Fund. Futures on currencies and forward currency agreements may also be used to hedge against a specific currency. In addition, all of the derivative instruments listed above may be used for investment (non-hedging) purposes to earn income; to enhance returns; to replace more traditional direct investments (except for forward currency agreements); or to obtain exposure to certain markets (except for forward currency agreements). The Fund also may use futures contracts on equity securities and indices to gain market exposure on its uninvested cash. Derivative instruments that provide investment exposure to investments in the Fund’s 80% investment policy or provide investment exposure to one or more of the market risk factors associated with such securities may be counted towards the Fund’s 80% investment policy.
The Fund also may at times invest in ETFs and other investment companies for the purpose of gaining exposure to the stock market while maintaining liquidity.
In pursuing its investment strategy, depending upon market and economic conditions, the Fund may have a significant degree of investments in securities of issuers within a single sector or industry, including the information technology sector and semiconductor industry.
Management process
The Advisor seeks to invest in high quality companies, expected to deliver above-average earnings per share (EPS) growth over the next 3‑5 years, trading at attractive valuations. The Advisor believes that investment risks inherent in investing in higher growth-oriented stocks can be mitigated by focusing on both higher quality companies and being disciplined regarding valuations. Using this approach, the Advisor believes the portfolio can deliver attractive risk-adjusted total returns through the market cycle when compared to US large-cap growth indices.
The portfolio management team defines “reasonable price” as attractive valuation relative to the broader growth index (Russell 1000 Growth Index). While the primary metric used to assess valuation is price-to-earnings, the team may include other metrics such as enterprise value-to-earnings before interest, taxes, depreciation and amortization (“EBITDA”) and price-to-sales.
In selecting individual securities for investment, the Advisor begins with a proprietary quantitative model. The investable universe of stocks are scored using the following metrics:
• | High-quality as defined by margin stability over a business cycle and return on equity. |
• | Expected earnings growth over the next 3‑5 years |
• | Valuation relative to the broader growth index (Russell 1000 Growth Index). |
The Advisor may modify the quantitative screening process at any time, without shareholder approval or notice.
Stocks are then reviewed from a “bottom-up” or fundamental perspective by the Advisor, leveraging the intellectual capital of UBS Global Wealth Management (“WM”), an affiliate of the Advisor, Chief Investment Office (“CIO”) equity strategists and equity sector analysts, as well as other resources. The Advisor assesses the fundamental outlook for revenues, earnings, quality, and valuation—among other metrics—while determining potential upside and downside risks given current and expected market environments. This assessment is determined with the intention of owning stocks for the portfolio over a multi-year time horizon.
In addition, the Advisor constructs the portfolio taking into account several investment considerations including but not limited to: the UBS House View (a publication of macro and thematic views of WM CIO) on markets, regions, sectors and style factors. While the Advisor may receive input from multiple business units within UBS, the Advisor has final discretion in the portfolio’s construction.
The Fund’s investment process integrates material sustainability and/or environmental, social and governance (“ESG”) considerations into the research process for portfolio investments and portfolio holdings for which ESG data is available. Therefore, the Advisor does not assess every investment for ESG factors and, when it does, not every ESG factor may be identified or evaluated. ESG integration is driven by taking into account material sustainability and/or ESG risks which could impact investment returns, rather than being driven by
specific ethical principles or norms. The analysis of material sustainability and/or ESG considerations can include many different aspects, including, for example, the carbon footprint, employee health and well-being, supply chain management, fair customer treatment and governance processes of a company. This analysis is captured in a qualitative ESG assessment by the Advisor that leverages internal research. The Advisor also accesses quantitative ESG data that combines multiple sources and provides information on ESG risks and opportunities. ESG considerations and weights considered may change over time. The Fund’s portfolio managers may still invest in securities without respect to sustainability and/or ESG considerations or in securities which present sustainability and/or ESG risks, including where the portfolio managers believe the potential compensation outweighs the risks identified.
Risk/return bar chart and table
The performance information that follows shows the Fund’s performance information in a bar chart and an average annual total returns table. The information provides some indication of the risks of investing in the Fund by showing changes in the Fund’s performance year to year and by showing how the Fund’s average annual total returns compare with those of a broad measure of market performance. The table also shows the Russell 1000 Growth Index, which is an additional index with characteristics relevant to the Fund. The indices reflect no deduction for fees, expenses or taxes. The Fund’s past performance (before and after taxes) is not necessarily an indication of how the Fund will perform in the future. Updated performance for the Fund is available at www.ubs.com/us/en/assetmanagement/funds/mutual-fund-performance.
After-tax returns are calculated using the historical highest individual federal marginal income tax rates and do not reflect the impact of state and local taxes. Actual after-tax returns depend on an investor’s tax situation and may differ from those shown. In addition, the after-tax returns shown are not relevant to investors who hold Fund shares through tax-advantaged arrangements, such as 401(k) plans or individual retirement accounts.
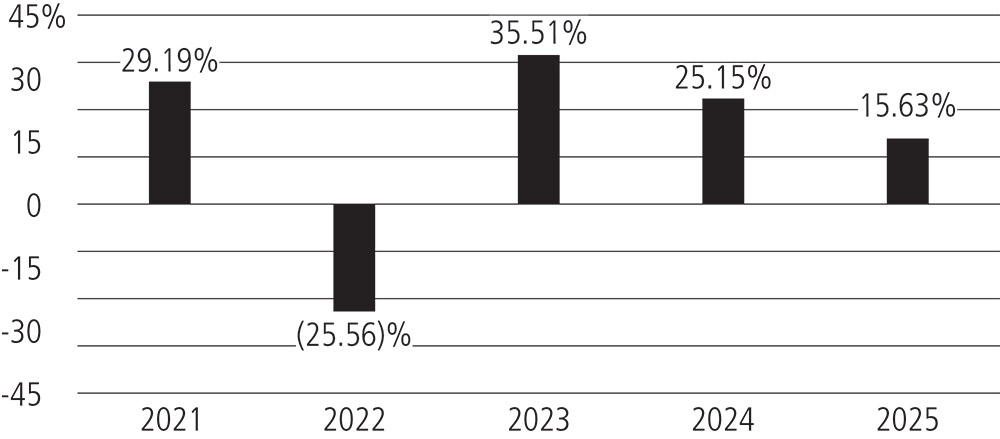
* 2021 is the Fund’s first full calendar year of operations.
Total return January 1—September 30, 2026: 5.02%
Best quarter during calendar years shown—2Q 2025: 16.28%
Worst quarter during calendar years shown—2Q 2022: (17.91)%
Class (inception date) |
|
| 1 year |
| 5 years |
| Life of class | |||
Class P (July 9, 2020) |
|
| 15.63 | % |
| 13.53 | % |
| 15.11 | % |
Return after taxes on distributions |
|
| 13.98 |
|
| 12.68 |
|
| 14.30 |
|
Return after taxes on distributions |
|
| 10.36 |
|
| 10.66 |
|
| 12.05 |
|
Russell 1000 Growth Index |
|
| 18.70 |
|
| 15.35 |
|
| 17.79 |
|
S&P 500 Index |
|
| 17.88 |
|
| 14.42 |
|
| 16.93 |
|