3Q 26 Earnings Presentation October 28, 2026 Exhibit 99.2
Legal Disclosures This document contains summarized information concerning Regional Management Corp. (the “Company”) and the Company’s business, operations, financial performance, and trends. No representation is made that the information in this document is complete. For additional financial, statistical, and business information, please see the Company’s most recent Annual Report on Form 10-K and Quarterly Reports on Form 10-Q filed with the U.S. Securities and Exchange Commission (the “SEC”), as well as the Company’s other reports filed with the SEC from time to time. Such reports are or will be available on the Company’s website (www.regionalmanagement.com) and on the SEC’s website (www.sec.gov). The information and opinions contained in this document are provided as of the date of this presentation and are subject to change without notice. This document has not been approved by any regulatory or supervisory authority. This presentation, the related remarks, and the responses to various questions may contain various “forward-looking statements” within the meaning of the Private Securities Litigation Reform Act of 1995. Forward-looking statements are not statements of historical fact but instead represent the Company’s expectations or beliefs concerning future events. Forward-looking statements include, without limitation, statements concerning financial outlook or future plans, objectives, goals, projections, strategies, events, or performance, and underlying assumptions and other statements related thereto. Words such as “may,” “will,” “should,” “likely,” “anticipates,” “expects,” “intends,” “plans,” “projects,” “believes,” “estimates,” “outlook,” and similar expressions may be used to identify these forward-looking statements. Such forward-looking statements speak only as of the date on which they were made and are about matters that are inherently subject to risks and uncertainties, many of which are outside of the control of the Company. As a result, actual performance and results may differ materially from those contemplated by these forward-looking statements. Therefore, investors should not place undue reliance on such statements. Factors that could cause actual results or performance to differ from the expectations expressed or implied in forward-looking statements include, but are not limited to, the following: managing growth effectively, implementing the Company’s growth strategy, opening new branches as planned, and continuing to expand our lending partnership with Column N.A.; the Company’s convenience check strategy; the Company’s policies and procedures for underwriting, processing, and servicing loans; the Company’s ability to collect on its loan portfolio; the Company’s insurance operations; exposure to credit risk and repayment risk, which risks may increase in light of adverse or recessionary economic conditions; the implementation of evolving underwriting models and processes, including as to the effectiveness of the Company’s custom scorecards; changes in the competitive environment in which the Company operates or a decrease in the demand for its products; the geographic concentration of the Company’s loan portfolio; the failure of third-party service providers, including those providing information technology products; changes in economic conditions in the markets the Company serves, including levels of unemployment and bankruptcies; the ability to achieve successful acquisitions and strategic alliances; the ability to realize the anticipated benefits from our lending partnership with Column N.A.; the ability to make technological improvements as quickly as competitors; security breaches, cyber-attacks, failures in information systems, or fraudulent activity; the development and use of artificial intelligence; the ability to originate loans; reliance on information technology resources and providers, including the risk of prolonged system outages; changes in current revenue and expense trends, including trends affecting delinquencies and credit losses; any future public health crises, including the impact of such crises on our operations and financial condition; changes in operating and administrative expenses; the departure, transition, or replacement of key personnel; the ability to timely and effectively implement, transition to, and maintain the necessary information technology systems, infrastructure, processes, and controls to support the Company’s operations and initiatives; changes in interest rates; existing sources of liquidity may become insufficient or access to these sources may become unexpectedly restricted; exposure to financial risk due to asset-backed securitization transactions; risks related to regulation and legal proceedings, including changes in laws or regulations or in the interpretation or enforcement of laws or regulations; changes in accounting standards, rules, and interpretations and the failure of related assumptions and estimates; the impact of changes in tax laws and guidance, including the timing and amount of revenues that may be recognized; risks related to the ownership of the Company's common stock, including volatility in the market price of shares of the Company's common stock; the timing and amount of future cash dividend payments; and anti-takeover provisions in the Company's charter documents and applicable state law. The foregoing factors and others are discussed in greater detail in the Company's filings with the SEC. The Company will not update or revise forward-looking statements to reflect events or circumstances after the date of this presentation or to reflect the occurrence of unanticipated events or the non-occurrence of anticipated events, whether as a result of new information, future developments, or otherwise, except as required by law. This presentation contains certain non-GAAP measures. Please refer to the Appendix accompanying this presentation for a reconciliation of non-GAAP measures to the most comparable GAAP measures. This presentation also contains certain financial terms and abbreviations. Please refer to the Appendix accompanying this presentation for a glossary of terms and abbreviations. 2
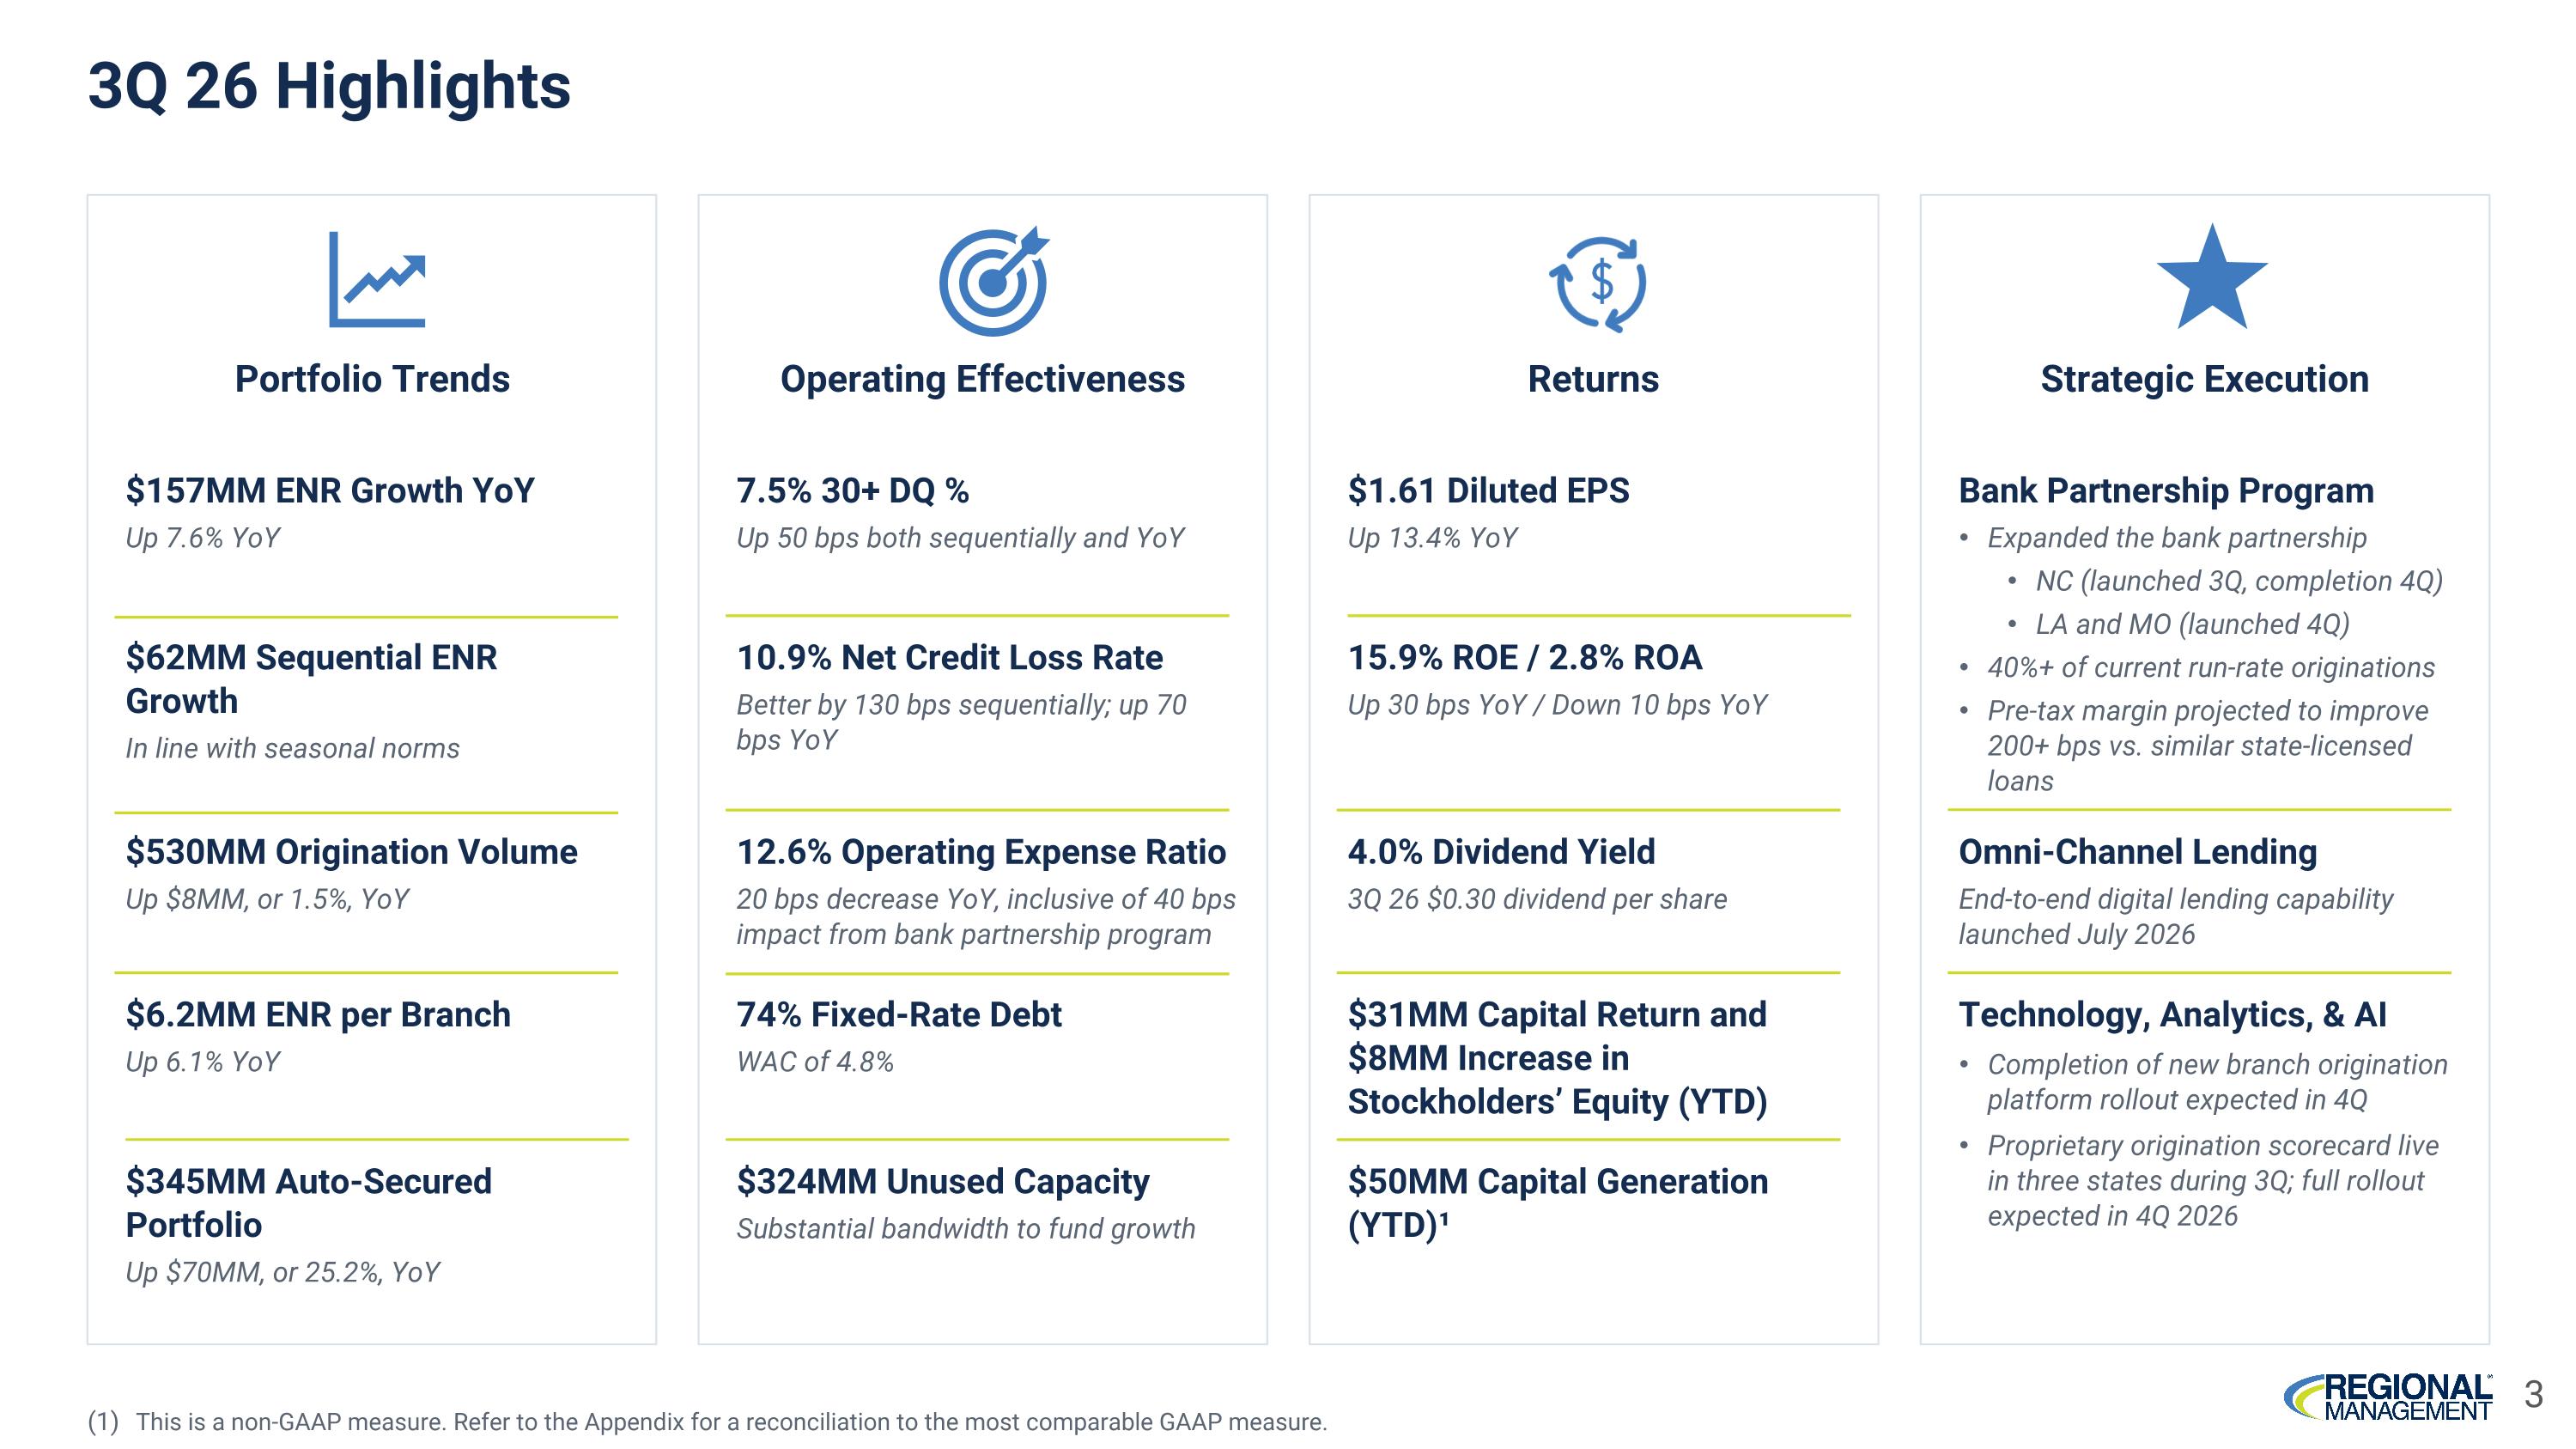
3Q 26 Highlights Portfolio Trends $157MM ENR Growth YoY Up 7.6% YoY $62MM Sequential ENR Growth In line with seasonal norms $530MM Origination Volume Up $8MM, or 1.5%, YoY $6.2MM ENR per Branch Up 6.1% YoY $345MM Auto-Secured Portfolio Up $70MM, or 25.2%, YoY Operating Effectiveness 7.5% 30+ DQ % Up 50 bps both sequentially and YoY 10.9% Net Credit Loss Rate Better by 130 bps sequentially; up 70 bps YoY 12.6% Operating Expense Ratio 20 bps decrease YoY, inclusive of 40 bps impact from bank partnership program 74% Fixed-Rate Debt WAC of 4.8% $324MM Unused Capacity Substantial bandwidth to fund growth Returns $1.61 Diluted EPS Up 13.4% YoY 15.9% ROE / 2.8% ROA Up 30 bps YoY / Down 10 bps YoY 4.0% Dividend Yield 3Q 26 $0.30 dividend per share $31MM Capital Return and $8MM Increase in Stockholders’ Equity (YTD) $50MM Capital Generation (YTD)¹ Strategic Execution Bank Partnership Program Expanded the bank partnership NC (launched 3Q, completion 4Q) LA and MO (launched 4Q) 40%+ of current run-rate originations Pre-tax margin projected to improve 200+ bps vs. similar state-licensed loans Omni-Channel Lending End-to-end digital lending capability launched July 2026 Technology, Analytics, & AI Completion of new branch origination platform rollout expected in 4Q Proprietary origination scorecard live in three states during 3Q; full rollout expected in 4Q 2026 This is a non-GAAP measure. Refer to the Appendix for a reconciliation to the most comparable GAAP measure. 3
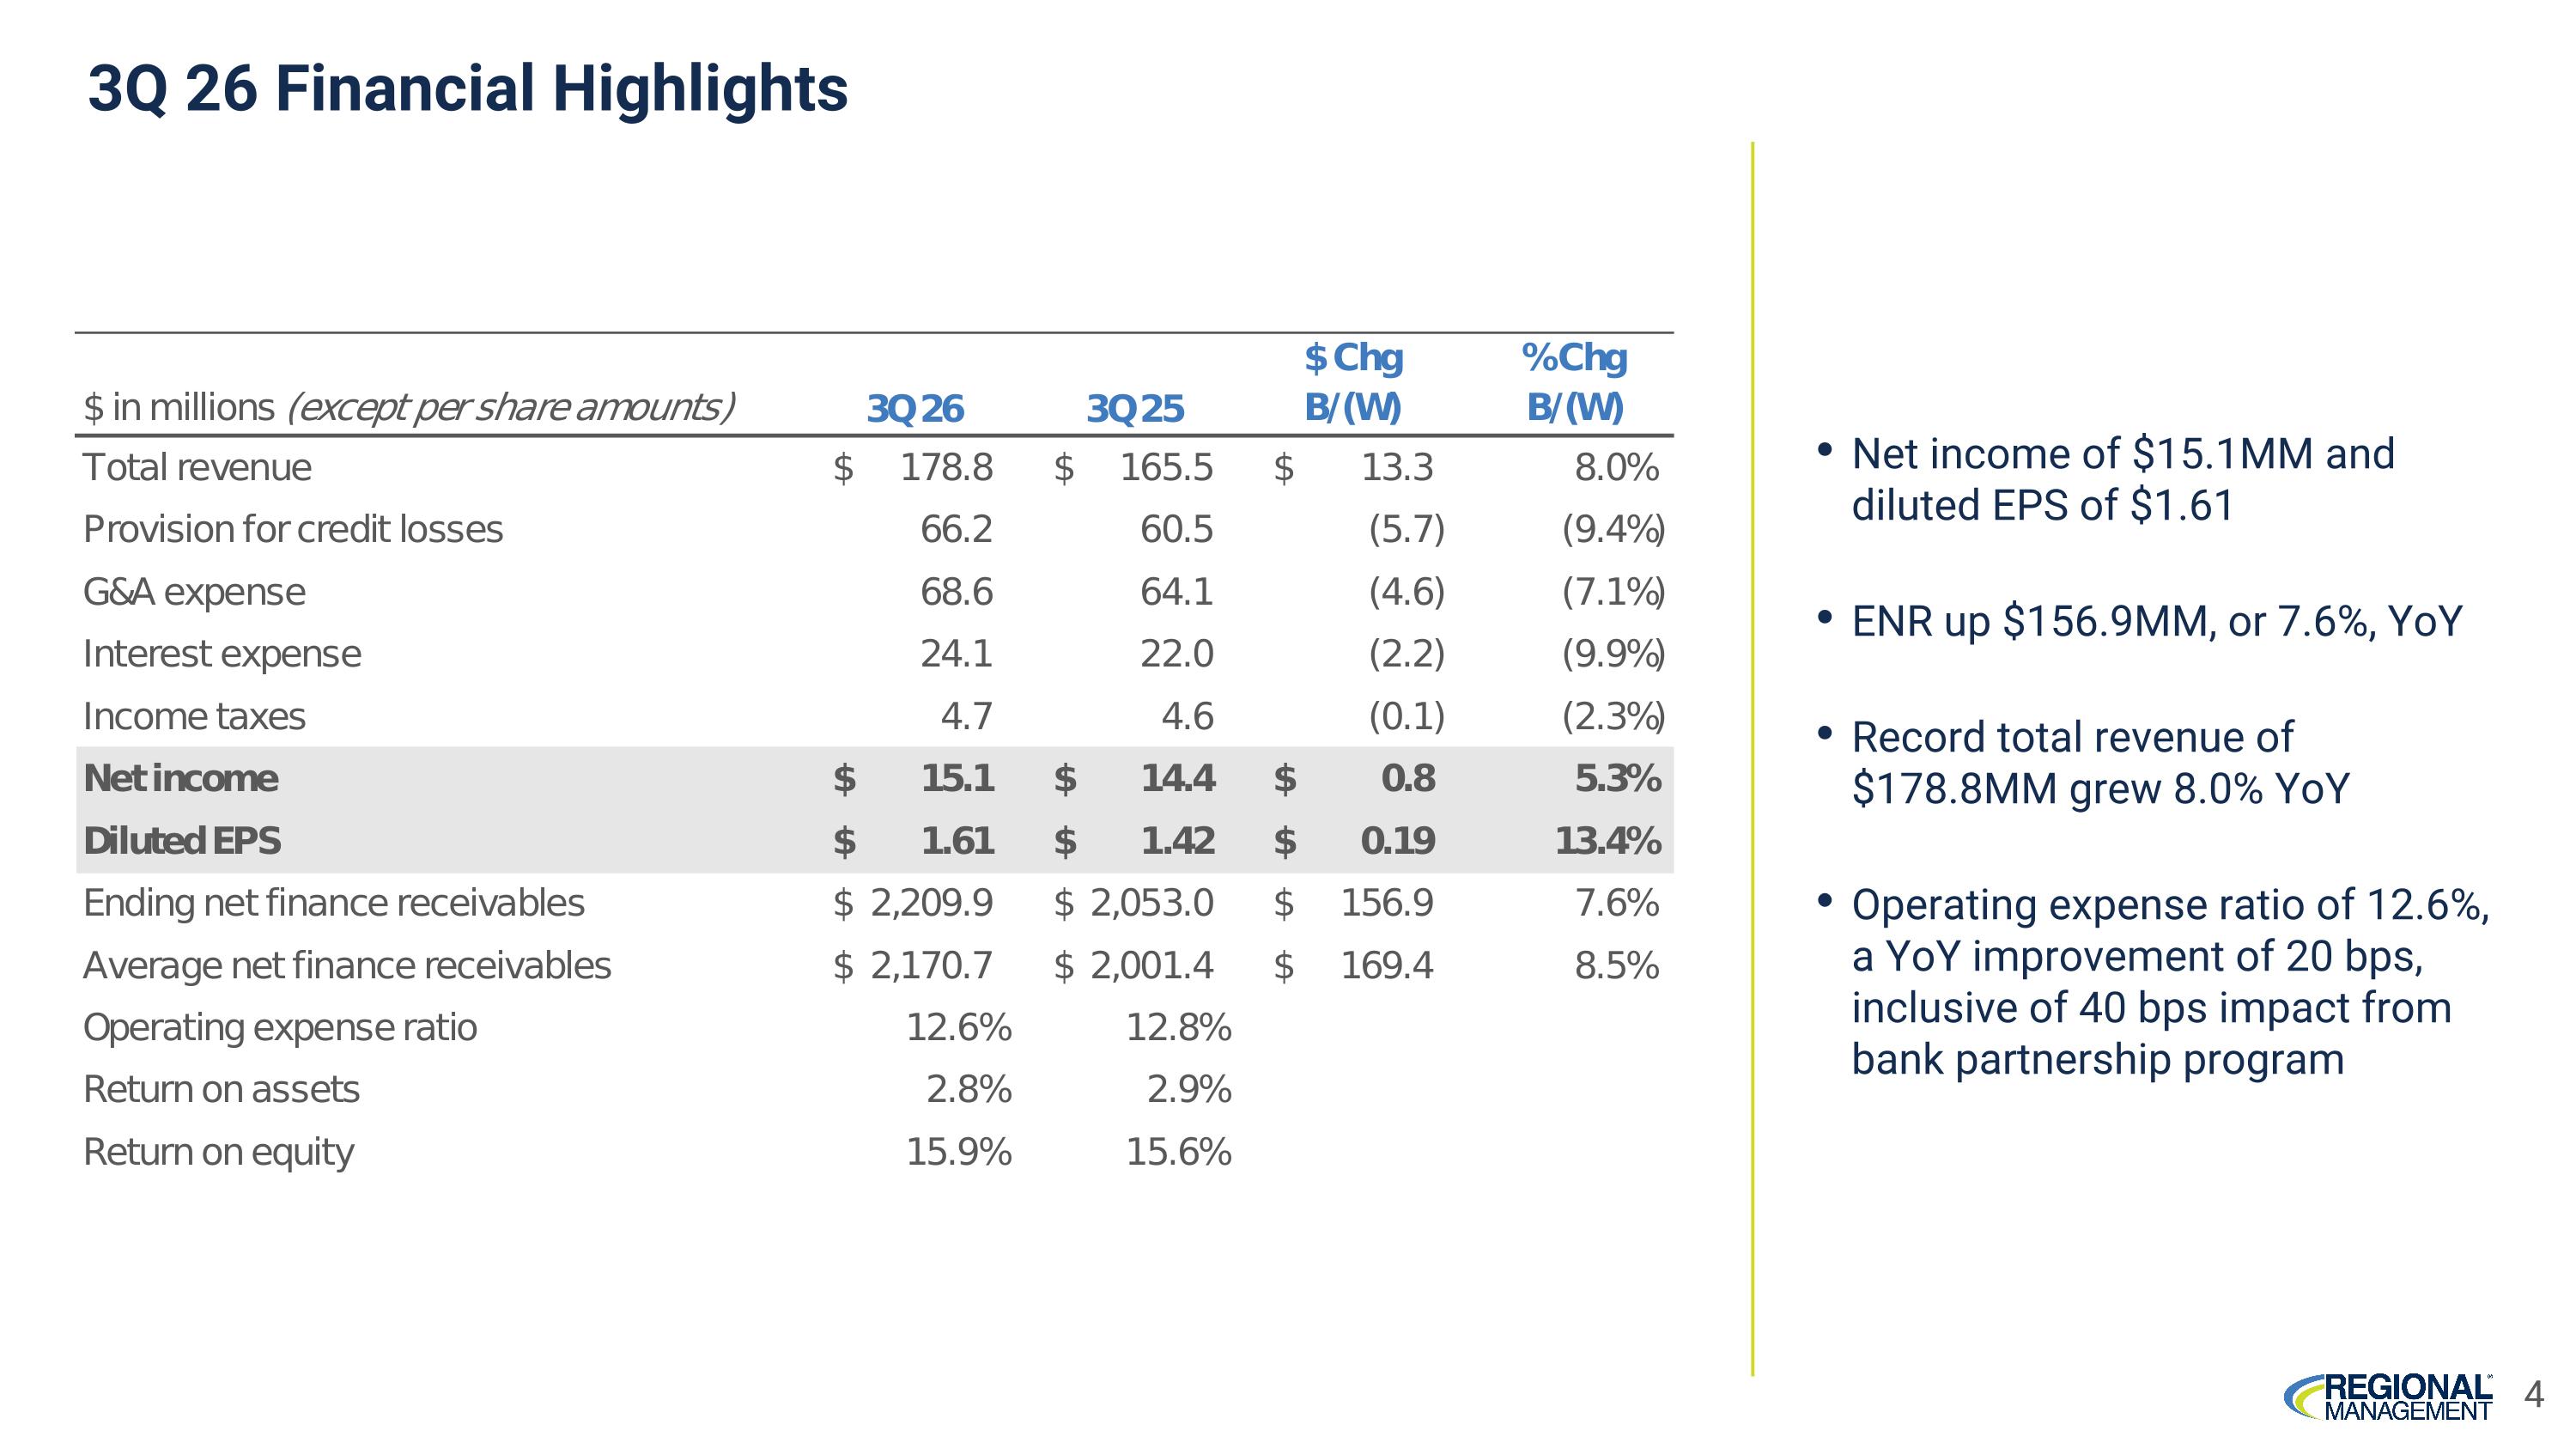
3Q 26 Financial Highlights Net income of $15.1MM and diluted EPS of $1.61 ENR up $156.9MM, or 7.6%, YoY Record total revenue of $178.8MM grew 8.0% YoY Operating expense ratio of 12.6%, a YoY improvement of 20 bps, inclusive of 40 bps impact from bank partnership program 4
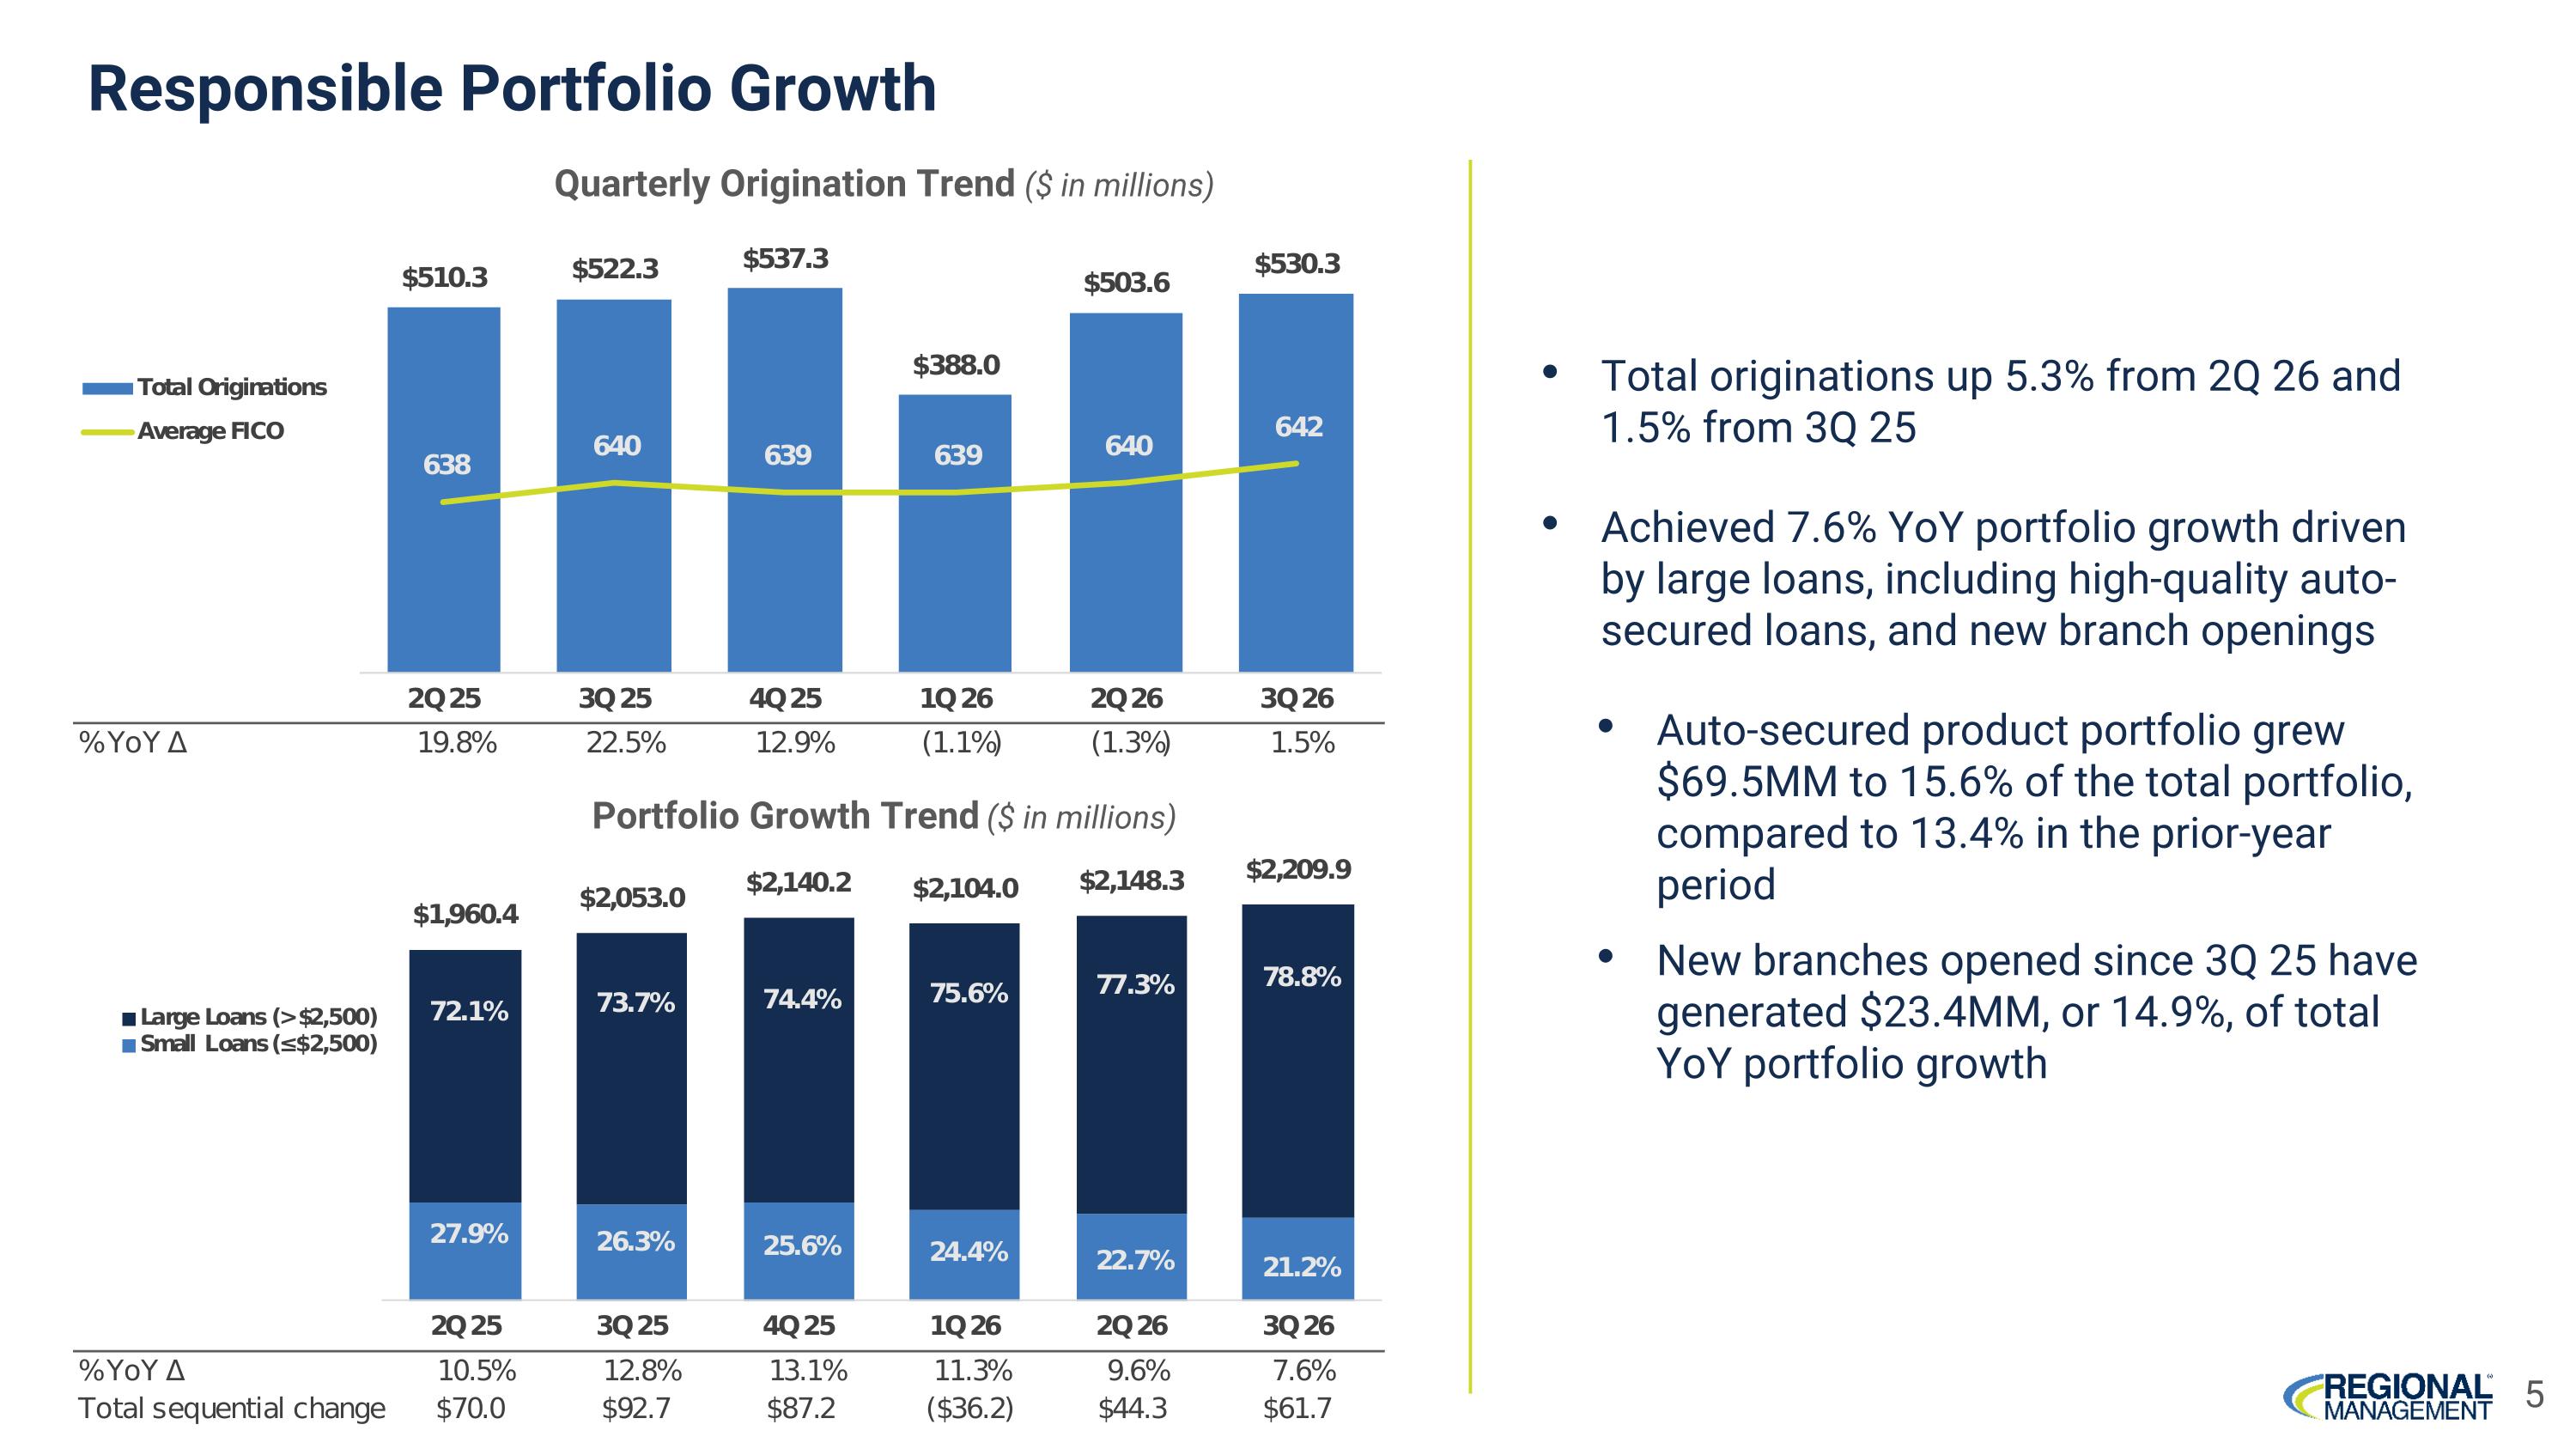
Responsible Portfolio Growth 5 Portfolio Growth Trend ($ in millions) Total originations up 5.3% from 2Q 26 and 1.5% from 3Q 25 Achieved 7.6% YoY portfolio growth driven by large loans, including high-quality auto-secured loans, and new branch openings Auto-secured product portfolio grew $69.5MM to 15.6% of the total portfolio, compared to 13.4% in the prior-year period New branches opened since 3Q 25 have generated $23.4MM, or 14.9%, of total YoY portfolio growth Quarterly Origination Trend ($ in millions)
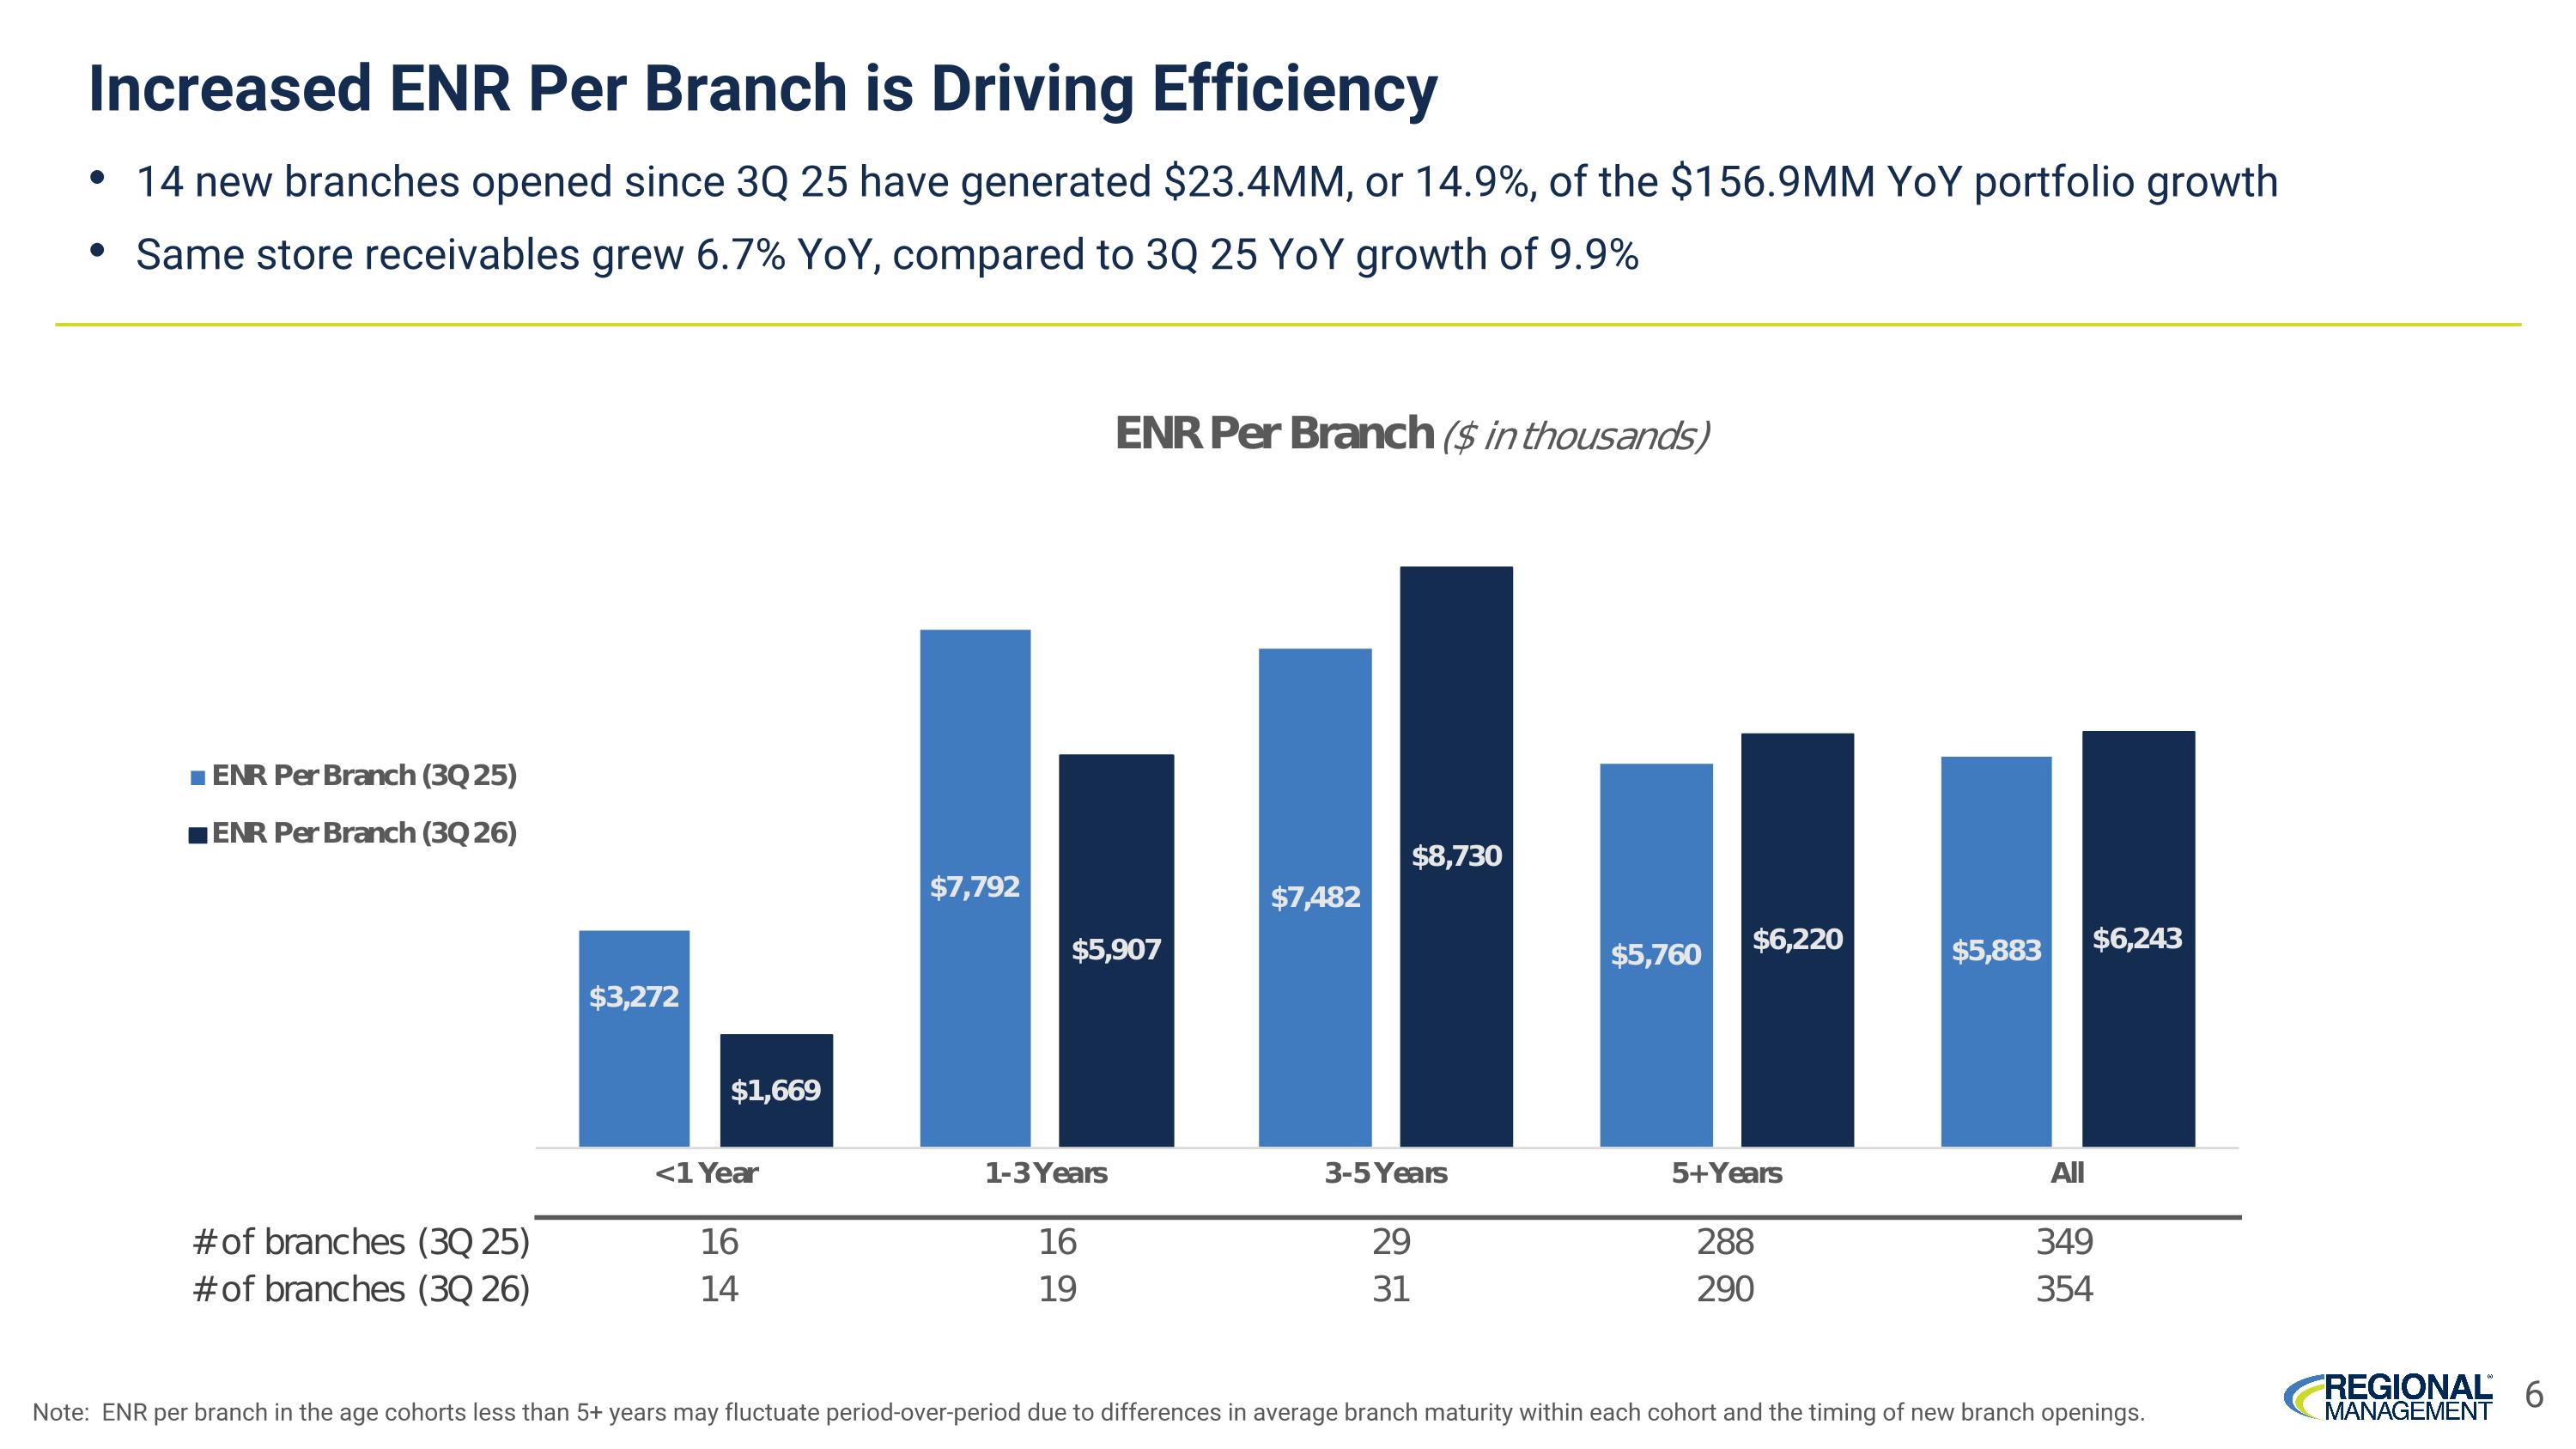
Increased ENR Per Branch is Driving Efficiency 14 new branches opened since 3Q 25 have generated $23.4MM, or 14.9%, of the $156.9MM YoY portfolio growth Same store receivables grew 6.7% YoY, compared to 3Q 25 YoY growth of 9.9% 6 Note: ENR per branch in the age cohorts less than 5+ years may fluctuate period-over-period due to differences in average branch maturity within each cohort and the timing of new branch openings.
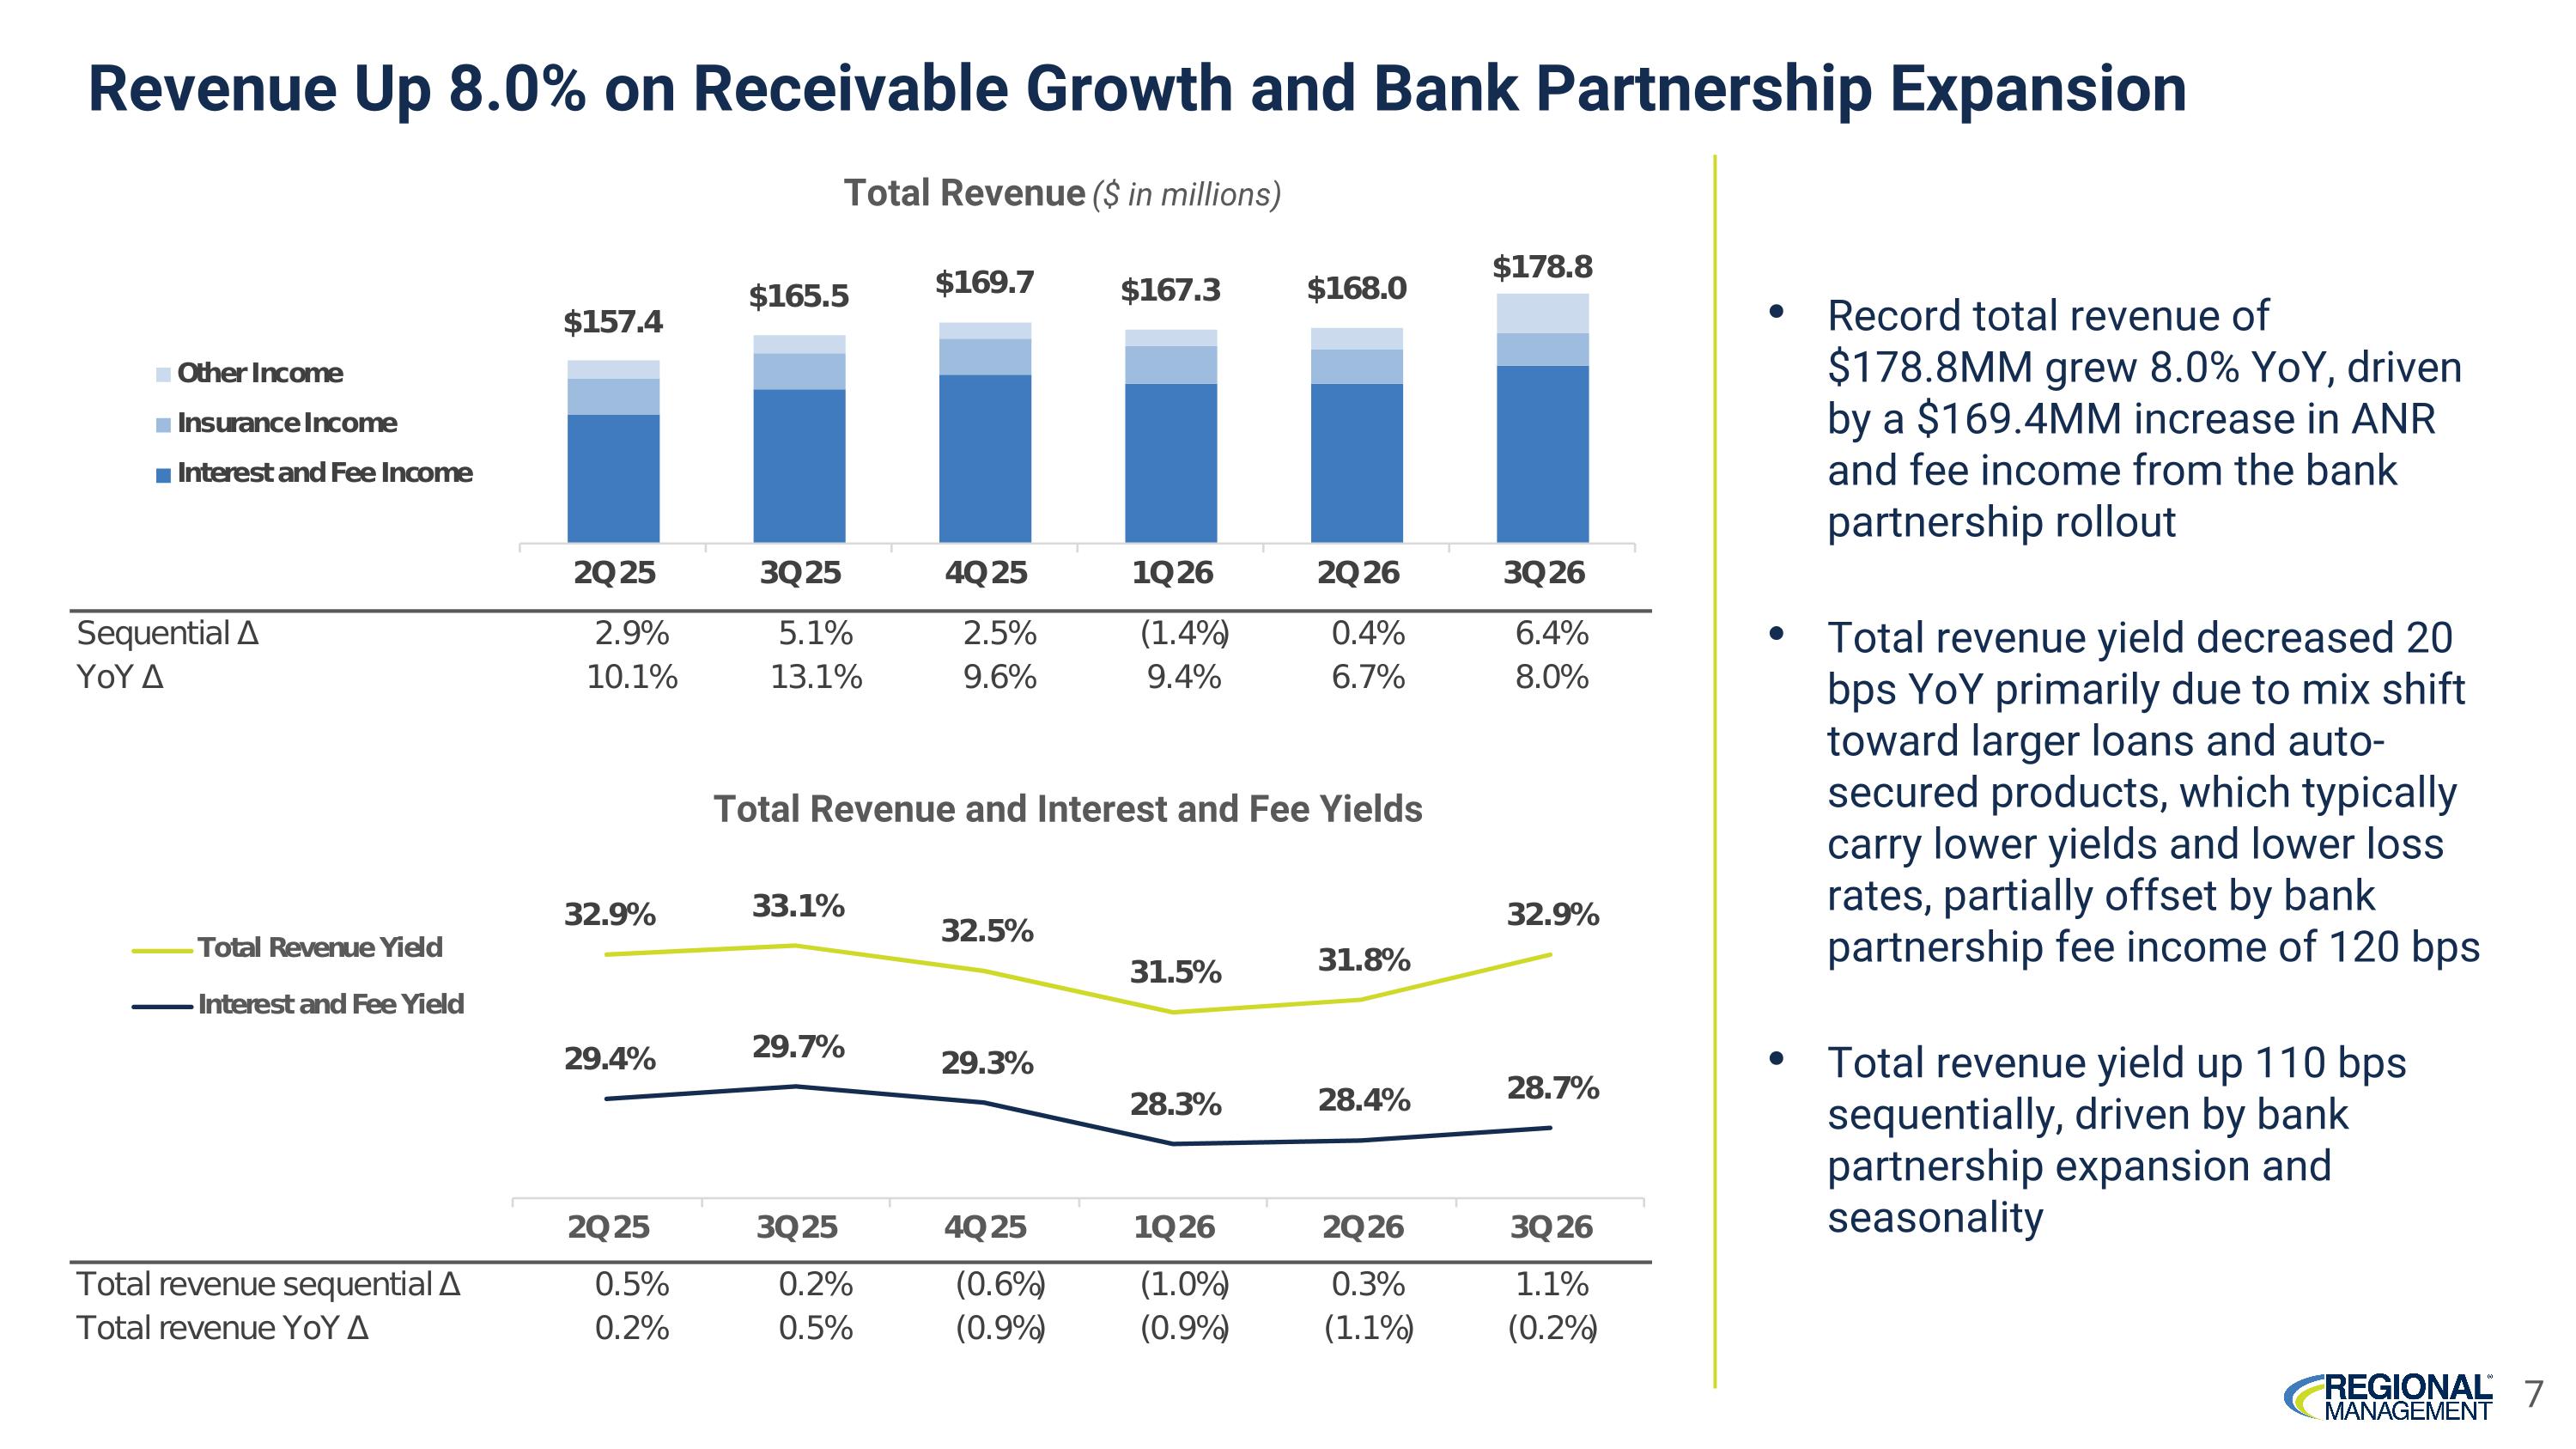
7 Revenue Up 8.0% on Receivable Growth and Bank Partnership Expansion Total Revenue and Interest and Fee Yields Total Revenue ($ in millions) Record total revenue of $178.8MM grew 8.0% YoY, driven by a $169.4MM increase in ANR and fee income from the bank partnership rollout Total revenue yield decreased 20 bps YoY primarily due to mix shift toward larger loans and auto-secured products, which typically carry lower yields and lower loss rates, partially offset by bank partnership fee income of 120 bps Total revenue yield up 110 bps sequentially, driven by bank partnership expansion and seasonality
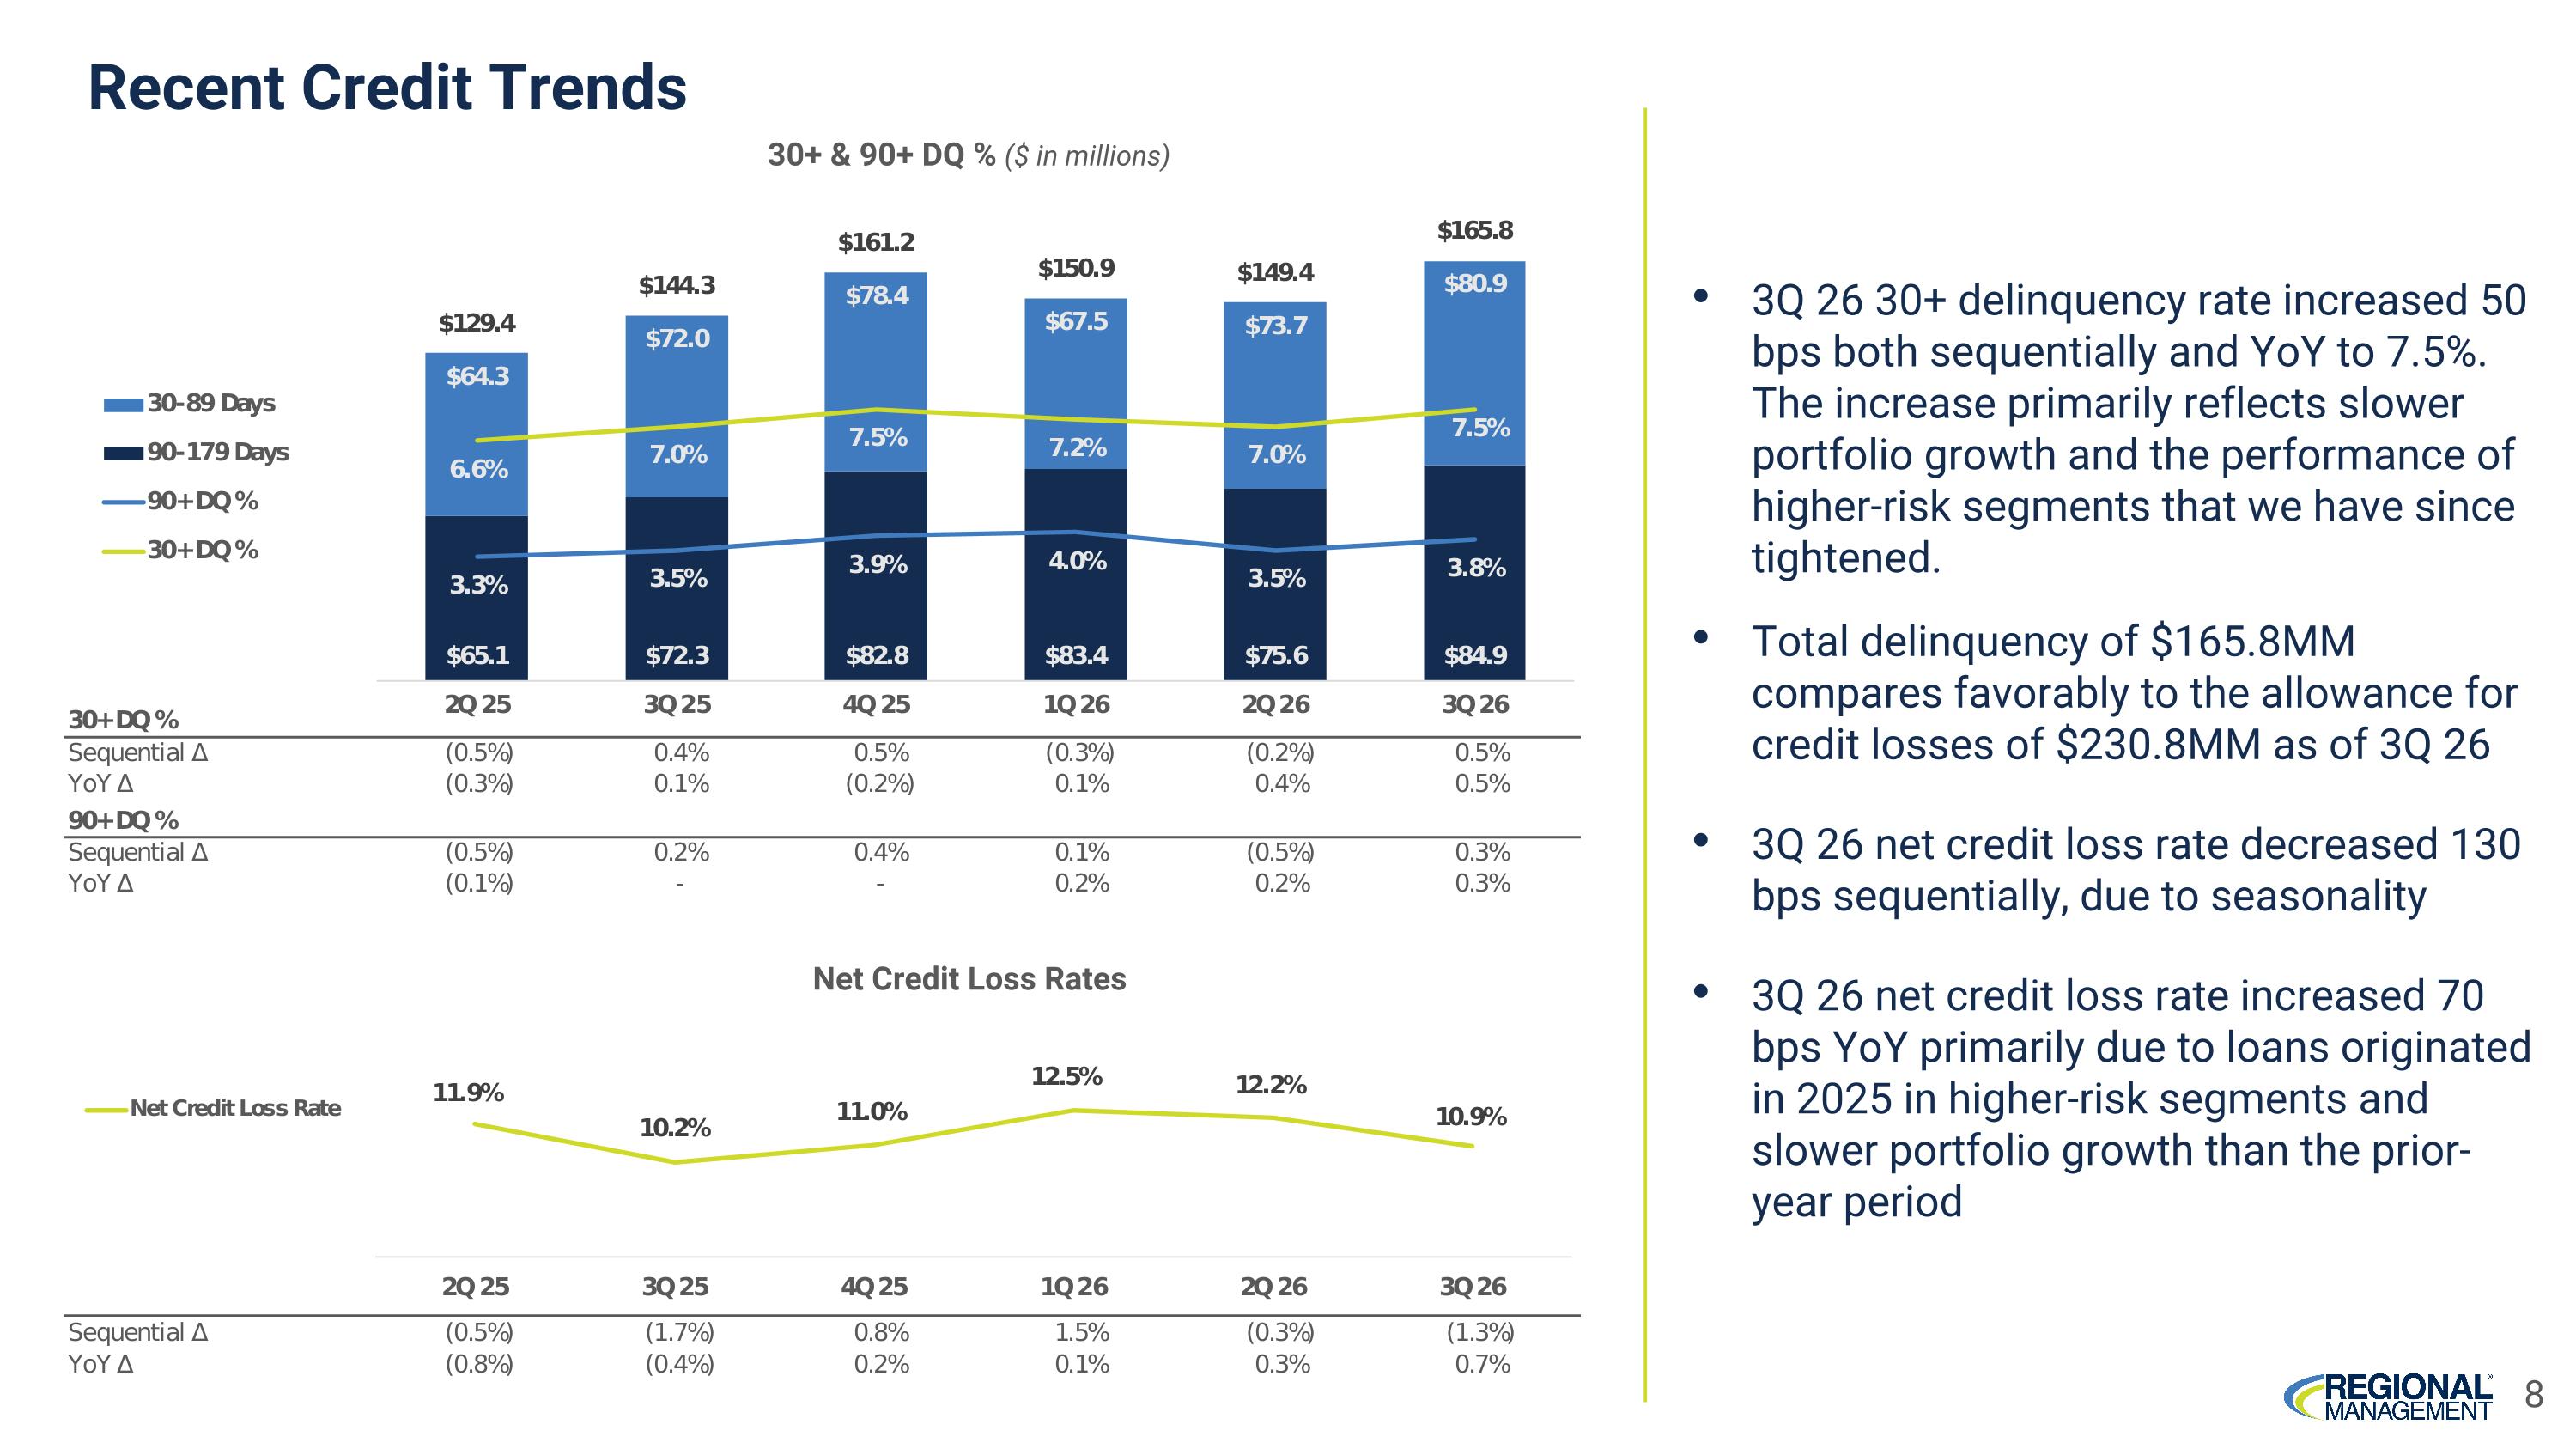
Recent Credit Trends 30+ & 90+ DQ % ($ in millions) Net Credit Loss Rates 8 3Q 26 30+ delinquency rate increased 50 bps both sequentially and YoY to 7.5%. The increase primarily reflects slower portfolio growth and the performance of higher-risk segments that we have since tightened. Total delinquency of $165.8MM compares favorably to the allowance for credit losses of $230.8MM as of 3Q 26 3Q 26 net credit loss rate decreased 130 bps sequentially, due to seasonality 3Q 26 net credit loss rate increased 70 bps YoY primarily due to loans originated in 2025 in higher-risk segments and slower portfolio growth than the prior-year period
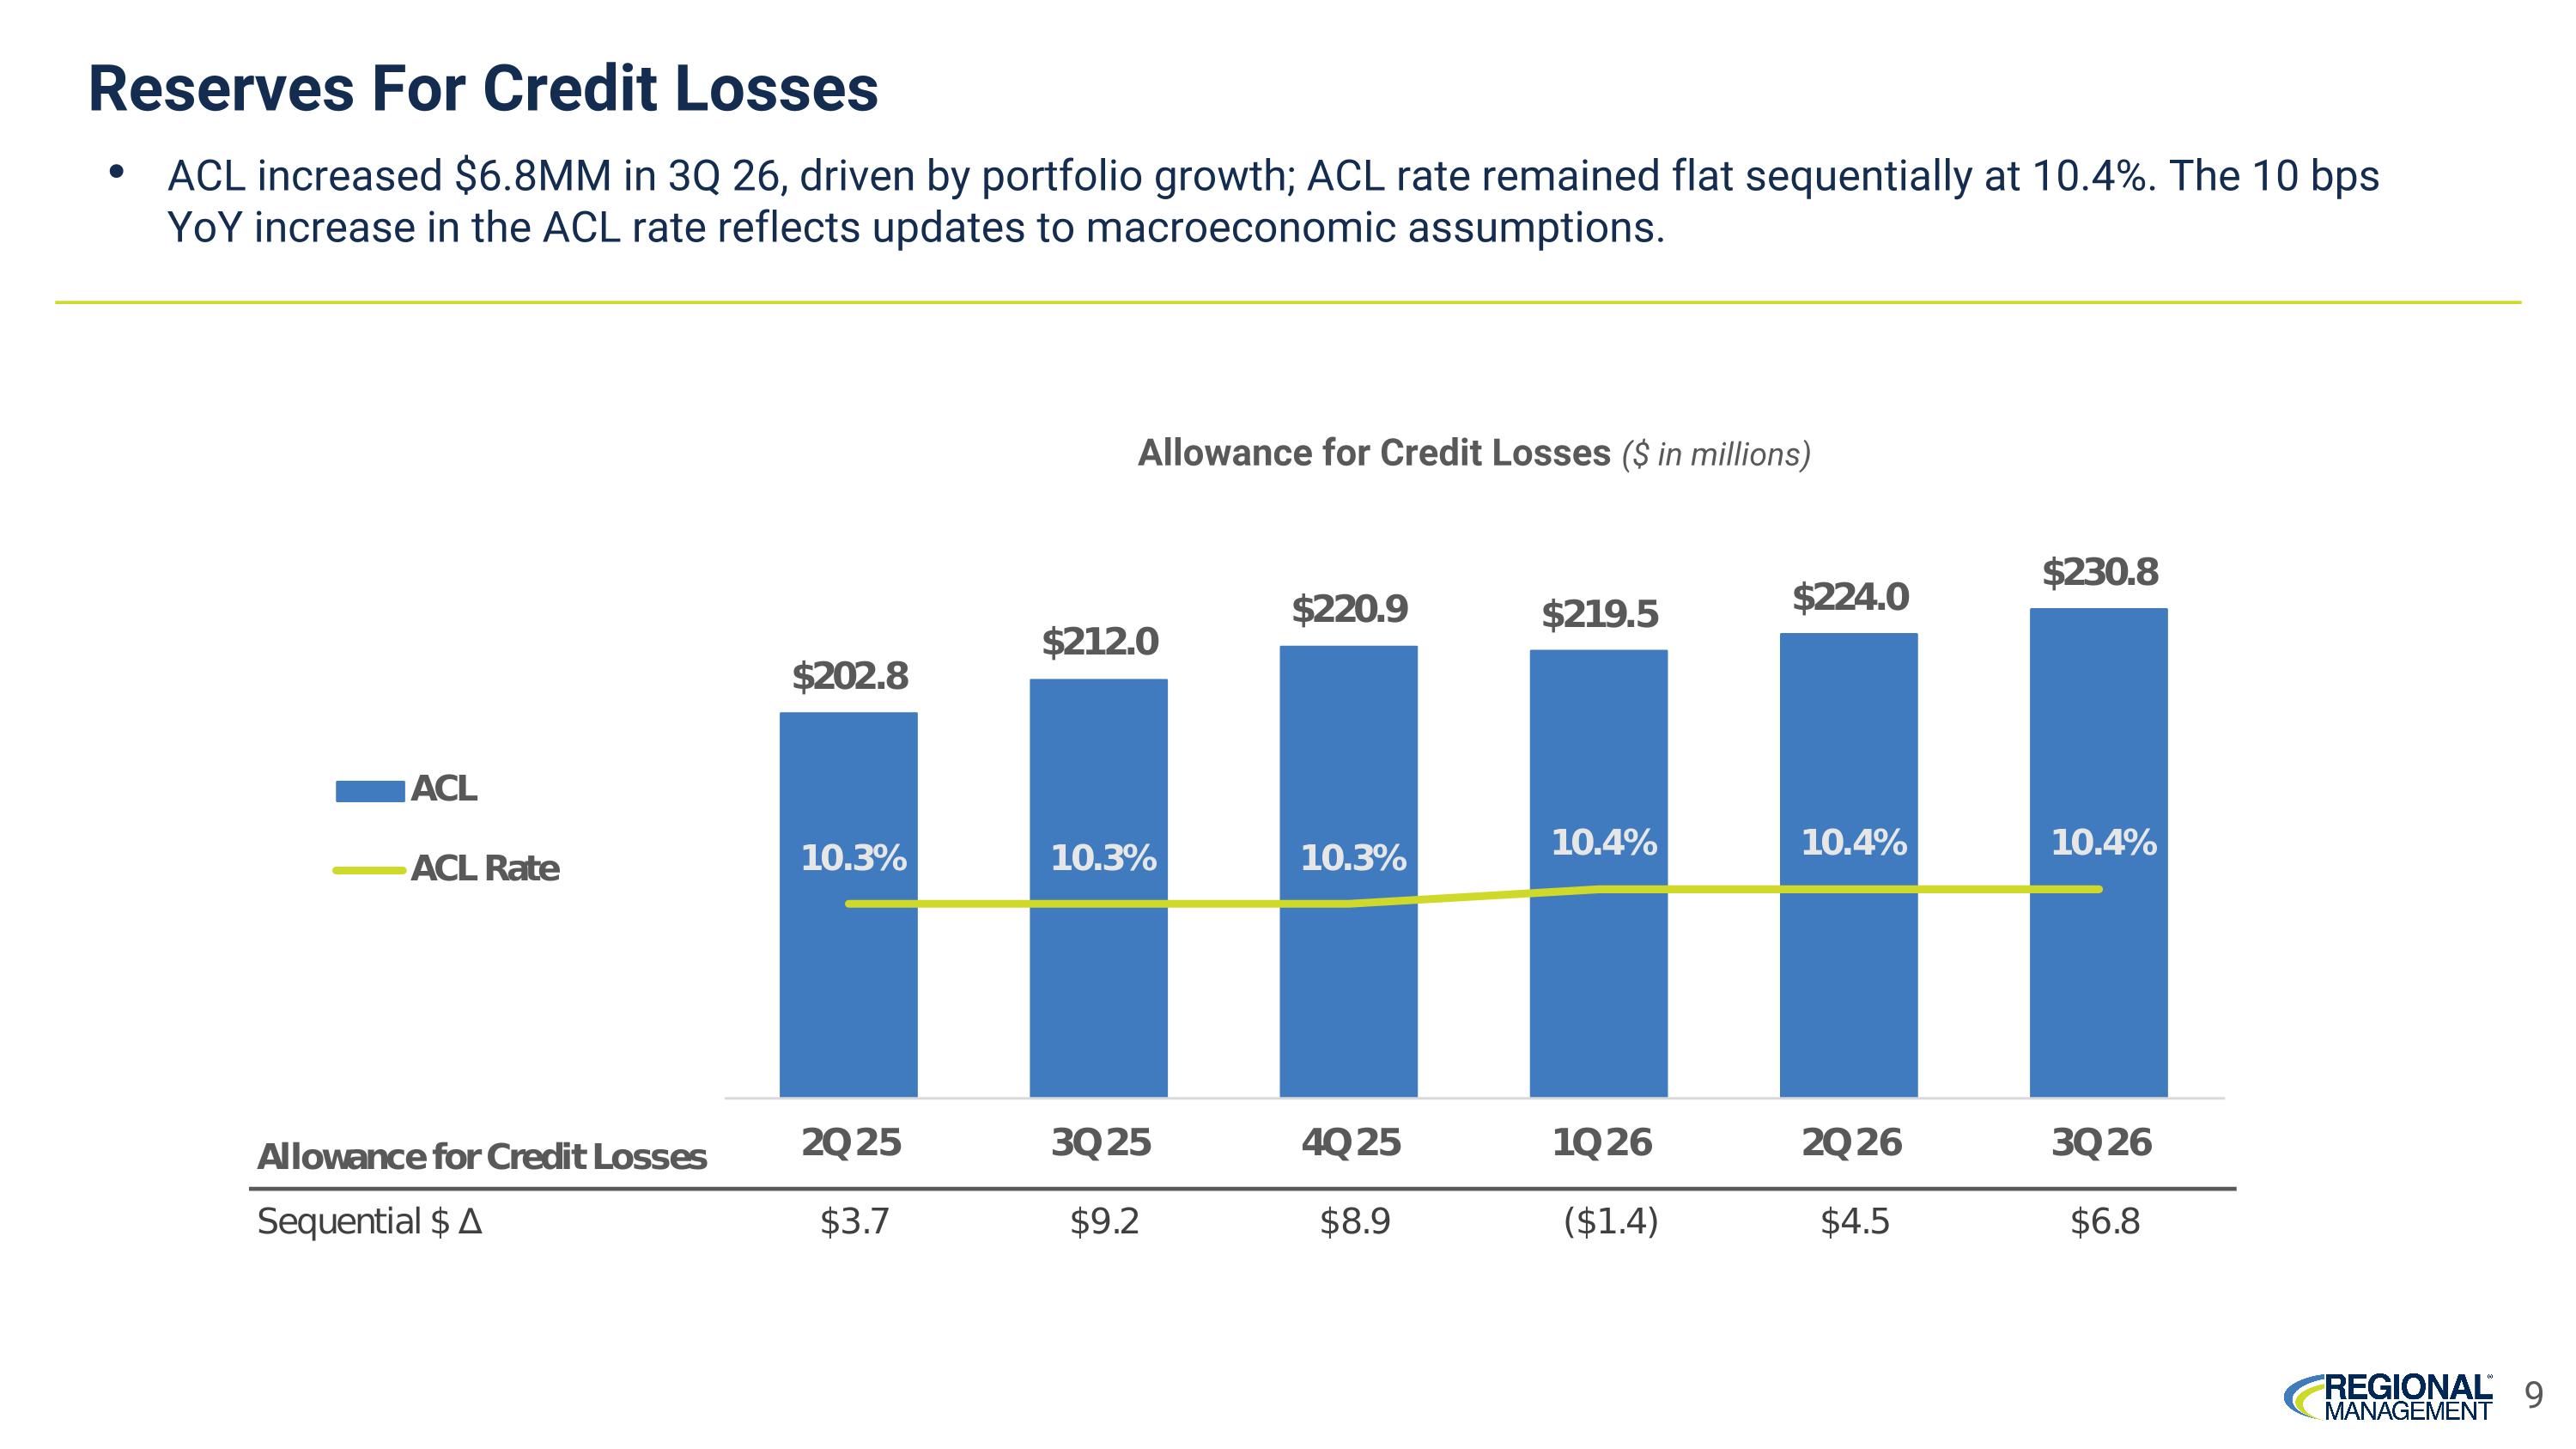
Reserves For Credit Losses ACL increased $6.8MM in 3Q 26, driven by portfolio growth; ACL rate remained flat sequentially at 10.4%. The 10 bps YoY increase in the ACL rate reflects updates to macroeconomic assumptions. Allowance for Credit Losses ($ in millions) 9
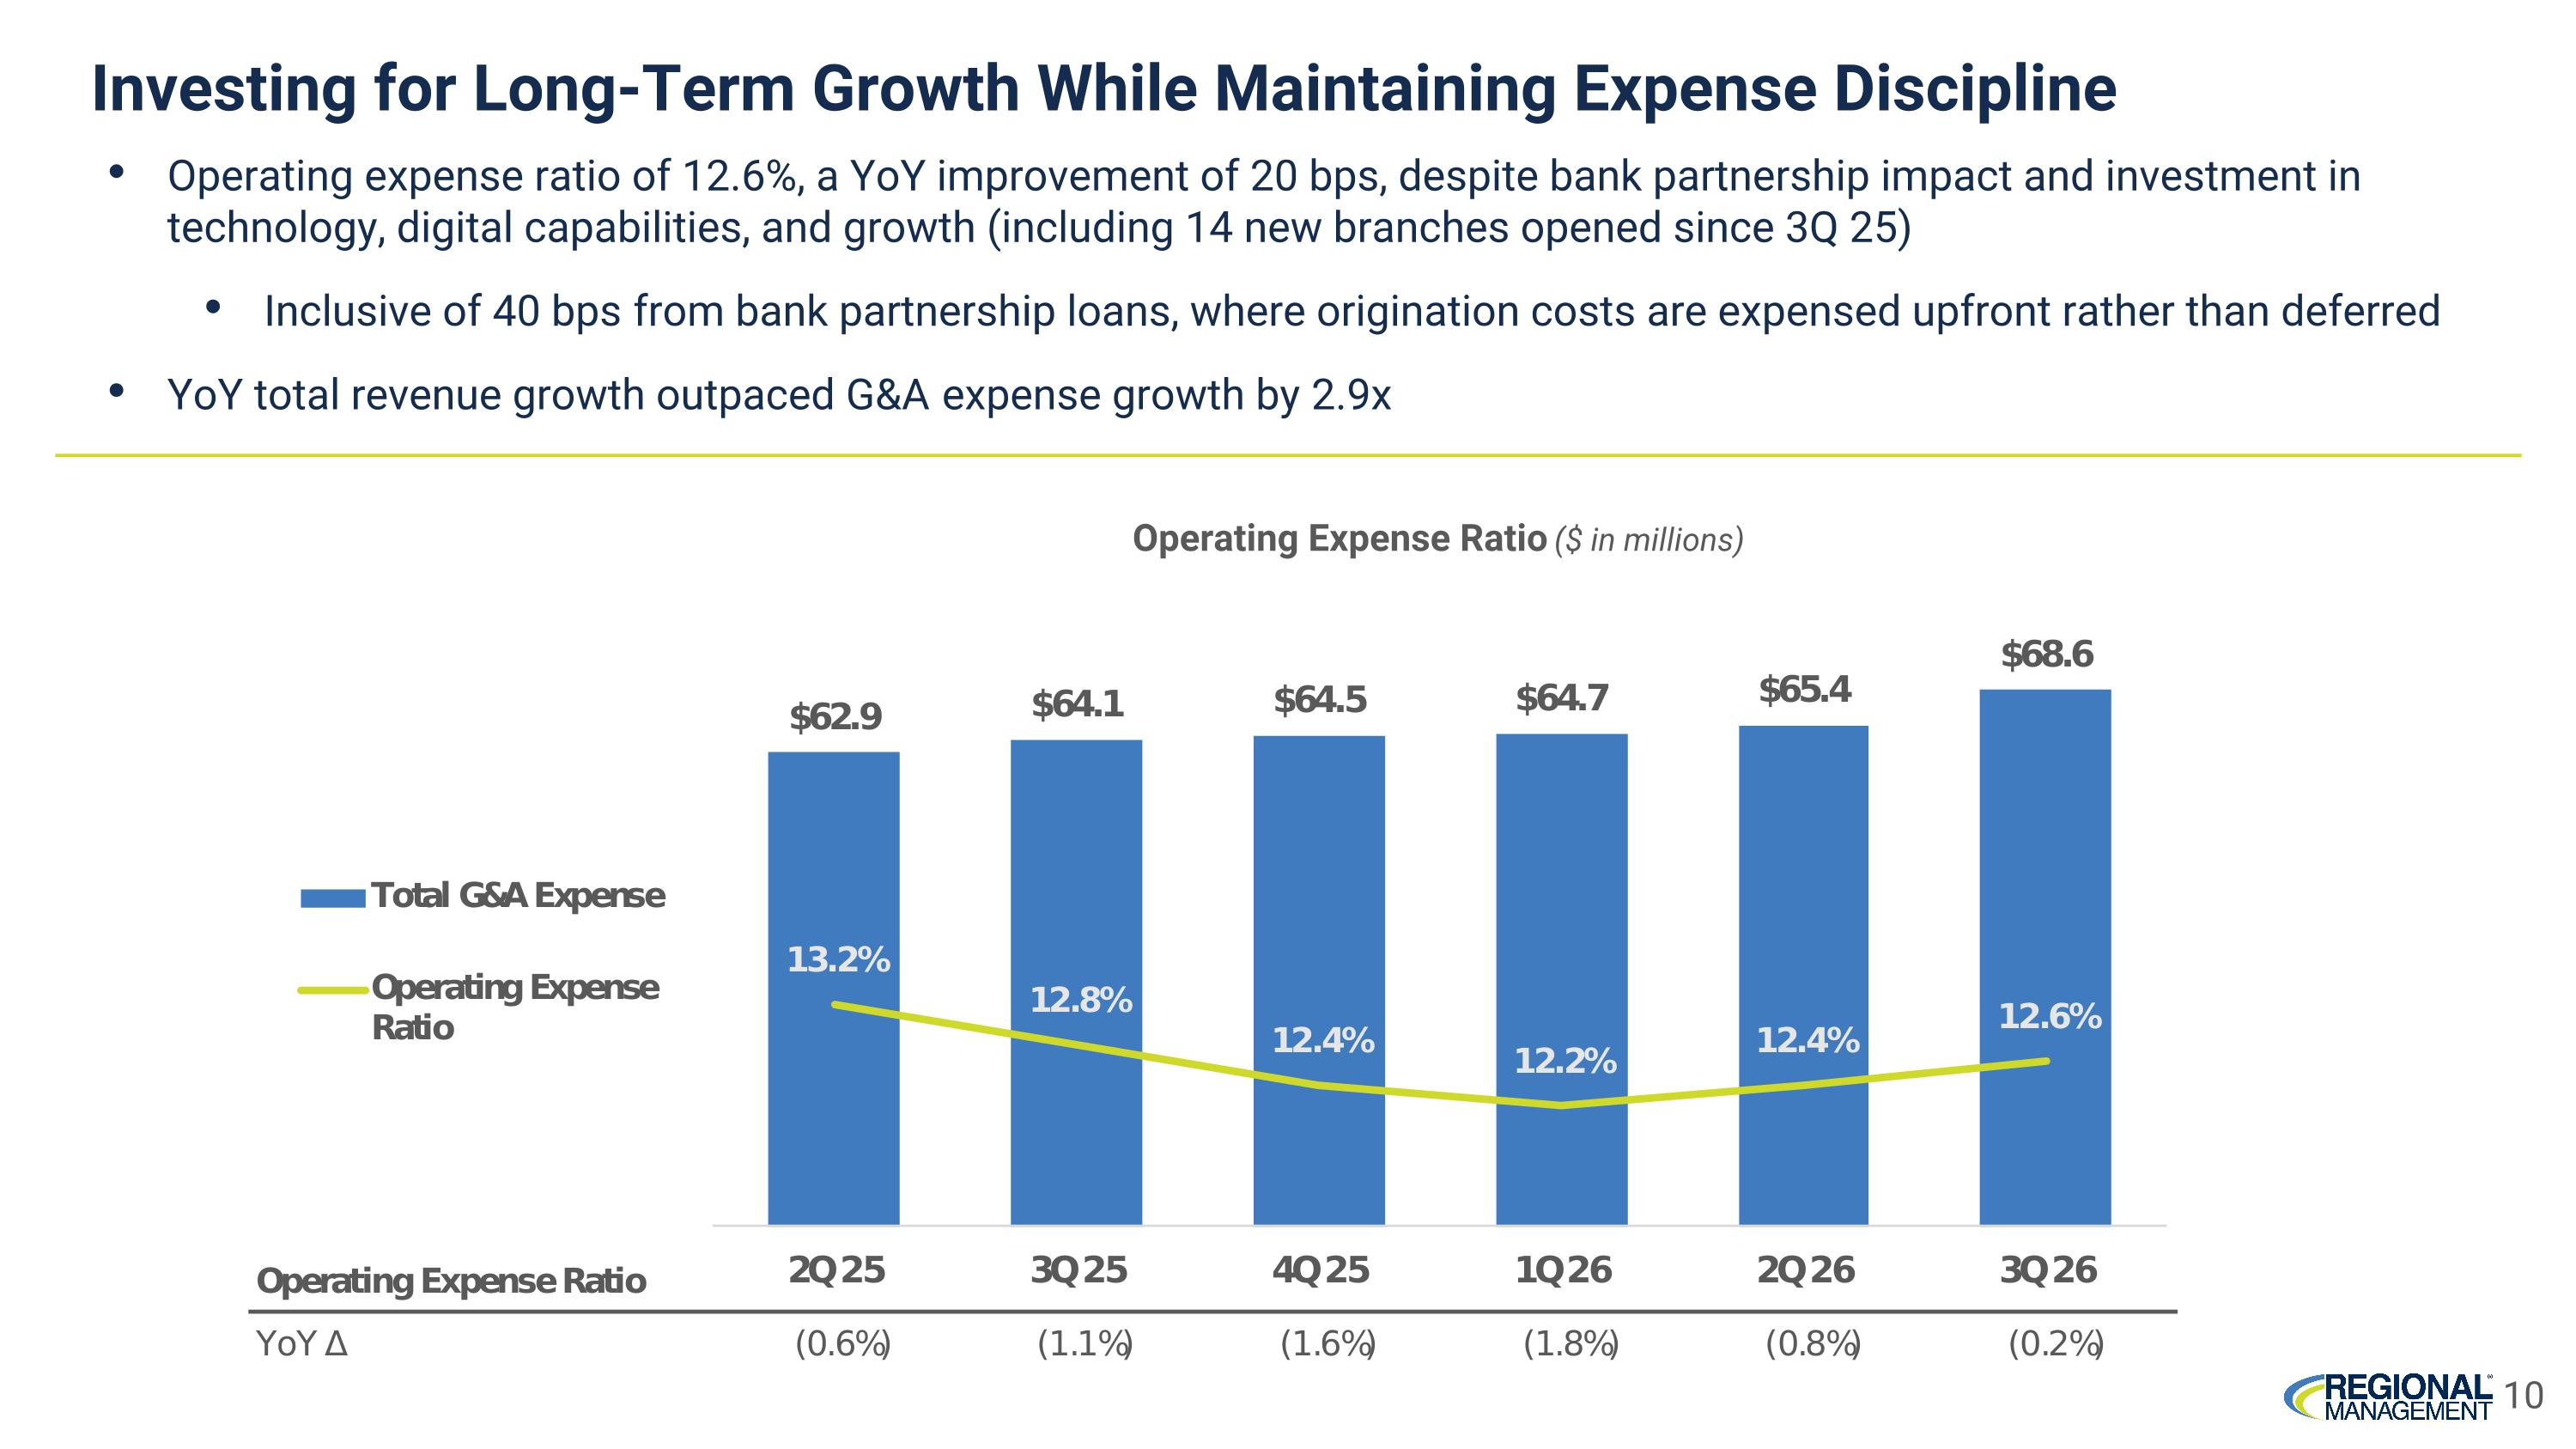
10 Operating Expense Ratio ($ in millions) Operating expense ratio of 12.6%, a YoY improvement of 20 bps, despite bank partnership impact and investment in technology, digital capabilities, and growth (including 14 new branches opened since 3Q 25) Inclusive of 40 bps from bank partnership loans, where origination costs are expensed upfront rather than deferred YoY total revenue growth outpaced G&A expense growth by 2.9x Investing for Long-Term Growth While Maintaining Expense Discipline
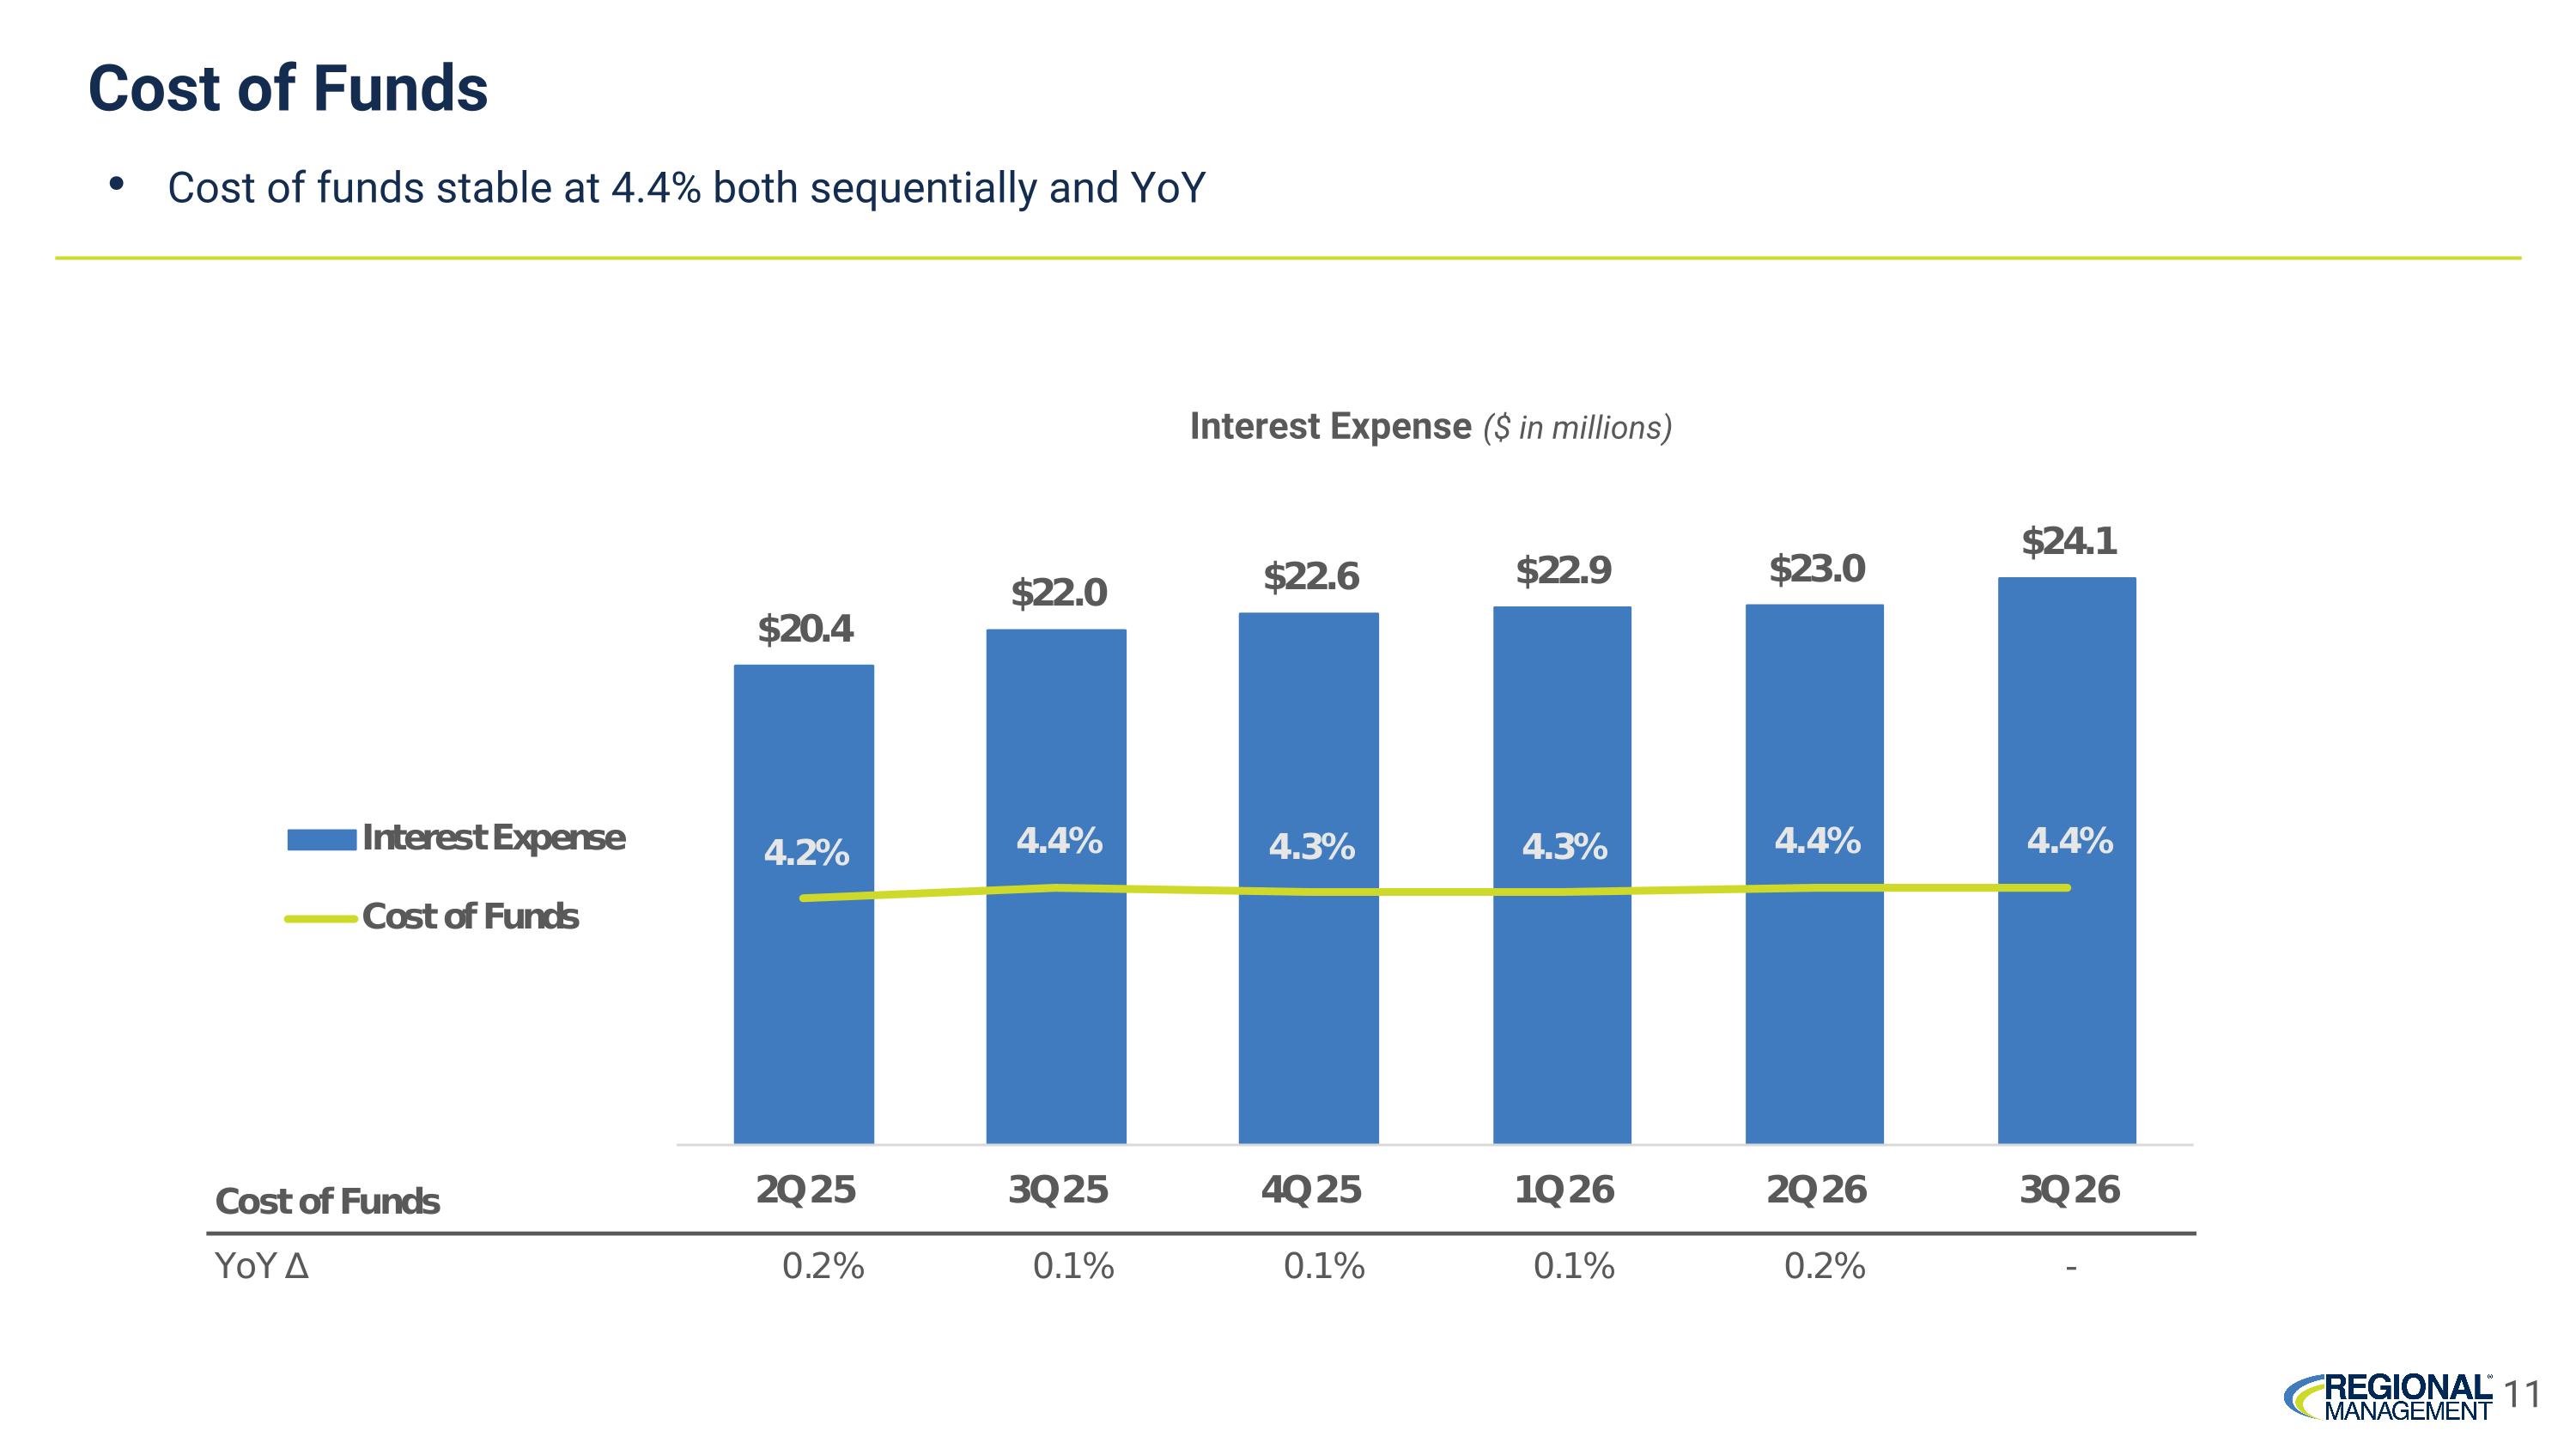
Cost of Funds 11 Interest Expense ($ in millions) Cost of funds stable at 4.4% both sequentially and YoY
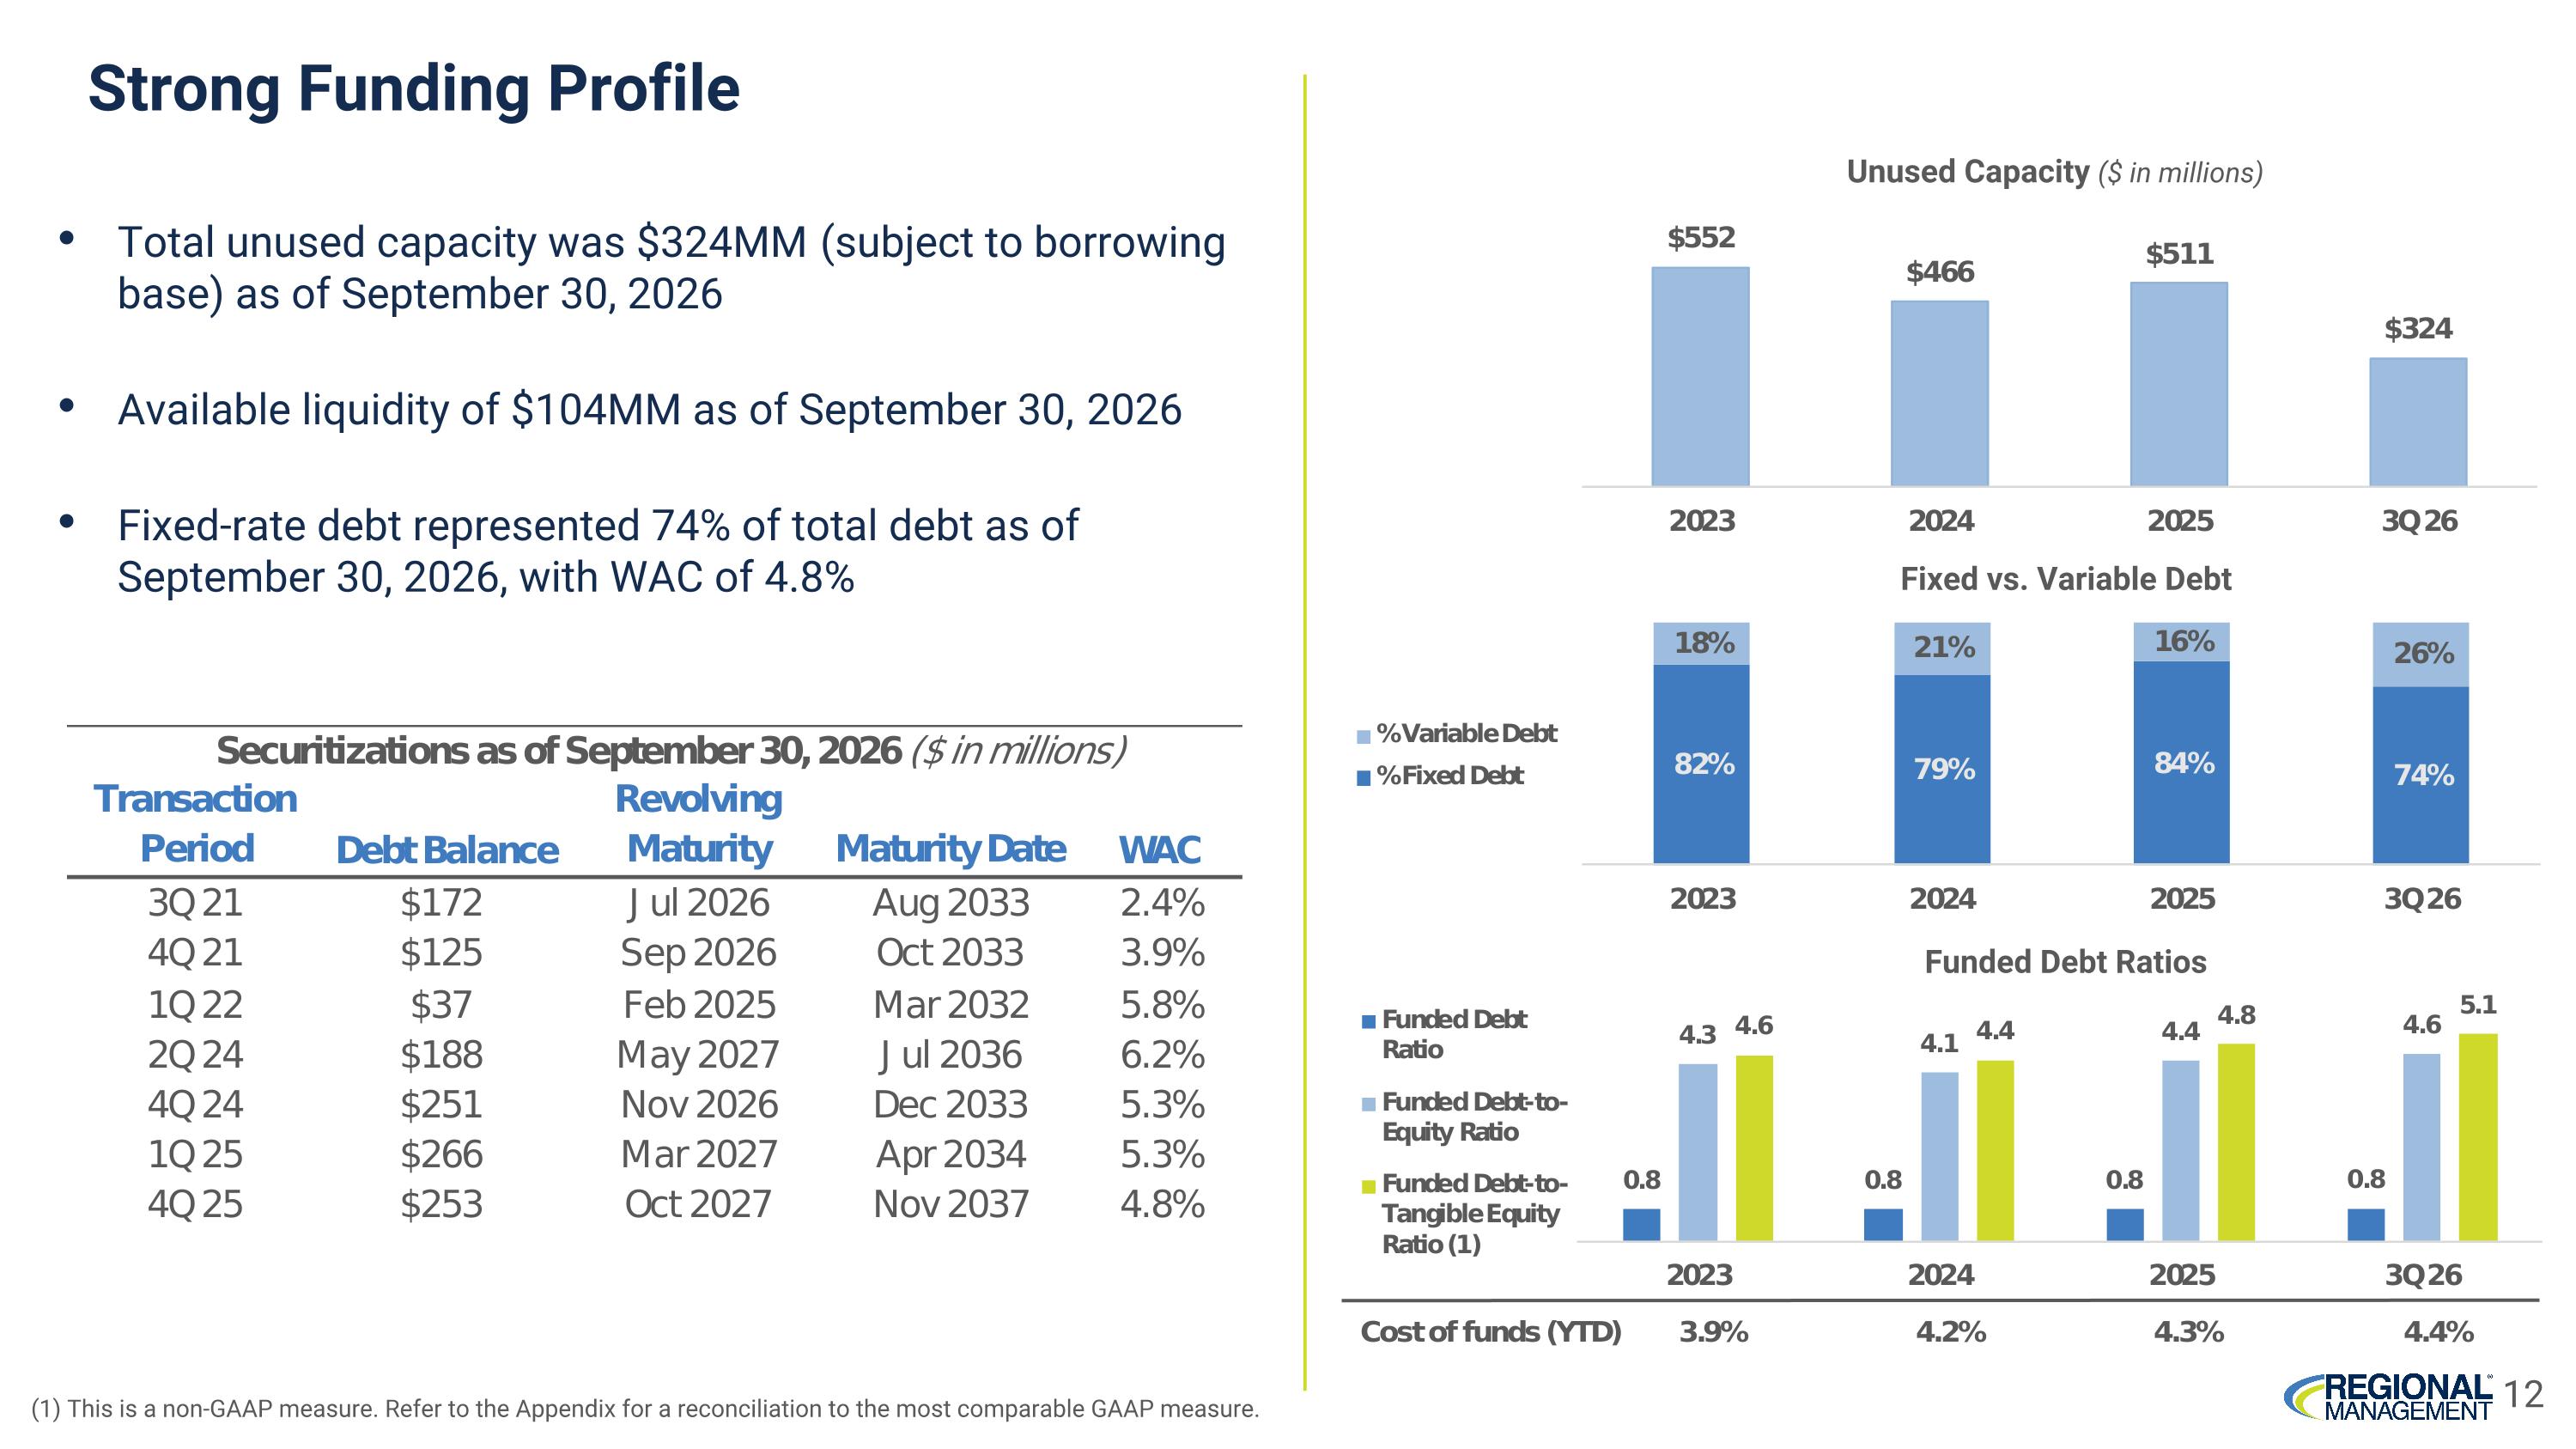
Total unused capacity was $324MM (subject to borrowing base) as of September 30, 2026 Available liquidity of $104MM as of September 30, 2026 Fixed-rate debt represented 74% of total debt as of September 30, 2026, with WAC of 4.8% Strong Funding Profile Unused Capacity ($ in millions) Fixed vs. Variable Debt Funded Debt Ratios 12 (1) This is a non-GAAP measure. Refer to the Appendix for a reconciliation to the most comparable GAAP measure.
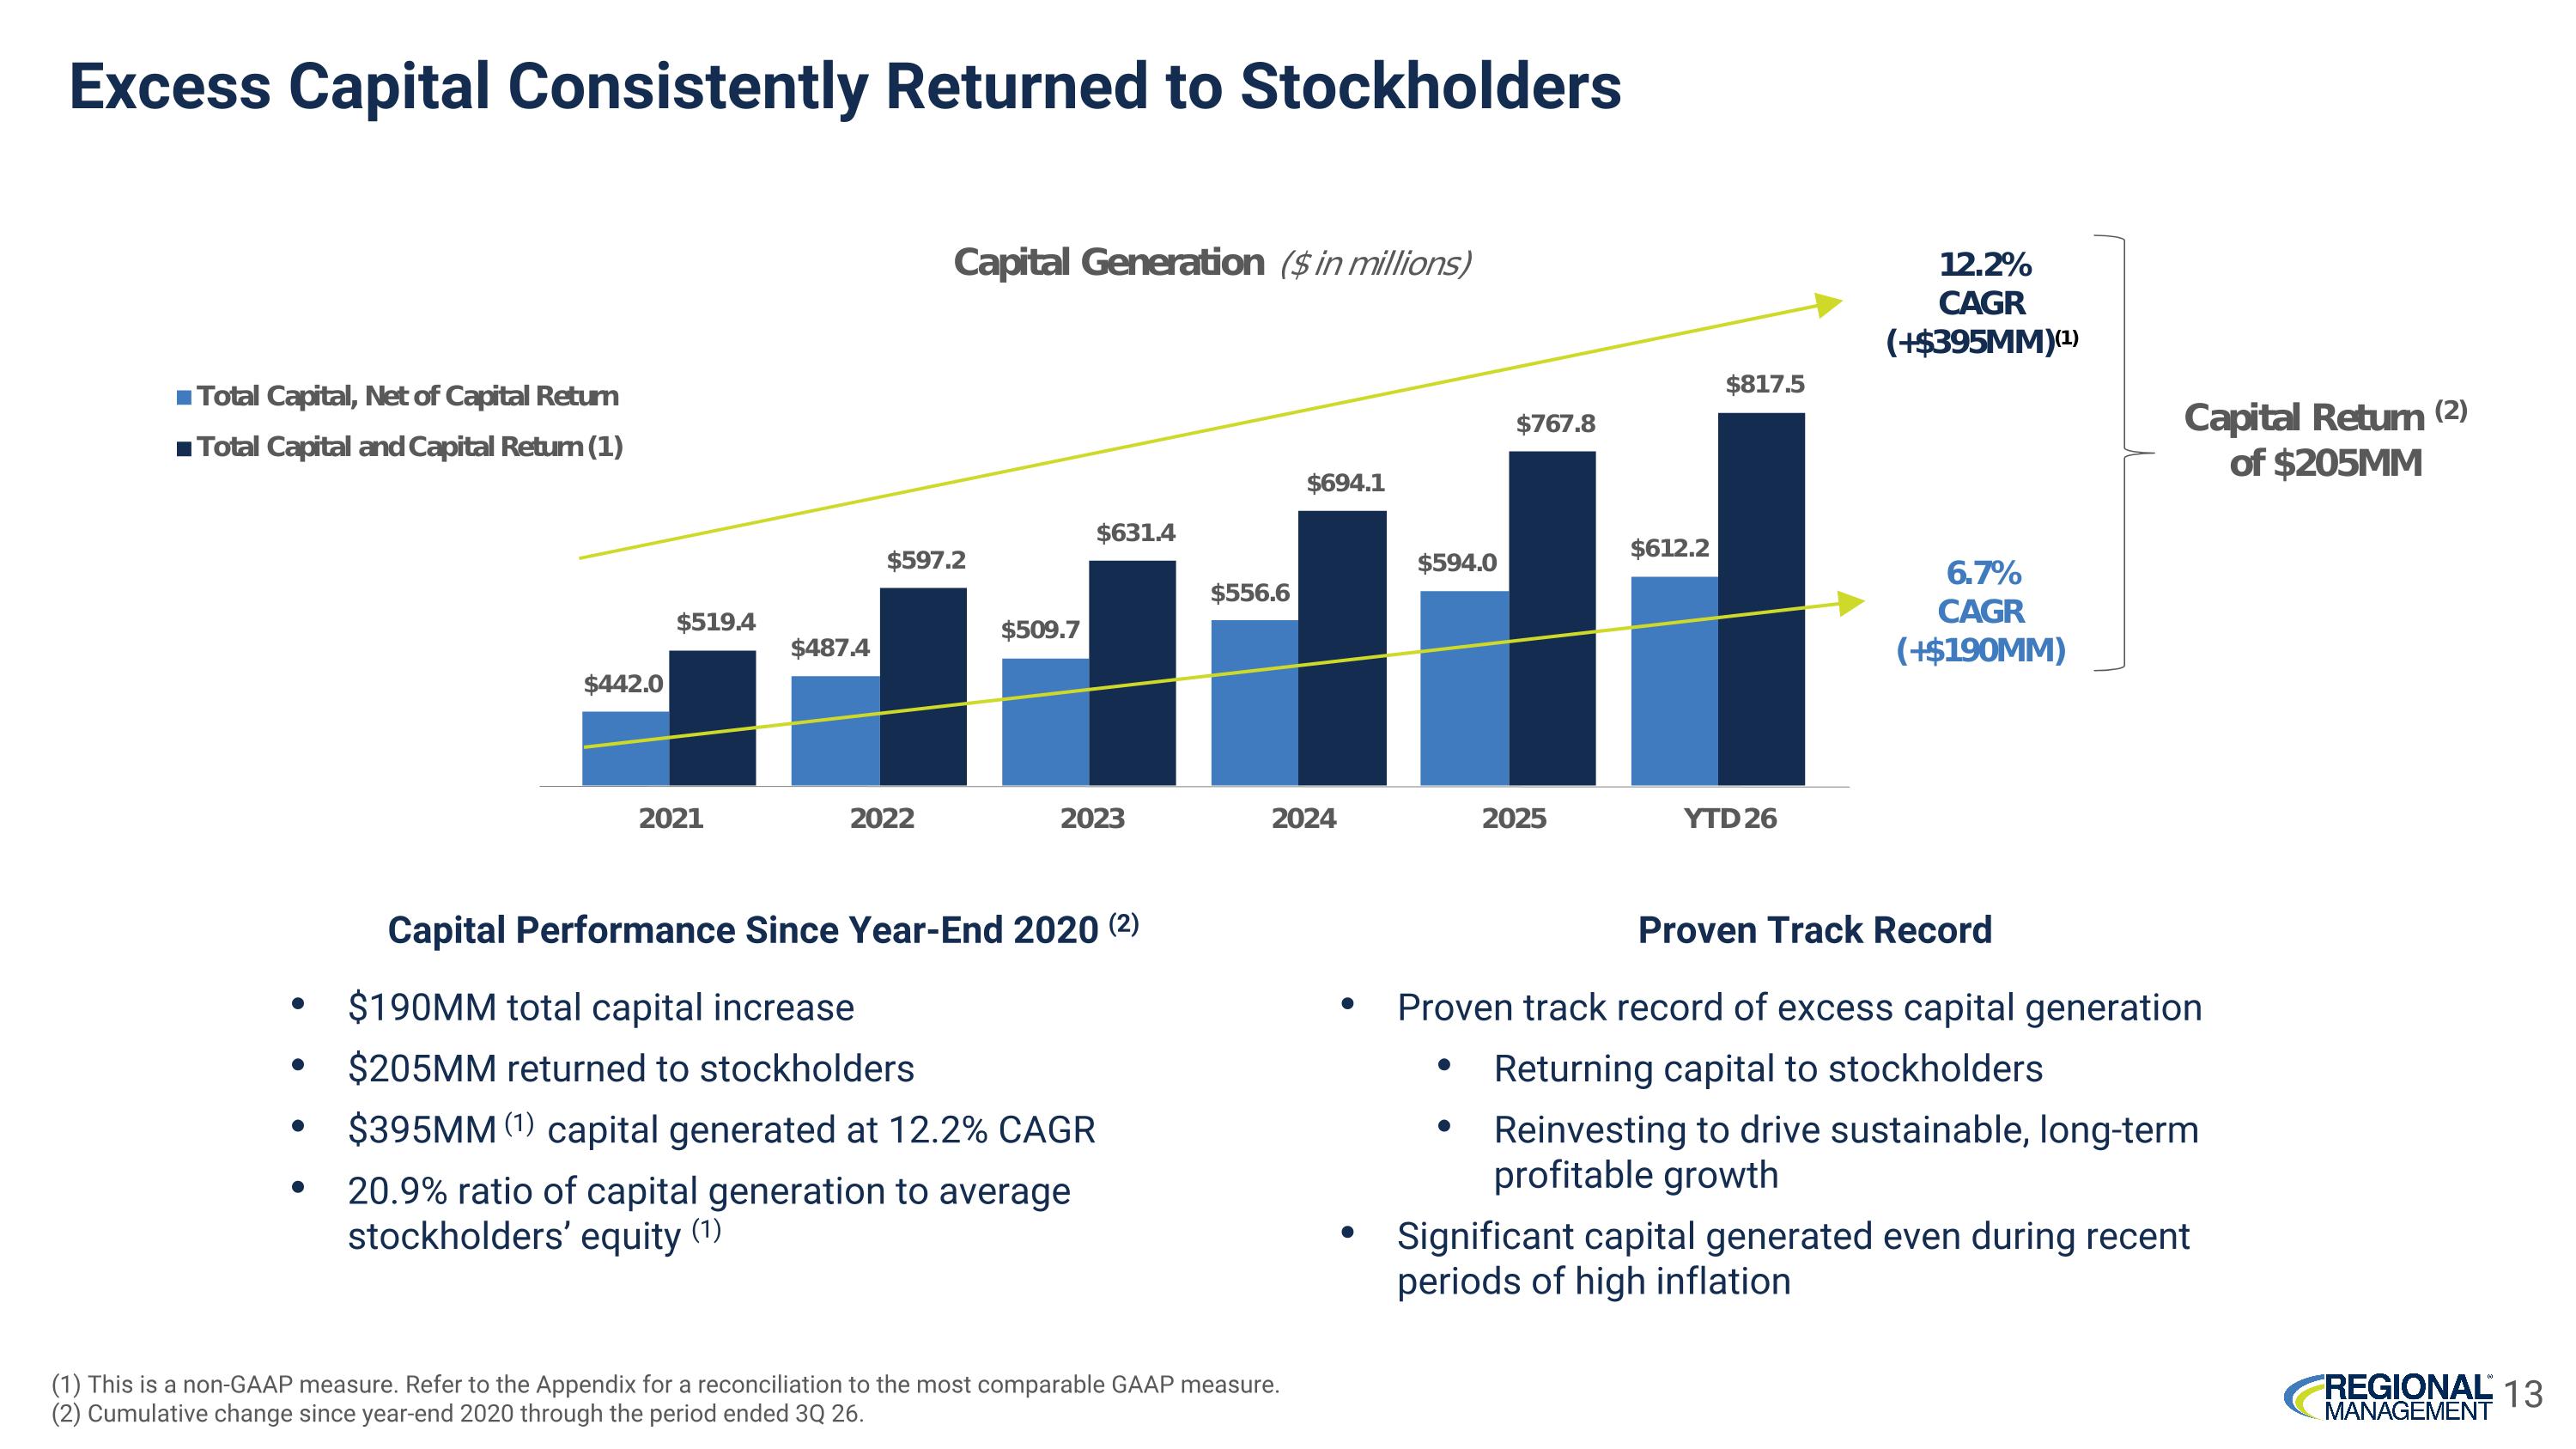
Excess Capital Consistently Returned to Stockholders 13 (1) This is a non-GAAP measure. Refer to the Appendix for a reconciliation to the most comparable GAAP measure. (2) Cumulative change since year-end 2020 through the period ended 3Q 26. Capital Performance Since Year-End 2020 (2) $190MM total capital increase $205MM returned to stockholders $395MM (1) capital generated at 12.2% CAGR 20.9% ratio of capital generation to average stockholders’ equity (1) Proven Track Record Proven track record of excess capital generation Returning capital to stockholders Reinvesting to drive sustainable, long-term profitable growth Significant capital generated even during recent periods of high inflation
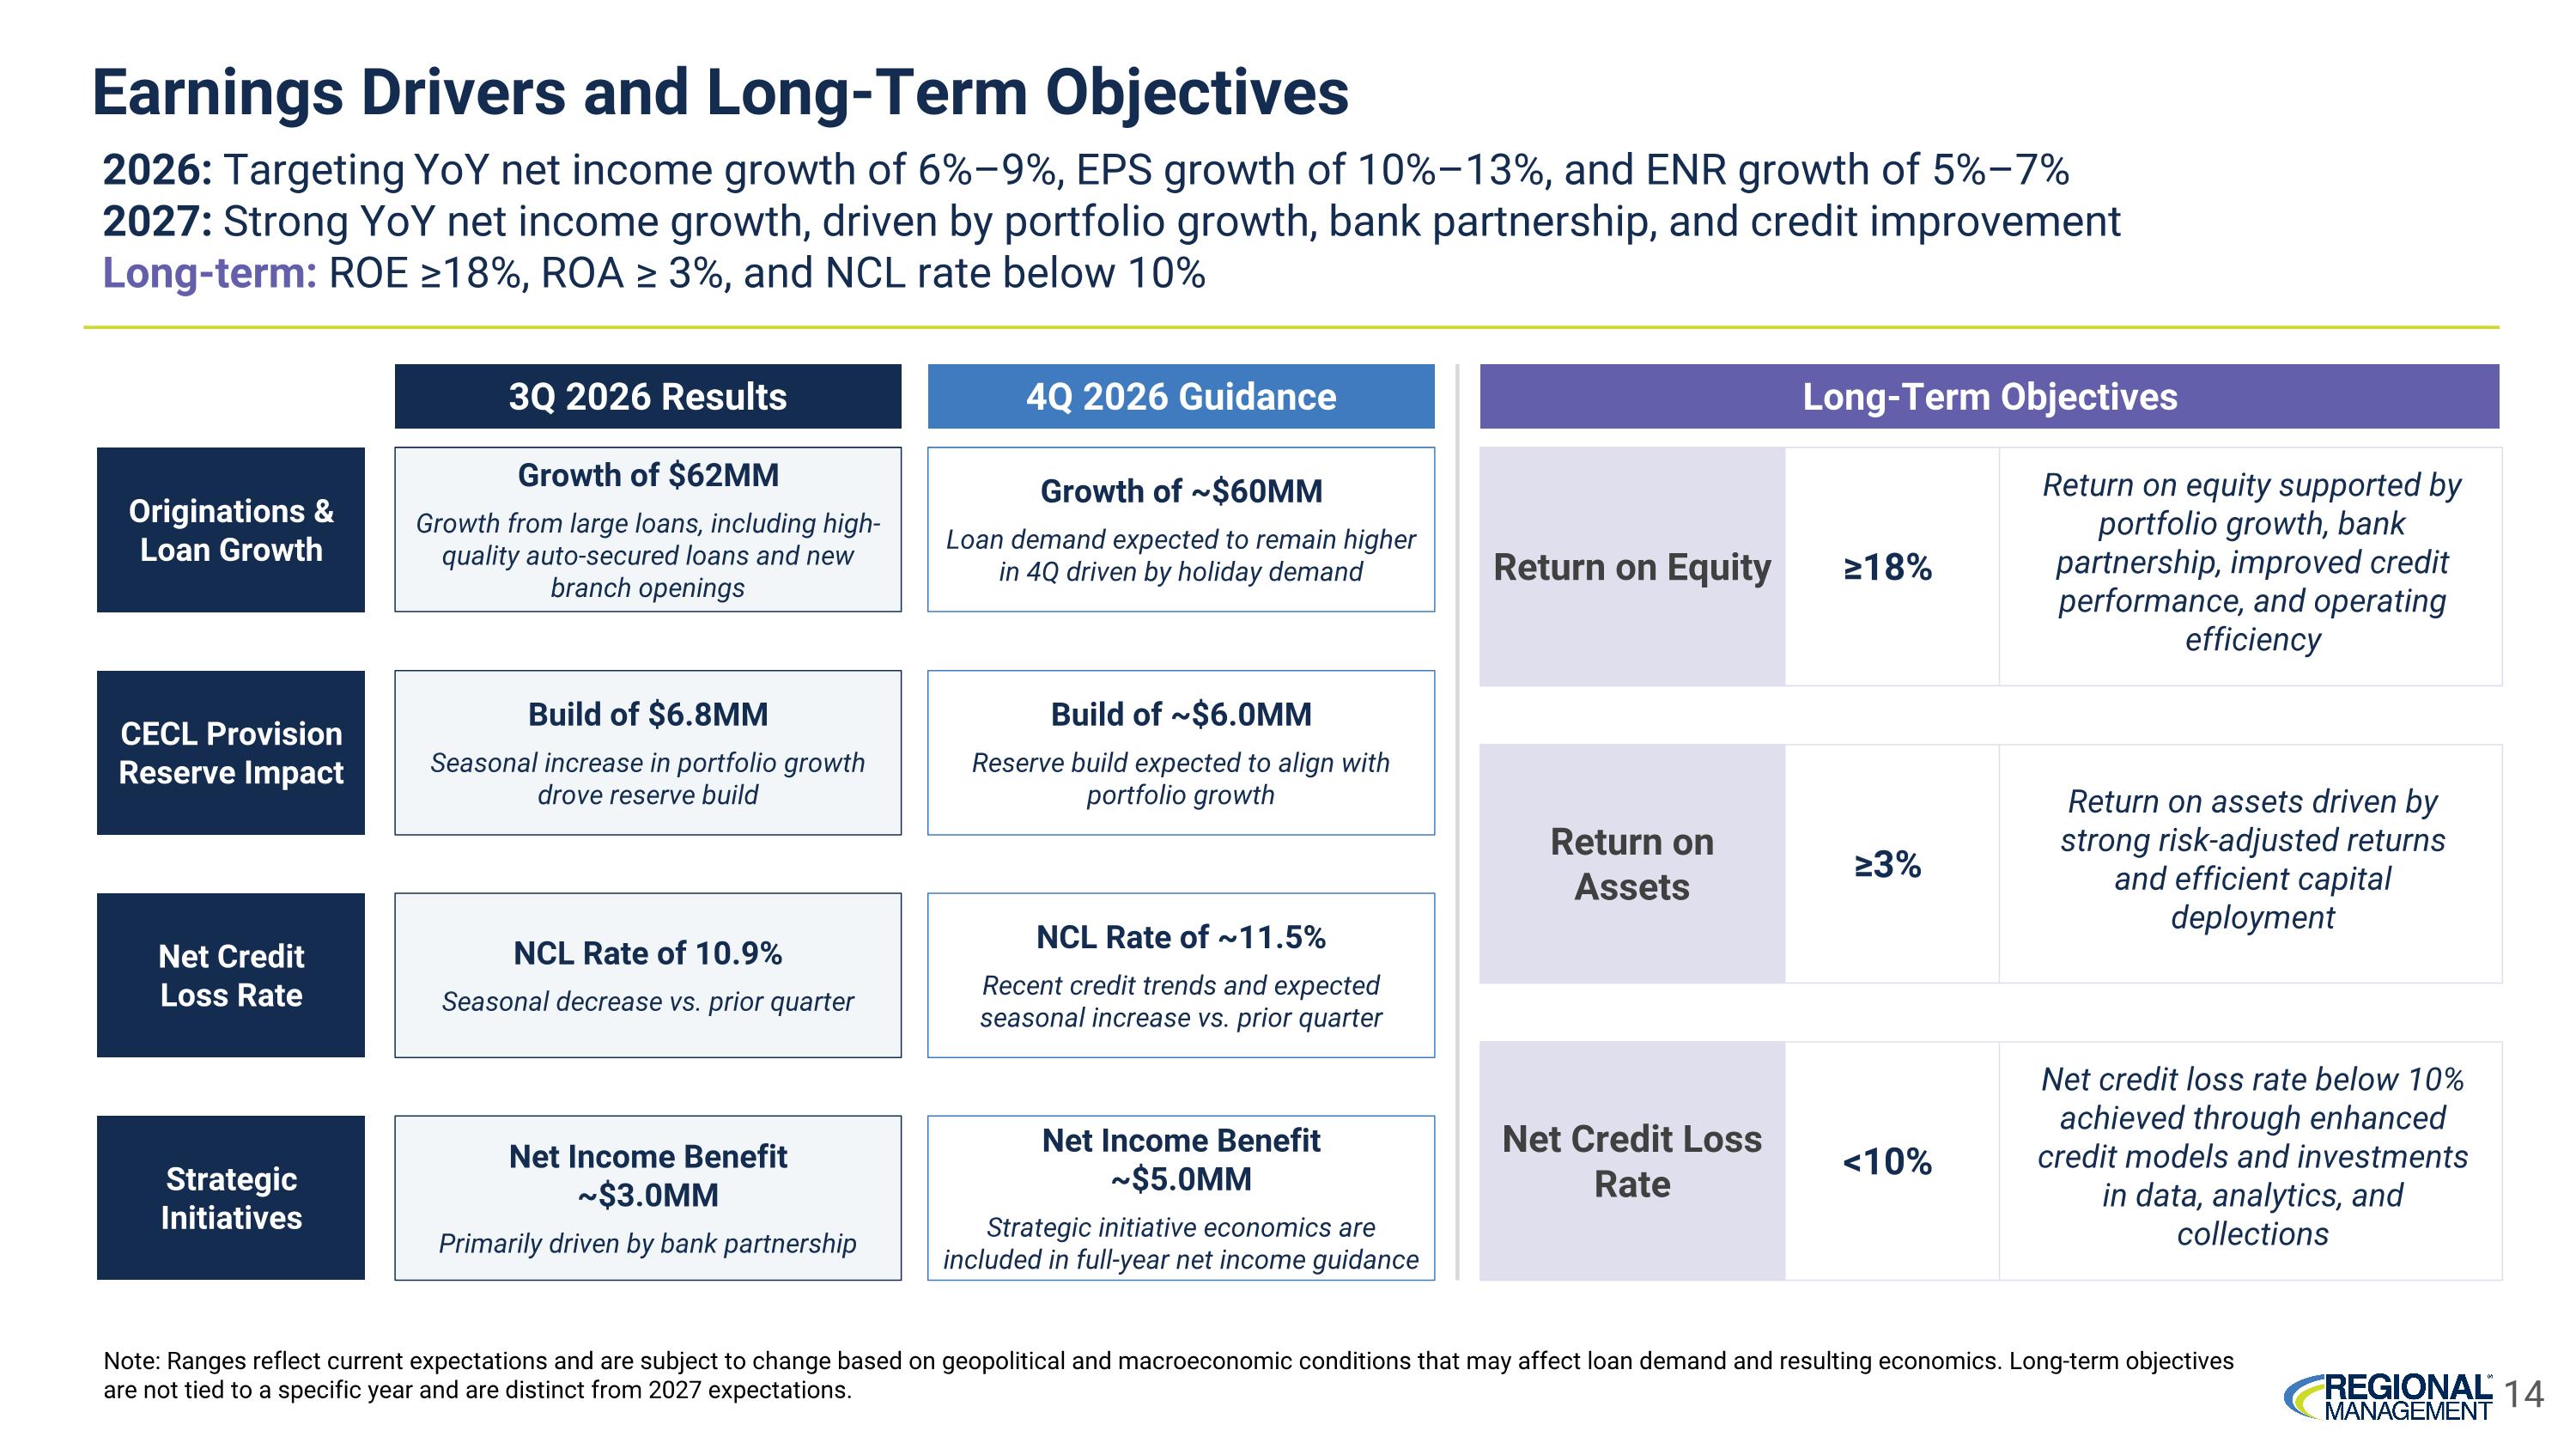
Earnings Drivers and Long-Term Objectives 2026: Targeting YoY net income growth of 6%–9%, EPS growth of 10%–13%, and ENR growth of 5%–7% 2027: Strong YoY net income growth, driven by portfolio growth, bank partnership, and credit improvement Long-term: ROE ≥18%, ROA ≥ 3%, and NCL rate below 10% 3Q 2026 Results Originations & Loan Growth CECL Provision Reserve Impact Net Credit Loss Rate Strategic Initiatives Net Income Benefit ~$3.0MM Primarily driven by bank partnership Note: Ranges reflect current expectations and are subject to change based on geopolitical and macroeconomic conditions that may affect loan demand and resulting economics. Long-term objectives are not tied to a specific year and are distinct from 2027 expectations. NCL Rate of 10.9% Seasonal decrease vs. prior quarter Build of $6.8MM Seasonal increase in portfolio growth drove reserve build Growth of $62MM Growth from large loans, including high-quality auto-secured loans and new branch openings NCL Rate of ~11.5% Recent credit trends and expected seasonal increase vs. prior quarter Build of ~$6.0MM Reserve build expected to align with portfolio growth Growth of ~$60MM Loan demand expected to remain higher in 4Q driven by holiday demand 4Q 2026 Guidance Net Income Benefit ~$5.0MM Strategic initiative economics are included in full-year net income guidance Long-Term Objectives Return on Equity ≥18% Return on equity supported by portfolio growth, bank partnership, improved credit performance, and operating efficiency Return on Assets ≥3% Return on assets driven by strong risk-adjusted returns and efficient capital deployment Net Credit Loss Rate <10% Net credit loss rate below 10% achieved through enhanced credit models and investments in data, analytics, and collections 14
Appendix 15
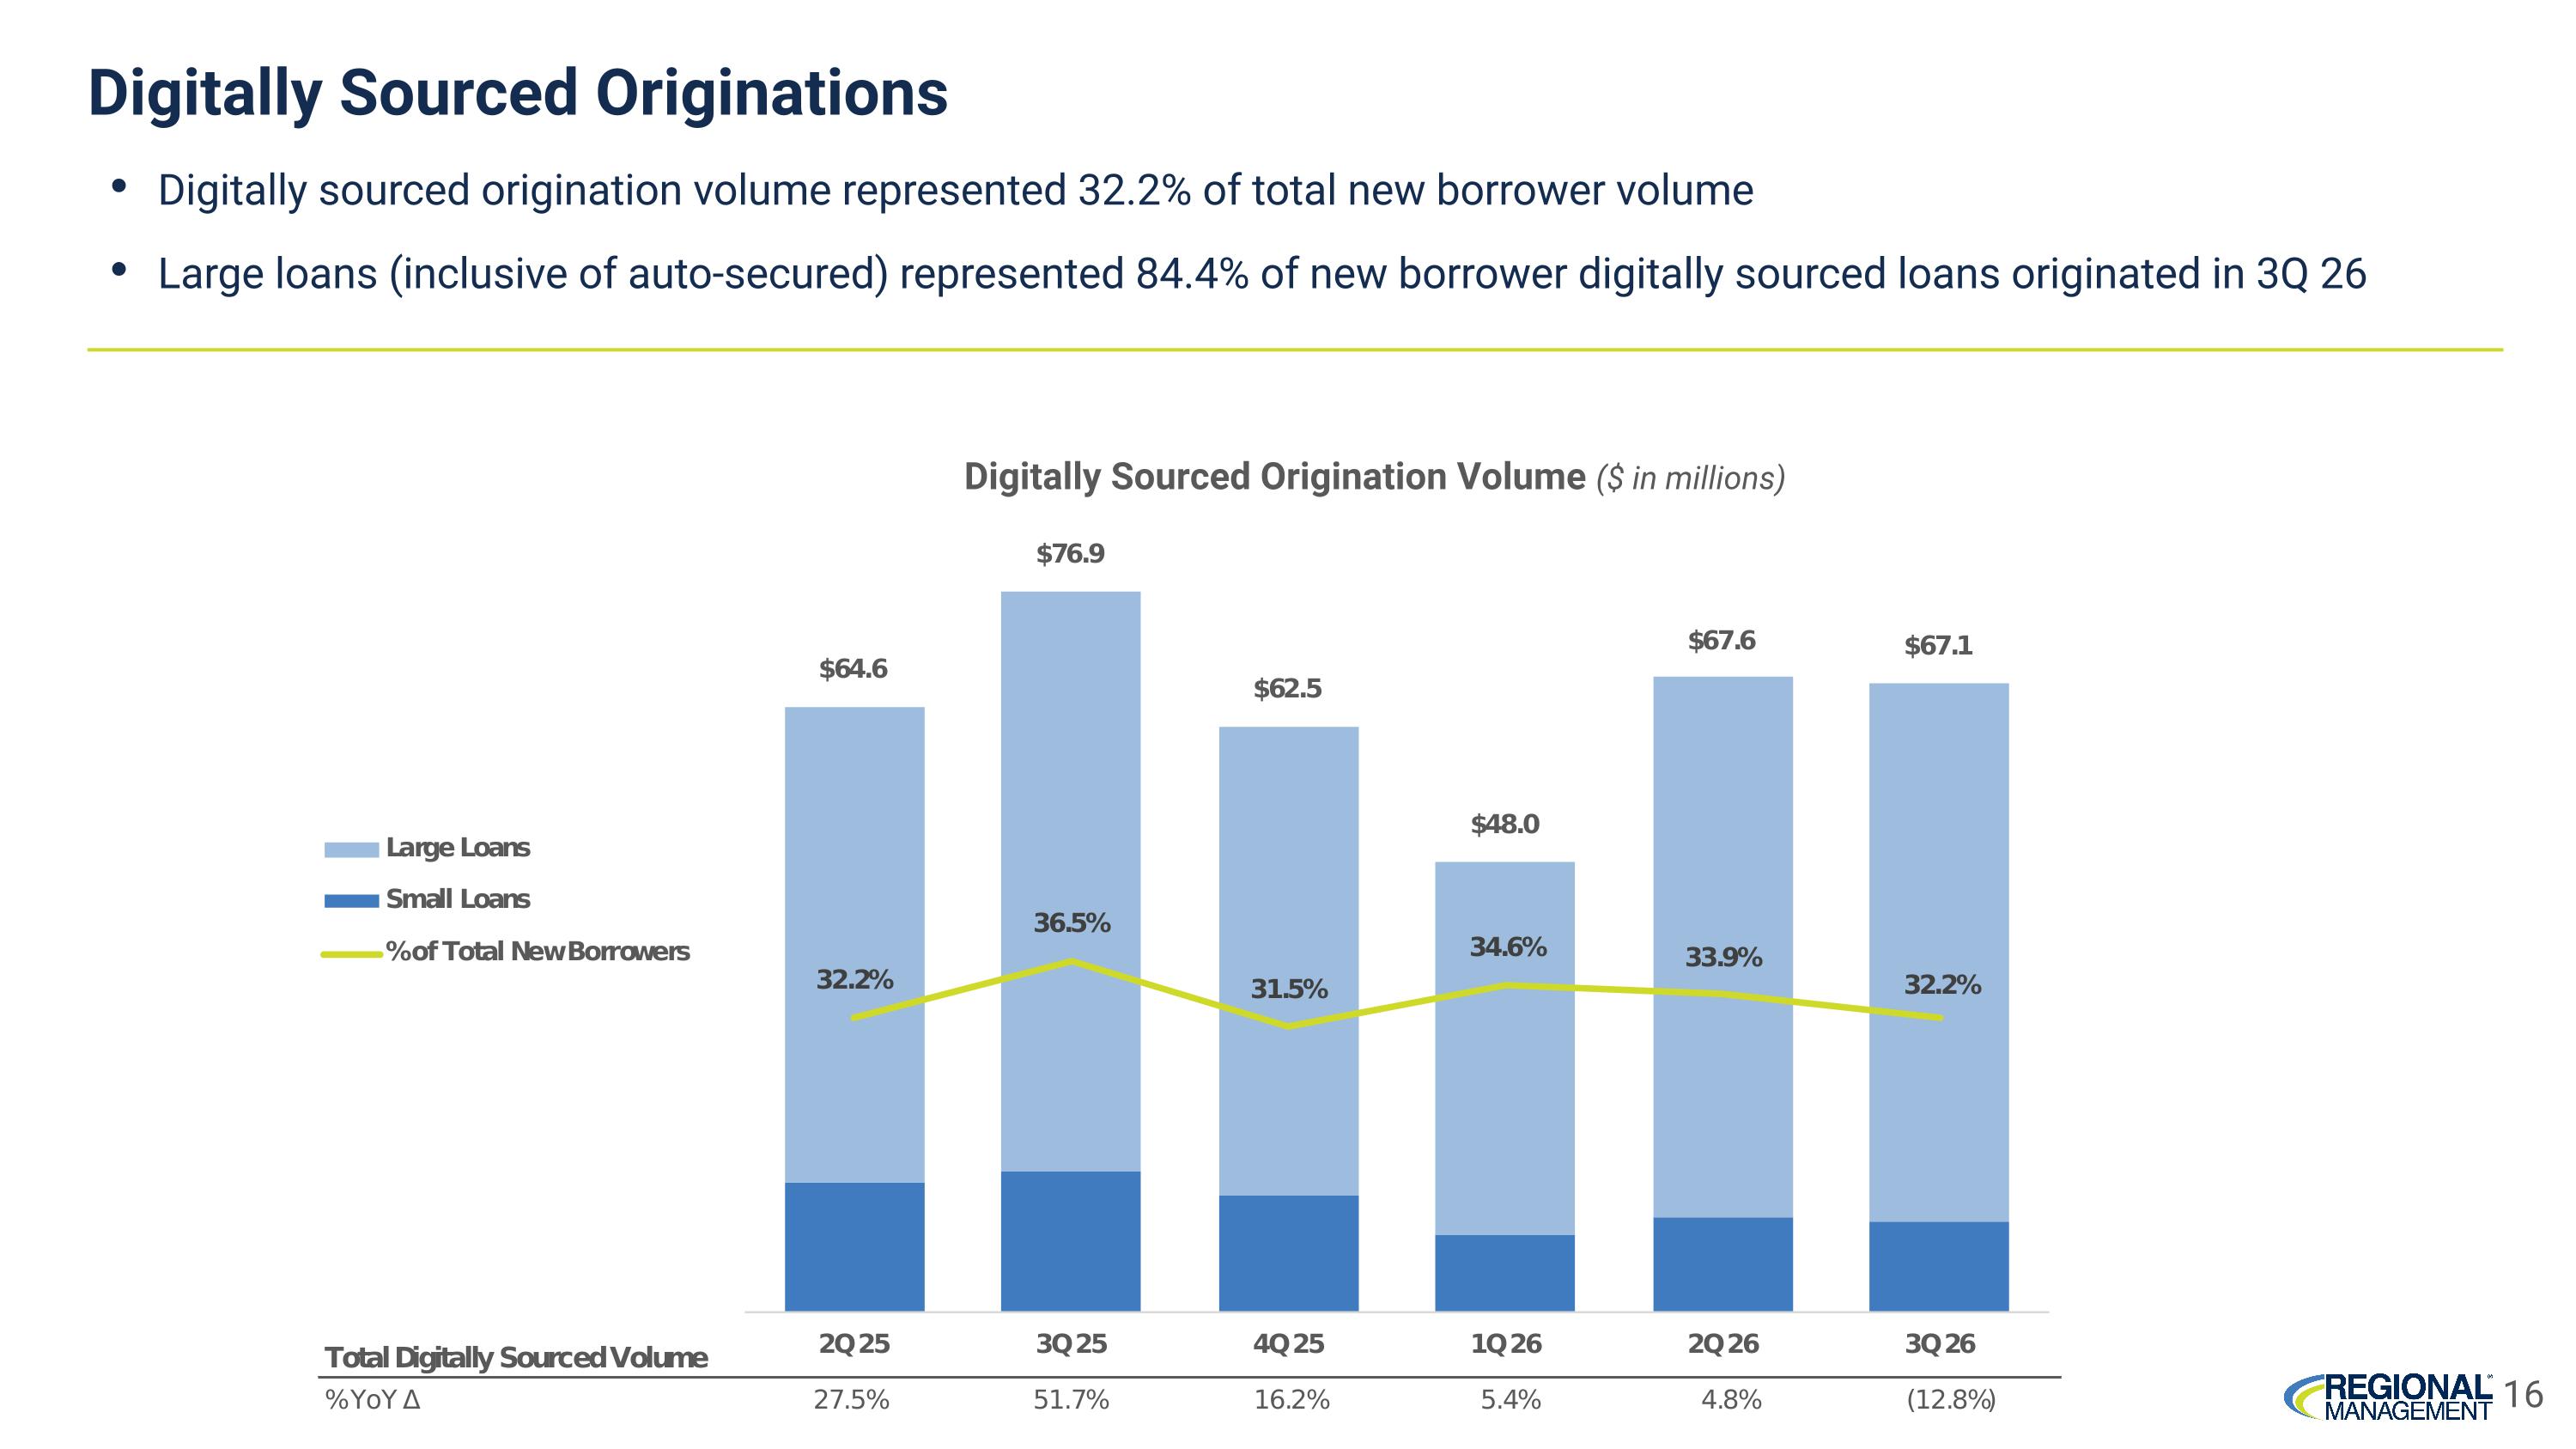
Digitally sourced origination volume represented 32.2% of total new borrower volume Large loans (inclusive of auto-secured) represented 84.4% of new borrower digitally sourced loans originated in 3Q 26 Digitally Sourced Origination Volume ($ in millions) Digitally Sourced Originations 16
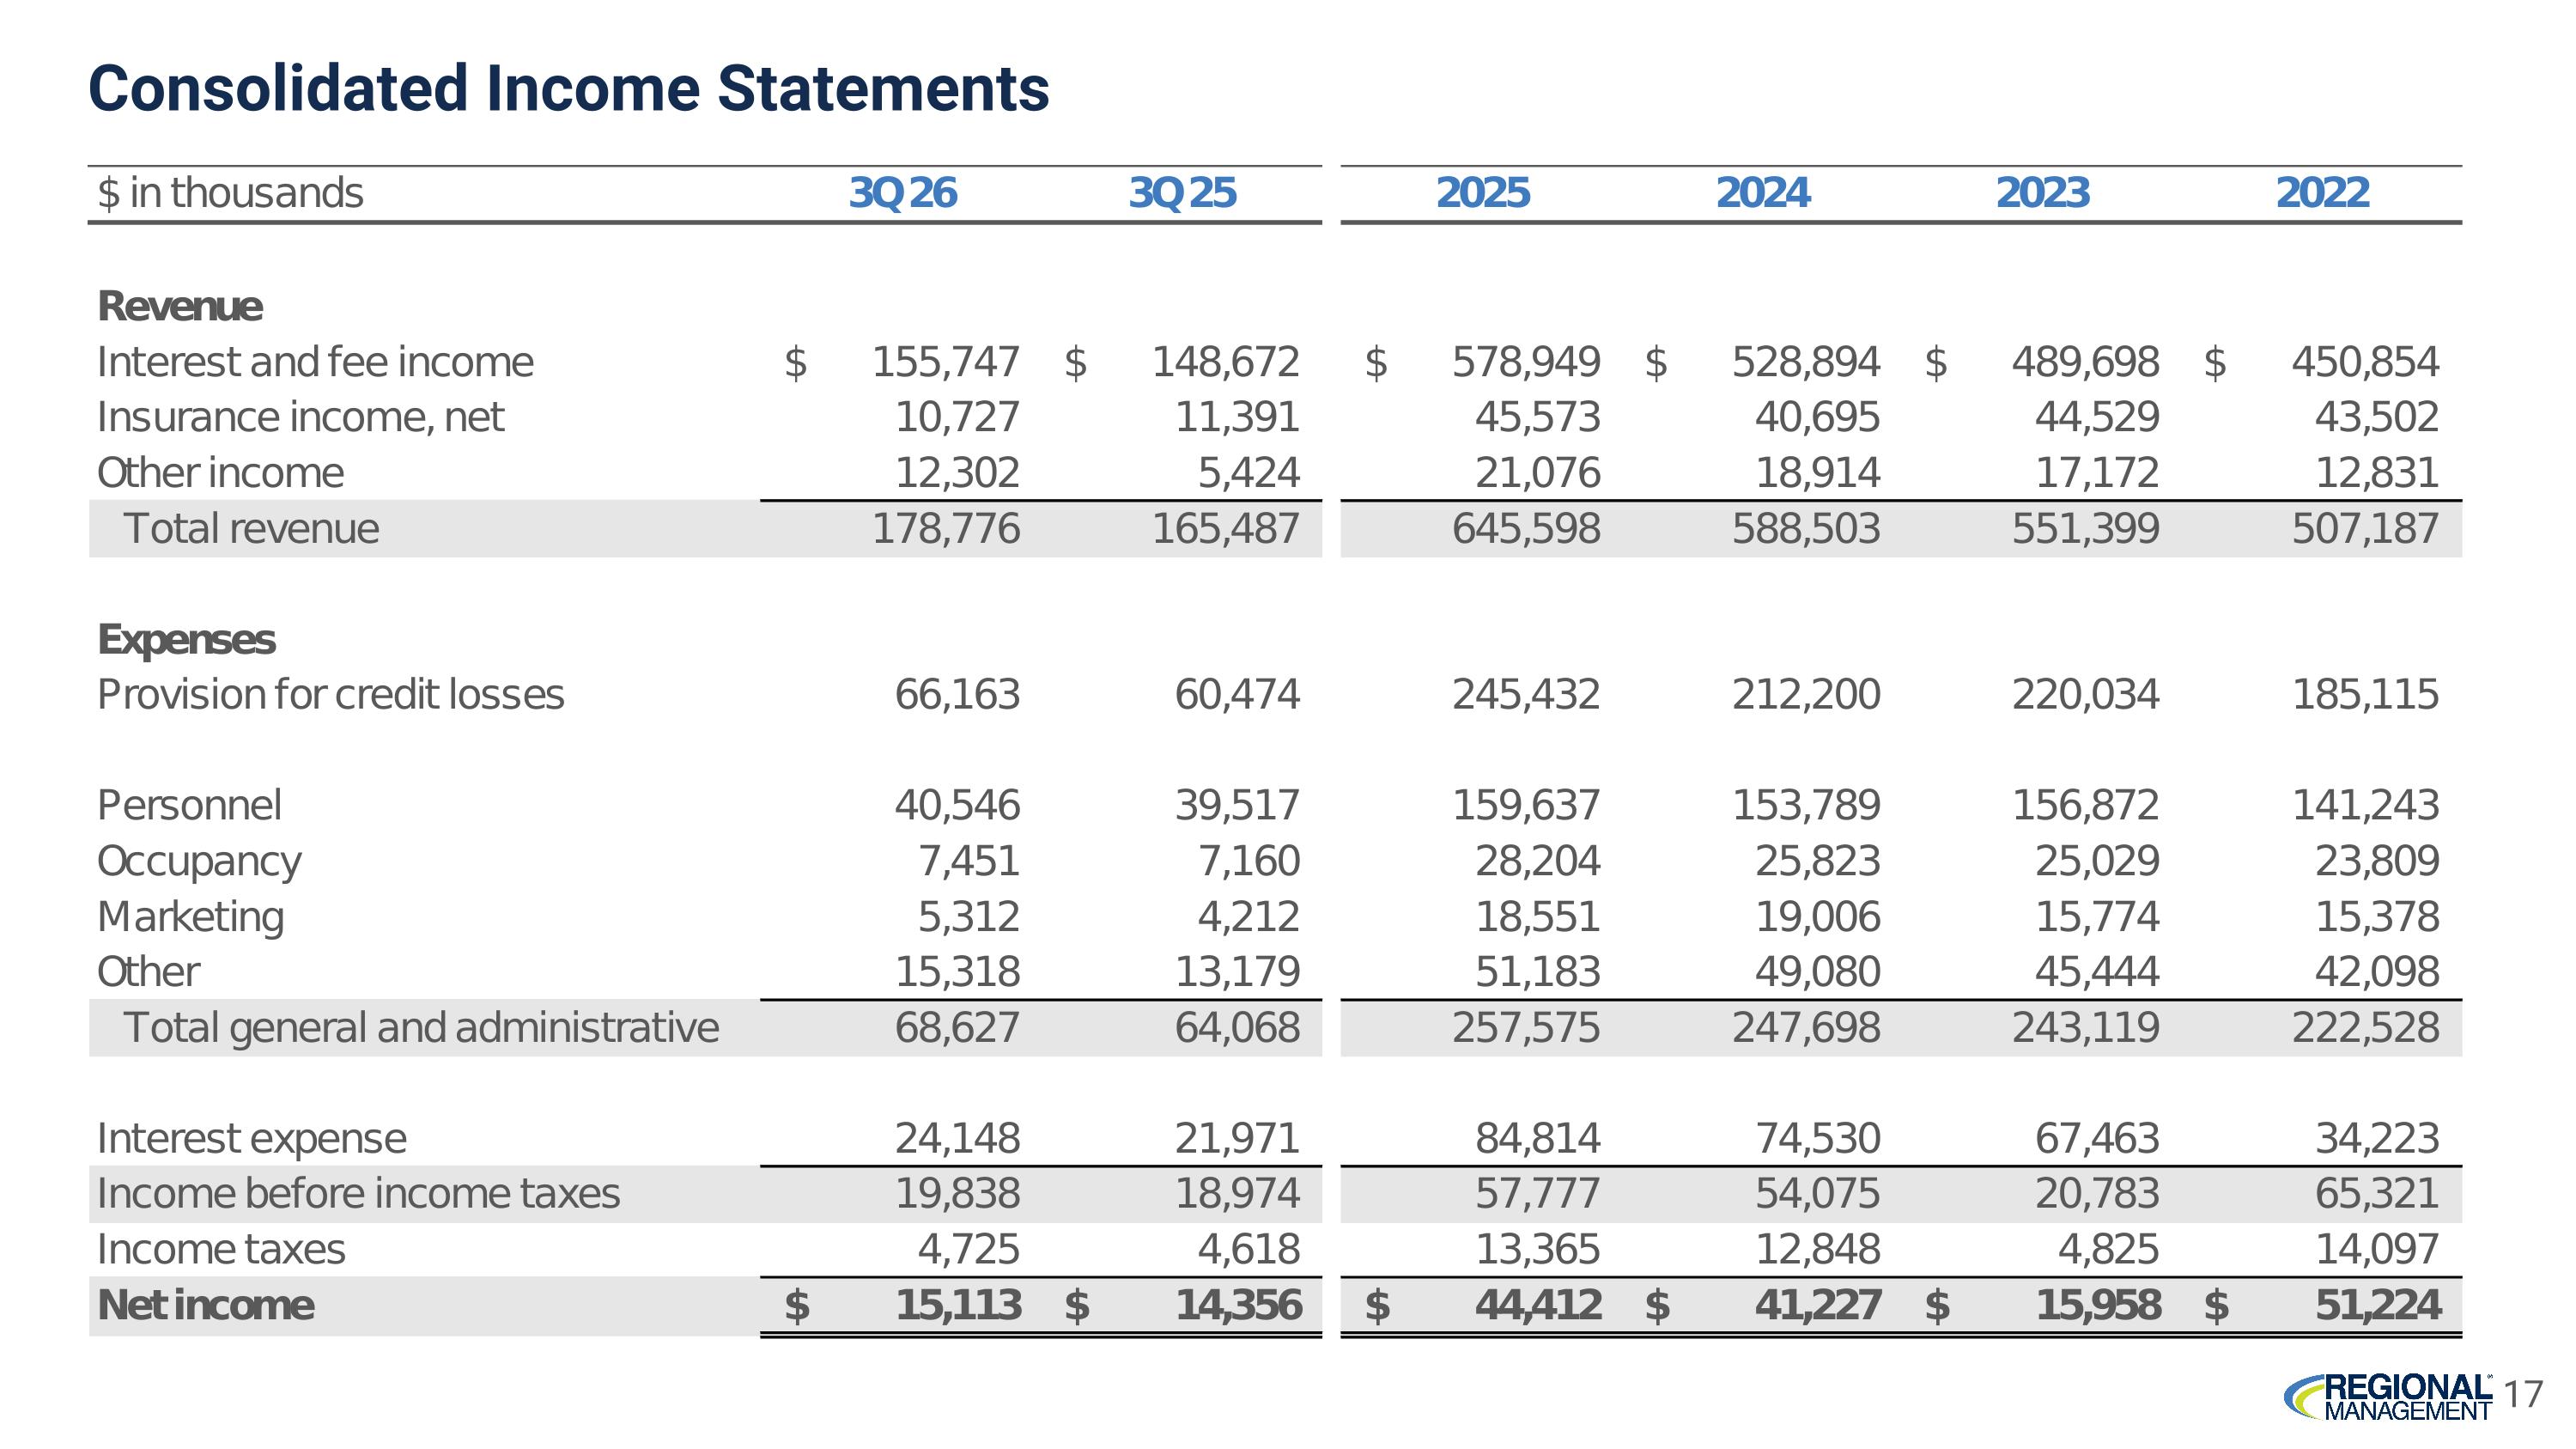
Consolidated Income Statements 17
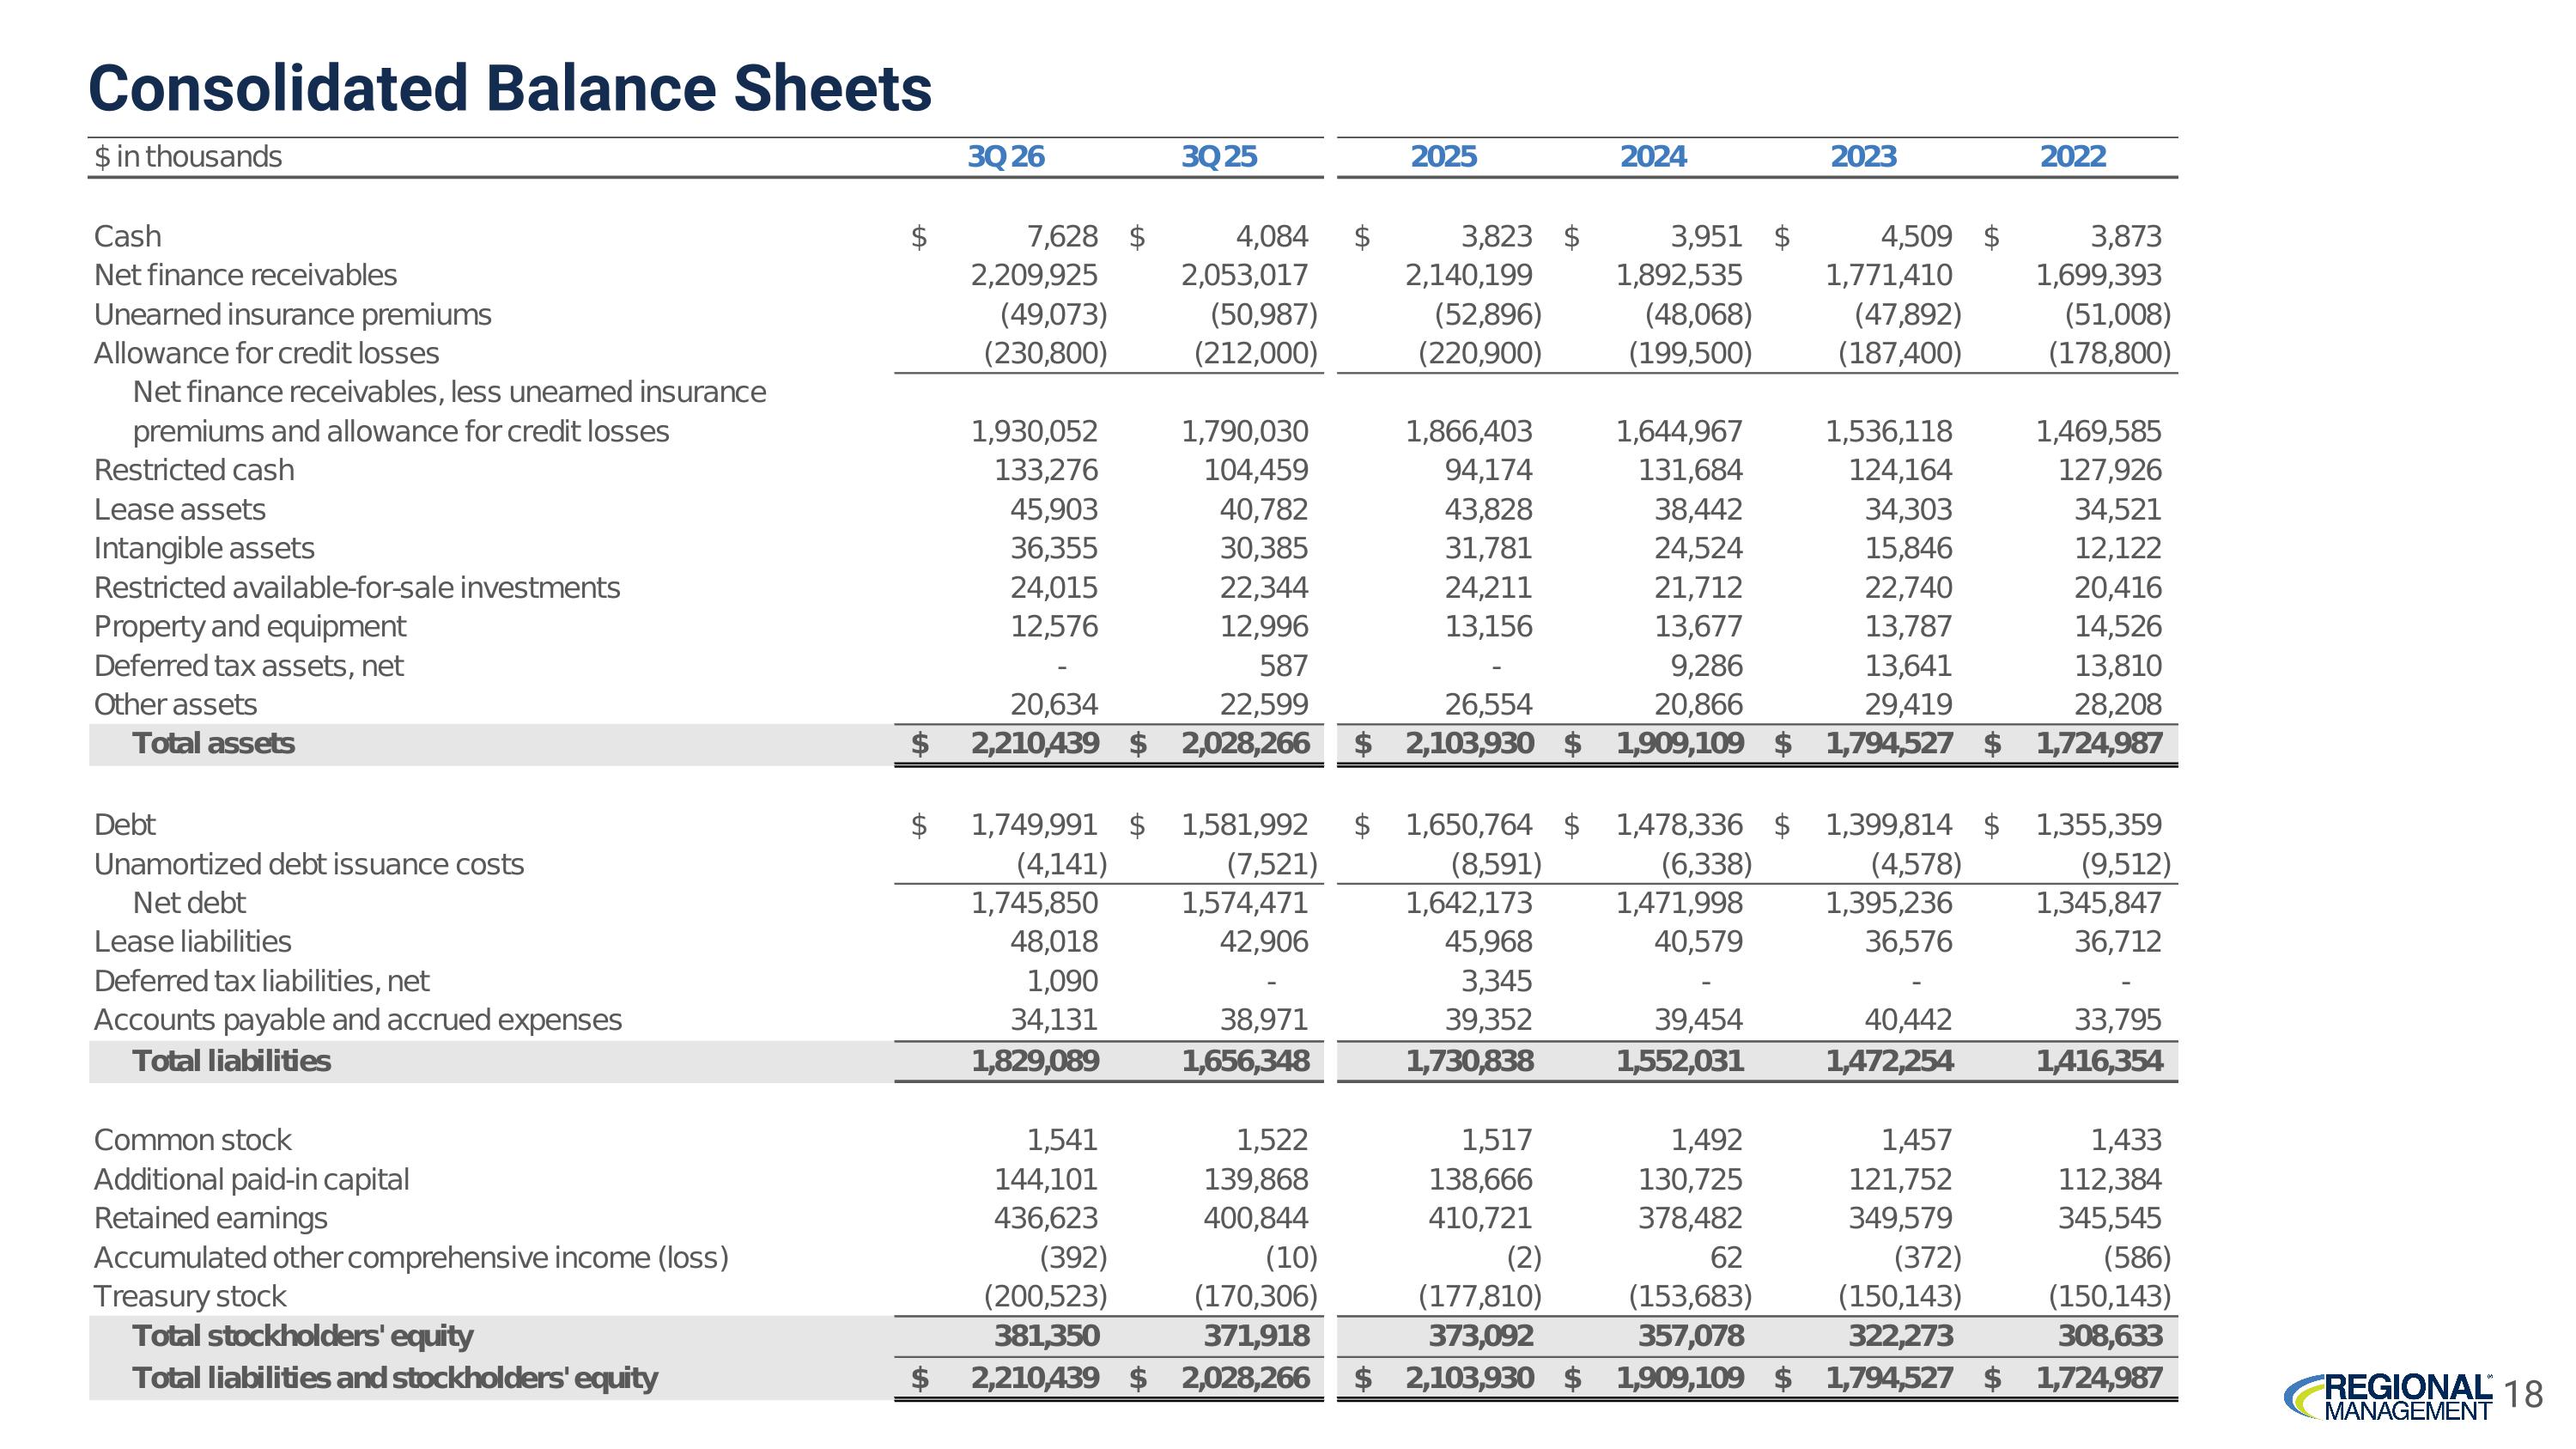
Consolidated Balance Sheets 18
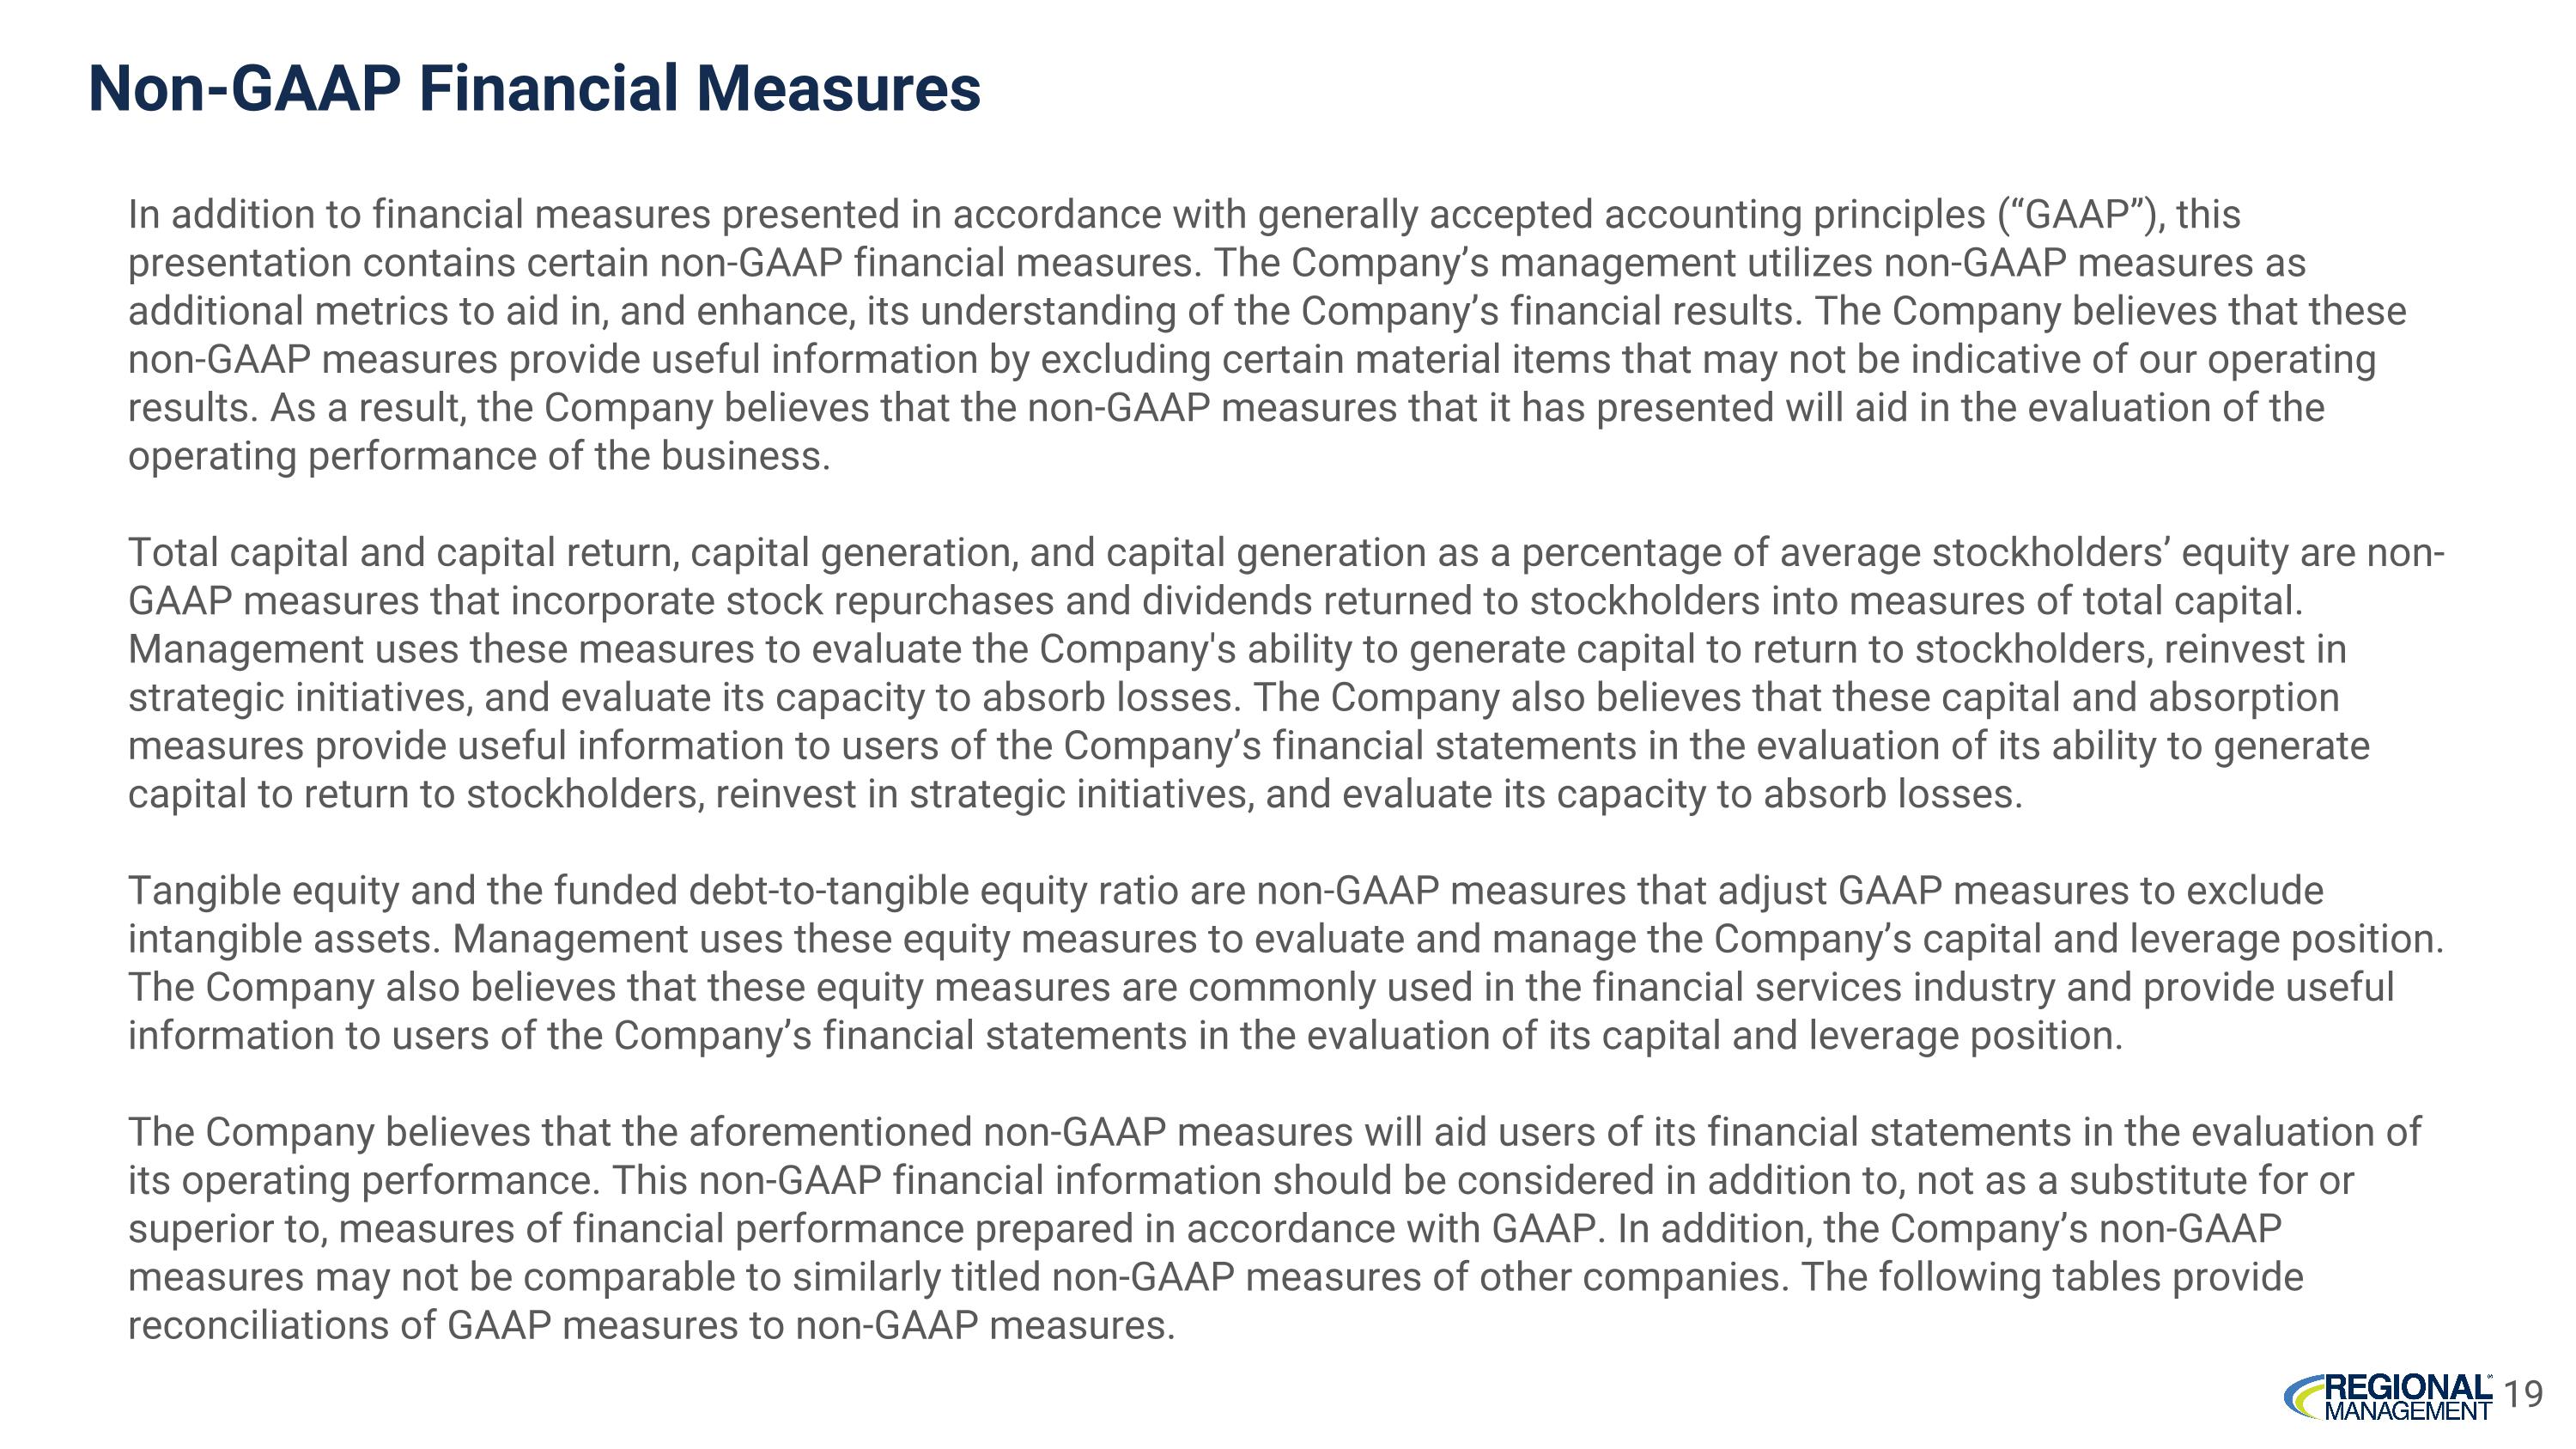
Non-GAAP Financial Measures In addition to financial measures presented in accordance with generally accepted accounting principles (“GAAP”), this presentation contains certain non-GAAP financial measures. The Company’s management utilizes non-GAAP measures as additional metrics to aid in, and enhance, its understanding of the Company’s financial results. The Company believes that these non-GAAP measures provide useful information by excluding certain material items that may not be indicative of our operating results. As a result, the Company believes that the non-GAAP measures that it has presented will aid in the evaluation of the operating performance of the business. Total capital and capital return, capital generation, and capital generation as a percentage of average stockholders’ equity are non-GAAP measures that incorporate stock repurchases and dividends returned to stockholders into measures of total capital. Management uses these measures to evaluate the Company's ability to generate capital to return to stockholders, reinvest in strategic initiatives, and evaluate its capacity to absorb losses. The Company also believes that these capital and absorption measures provide useful information to users of the Company’s financial statements in the evaluation of its ability to generate capital to return to stockholders, reinvest in strategic initiatives, and evaluate its capacity to absorb losses. Tangible equity and the funded debt-to-tangible equity ratio are non-GAAP measures that adjust GAAP measures to exclude intangible assets. Management uses these equity measures to evaluate and manage the Company’s capital and leverage position. The Company also believes that these equity measures are commonly used in the financial services industry and provide useful information to users of the Company’s financial statements in the evaluation of its capital and leverage position. The Company believes that the aforementioned non-GAAP measures will aid users of its financial statements in the evaluation of its operating performance. This non-GAAP financial information should be considered in addition to, not as a substitute for or superior to, measures of financial performance prepared in accordance with GAAP. In addition, the Company’s non-GAAP measures may not be comparable to similarly titled non-GAAP measures of other companies. The following tables provide reconciliations of GAAP measures to non-GAAP measures. 19
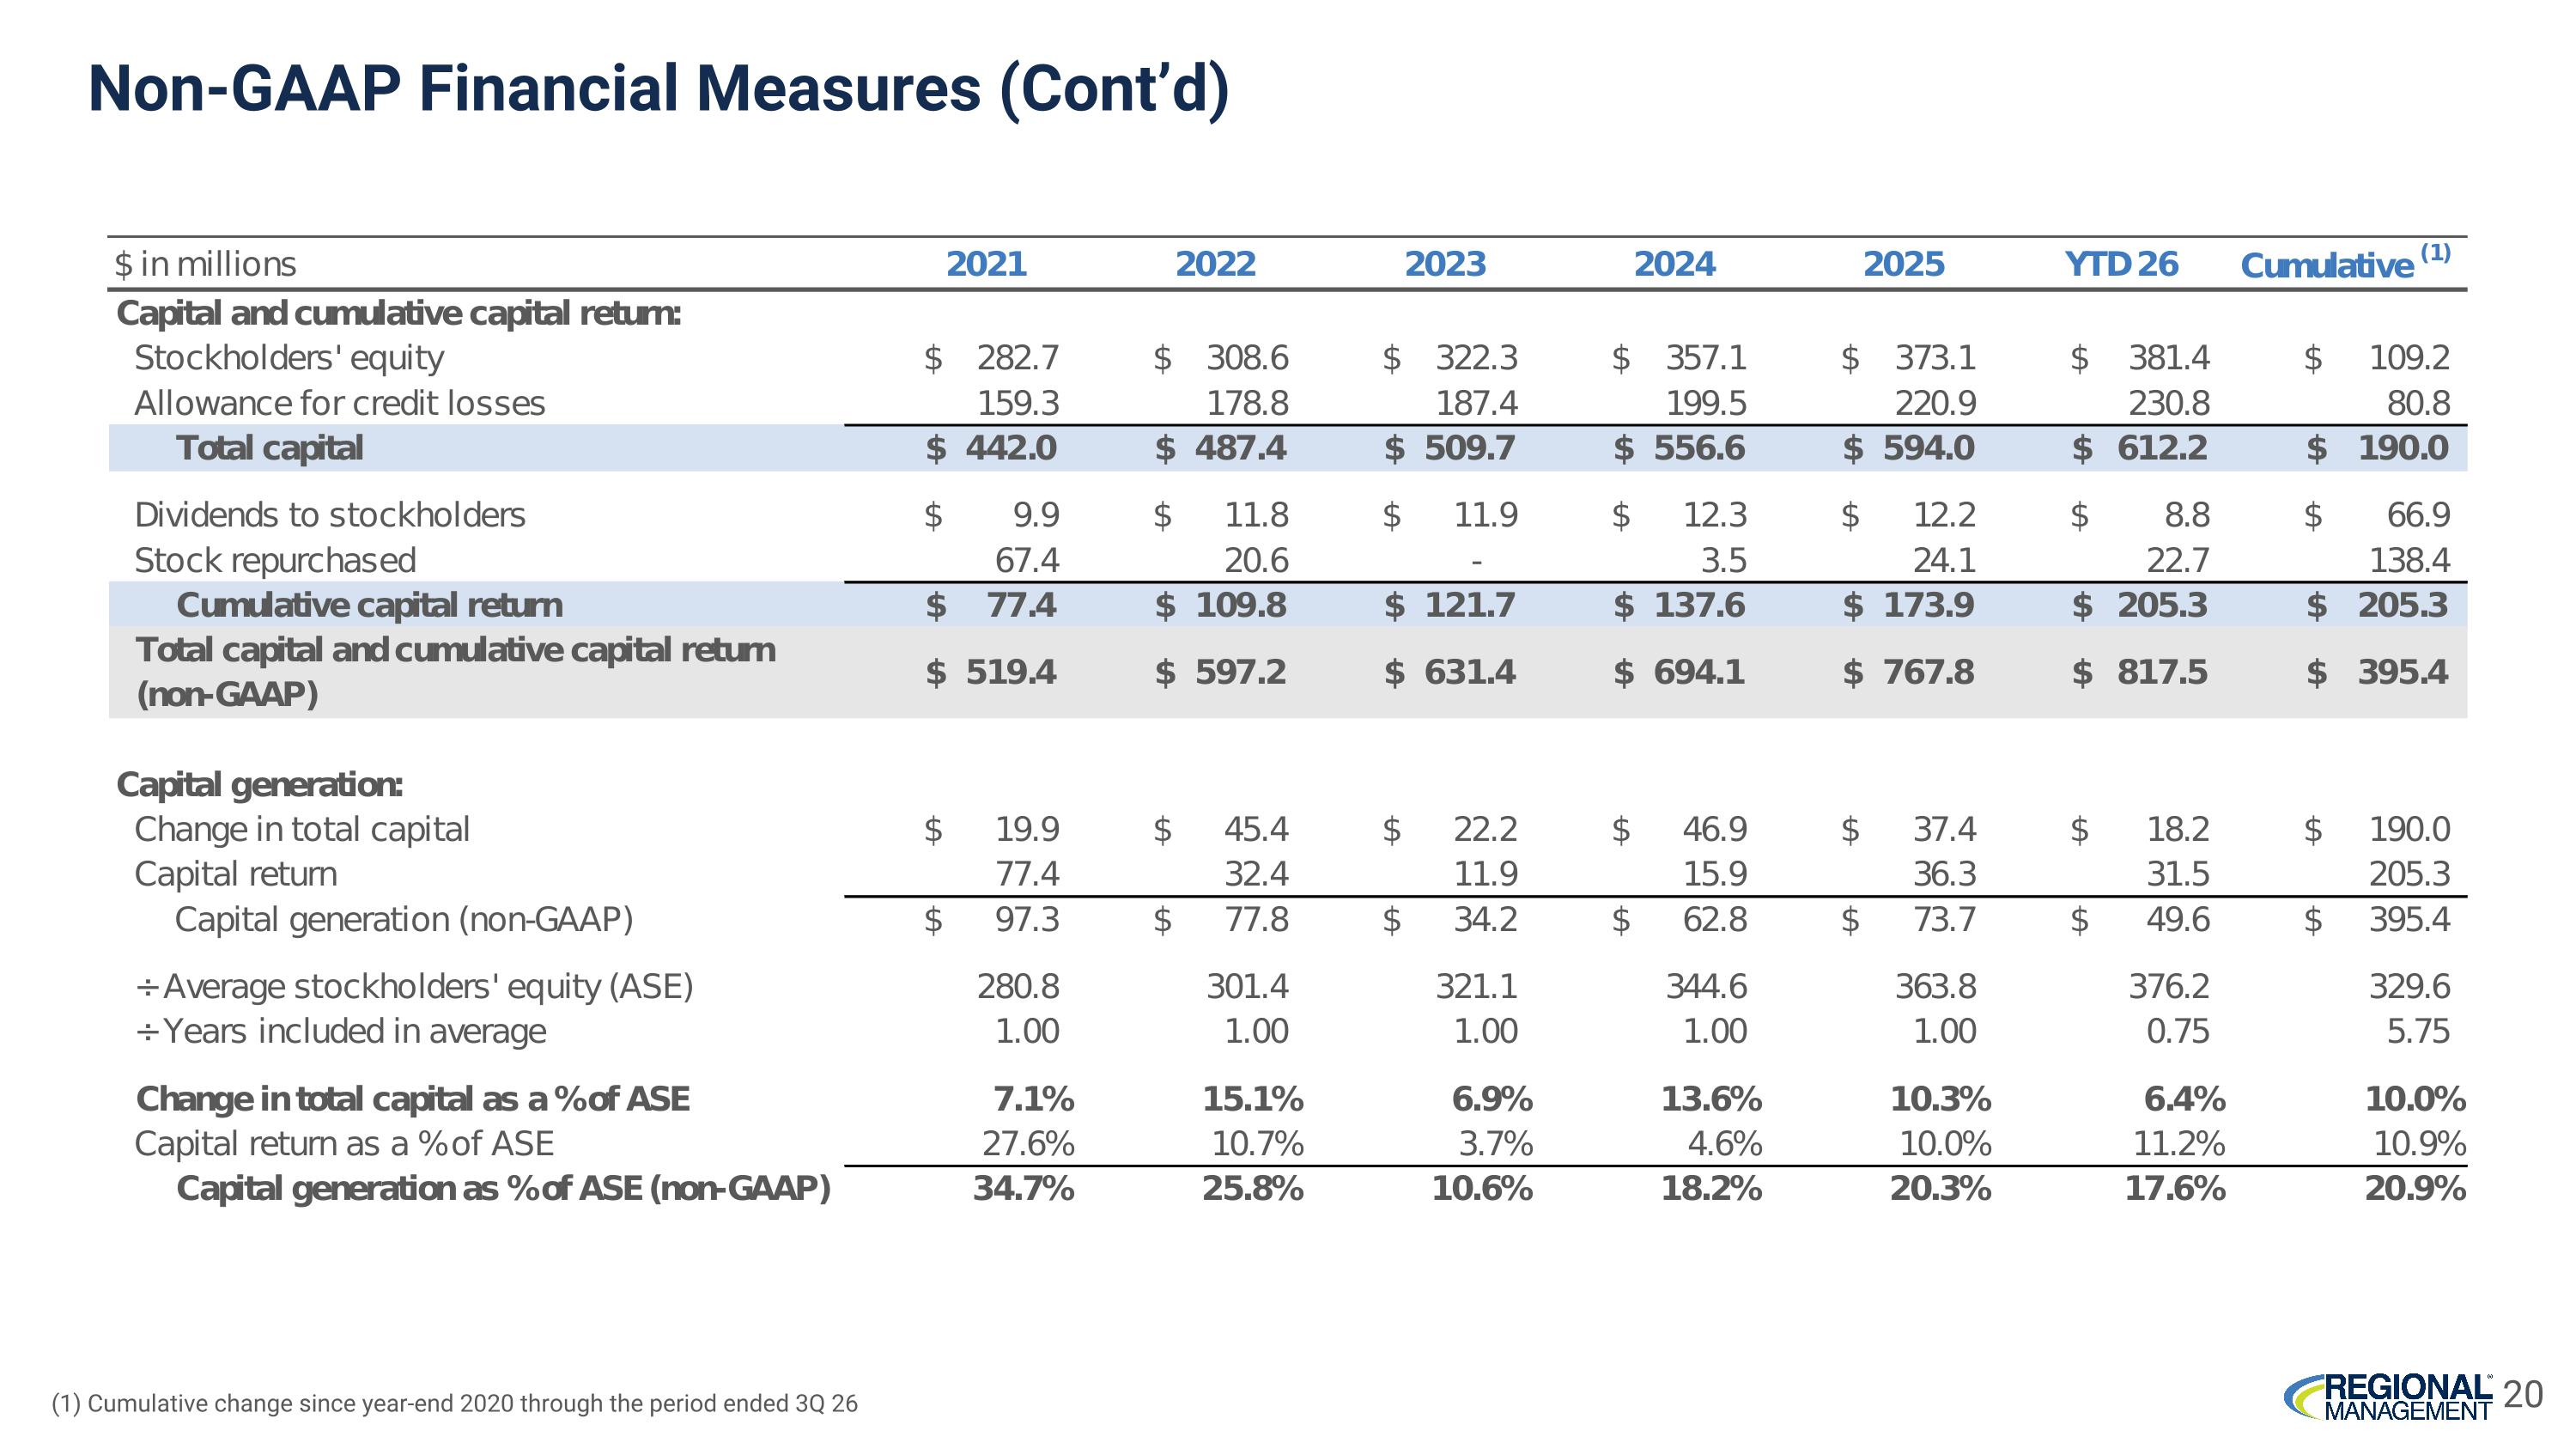
20 (1) Cumulative change since year-end 2020 through the period ended 3Q 26 Non-GAAP Financial Measures (Cont’d)
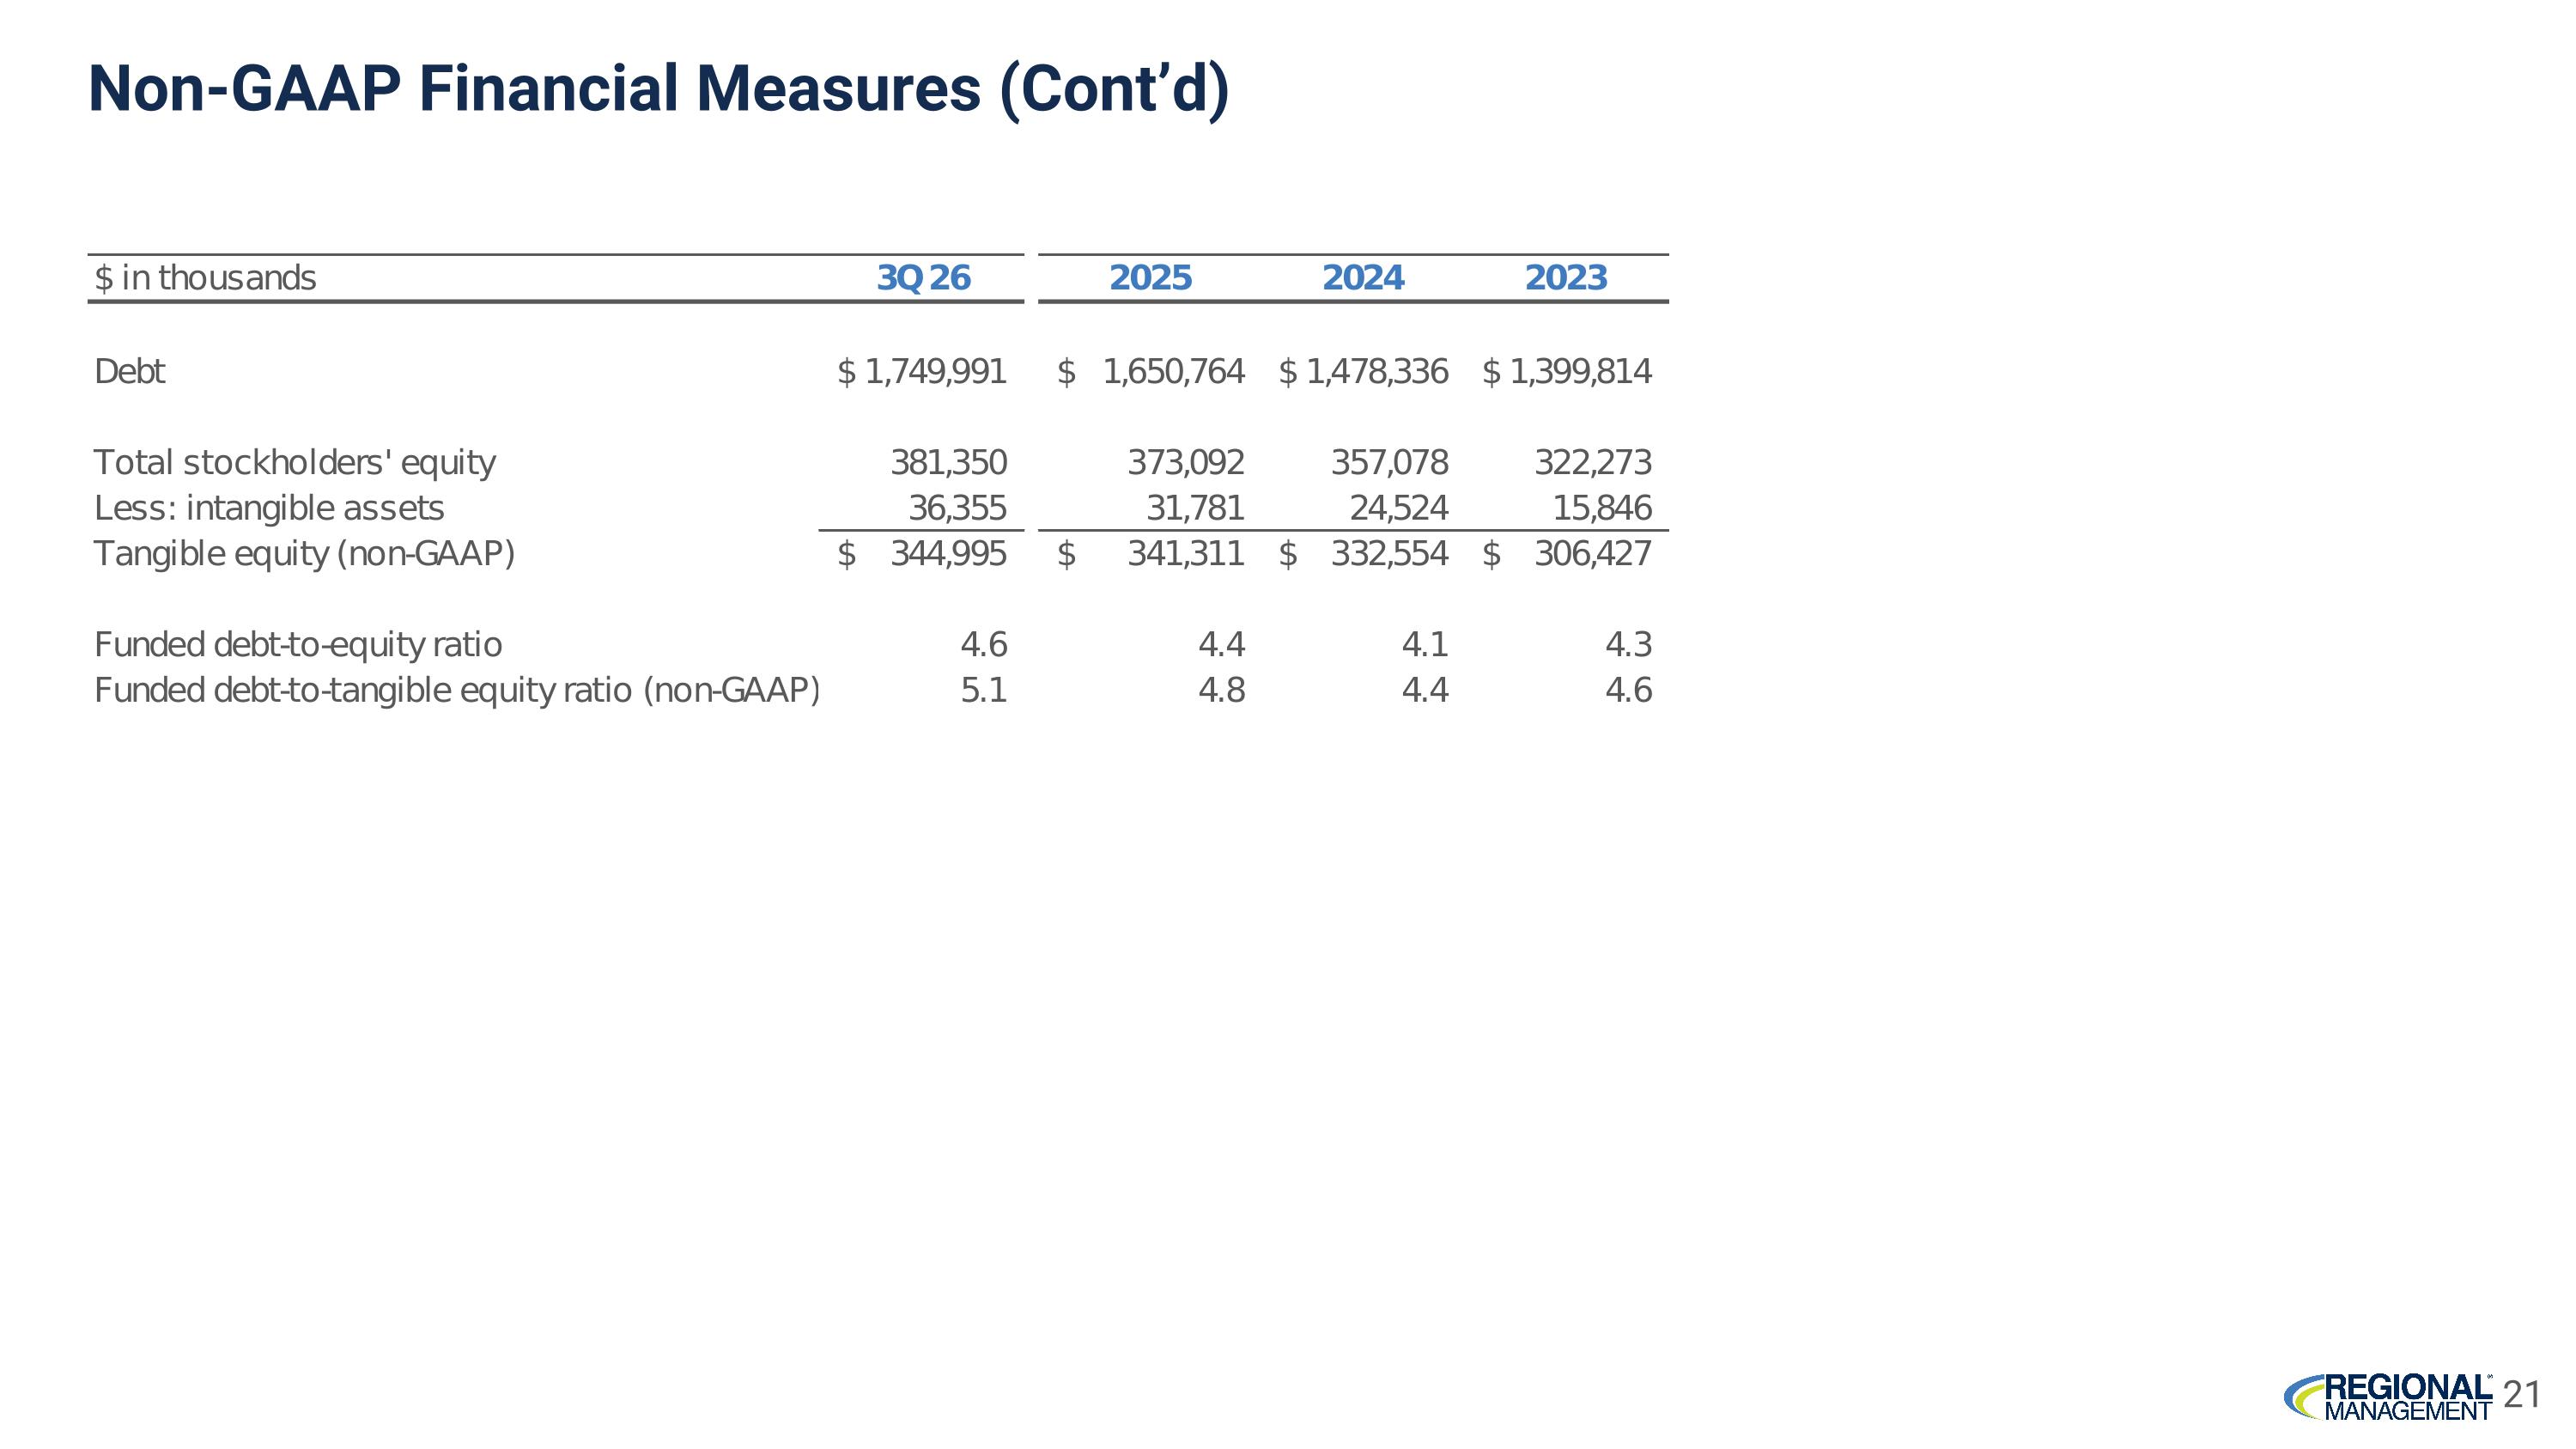
Non-GAAP Financial Measures (Cont’d) 21
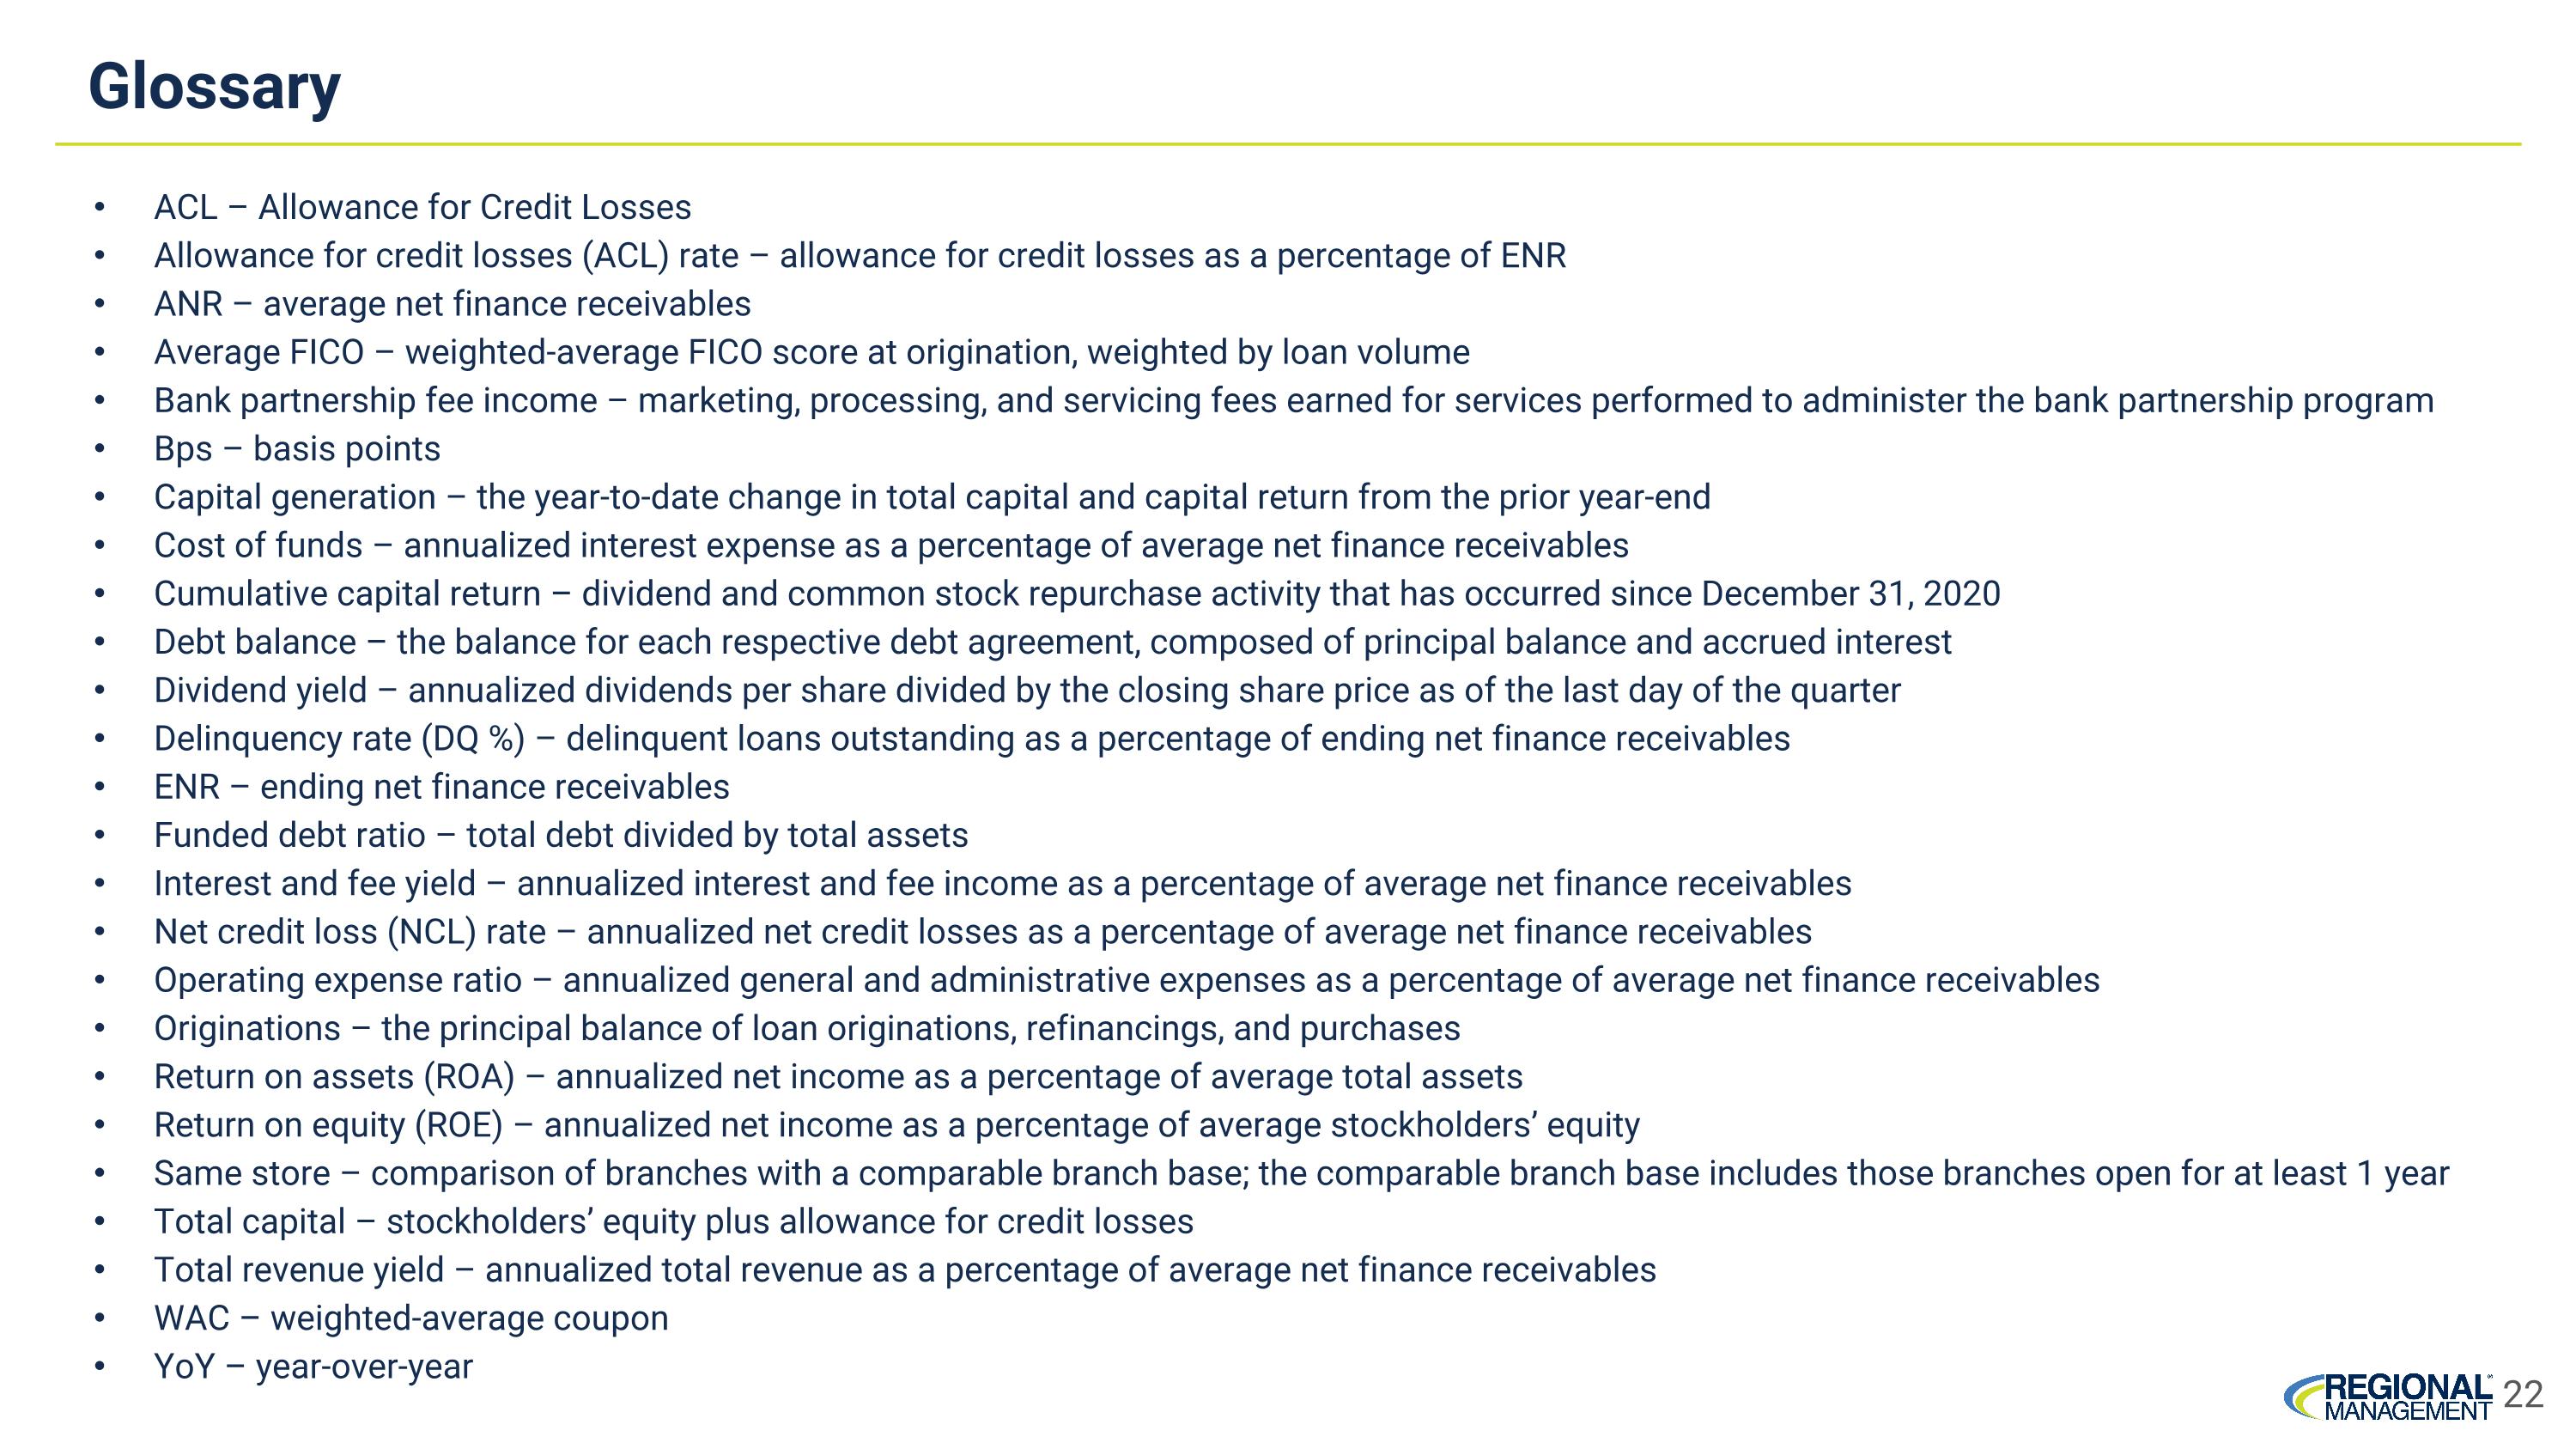
Glossary 22 ACL – Allowance for Credit Losses Allowance for credit losses (ACL) rate – allowance for credit losses as a percentage of ENR ANR – average net finance receivables Average FICO – weighted-average FICO score at origination, weighted by loan volume Bank partnership fee income – marketing, processing, and servicing fees earned for services performed to administer the bank partnership program Bps – basis points Capital generation – the year-to-date change in total capital and capital return from the prior year-end Cost of funds – annualized interest expense as a percentage of average net finance receivables Cumulative capital return – dividend and common stock repurchase activity that has occurred since December 31, 2020 Debt balance – the balance for each respective debt agreement, composed of principal balance and accrued interest Dividend yield – annualized dividends per share divided by the closing share price as of the last day of the quarter Delinquency rate (DQ %) – delinquent loans outstanding as a percentage of ending net finance receivables ENR – ending net finance receivables Funded debt ratio – total debt divided by total assets Interest and fee yield – annualized interest and fee income as a percentage of average net finance receivables Net credit loss (NCL) rate – annualized net credit losses as a percentage of average net finance receivables Operating expense ratio – annualized general and administrative expenses as a percentage of average net finance receivables Originations – the principal balance of loan originations, refinancings, and purchases Return on assets (ROA) – annualized net income as a percentage of average total assets Return on equity (ROE) – annualized net income as a percentage of average stockholders’ equity Same store – comparison of branches with a comparable branch base; the comparable branch base includes those branches open for at least 1 year Total capital – stockholders’ equity plus allowance for credit losses Total revenue yield – annualized total revenue as a percentage of average net finance receivables WAC – weighted-average coupon YoY – year-over-year