3rd Quarter 2026 Earnings Supplement and Investor Presentation October 28, 2026
Forward-Looking Statements This document may contain forward-looking statements ("FLS") concerning, among other things: projections of revenues, expenses, income or loss, earnings or loss per share, capital expenditures, payment or nonpayment of dividends, net interest income, capital levels, credit losses, net interest margin, liquidity, and other financial items. These statements may also include statements of plans, objectives, and expectations of Central Pacific Financial Corp. (the "Company") or its management or Board of Directors, including those relating to business strategies, use of capital, products or services, technology initiatives, acquisitions, and regulatory developments or actions. In addition, such statements may address future economic performance and anticipated results from our business initiatives and strategic objectives, and statements regarding assumptions underlying or relating to any of the foregoing. Words such as "believe," "plan," "anticipate," "aim," "seek," "expect," "intend," "forecast," "hope," "target," "continue," "remain," "estimate," "will," "should," "may," "could," "would," and other similar expressions are intended to identify FLS, although not all forward-looking statements contain such identifying words. While we believe that our FLS and the assumptions underlying them are reasonable, such statements are inherently subject to significant risks and uncertainties that are difficult to predict and are beyond our control. Actual results may differ materially from those expressed or implied by such FLS as a result of numerous factors, including, but are not limited to: the persistence or resurgence of current inflationary pressures in the United States and our market areas, and their effect on market interest rates, economic conditions, and credit quality; the impact of the current U.S. administration's economic policies, including potential international tariffs, geopolitical instability, trade tensions, fiscal policy changes, cost-cutting, and other governmental initiatives; disruptions in the economy, including the effects of government shutdown(s) and supply chain disruptions; labor contract disputes, and potential strikes impacting both the U.S. National and Hawaii economies; adverse trends in the real estate or construction industries, including rising inventory levels or declining property values; deterioration in borrowers' financial performance leading to increased loan delinquencies, asset quality issues, or loan losses; the impact of local, national, and international economies and natural disasters (such as wildfires, volcanic eruptions, hurricanes, tsunamis, storms, floods, or earthquakes) on our markets and major industries within Hawaii; weakness in domestic economic conditions, including higher unemployment levels, instability in the financial industry, deterioration in the real estate markets, and declines in consumer or business confidence; revisions to estimates of reserve requirements under applicable regulatory and accounting standards; the adverse effects of bank failures on customer confidence, deposit behavior, liquidity, and regulatory responses; the adverse effects of pandemics, epidemics, and other public health emergencies, including their impact on Hawaii's tourism and construction sectors, and on our borrowers, customers, vendors, and employees; the impact of legislative and regulatory developments, changing capital and consumer protection rules, and new regulations affecting our operations and competitiveness; the costs and effects of legal and regulatory proceedings, including actual or threatened litigation and the results of governmental and regulatory examinations and orders, as well as the costs of ongoing or potential compliance efforts; the effect of accounting standard changes adopted by regulatory agencies, the Securities and Exchange Commission ("SEC"), the Public Company Accounting Oversight Board ("PCAOB"), or the Financial Accounting Standards Board ("FASB"), and the cost and resources associated with implementation; changes in trade, tariff, monetary, or fiscal policies and laws, including actions by the Board of Governors of the Federal Reserve System; increased competition from banks, credit unions, fintech companies, nonbank lenders, and other financial service providers; market volatility and monetary fluctuations; declines in our market capitalization or changes in the price of the Company's common stock; the effects and cost of acquisitions, dispositions, strategic investments, business combinations, restructurings, or other strategic transactions we may pursue or evaluate; political instability, acts of war or terrorism, or other geopolitical conflicts; shifts in consumer spending, borrowing and savings behaviors; technological changes and developments; cybersecurity incidents, data privacy breaches, or fraud involving us or third-party vendors; deficiencies in our internal control over financial reporting or disclosure controls and procedures, and our ability to remediate them; our ability to achieve efficiency ratio improvement goals; changes in management, directors, key personnel, organizational structure, compensation programs, employee benefit plans, or our ability to attract and retain qualified personnel; risks related to the United States fiscal debt, deficit and budget uncertainties; and our ability to successfully manage the risks associated with any of the foregoing items. For further information on factors that could cause actual results to differ materially from the expectations or projections expressed in our FLS, please refer to the Company's filings with the U.S. Securities and Exchange Commission, including the Company's most recent Form 10-K, particularly, the discussion of "Risk Factors" set forth therein. We urge investors to consider all of these factors carefully in evaluating the FLS contained in this document. FLS speak only as of the date on which such statements are made. We undertake no obligation to update any FLS to reflect events or circumstances occurring after the date on which such statements are made, or to reflect the occurrence of unanticipated events, except as required by law.
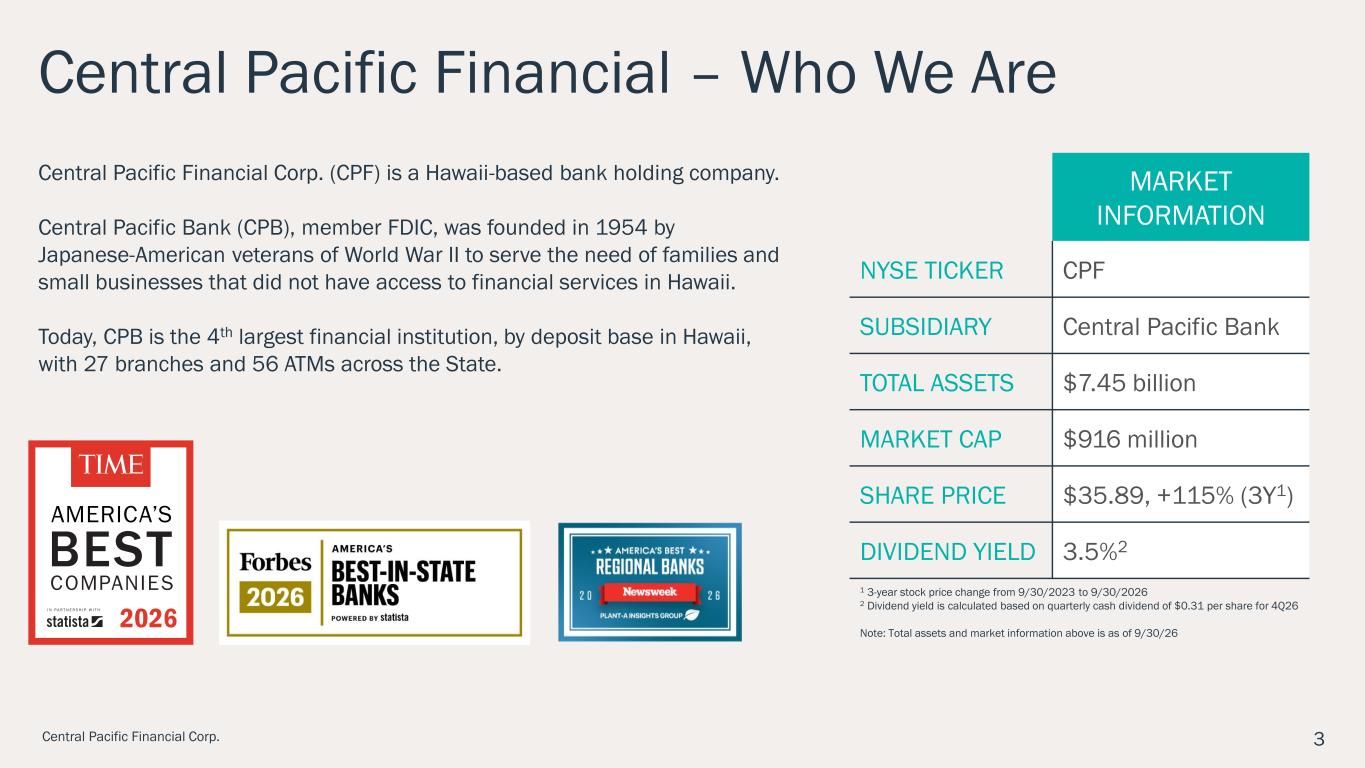
3Central Pacific Financial Corp. MARKET INFORMATION NYSE TICKER CPF SUBSIDIARY Central Pacific Bank TOTAL ASSETS $7.45 billion MARKET CAP $916 million SHARE PRICE $35.89, +115% (3Y1) DIVIDEND YIELD 3.5%2 Central Pacific Financial Corp. (CPF) is a Hawaii-based bank holding company. Central Pacific Bank (CPB), member FDIC, was founded in 1954 by Japanese-American veterans of World War II to serve the need of families and small businesses that did not have access to financial services in Hawaii. Today, CPB is the 4th largest financial institution, by deposit base in Hawaii, with 27 branches and 56 ATMs across the State. Central Pacific Financial – Who We Are 1 3-year stock price change from 9/30/2023 to 9/30/2026 2 Dividend yield is calculated based on quarterly cash dividend of $0.31 per share for 4Q26 Note: Total assets and market information above is as of 9/30/26

Strategic Focus
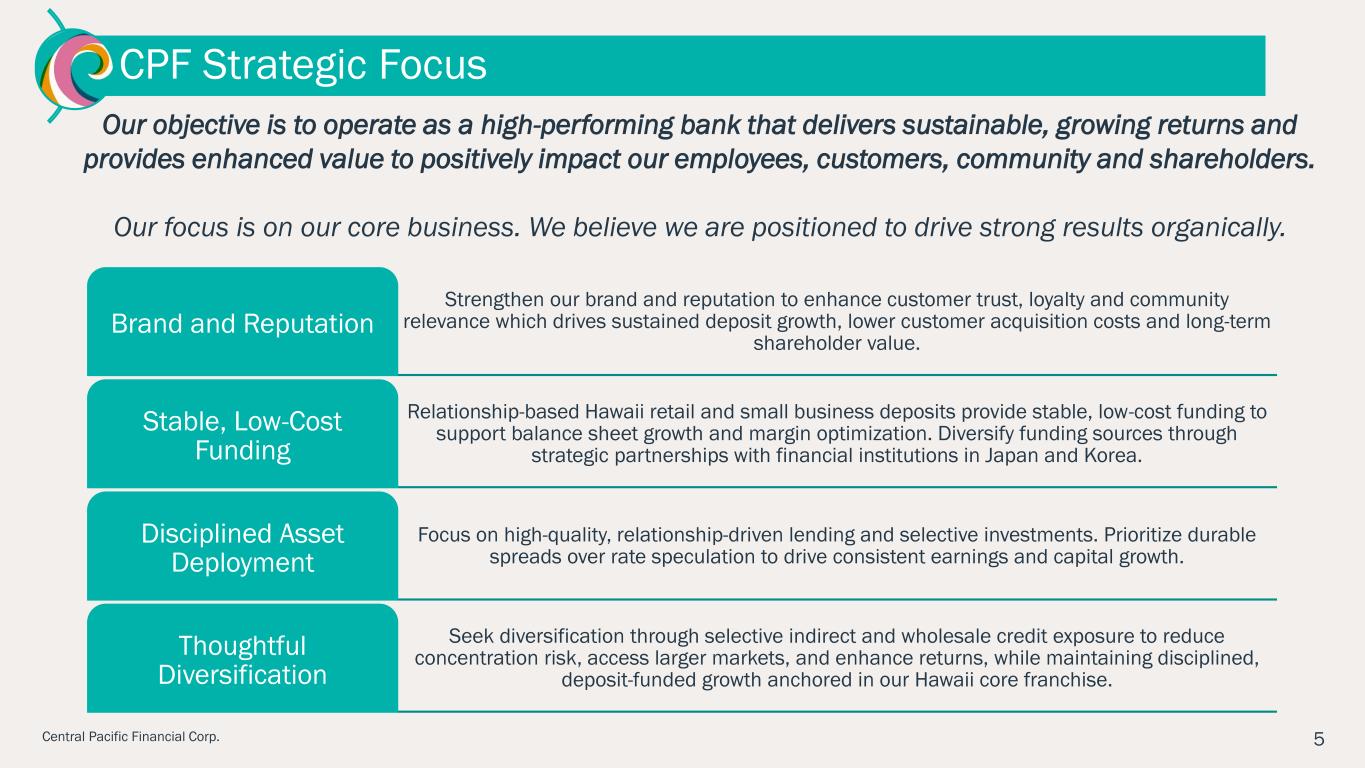
5Central Pacific Financial Corp. CPF Strategic Focus Our objective is to operate as a high-performing bank that delivers sustainable, growing returns and provides enhanced value to positively impact our employees, customers, community and shareholders. Our focus is on our core business. We believe we are positioned to drive strong results organically. Strengthen our brand and reputation to enhance customer trust, loyalty and community relevance which drives sustained deposit growth, lower customer acquisition costs and long-term shareholder value. Brand and Reputation Relationship-based Hawaii retail and small business deposits provide stable, low-cost funding to support balance sheet growth and margin optimization. Diversify funding sources through strategic partnerships with financial institutions in Japan and Korea. Stable, Low-Cost Funding Focus on high-quality, relationship-driven lending and selective investments. Prioritize durable spreads over rate speculation to drive consistent earnings and capital growth. Disciplined Asset Deployment Seek diversification through selective indirect and wholesale credit exposure to reduce concentration risk, access larger markets, and enhance returns, while maintaining disciplined, deposit-funded growth anchored in our Hawaii core franchise. Thoughtful Diversification
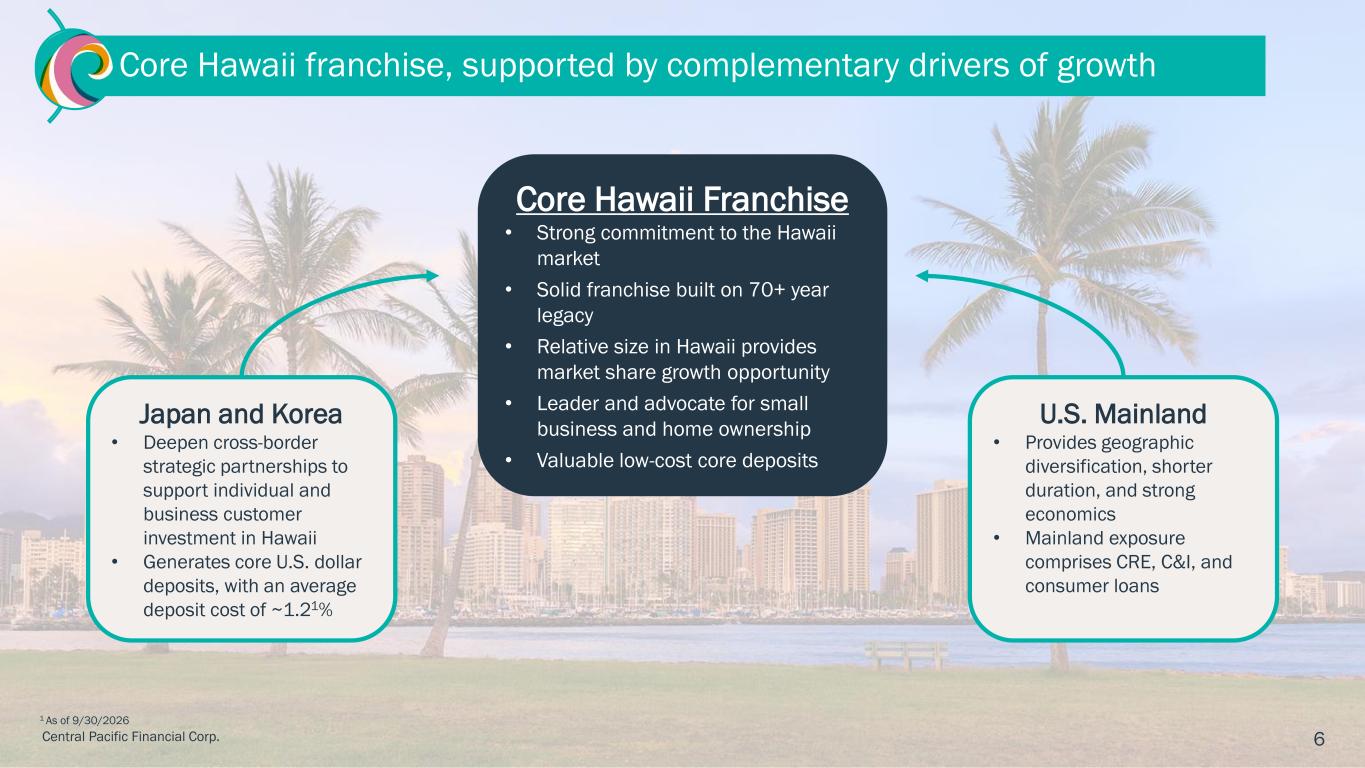
6Central Pacific Financial Corp. Core Hawaii franchise, supported by complementary drivers of growth Core Hawaii Franchise • Strong commitment to the Hawaii market • Solid franchise built on 70+ year legacy • Relative size in Hawaii provides market share growth opportunity • Leader and advocate for small business and home ownership • Valuable low-cost core deposits Japan and Korea • Deepen cross-border strategic partnerships to support individual and business customer investment in Hawaii • Generates core U.S. dollar deposits, with an average deposit cost of ~1.21% U.S. Mainland • Provides geographic diversification, shorter duration, and strong economics • Mainland exposure comprises CRE, C&I, and consumer loans 1 As of 9/30/2026
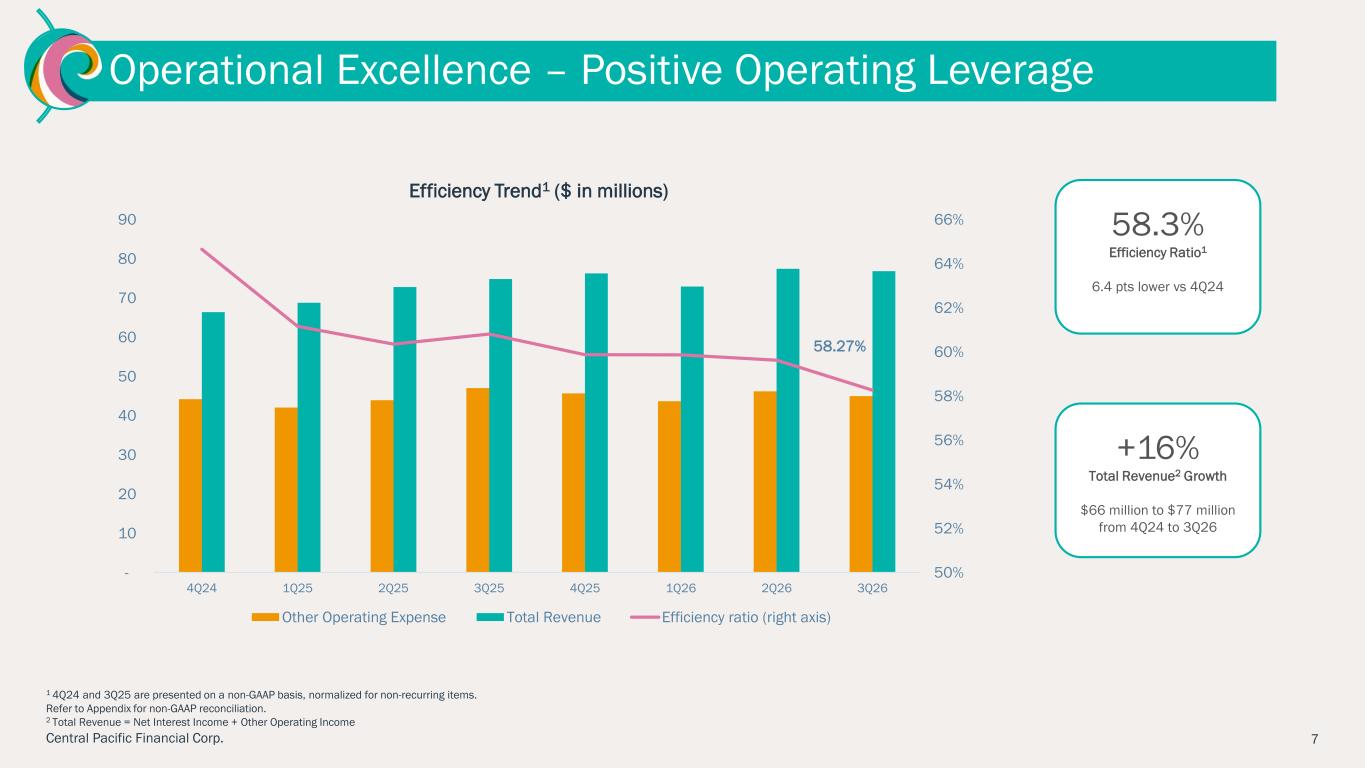
Operational Excellence – Positive Operating Leverage 1 4Q24 and 3Q25 are presented on a non-GAAP basis, normalized for non-recurring items. Refer to Appendix for non-GAAP reconciliation. 2 Total Revenue = Net Interest Income + Other Operating Income Central Pacific Financial Corp. 7 58.3% Efficiency Ratio1 6.4 pts lower vs 4Q24 +16% Total Revenue2 Growth $66 million to $77 million from 4Q24 to 3Q26 58.27% 50% 52% 54% 56% 58% 60% 62% 64% 66% - 10 20 30 40 50 60 70 80 90 4Q24 1Q25 2Q25 3Q25 4Q25 1Q26 2Q26 3Q26 Efficiency Trend1 ($ in millions) Other Operating Expense Total Revenue Efficiency ratio (right axis)
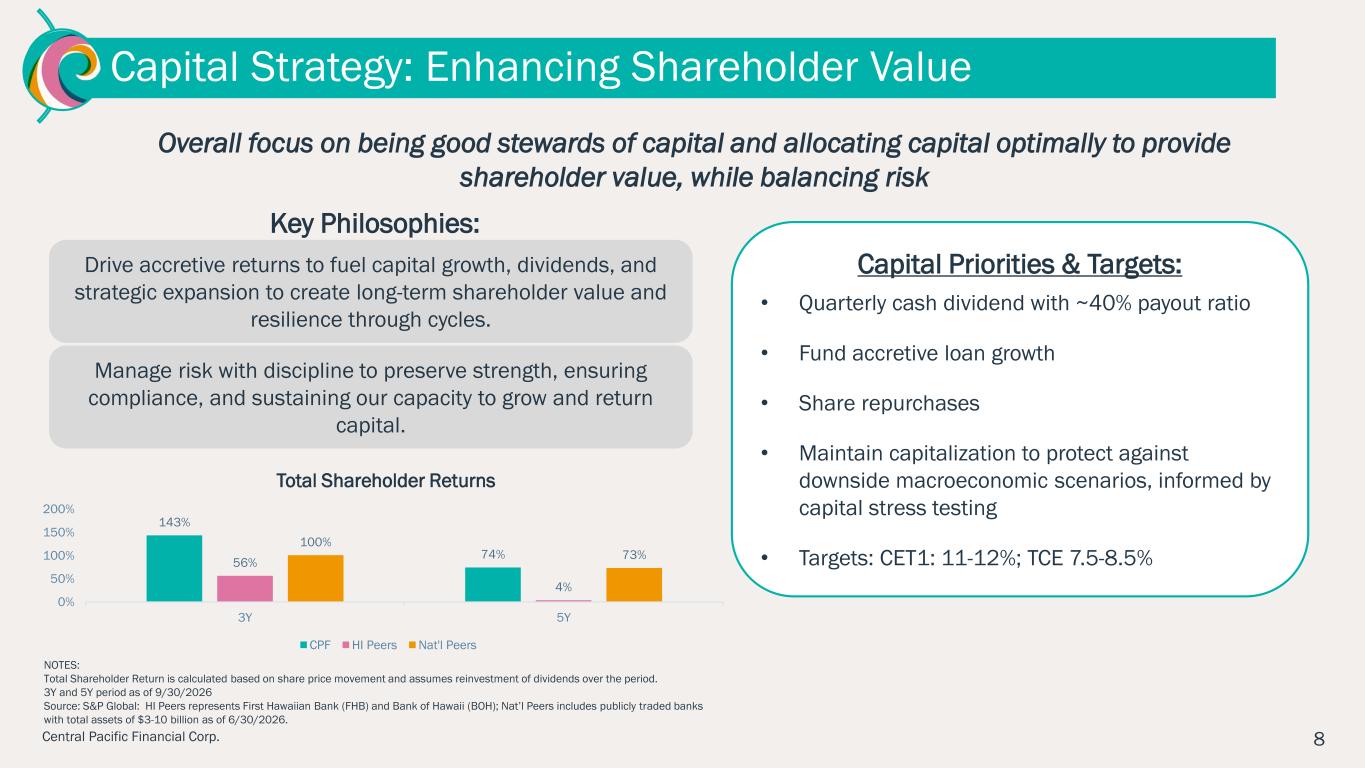
8Central Pacific Financial Corp. Capital Strategy: Enhancing Shareholder Value Overall focus on being good stewards of capital and allocating capital optimally to provide shareholder value, while balancing risk Drive accretive returns to fuel capital growth, dividends, and strategic expansion to create long-term shareholder value and resilience through cycles. Manage risk with discipline to preserve strength, ensuring compliance, and sustaining our capacity to grow and return capital. Key Philosophies: NOTES: Total Shareholder Return is calculated based on share price movement and assumes reinvestment of dividends over the period. 3Y and 5Y period as of 9/30/2026 Source: S&P Global: HI Peers represents First Hawaiian Bank (FHB) and Bank of Hawaii (BOH); Nat’l Peers includes publicly traded banks with total assets of $3-10 billion as of 6/30/2026. Capital Priorities & Targets: • Quarterly cash dividend with ~40% payout ratio • Fund accretive loan growth • Share repurchases • Maintain capitalization to protect against downside macroeconomic scenarios, informed by capital stress testing • Targets: CET1: 11-12%; TCE 7.5-8.5% 143% 74% 56% 4% 100% 73% 0% 50% 100% 150% 200% 3Y 5Y Total Shareholder Returns CPF HI Peers Nat'l Peers

3Q 2026 Financial Results
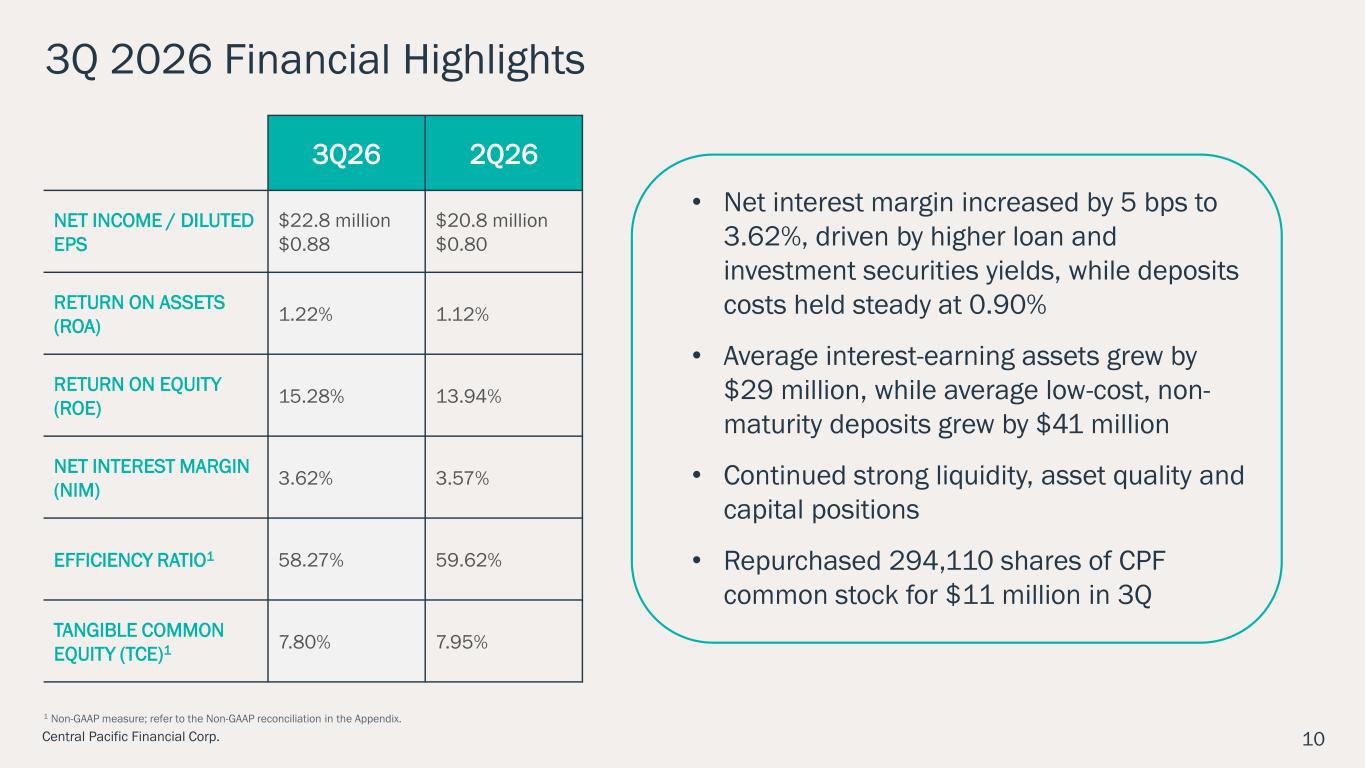
10Central Pacific Financial Corp. 3Q 2026 Financial Highlights 3Q26 2Q26 NET INCOME / DILUTED EPS $22.8 million $0.88 $20.8 million $0.80 RETURN ON ASSETS (ROA) 1.22% 1.12% RETURN ON EQUITY (ROE) 15.28% 13.94% NET INTEREST MARGIN (NIM) 3.62% 3.57% EFFICIENCY RATIO1 58.27% 59.62% TANGIBLE COMMON EQUITY (TCE)1 7.80% 7.95% 1 Non-GAAP measure; refer to the Non-GAAP reconciliation in the Appendix. • Net interest margin increased by 5 bps to 3.62%, driven by higher loan and investment securities yields, while deposits costs held steady at 0.90% • Average interest-earning assets grew by $29 million, while average low-cost, non- maturity deposits grew by $41 million • Continued strong liquidity, asset quality and capital positions • Repurchased 294,110 shares of CPF common stock for $11 million in 3Q
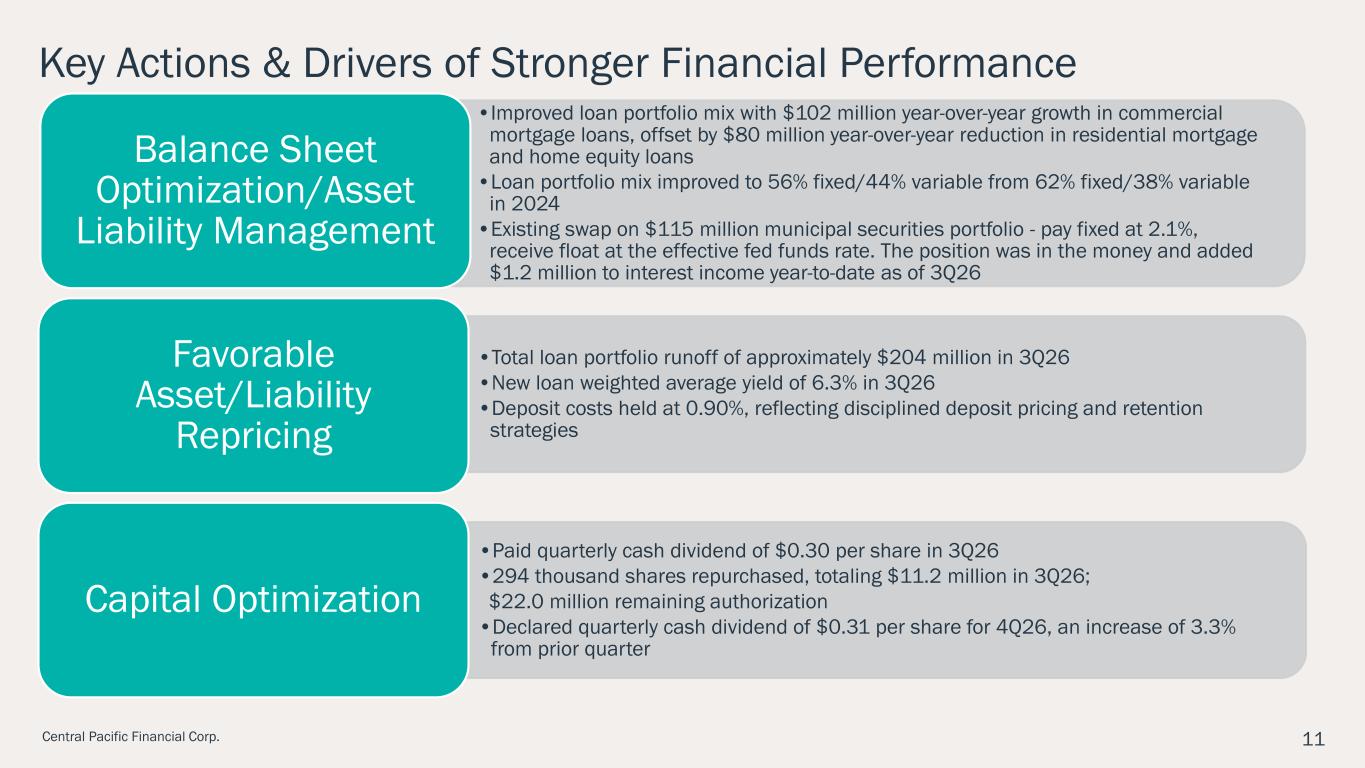
11Central Pacific Financial Corp. Key Actions & Drivers of Stronger Financial Performance •Improved loan portfolio mix with $102 million year-over-year growth in commercial mortgage loans, offset by $80 million year-over-year reduction in residential mortgage and home equity loans •Loan portfolio mix improved to 56% fixed/44% variable from 62% fixed/38% variable in 2024 •Existing swap on $115 million municipal securities portfolio - pay fixed at 2.1%, receive float at the effective fed funds rate. The position was in the money and added $1.2 million to interest income year-to-date as of 3Q26 Balance Sheet Optimization/Asset Liability Management •Total loan portfolio runoff of approximately $204 million in 3Q26 •New loan weighted average yield of 6.3% in 3Q26 •Deposit costs held at 0.90%, reflecting disciplined deposit pricing and retention strategies Favorable Asset/Liability Repricing •Paid quarterly cash dividend of $0.30 per share in 3Q26 •294 thousand shares repurchased, totaling $11.2 million in 3Q26; $22.0 million remaining authorization •Declared quarterly cash dividend of $0.31 per share for 4Q26, an increase of 3.3% from prior quarter Capital Optimization
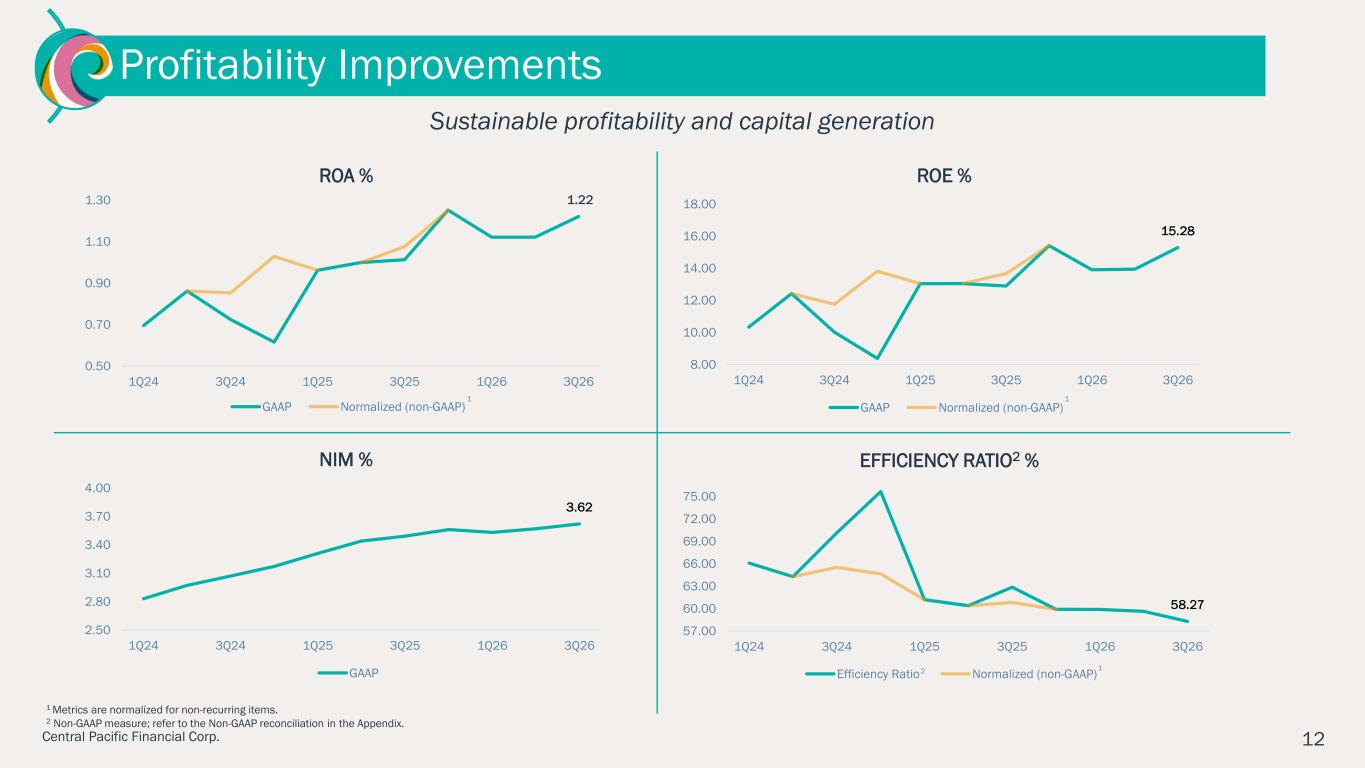
12Central Pacific Financial Corp. 58.27 57.00 60.00 63.00 66.00 69.00 72.00 75.00 1Q24 3Q24 1Q25 3Q25 1Q26 3Q26 EFFICIENCY RATIO2 % Efficiency Ratio Normalized (non-GAAP) Profitability Improvements Sustainable profitability and capital generation 1 Metrics are normalized for non-recurring items. 2 Non-GAAP measure; refer to the Non-GAAP reconciliation in the Appendix. 1.22 0.50 0.70 0.90 1.10 1.30 1Q24 3Q24 1Q25 3Q25 1Q26 3Q26 ROA % GAAP Normalized (non-GAAP) 1 15.28 8.00 10.00 12.00 14.00 16.00 18.00 1Q24 3Q24 1Q25 3Q25 1Q26 3Q26 ROE % GAAP Normalized (non-GAAP) 1 1 3.62 2.50 2.80 3.10 3.40 3.70 4.00 1Q24 3Q24 1Q25 3Q25 1Q26 3Q26 NIM % GAAP 2
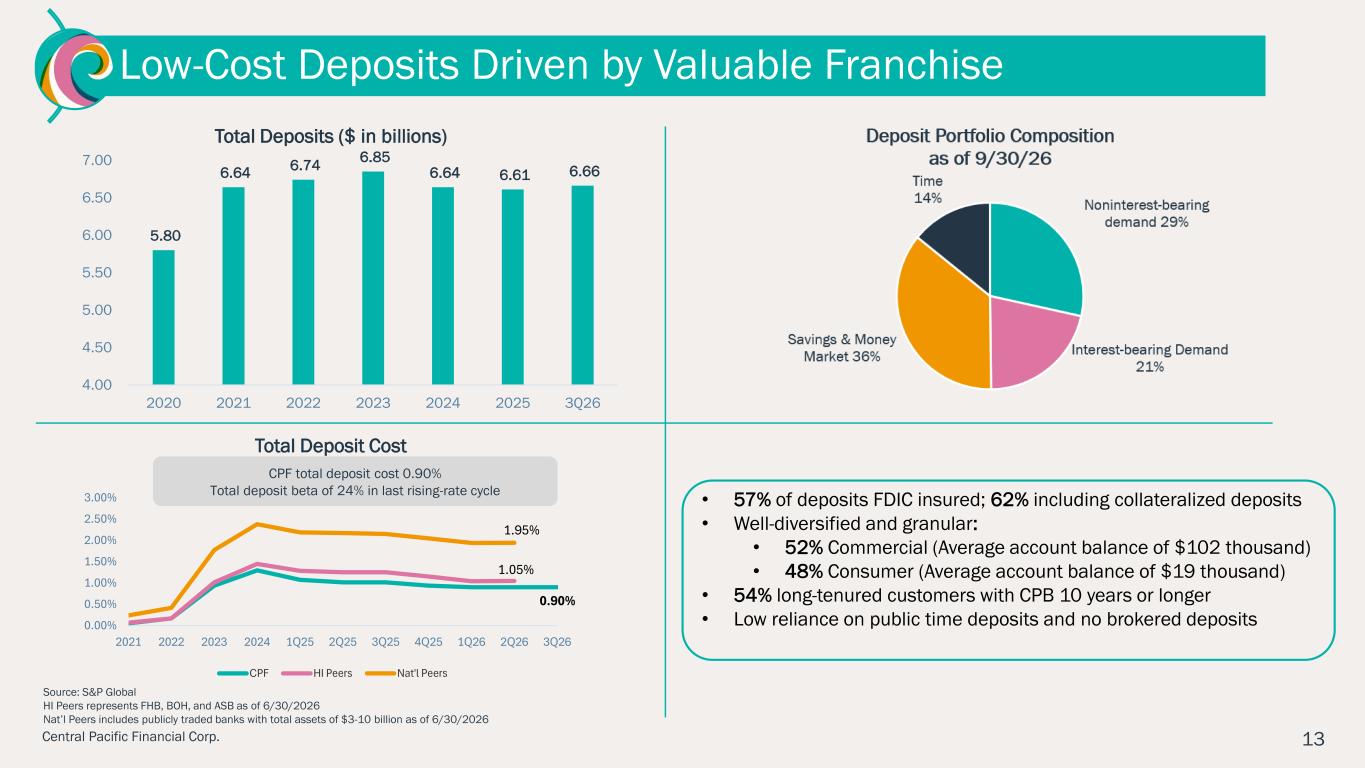
13Central Pacific Financial Corp. 0.90% 1.05% 1.95% 0.00% 0.50% 1.00% 1.50% 2.00% 2.50% 3.00% 2021 2022 2023 2024 1Q25 2Q25 3Q25 4Q25 1Q26 2Q26 3Q26 Total Deposit Cost CPF HI Peers Nat'l Peers CPF total deposit cost 0.90% Total deposit beta of 24% in last rising-rate cycle Low-Cost Deposits Driven by Valuable Franchise • 57% of deposits FDIC insured; 62% including collateralized deposits • Well-diversified and granular: • 52% Commercial (Average account balance of $102 thousand) • 48% Consumer (Average account balance of $19 thousand) • 54% long-tenured customers with CPB 10 years or longer • Low reliance on public time deposits and no brokered deposits Source: S&P Global HI Peers represents FHB, BOH, and ASB as of 6/30/2026 Nat’l Peers includes publicly traded banks with total assets of $3-10 billion as of 6/30/2026 5.80 6.64 6.74 6.85 6.64 6.61 6.66 4.00 4.50 5.00 5.50 6.00 6.50 7.00 2020 2021 2022 2023 2024 2025 3Q26 Total Deposits ($ in billions)
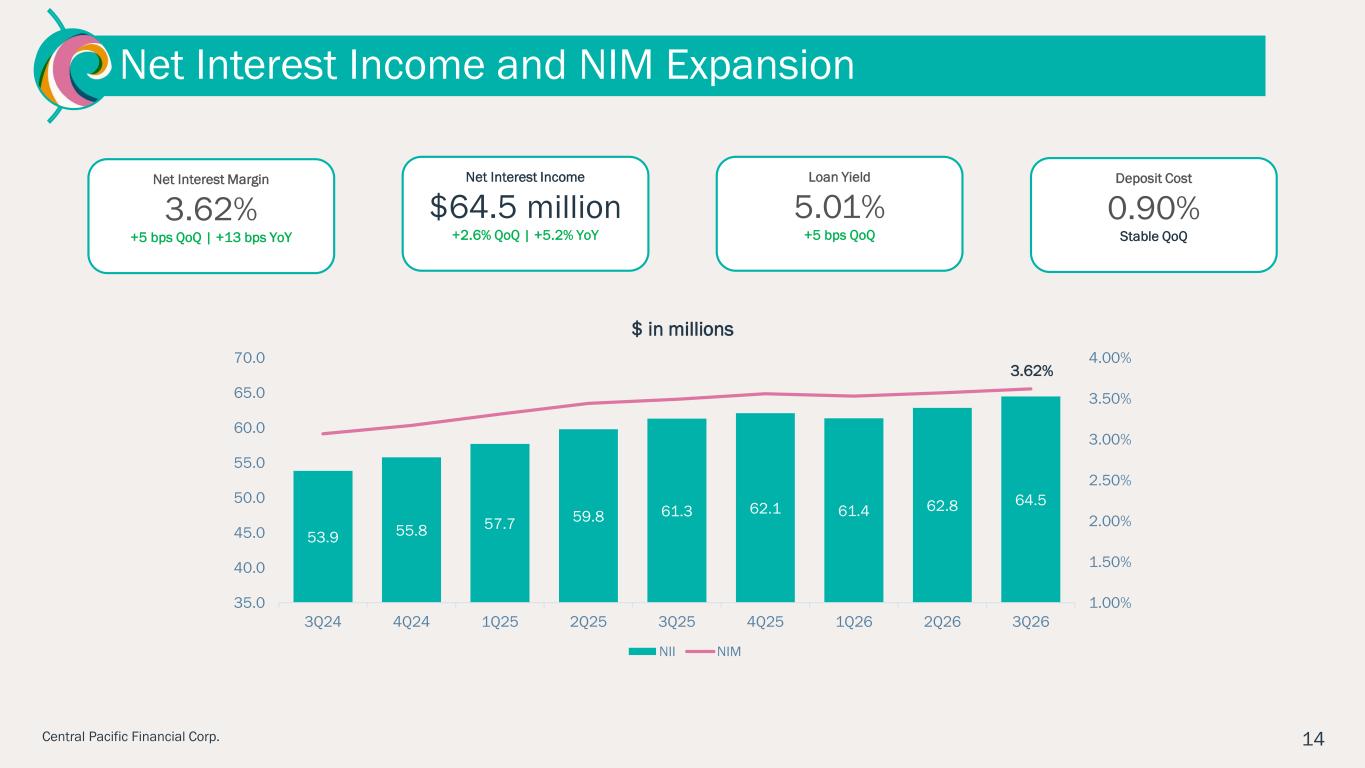
14Central Pacific Financial Corp. Net Interest Income and NIM Expansion 53.9 55.8 57.7 59.8 61.3 62.1 61.4 62.8 64.5 3.62% 1.00% 1.50% 2.00% 2.50% 3.00% 3.50% 4.00% 35.0 40.0 45.0 50.0 55.0 60.0 65.0 70.0 3Q24 4Q24 1Q25 2Q25 3Q25 4Q25 1Q26 2Q26 3Q26 $ in millions NII NIM Net Interest Margin 3.62% +5 bps QoQ | +13 bps YoY Net Interest Income $64.5 million +2.6% QoQ | +5.2% YoY Deposit Cost 0.90% Stable QoQ Loan Yield 5.01% +5 bps QoQ
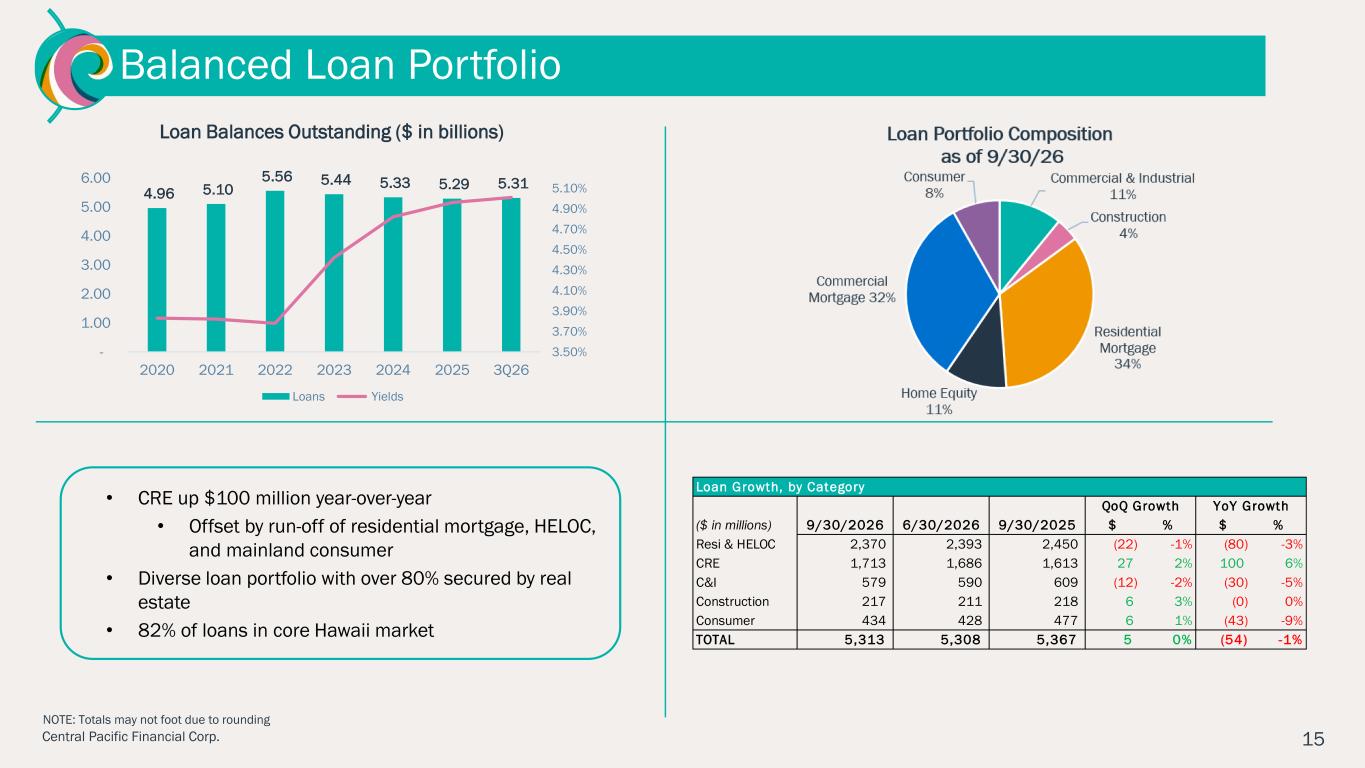
15Central Pacific Financial Corp. Balanced Loan Portfolio NOTE: Totals may not foot due to rounding • CRE up $100 million year-over-year • Offset by run-off of residential mortgage, HELOC, and mainland consumer • Diverse loan portfolio with over 80% secured by real estate • 82% of loans in core Hawaii market 4.96 5.10 5.56 5.44 5.33 5.29 5.31 3.50% 3.70% 3.90% 4.10% 4.30% 4.50% 4.70% 4.90% 5.10% - 1.00 2.00 3.00 4.00 5.00 6.00 2020 2021 2022 2023 2024 2025 3Q26 Loan Balances Outstanding ($ in billions) Loans Yields ($ in millions) 9/30/2026 6/30/2026 9/30/2025 $ % $ % Resi & HELOC 2,370 2,393 2,450 (22) -1% (80) -3% CRE 1,713 1,686 1,613 27 2% 100 6% C&I 579 590 609 (12) -2% (30) -5% Construction 217 211 218 6 3% (0) 0% Consumer 434 428 477 6 1% (43) -9% TOTAL 5,313 5,308 5,367 5 0% (54) -1% Loan Growth, by Category QoQ Growth YoY Growth
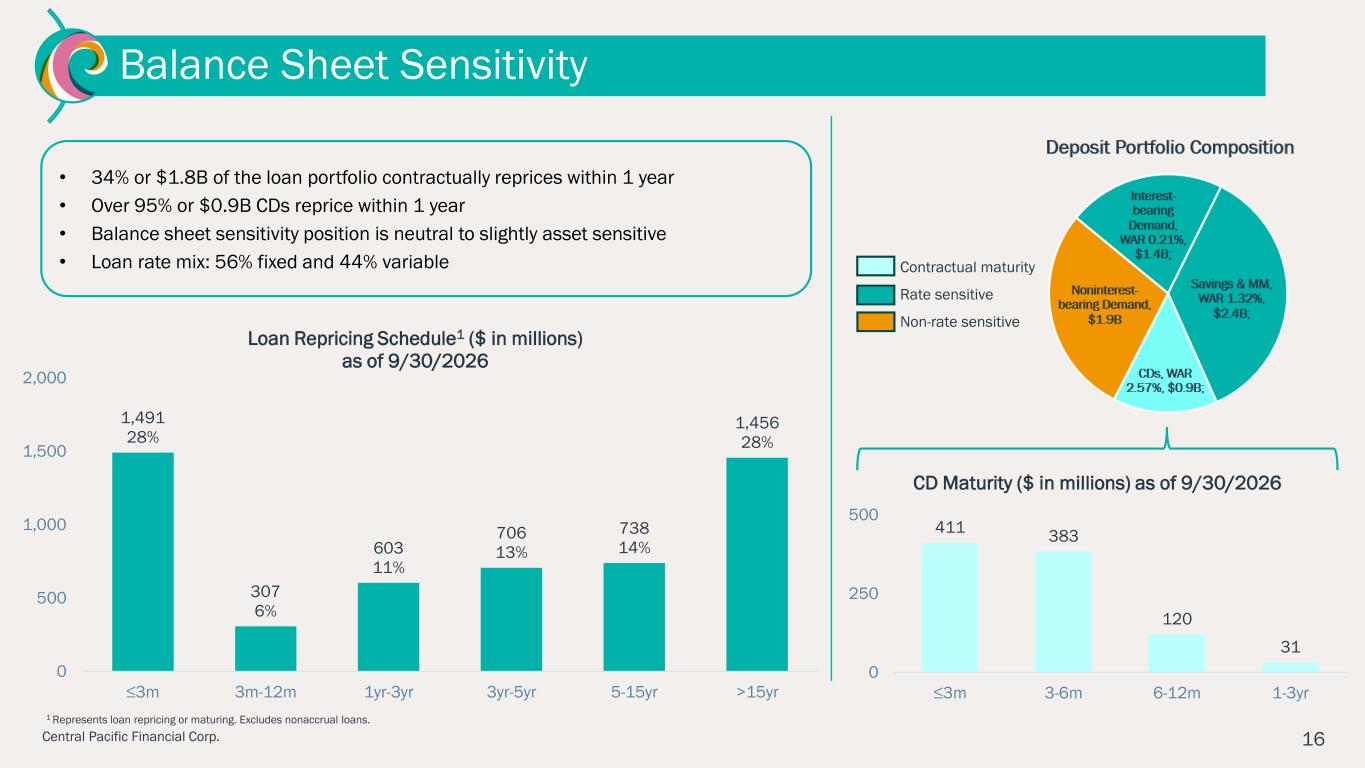
16Central Pacific Financial Corp. Balance Sheet Sensitivity 411 383 120 31 0 250 500 ≤3m 3-6m 6-12m 1-3yr CD Maturity ($ in millions) as of 9/30/2026 1,491 28% 307 6% 603 11% 706 13% 738 14% 1,456 28% 0 500 1,000 1,500 2,000 ≤3m 3m-12m 1yr-3yr 3yr-5yr 5-15yr >15yr Loan Repricing Schedule1 ($ in millions) as of 9/30/2026 ▪ Contractual maturity ▪ Rate sensitive ▪ Non-rate sensitive 1 Represents loan repricing or maturing. Excludes nonaccrual loans. • 34% or $1.8B of the loan portfolio contractually reprices within 1 year • Over 95% or $0.9B CDs reprice within 1 year • Balance sheet sensitivity position is neutral to slightly asset sensitive • Loan rate mix: 56% fixed and 44% variable
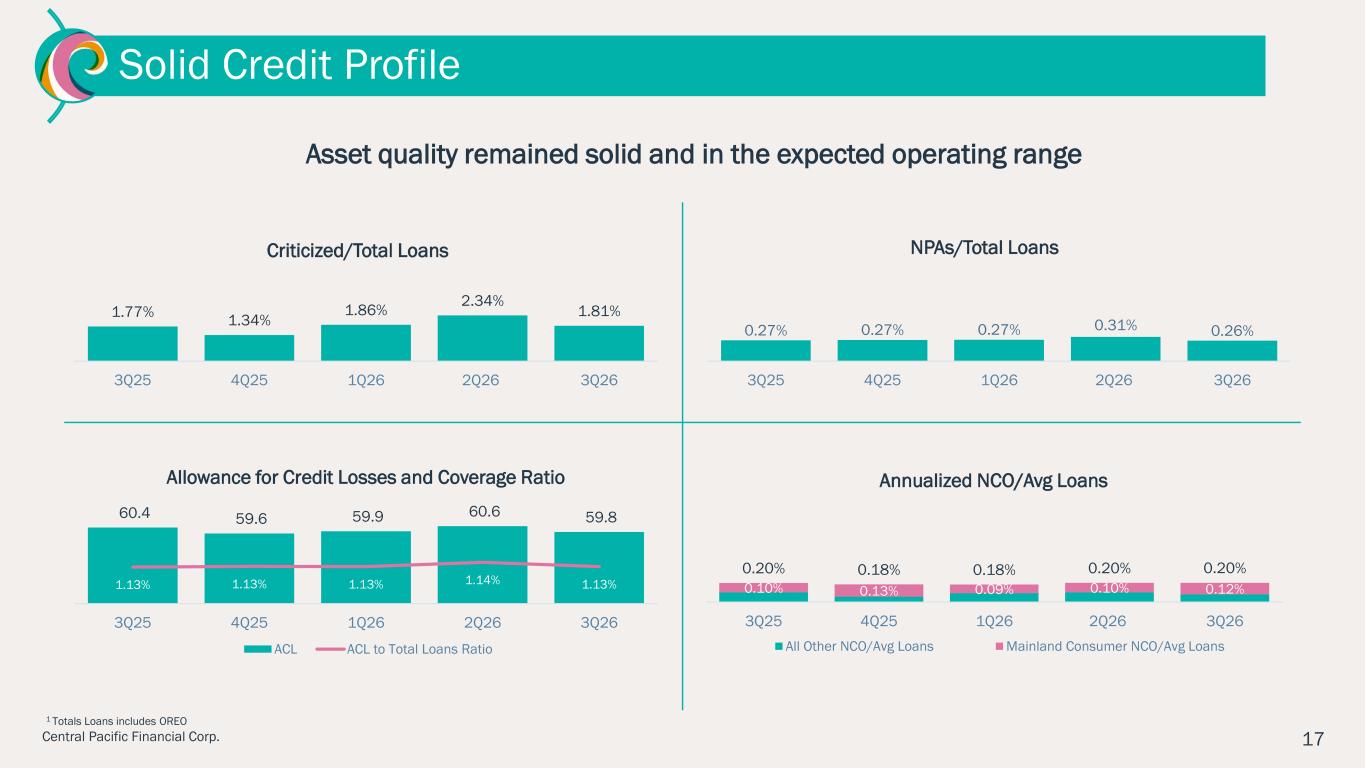
17Central Pacific Financial Corp. 5 Solid Credit Profile Asset quality remained solid and in the expected operating range 1 Totals Loans includes OREO 60.4 59.6 59.9 60.6 59.8 1.13% 1.13% 1.13% 1.14% 1.13% 3Q25 4Q25 1Q26 2Q26 3Q26 Allowance for Credit Losses and Coverage Ratio ACL ACL to Total Loans Ratio 1.77% 1.34% 1.86% 2.34% 1.81% 3Q25 4Q25 1Q26 2Q26 3Q26 Criticized/Total Loans 0.27% 0.27% 0.27% 0.31% 0.26% 3Q25 4Q25 1Q26 2Q26 3Q26 NPAs/Total Loans 0.10% 0.13% 0.09% 0.10% 0.12% 0.20% 0.18% 0.18% 0.20% 0.20% 3Q25 4Q25 1Q26 2Q26 3Q26 Annualized NCO/Avg Loans All Other NCO/Avg Loans Mainland Consumer NCO/Avg Loans
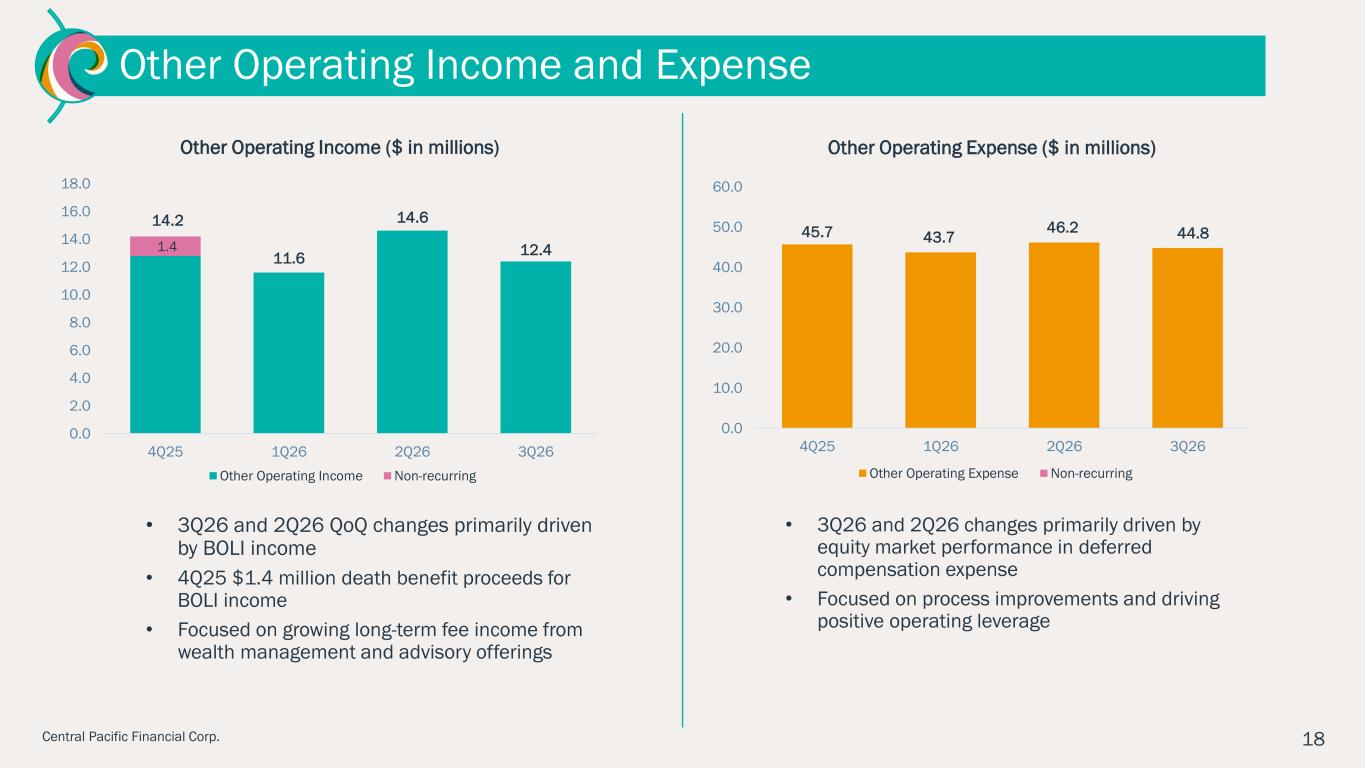
18Central Pacific Financial Corp. 11.6 14.6 12.41.4 0.0 2.0 4.0 6.0 8.0 10.0 12.0 14.0 16.0 18.0 4Q25 1Q26 2Q26 3Q26 Other Operating Income ($ in millions) Other Operating Income Non-recurring • 3Q26 and 2Q26 QoQ changes primarily driven by BOLI income • 4Q25 $1.4 million death benefit proceeds for BOLI income • Focused on growing long-term fee income from wealth management and advisory offerings • 3Q26 and 2Q26 changes primarily driven by equity market performance in deferred compensation expense • Focused on process improvements and driving positive operating leverage Other Operating Income and Expense 14.2 45.7 43.7 46.2 44.8 0.0 10.0 20.0 30.0 40.0 50.0 60.0 4Q25 1Q26 2Q26 3Q26 Other Operating Expense ($ in millions) Other Operating Expense Non-recurring
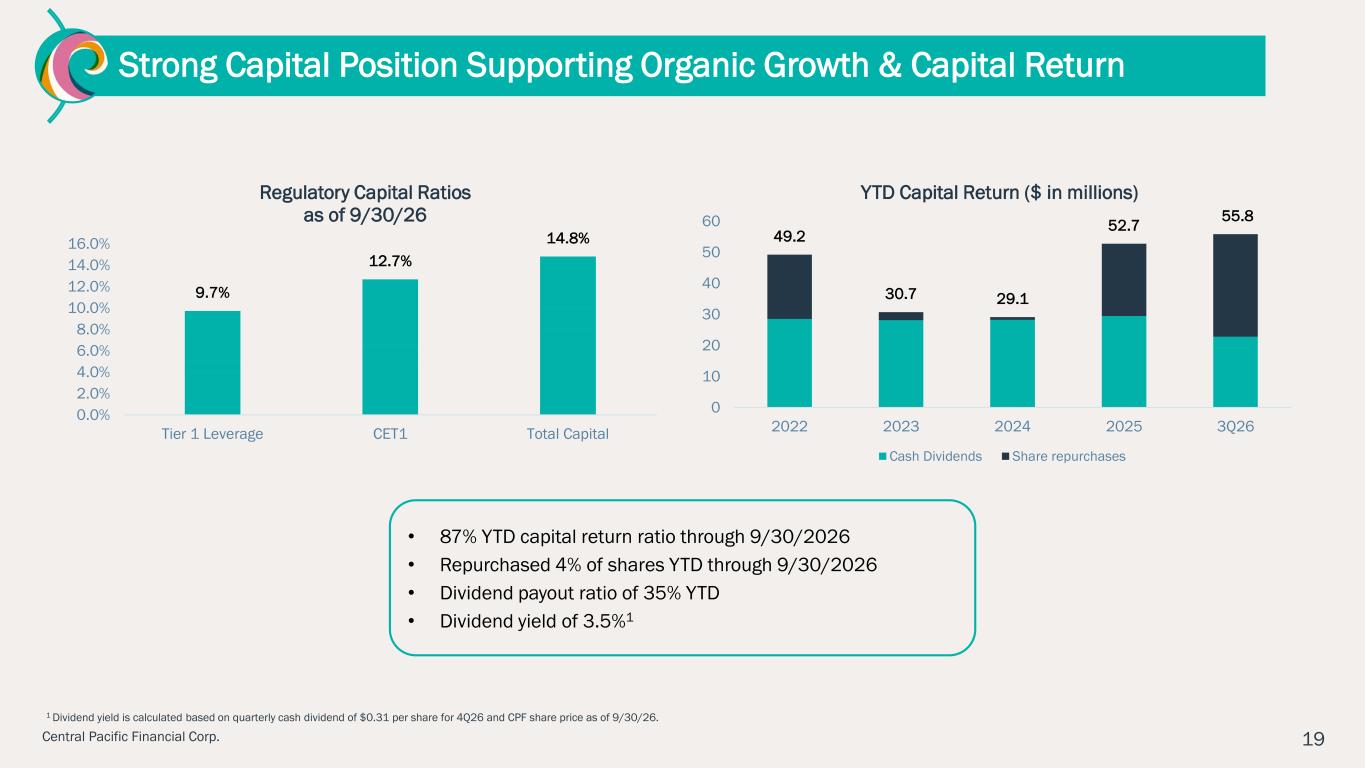
19Central Pacific Financial Corp. Strong Capital Position Supporting Organic Growth & Capital Return 49.2 30.7 29.1 52.7 55.8 0 10 20 30 40 50 60 2022 2023 2024 2025 3Q26 YTD Capital Return ($ in millions) Cash Dividends Share repurchases 9.7% 12.7% 14.8% 0.0% 2.0% 4.0% 6.0% 8.0% 10.0% 12.0% 14.0% 16.0% Tier 1 Leverage CET1 Total Capital Regulatory Capital Ratios as of 9/30/26 • 87% YTD capital return ratio through 9/30/2026 • Repurchased 4% of shares YTD through 9/30/2026 • Dividend payout ratio of 35% YTD • Dividend yield of 3.5%1 1 Dividend yield is calculated based on quarterly cash dividend of $0.31 per share for 4Q26 and CPF share price as of 9/30/26.

Appendix
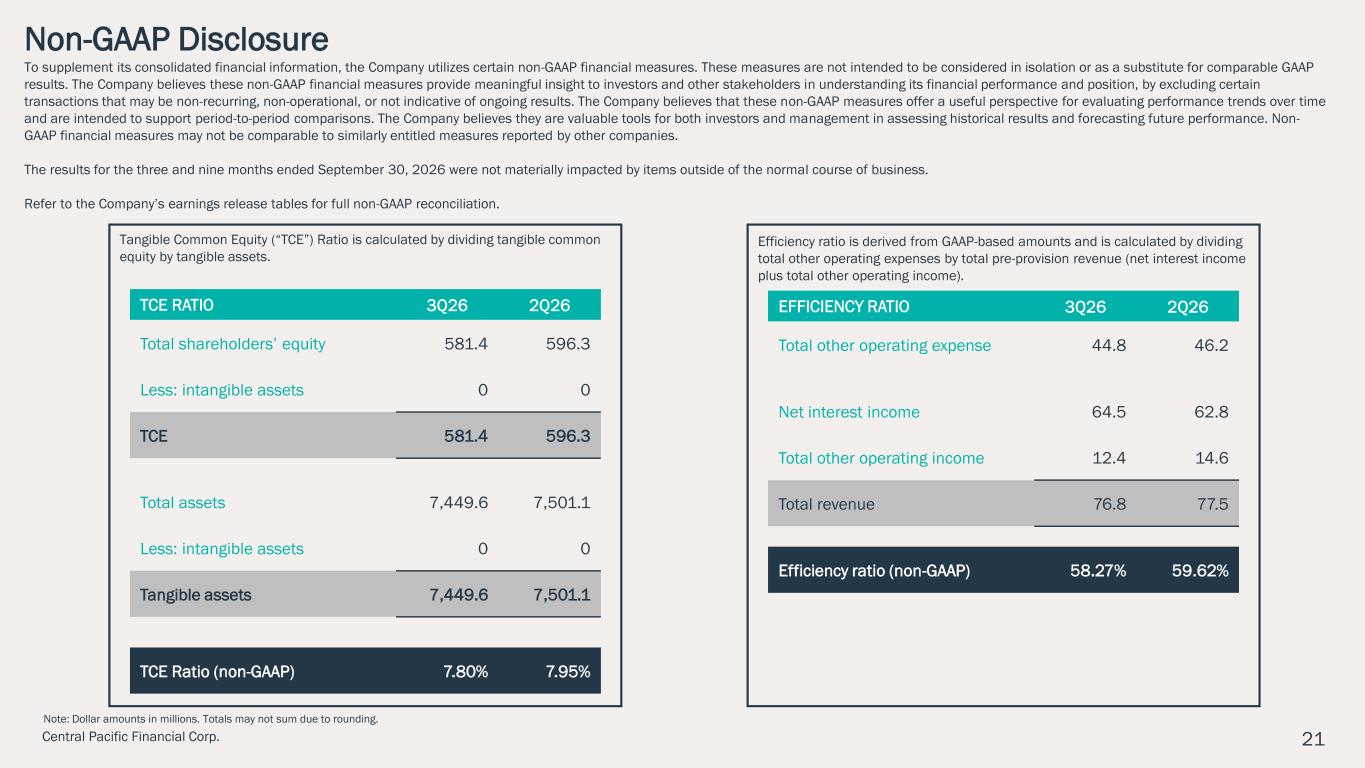
21Central Pacific Financial Corp. Non-GAAP Disclosure To supplement its consolidated financial information, the Company utilizes certain non-GAAP financial measures. These measures are not intended to be considered in isolation or as a substitute for comparable GAAP results. The Company believes these non-GAAP financial measures provide meaningful insight to investors and other stakeholders in understanding its financial performance and position, by excluding certain transactions that may be non-recurring, non-operational, or not indicative of ongoing results. The Company believes that these non-GAAP measures offer a useful perspective for evaluating performance trends over time and are intended to support period-to-period comparisons. The Company believes they are valuable tools for both investors and management in assessing historical results and forecasting future performance. Non- GAAP financial measures may not be comparable to similarly entitled measures reported by other companies. The results for the three and nine months ended September 30, 2026 were not materially impacted by items outside of the normal course of business. Refer to the Company’s earnings release tables for full non-GAAP reconciliation. EFFICIENCY RATIO 3Q26 2Q26 Total other operating expense 44.8 46.2 Net interest income 64.5 62.8 Total other operating income 12.4 14.6 Total revenue 76.8 77.5 Efficiency ratio (non-GAAP) 58.27% 59.62% TCE RATIO 3Q26 2Q26 Total shareholders’ equity 581.4 596.3 Less: intangible assets 0 0 TCE 581.4 596.3 Total assets 7,449.6 7,501.1 Less: intangible assets 0 0 Tangible assets 7,449.6 7,501.1 TCE Ratio (non-GAAP) 7.80% 7.95% Efficiency ratio is derived from GAAP-based amounts and is calculated by dividing total other operating expenses by total pre-provision revenue (net interest income plus total other operating income). Tangible Common Equity (“TCE”) Ratio is calculated by dividing tangible common equity by tangible assets. Note: Dollar amounts in millions. Totals may not sum due to rounding.
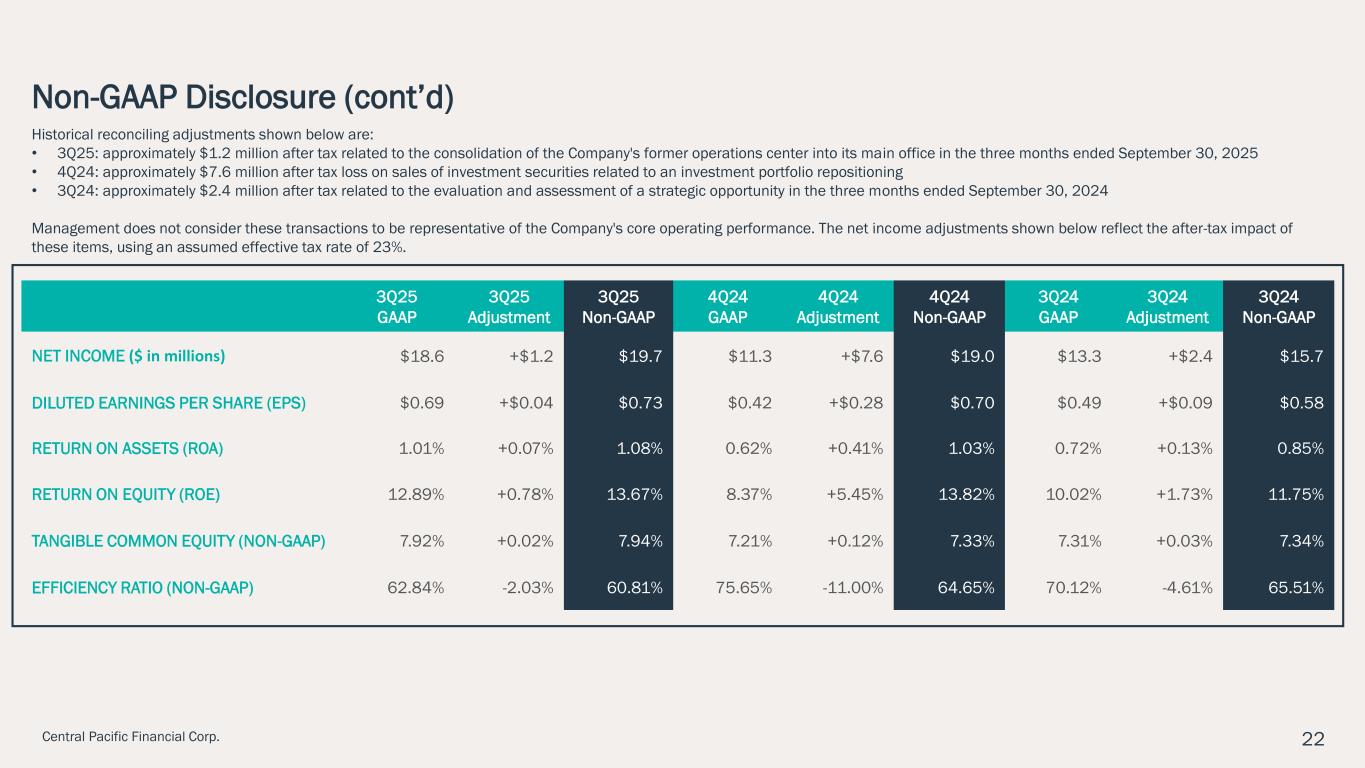
22Central Pacific Financial Corp. Non-GAAP Disclosure (cont’d) Historical reconciling adjustments shown below are: • 3Q25: approximately $1.2 million after tax related to the consolidation of the Company's former operations center into its main office in the three months ended September 30, 2025 • 4Q24: approximately $7.6 million after tax loss on sales of investment securities related to an investment portfolio repositioning • 3Q24: approximately $2.4 million after tax related to the evaluation and assessment of a strategic opportunity in the three months ended September 30, 2024 Management does not consider these transactions to be representative of the Company's core operating performance. The net income adjustments shown below reflect the after-tax impact of these items, using an assumed effective tax rate of 23%. 3Q25 GAAP 3Q25 Adjustment 3Q25 Non-GAAP 4Q24 GAAP 4Q24 Adjustment 4Q24 Non-GAAP 3Q24 GAAP 3Q24 Adjustment 3Q24 Non-GAAP NET INCOME ($ in millions) $18.6 +$1.2 $19.7 $11.3 +$7.6 $19.0 $13.3 +$2.4 $15.7 DILUTED EARNINGS PER SHARE (EPS) $0.69 +$0.04 $0.73 $0.42 +$0.28 $0.70 $0.49 +$0.09 $0.58 RETURN ON ASSETS (ROA) 1.01% +0.07% 1.08% 0.62% +0.41% 1.03% 0.72% +0.13% 0.85% RETURN ON EQUITY (ROE) 12.89% +0.78% 13.67% 8.37% +5.45% 13.82% 10.02% +1.73% 11.75% TANGIBLE COMMON EQUITY (NON-GAAP) 7.92% +0.02% 7.94% 7.21% +0.12% 7.33% 7.31% +0.03% 7.34% EFFICIENCY RATIO (NON-GAAP) 62.84% -2.03% 60.81% 75.65% -11.00% 64.65% 70.12% -4.61% 65.51%
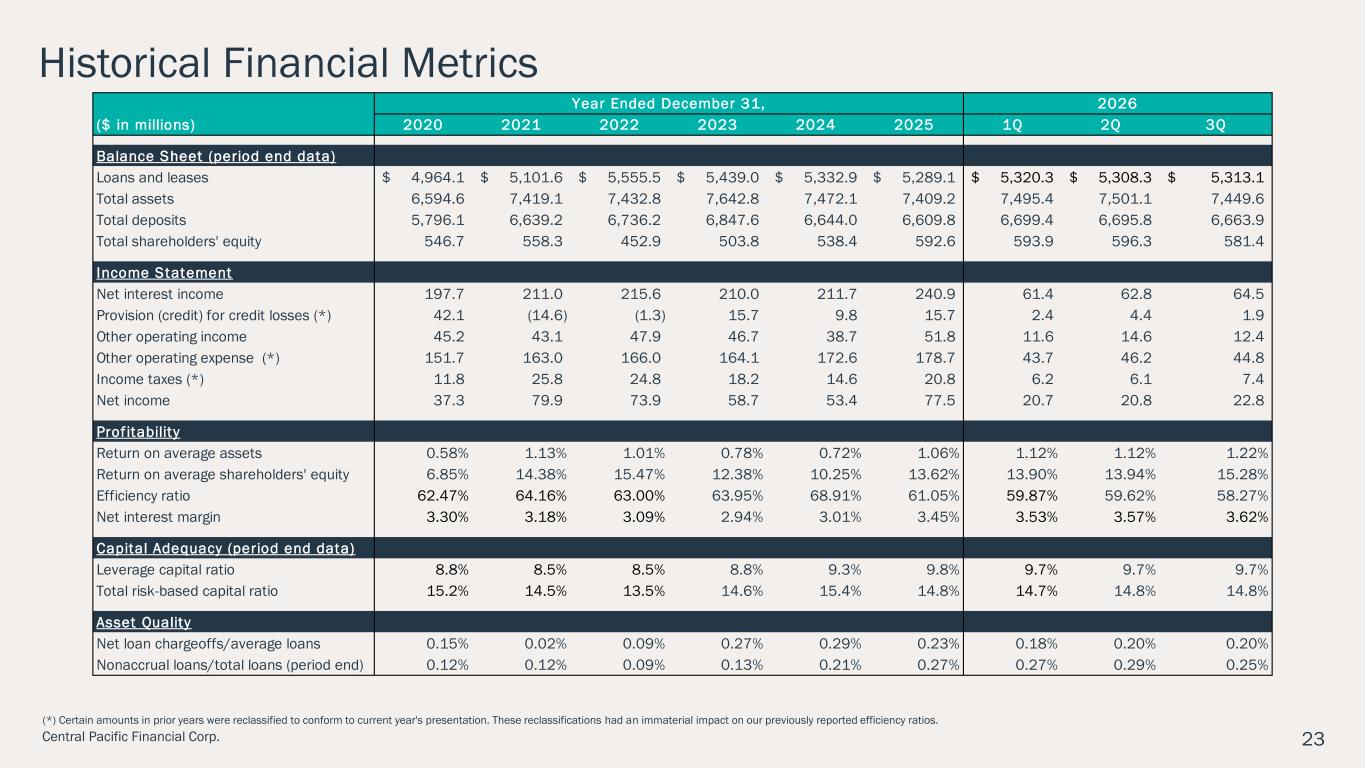
23Central Pacific Financial Corp. (*) Certain amounts in prior years were reclassified to conform to current year's presentation. These reclassifications had an immaterial impact on our previously reported efficiency ratios. Historical Financial Metrics ($ in millions) 2020 2021 2022 2023 2024 2025 1Q 2Q 3Q Balance Sheet (period end data) Loans and leases 4,964.1$ 5,101.6$ 5,555.5$ 5,439.0$ 5,332.9$ 5,289.1$ 5,320.3$ 5,308.3$ 5,313.1$ Total assets 6,594.6 7,419.1 7,432.8 7,642.8 7,472.1 7,409.2 7,495.4 7,501.1 7,449.6 Total deposits 5,796.1 6,639.2 6,736.2 6,847.6 6,644.0 6,609.8 6,699.4 6,695.8 6,663.9 Total shareholders' equity 546.7 558.3 452.9 503.8 538.4 592.6 593.9 596.3 581.4 Income Statement Net interest income 197.7 211.0 215.6 210.0 211.7 240.9 61.4 62.8 64.5 Provision (credit) for credit losses (*) 42.1 (14.6) (1.3) 15.7 9.8 15.7 2.4 4.4 1.9 Other operating income 45.2 43.1 47.9 46.7 38.7 51.8 11.6 14.6 12.4 Other operating expense (*) 151.7 163.0 166.0 164.1 172.6 178.7 43.7 46.2 44.8 Income taxes (*) 11.8 25.8 24.8 18.2 14.6 20.8 6.2 6.1 7.4 Net income 37.3 79.9 73.9 58.7 53.4 77.5 20.7 20.8 22.8 Prof itability Return on average assets 0.58% 1.13% 1.01% 0.78% 0.72% 1.06% 1.12% 1.12% 1.22% Return on average shareholders' equity 6.85% 14.38% 15.47% 12.38% 10.25% 13.62% 13.90% 13.94% 15.28% Efficiency ratio 62.47% 64.16% 63.00% 63.95% 68.91% 61.05% 59.87% 59.62% 58.27% Net interest margin 3.30% 3.18% 3.09% 2.94% 3.01% 3.45% 3.53% 3.57% 3.62% Capital Adequacy (period end data) Leverage capital ratio 8.8% 8.5% 8.5% 8.8% 9.3% 9.8% 9.7% 9.7% 9.7% Total risk-based capital ratio 15.2% 14.5% 13.5% 14.6% 15.4% 14.8% 14.7% 14.8% 14.8% Asset Quality Net loan chargeoffs/average loans 0.15% 0.02% 0.09% 0.27% 0.29% 0.23% 0.18% 0.20% 0.20% Nonaccrual loans/total loans (period end) 0.12% 0.12% 0.09% 0.13% 0.21% 0.27% 0.27% 0.29% 0.25% Year Ended December 31, 2026
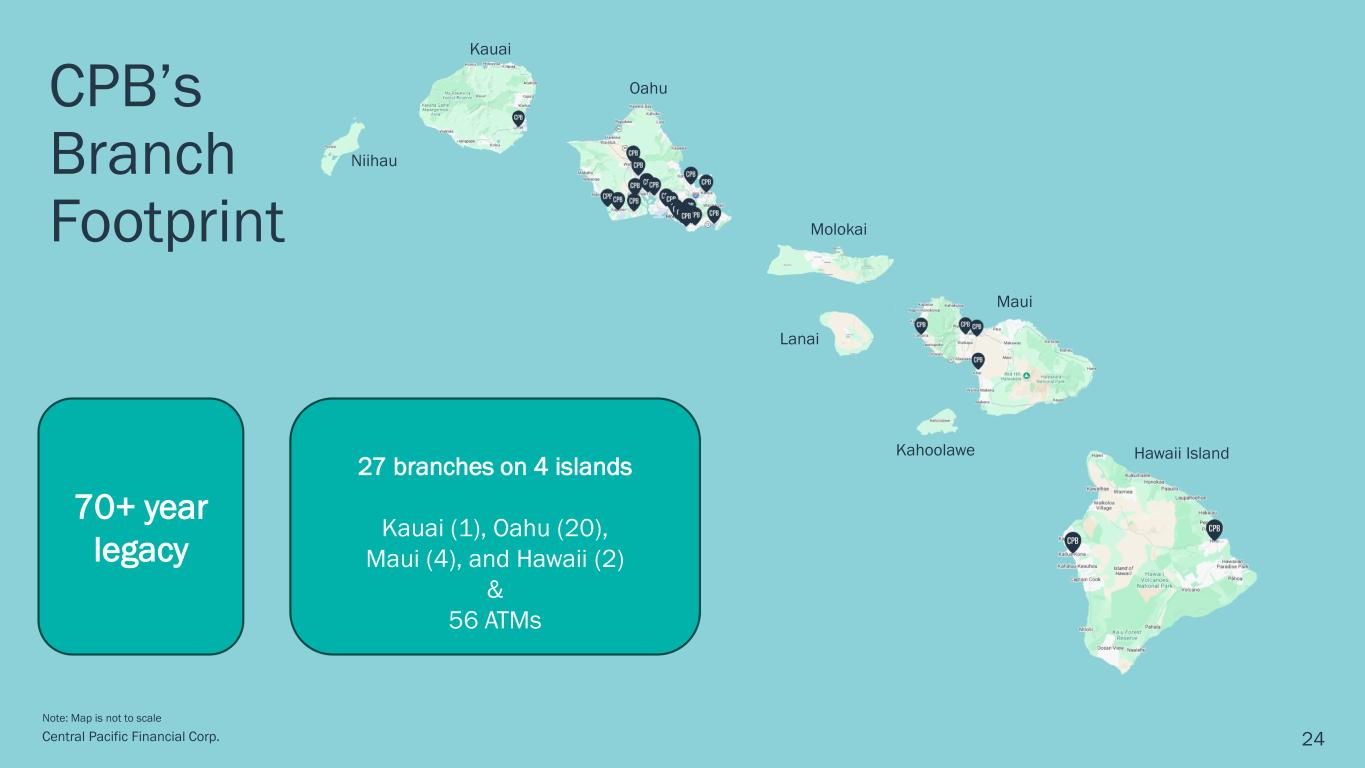
24Central Pacific Financial Corp. CPB’s Branch Footprint 70+ year legacy 27 branches on 4 islands Kauai (1), Oahu (20), Maui (4), and Hawaii (2) & 56 ATMs Kauai Oahu Molokai Maui Hawaii Island Niihau Kahoolawe Lanai Note: Map is not to scale
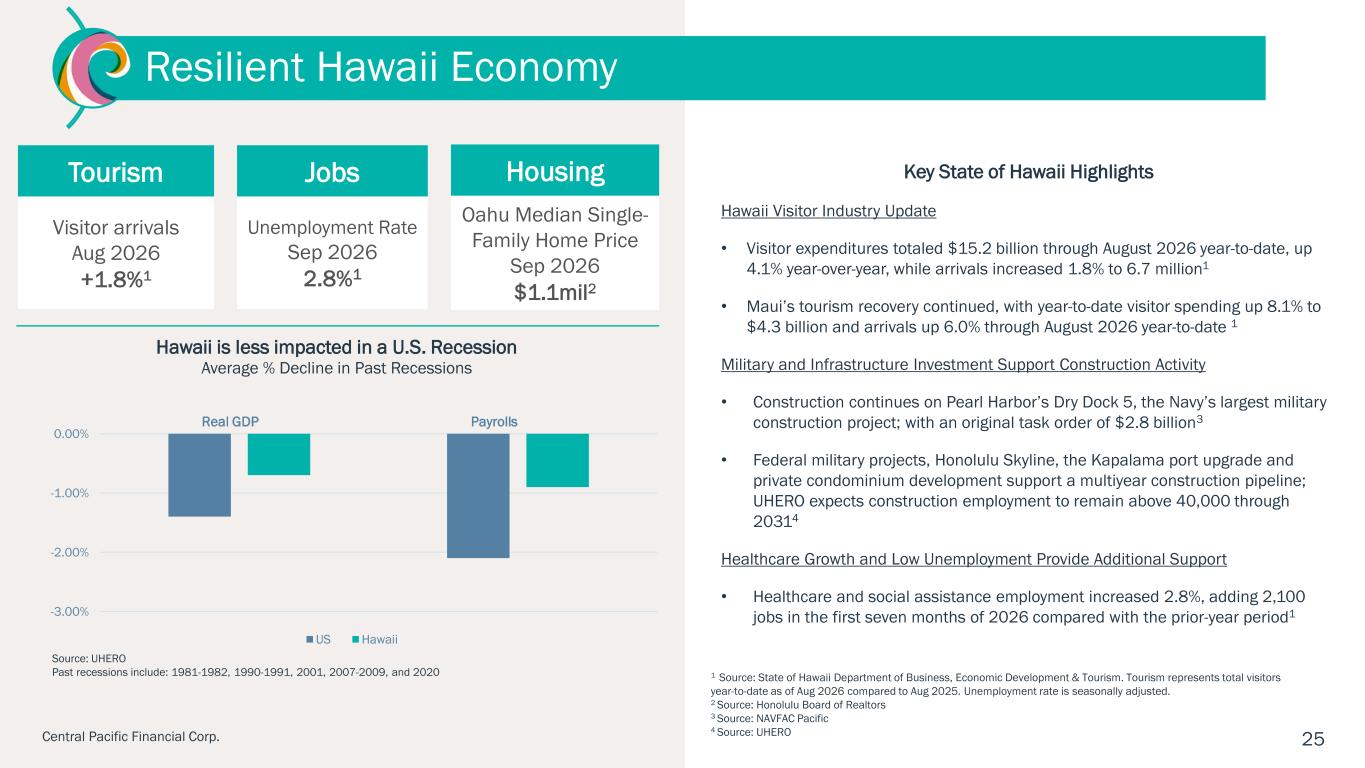
252Central Pacific Financial Corp. Tourism Visitor arrivals Aug 2026 +1.8%1 Jobs Unemployment Rate Sep 2026 2.8%1 Key State of Hawaii Highlights Hawaii Visitor Industry Update • Visitor expenditures totaled $15.2 billion through August 2026 year-to-date, up 4.1% year-over-year, while arrivals increased 1.8% to 6.7 million1 • Maui’s tourism recovery continued, with year-to-date visitor spending up 8.1% to $4.3 billion and arrivals up 6.0% through August 2026 year-to-date 1 Military and Infrastructure Investment Support Construction Activity • Construction continues on Pearl Harbor’s Dry Dock 5, the Navy’s largest military construction project; with an original task order of $2.8 billion3 • Federal military projects, Honolulu Skyline, the Kapalama port upgrade and private condominium development support a multiyear construction pipeline; UHERO expects construction employment to remain above 40,000 through 20314 Healthcare Growth and Low Unemployment Provide Additional Support • Healthcare and social assistance employment increased 2.8%, adding 2,100 jobs in the first seven months of 2026 compared with the prior-year period1 1 Source: State of Hawaii Department of Business, Economic Development & Tourism. Tourism represents total visitors year-to-date as of Aug 2026 compared to Aug 2025. Unemployment rate is seasonally adjusted. 2 Source: Honolulu Board of Realtors 3 Source: NAVFAC Pacific 4 Source: UHERO Resilient Hawaii Economy Housing Oahu Median Single- Family Home Price Sep 2026 $1.1mil2 -3.00% -2.00% -1.00% 0.00% Hawaii is less impacted in a U.S. Recession Average % Decline in Past Recessions US Hawaii Real GDP Source: UHERO Past recessions include: 1981-1982, 1990-1991, 2001, 2007-2009, and 2020 Payrolls
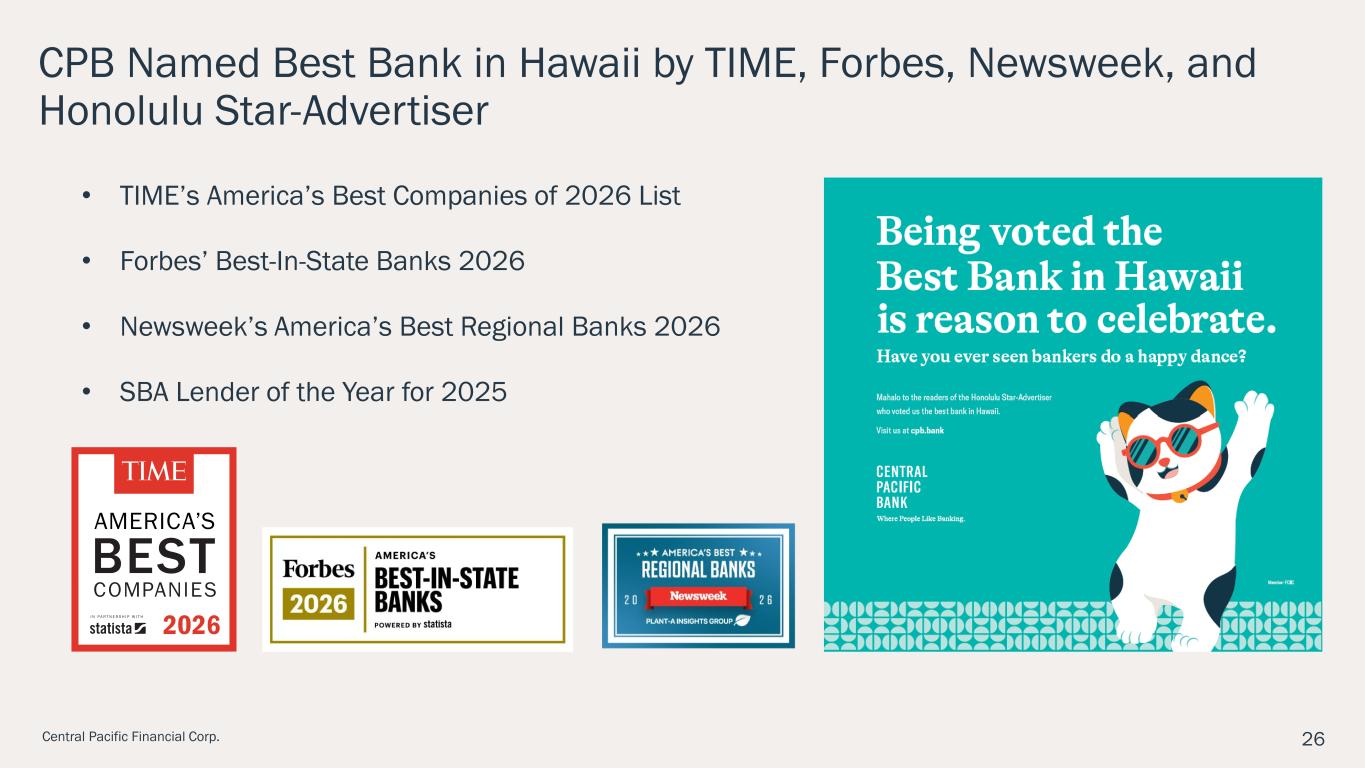
26Central Pacific Financial Corp. CPB Named Best Bank in Hawaii by TIME, Forbes, Newsweek, and Honolulu Star-Advertiser • TIME’s America’s Best Companies of 2026 List • Forbes’ Best-In-State Banks 2026 • Newsweek’s America’s Best Regional Banks 2026 • SBA Lender of the Year for 2025

Mahalo