Value of Initial Fixed $100 | ||||||||||
Fiscal Year | Summary Compensation | Summary Compensation | Compensation | Compensation | Average Summary | Average Compensation | Total | Peer Group | Net Income | Economic Profit |
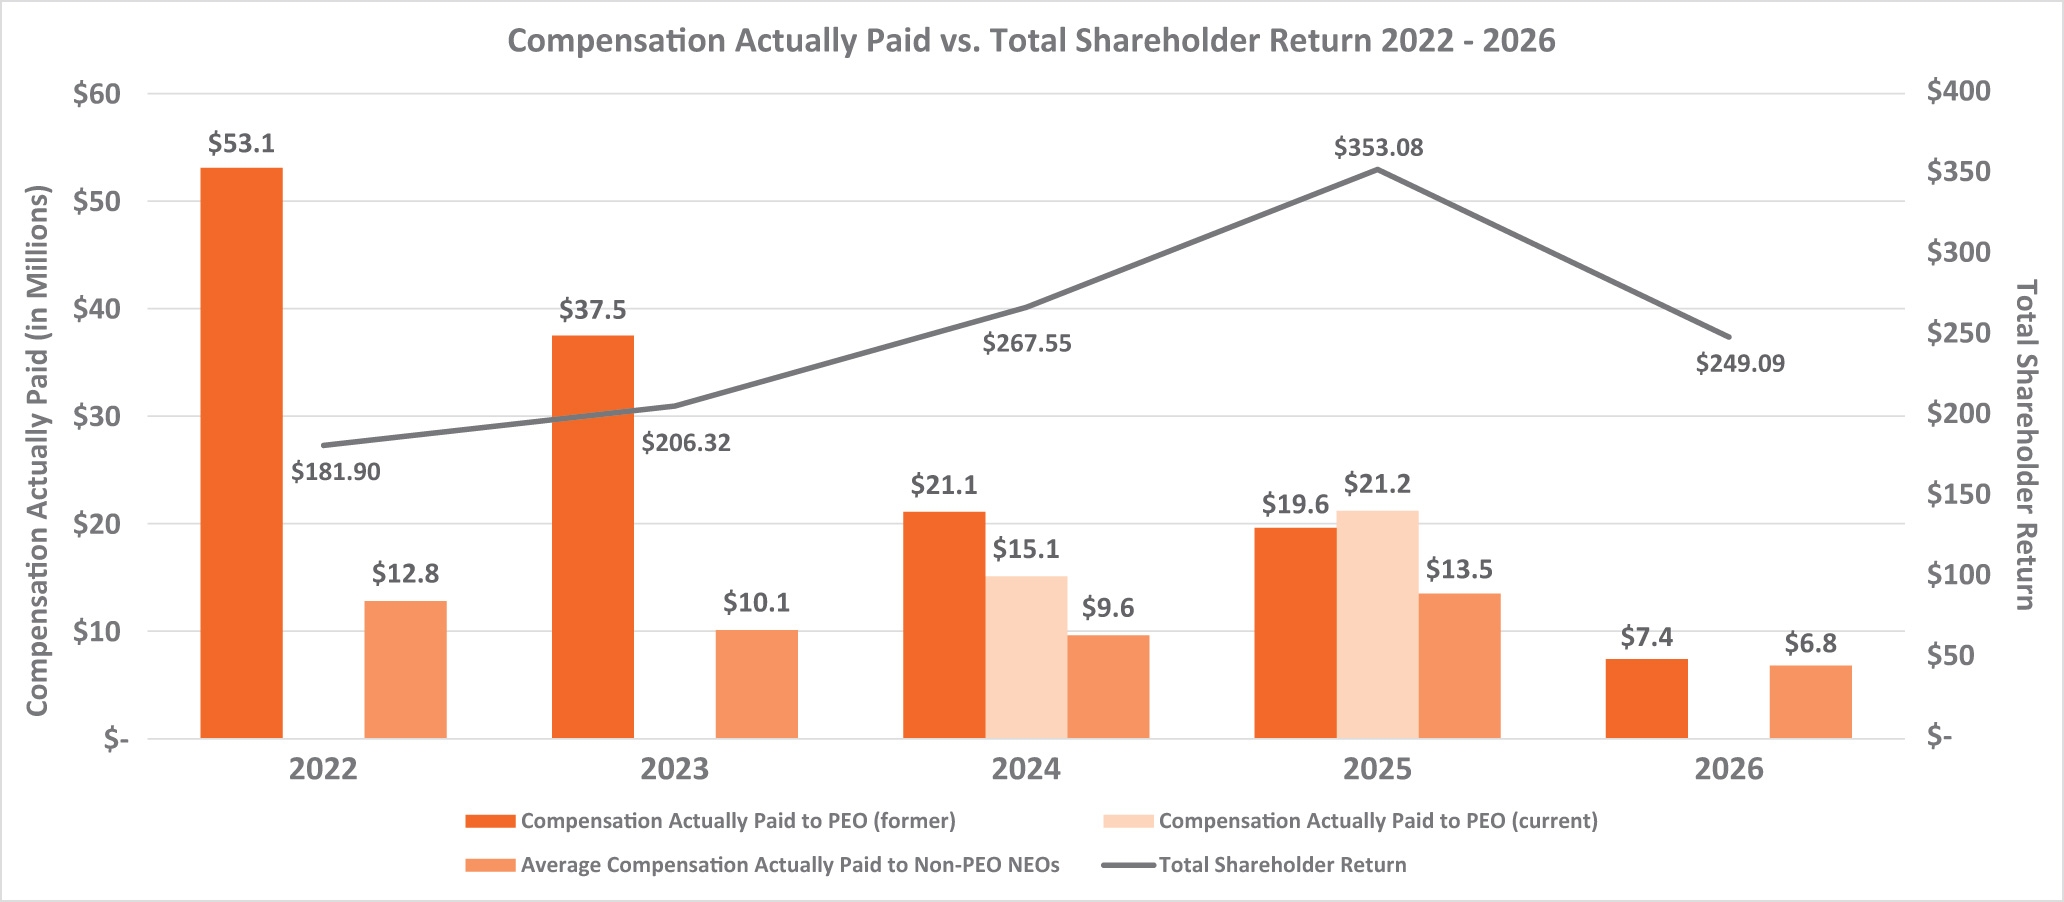
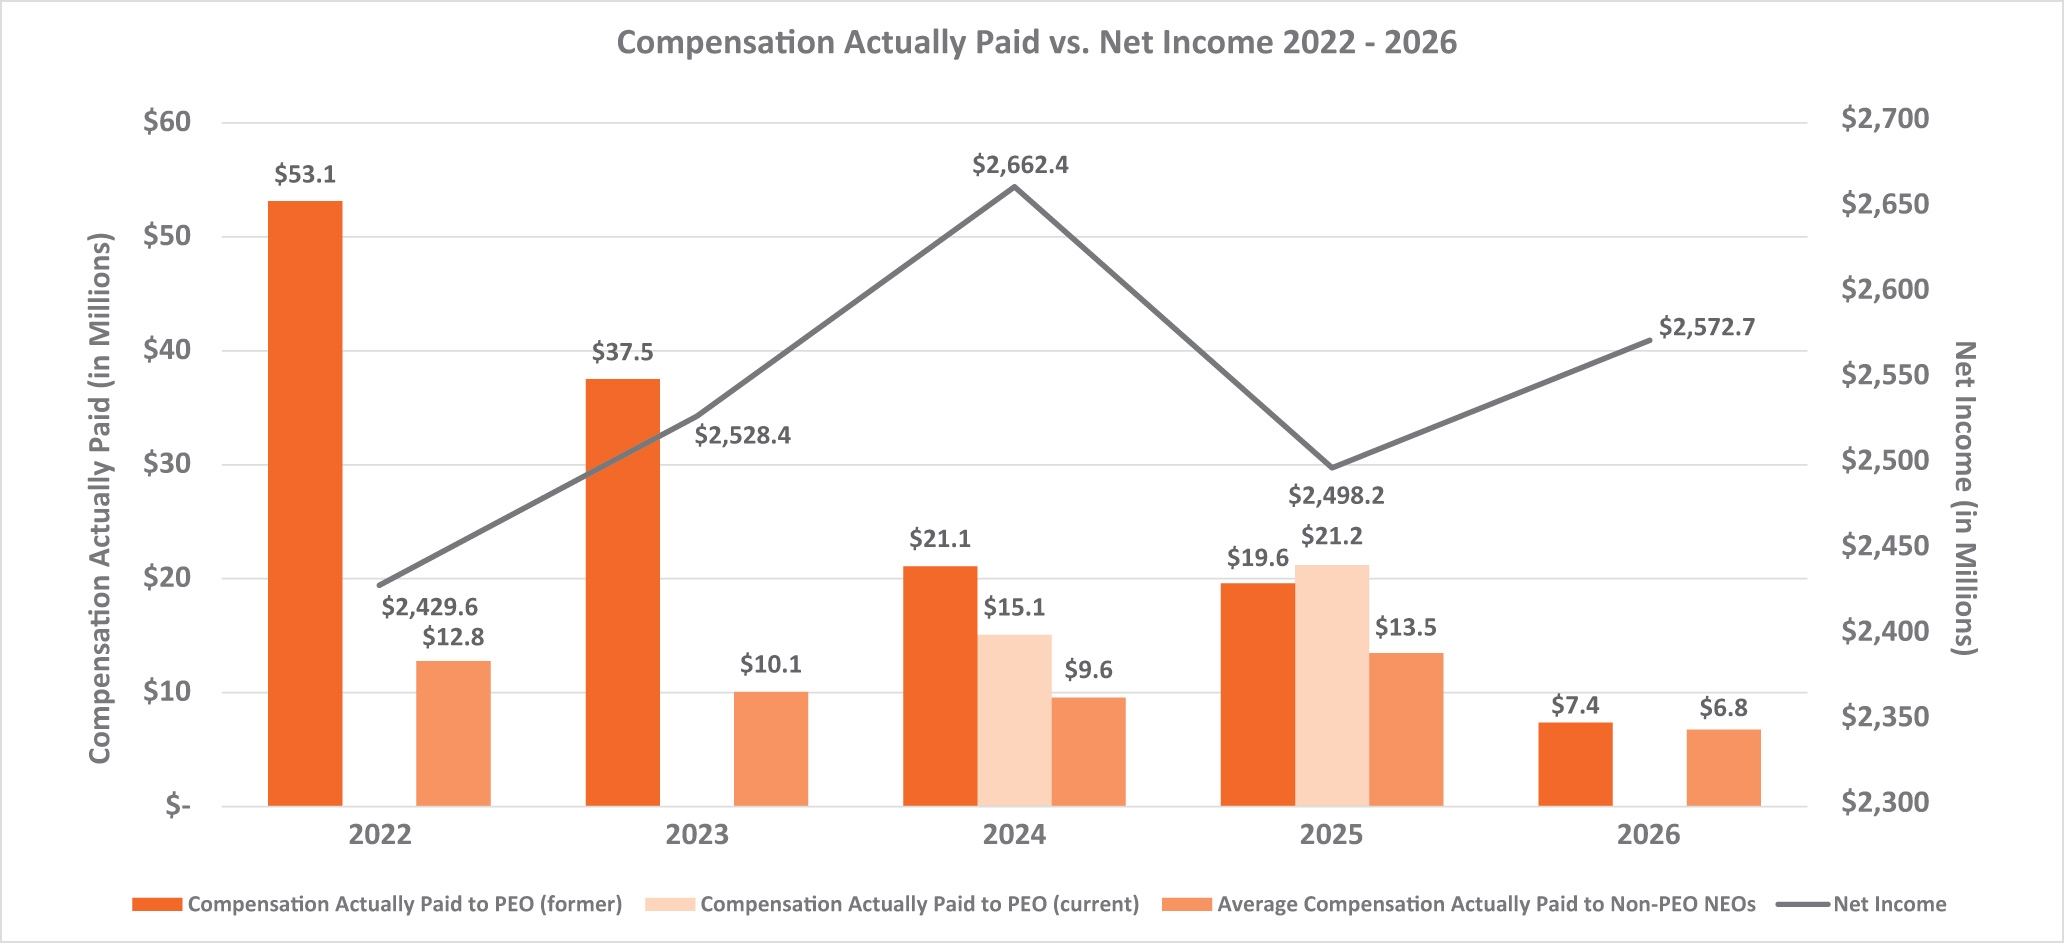
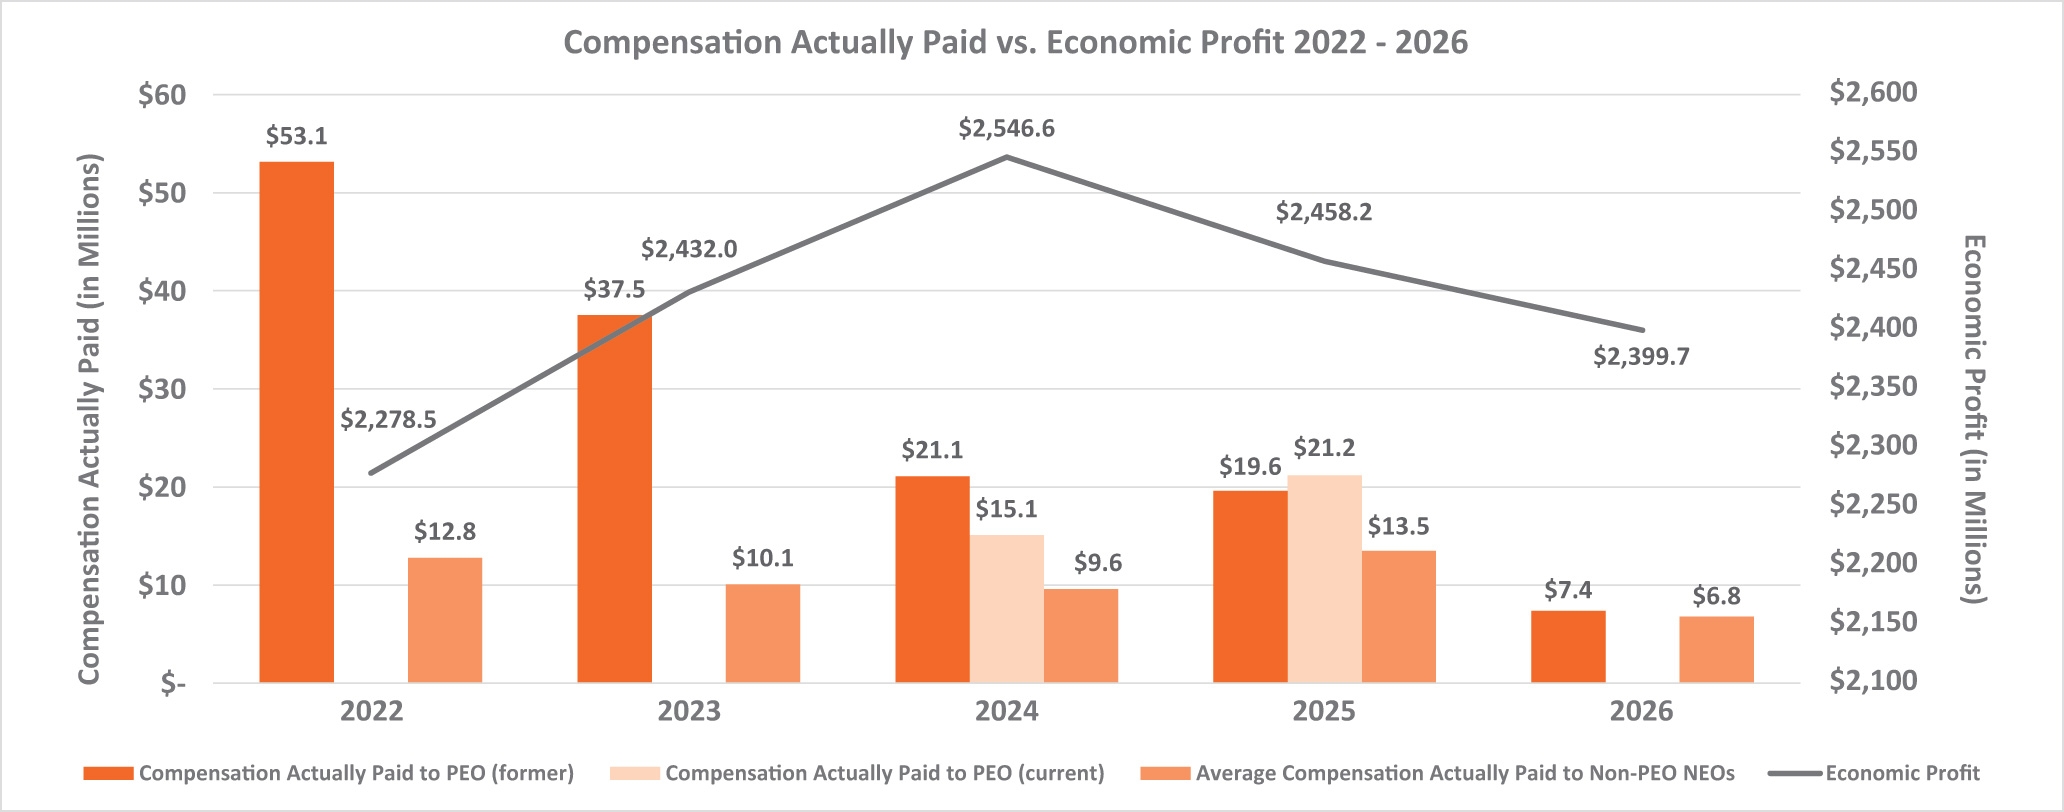
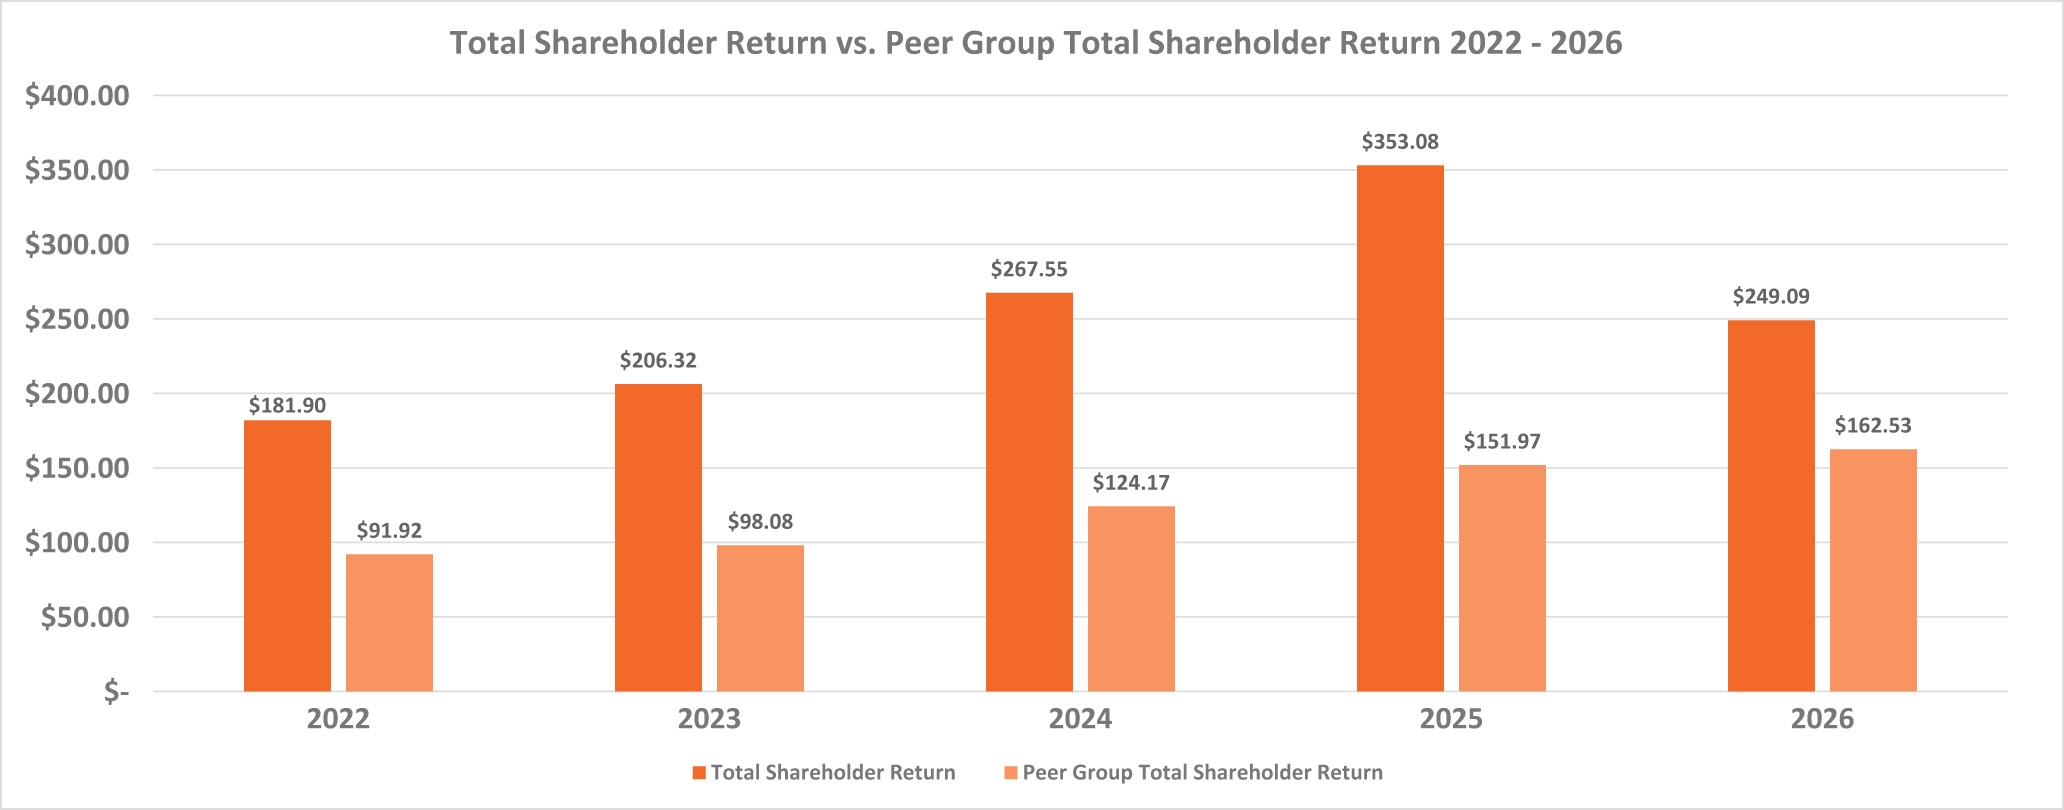
2026 | $ 11,236,964 | $ 7,473,423 | $ 7,778,912 | $ 6,908,759 | $249.09 | $162.53 | $2,572.7 | $2,399.7 | ||
2025 | 9,636,414 | 21,265,131 | 6,009,622 | 13,589,166 | 353.08 | 151.97 | 2,498.2 | 2,458.2 | ||
2024 | 9,198,465 | 6,046,598 | 15,071,027 | 21,056,588 | 6,209,177 | 9,568,493 | 267.55 | 124.17 | 2,662.4 | 2,546.6 |
2023 | 18,796,822 | 37,562,328 | 5,404,080 | 10,077,359 | 206.32 | 98.08 | 2,528.4 | 2,432.0 | ||
2022 | 14,330,010 | 53,183,213 | 4,403,231 | 12,895,019 | 181.90 | 91.92 | 2,429.6 | 2,278.5 | ||
| (1) | Reconciliation of amounts shown in Summary Compensation Table to CAP to PEO. |
Current CEO- Philip B. Daniele, III | ||||||||||||||||||||||||
Fiscal Year | | Summary Compensation | Value of Stock | Year-End Value | Change in Fair Value of Prior | Change in Fair | Prior Year Fair | | Total | CAP | ||||||||||||||
2026 | $ | 11,236,964 | $ | (8,294,592) | $ | 3,288,837 | $ | (1,691,530) | $ | 2,933,745 | $ | $ | (3,763,541) | $ | 7,473,423 | |||||||||
2025 | 9,636,414 | (7,226,543) | 11,436,253 | 7,679,175 | (260,168) | — | 11,628,717 | 21,265,131 | ||||||||||||||||
2024 | 9,198,465 | (7,224,860) | 9,992,595 | 2,989,428 | 115,398 | — | 5,872,562 | 15,071,027 | ||||||||||||||||
Former CEO- William C. Rhodes, III | ||||||||||||||||||||||||
Fiscal Year | | Summary Compensation | Value of Stock | Year-End Value | Change in Fair Value of Prior | Change in Fair | Prior Year Fair | | Total | CAP | ||||||||||||||
2024 | $ | 6,046,598 | $ | (4,917,334) | $ | 6,368,390 | $ | 12,949,232 | $ | 609,702 | $ | — | $ | 15,009,990 | $ | 21,056,588 | ||||||||
2023 | 18,796,822 | (15,966,758) | 24,357,600 | 9,772,375 | 602,289 | — | 18,765,506 | 37,562,328 | ||||||||||||||||
2022 | 14,330,010 | (10,370,249) | 20,198,760 | 26,351,061 | 2,673,630 | — | 38,853,203 | 53,183,213 | ||||||||||||||||
| (2) | Stock options are valued based on the Black-Scholes option pricing model as of the applicable measurement date. Stock options valued on a date other than the grant date are valued using the stock price and updated assumptions (i.e., term, volatility, interest rate) on such measurement date. |
| (3) | The Non-PEO NEOs are comprised of: Messrs. Jackson, Newbern, Gould and Jaycox for fiscal year 2026, Messrs. Jackson, Newbern, Hackney and Jaycox for fiscal year 2025 and 2024, Messrs. Jackson, Newbern, Daniele and Frazer for fiscal years 2023 and 2022. |
| (4) | Reconciliation of amounts shown in Summary Compensation Table to CAP to Non-PEO NEOs |
Fiscal Year | | Summary Compensation | | Value of Stock | | Year-End Value | | Change in Fair Value of Prior | | Change in Fair | | Prior Year Fair | | Total | | CAP | ||||||||
2026 | $ | 7,778,912 | $ | (6,410,736) | $ | 2,042,407 | $ | 175,915 | $ | 3,322,262 | $ | $ | (870,153) | $ | 6,908,759 | |||||||||
2025 | 6,009,622 | (4,685,046) | 7,468,673 | 4,928,928 | (133,011) | — | 7,579,544 | 13,589,166 | ||||||||||||||||
2024 | 6,209,177 | (5,105,044) | 6,522,730 | 1,924,159 | 17,471 | — | 3,359,316 | 9,568,493 | ||||||||||||||||
2023 | 5,404,080 | (4,245,009) | 6,476,196 | 2,317,977 | 124,116 | — | 4,673,280 | 10,077,359 | ||||||||||||||||
2022 | 4,403,231 | (2,886,928) | 5,633,491 | 5,210,600 | 534,626 | — | 8,491,789 | 12,895,019 |
| (5) | Represents the weighted peer group total shareholder return (“TSR”), weighted according to each of the companies’ respective market capitalizations at the beginning of each period for which a return is indicated. The Company's peer group is the S&P Retail Index as reflected in our Annual Report on Form 10-K for fiscal year 2026. |
| (6) | Economic Profit was selected by the Company as the “most important” financial performance measure (that is not otherwise required to be disclosed in the table above) used to link CAP to Company performance for the most recently completed fiscal year, or the Company-Selected Measure. See page 53 of “Compensation Discussion and Analysis” for more information about how Economic Profit is calculated. |
| (3) | The Non-PEO NEOs are comprised of: Messrs. Jackson, Newbern, Gould and Jaycox for fiscal year 2026, Messrs. Jackson, Newbern, Hackney and Jaycox for fiscal year 2025 and 2024, Messrs. Jackson, Newbern, Daniele and Frazer for fiscal years 2023 and 2022. |
| (5) | Represents the weighted peer group total shareholder return (“TSR”), weighted according to each of the companies’ respective market capitalizations at the beginning of each period for which a return is indicated. The Company's peer group is the S&P Retail Index as reflected in our Annual Report on Form 10-K for fiscal year 2026. |
| (1) | Reconciliation of amounts shown in Summary Compensation Table to CAP to PEO. |
Current CEO- Philip B. Daniele, III | ||||||||||||||||||||||||
Fiscal Year | | Summary Compensation | Value of Stock | Year-End Value | Change in Fair Value of Prior | Change in Fair | Prior Year Fair | | Total | CAP | ||||||||||||||
2026 | $ | 11,236,964 | $ | (8,294,592) | $ | 3,288,837 | $ | (1,691,530) | $ | 2,933,745 | $ | $ | (3,763,541) | $ | 7,473,423 | |||||||||
2025 | 9,636,414 | (7,226,543) | 11,436,253 | 7,679,175 | (260,168) | — | 11,628,717 | 21,265,131 | ||||||||||||||||
2024 | 9,198,465 | (7,224,860) | 9,992,595 | 2,989,428 | 115,398 | — | 5,872,562 | 15,071,027 | ||||||||||||||||
Former CEO- William C. Rhodes, III | ||||||||||||||||||||||||
Fiscal Year | | Summary Compensation | Value of Stock | Year-End Value | Change in Fair Value of Prior | Change in Fair | Prior Year Fair | | Total | CAP | ||||||||||||||
2024 | $ | 6,046,598 | $ | (4,917,334) | $ | 6,368,390 | $ | 12,949,232 | $ | 609,702 | $ | — | $ | 15,009,990 | $ | 21,056,588 | ||||||||
2023 | 18,796,822 | (15,966,758) | 24,357,600 | 9,772,375 | 602,289 | — | 18,765,506 | 37,562,328 | ||||||||||||||||
2022 | 14,330,010 | (10,370,249) | 20,198,760 | 26,351,061 | 2,673,630 | — | 38,853,203 | 53,183,213 | ||||||||||||||||
| (4) | Reconciliation of amounts shown in Summary Compensation Table to CAP to Non-PEO NEOs |
Fiscal Year | | Summary Compensation | | Value of Stock | | Year-End Value | | Change in Fair Value of Prior | | Change in Fair | | Prior Year Fair | | Total | | CAP | ||||||||
2026 | $ | 7,778,912 | $ | (6,410,736) | $ | 2,042,407 | $ | 175,915 | $ | 3,322,262 | $ | $ | (870,153) | $ | 6,908,759 | |||||||||
2025 | 6,009,622 | (4,685,046) | 7,468,673 | 4,928,928 | (133,011) | — | 7,579,544 | 13,589,166 | ||||||||||||||||
2024 | 6,209,177 | (5,105,044) | 6,522,730 | 1,924,159 | 17,471 | — | 3,359,316 | 9,568,493 | ||||||||||||||||
2023 | 5,404,080 | (4,245,009) | 6,476,196 | 2,317,977 | 124,116 | — | 4,673,280 | 10,077,359 | ||||||||||||||||
2022 | 4,403,231 | (2,886,928) | 5,633,491 | 5,210,600 | 534,626 | — | 8,491,789 | 12,895,019 |
| (6) | Economic Profit was selected by the Company as the “most important” financial performance measure (that is not otherwise required to be disclosed in the table above) used to link CAP to Company performance for the most recently completed fiscal year, or the Company-Selected Measure. See page 53 of “Compensation Discussion and Analysis” for more information about how Economic Profit is calculated. |