Pay vs Performance Disclosure - USD ($)
Jun. 30, 2026
Jun. 30, 2025
Jun. 30, 2024
| SCT Total for PEO | CAP to PEO | Average SCT Total for Non-PEO Named Executive Officers | Average CAP to Non-PEO Named Executive Officers | Value of Initial Fixed $100 Investment Based on Total Shareholder Return | Net Loss | |
| Year | ($) (1) | ($) (2) | ($) (1) | ($) (3) | ($) (4) | ($) |
| 2026 | 381,034 | 388,942 | 428,150 | 412,300 | 81.73 | (3,629,891) |
| 2025 | 1,106,559 | 1,034,559 | 288,568 | 197,834 | 78.53 | (5,780,246) |
| 2024 | 251,032 | 251,032 | 284,615 | 260,322 | 92.79 | (2,951,377) |
| (1) | Amounts reported in these columns represent total compensation as reported in the Summary Compensation Table for Dr. Forkey, our PEO, and the average of the total compensation as reported in the Summary Compensation Table for our remaining NEOs for the relevant fiscal year, which captures the individuals indicated in the table below for each fiscal year: |
| Year | PEO | Non-PEO NEOs |
| 2026 | Dr. Joseph Forkey | Wayne Coll, Joseph Traut |
| 2025 | Dr. Joseph Forkey | Wayne Coll, Mahesh Lawande |
| 2024 | Dr. Joseph Forkey | Wayne Coll, Mahesh Lawande |
| (2) | Amounts reported in these columns represent compensation actually paid (calculated in accordance with SEC rules) to Dr. Forkey for each year. |
| Adjustments to Determine CAP for PEO | 2026 | 2025 | 2024 |
| Total SCT for PEO | 381,034 | 1,106,559 | 251,032 |
| Deduction for Amounts Reportable under the "Option Awards" Columns in the SCT | – | (742,000) | – |
| Increase for Fair Value of Awards Granted during the year that Remain Unvested as of Year end | 5,272 | 670,000 | – |
| Increase/deduction for Change in Fair Value from Prior Year-end to Vesting of Awards Granted Prior to year that Vested During year | 2,636 | – | – |
| Total Adjustments | 7,908 | (72,000) | – |
| CAP for PEO | 388,942 | 1,034,559 | 251,032 |
| (3) | Amounts reported in these columns represent compensation actually paid (calculated in accordance with SEC rules) and the average of the compensation actually paid to Non-PEO NEOs and reflects the following adjustments from total compensation reported in the Summary Compensation Table: |
| Adjustments to Determine CAP for Non-PEO NEOs | 2026 | 2025 | 2024 |
| Average total SCT for non-PEO NEOs | 428,150 | 288,568 | 284,615 |
| Deduction for Amounts Reportable under the "Option Awards" Columns in the SCT | (122,664) | (166,950) | – |
| Increase for Fair Value of Awards Granted during the year that Remain Unvested as of Year end | 108,900 | 150,750 | – |
| Increase/deduction for Change in Fair Value from Prior Year-end to current Year-end of Awards Granted Prior to year that were Outstanding and Unvested as of Year-end | 824 | (45,217) | (17,489) |
| Increase/deduction for Change in Fair Value from Prior Year-end to Vesting of Awards Granted Prior to year that Vested During year | (2,910) | (29,317) | (4,211) |
| Change in Fair Value of Awards Granted Prior to year that were modified during year | – | – | (2,593) |
| Total Adjustments | (15,850) | (90,734) | (24,293) |
| Average CAP for non-PEO NEOs | 412,300 | 197,834 | 260,322 |
| (4) | Assumes $100 invested on June 30, 2023, at the closing price on the last day of trading of our common stock and immediately prior to commencement of fiscal 2024. |
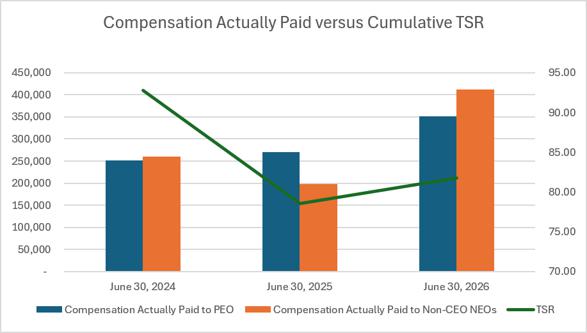
The following chart sets forth the relationship between CAP to our CEO, the average CAP to our Non-CEO NEOs, and the Company’s cumulative TSR over the three most recently completed fiscal years.
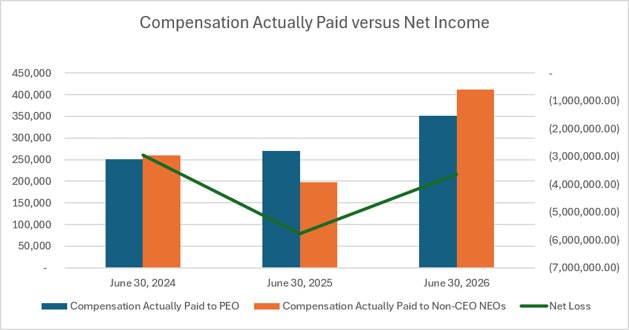
CAP and Company Net Income
The following chart sets forth the relationship between CAP to our CEO, the average CAP to our Non-CEO NEOs, and our net income during the three most recently completed fiscal years.