Shareholder Report
Aug. 31, 2026
USD ($)
$ / shares
This report describes changes to the Fund that occurred during the reporting period.
WHAT WERE THE FUND COSTS FOR THE LAST YEAR? (based on a hypothetical $10,000 investment)
|
Fund Name
|
Costs of a $10,000 investment
|
Costs paid as a percentage of a $10,000 investment*
|
|
Franklin Templeton SMACS: Series CH1
|
$0
|
0.00%
|
HOW DID THE FUND PERFORM LAST YEAR AND WHAT AFFECTED ITS PERFORMANCE?
For the twelve months ended August 31, 2026, Franklin Templeton SMACS: Series CH Fund returned 6.92%. The Fund compares its performance to the Bloomberg Municipal Bond California Exempt Index, which returned 3.85% for the same period.
PERFORMANCE HIGHLIGHTS
|
Top contributors to performance:
|
|
|
↑
|
Security selection within bonds with no external credit rating
|
|
↑
|
Overweight exposure to bonds with 20 years to maturity
|
|
↑
|
Underweight allocation to AA rated bonds
|
|
Top detractors from performance:
|
|
|
↓
|
Overweight allocation to bonds with no external credit rating
|
|
↓
|
Overweight exposure to bonds with 10 years to maturity
|
|
↓
|
Security selection within BB rated bonds
|
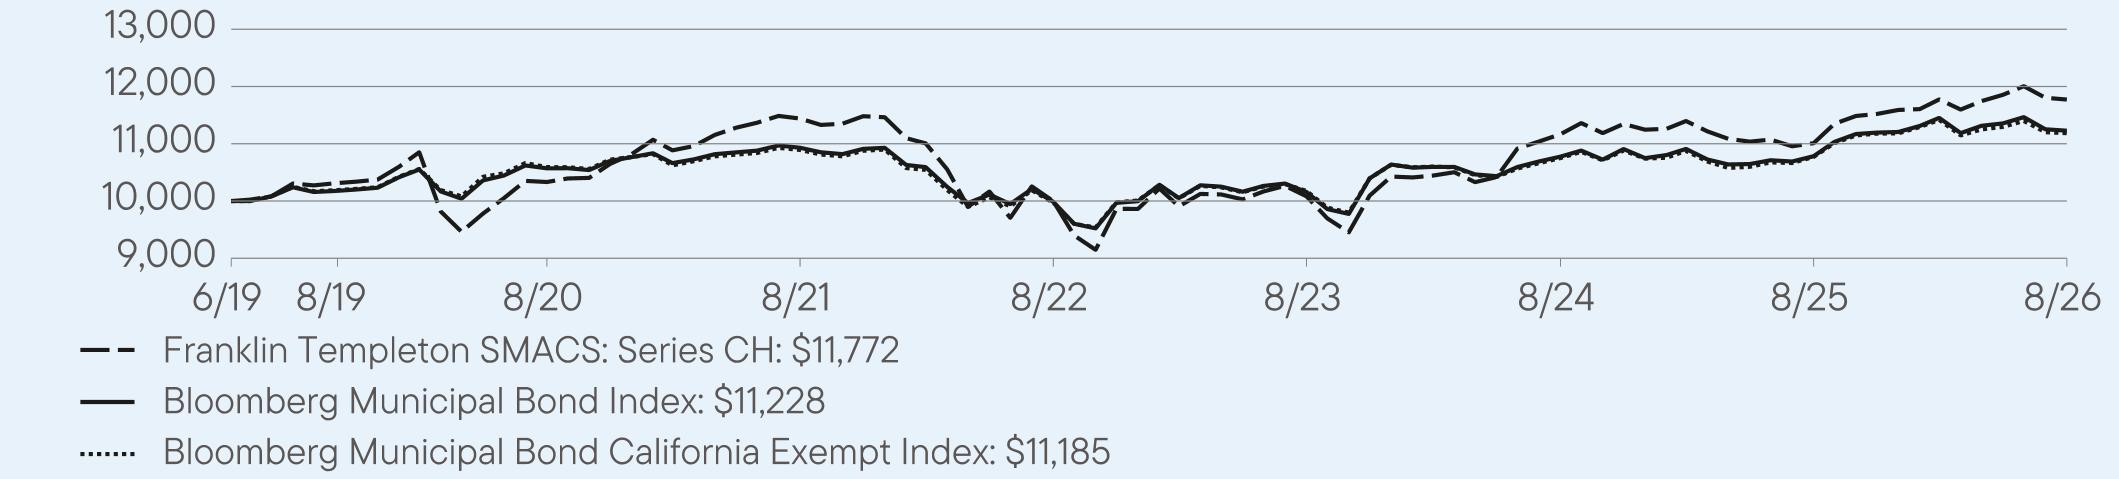
AVERAGE ANNUAL TOTAL RETURNS (%) Period Ended August 31, 2026
|
|
1 Year
|
5 Year
|
Since Inception
(6/3/2019) |
|
Franklin Templeton SMACS: Series CH
|
6.92
|
0.57
|
2.28
|
|
Bloomberg Municipal Bond Index
|
4.12
|
0.54
|
1.65
|
|
Bloomberg Municipal Bond California Exempt Index
|
3.85
|
0.53
|
1.59
|
For current month-end performance, please call Franklin Templeton at (800) DIAL BEN/342-5236 or visit
https://www.franklintempleton.com/investments/options/mutual-funds.
https://www.franklintempleton.com/investments/options/mutual-funds.
Important data provider notices and terms available at www.franklintempletondatasources.com.
KEY FUND STATISTICS (as of August 31, 2026)
|
Total Net Assets
|
$38,588,769
|
|
Total Number of Portfolio Holdings
|
103
|
|
Total Management Fee Paid
|
$0
|
|
Portfolio Turnover Rate
|
12.72%
|
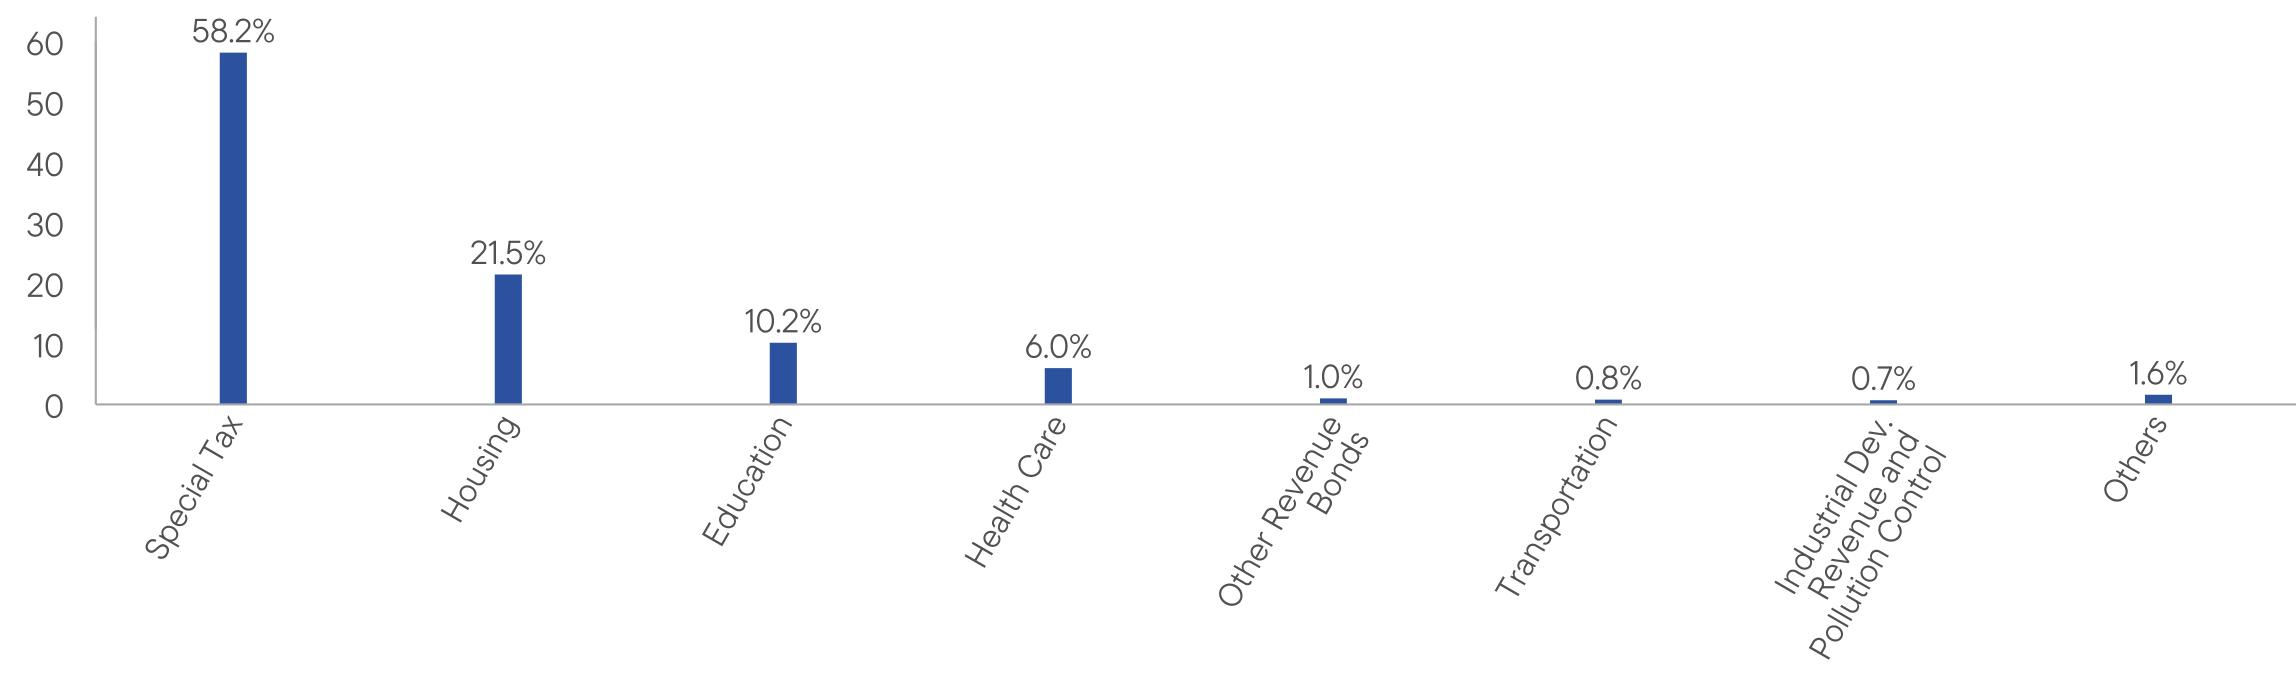
WHAT DID THE FUND INVEST IN? (as of August 31, 2026)
Portfolio Composition* (% of Total Investments)
HOW HAS THE FUND CHANGED?
Effective June 30, 2026, Daniel Workman was added as a portfolio manager of the Fund and John Wiley stepped down as a portfolio manager of the Fund.
This is a summary of certain changes to the Fund since September 1, 2025. For more complete information, you may review the Fund’s current prospectus and any applicable supplements and the Fund’s next prospectus, which we expect to be available by January 1, 2027, at https://www.franklintempleton.com/regulatory-fund-documents or upon request at (800) DIAL BEN/342-5236 or prospectus.us.franklintempleton@fisglobal.com.
WHAT WERE THE FUND COSTS FOR THE LAST YEAR? (based on a hypothetical $10,000 investment)
|
Fund Name
|
Costs of a $10,000 investment
|
Costs paid as a percentage of a $10,000 investment*
|
|
Franklin Templeton SMACS: Series E1
|
$0
|
0.00%
|
HOW DID THE FUND PERFORM LAST YEAR AND WHAT AFFECTED ITS PERFORMANCE?
For the twelve months ended August 31, 2026, Franklin Templeton SMACS: Series E returned 21.07%. The Fund compares its performance to the MSCI USA High Dividend Yield Index, which returned 19.72% for the same period.
PERFORMANCE HIGHLIGHTS
|
Top contributors to performance:
|
|
|
↑
|
Information technology (IT), energy and health care sectors led absolute returns during the period.
|
|
↑
|
Marvell Technology added value within IT, while Albemarle and SLB contributed within materials and energy, respectively.
|
|
↑
|
Stock selection within materials assisted relative returns, as did selection and underweight allocations to the consumer discretionary and consumer staples sectors.
|
|
Top detractors from performance:
|
|
|
↓
|
The consumer discretionary sector detracted from absolute returns.
|
|
↓
|
In terms of individual issuers, Nike hindered performance within consumer discretionary. Accenture and Oracle also detracted within IT.
|
|
↓
|
Relative returns were weakened by selection within the industrials and IT sectors, as well as selection and underweight exposure to health care companies.
|
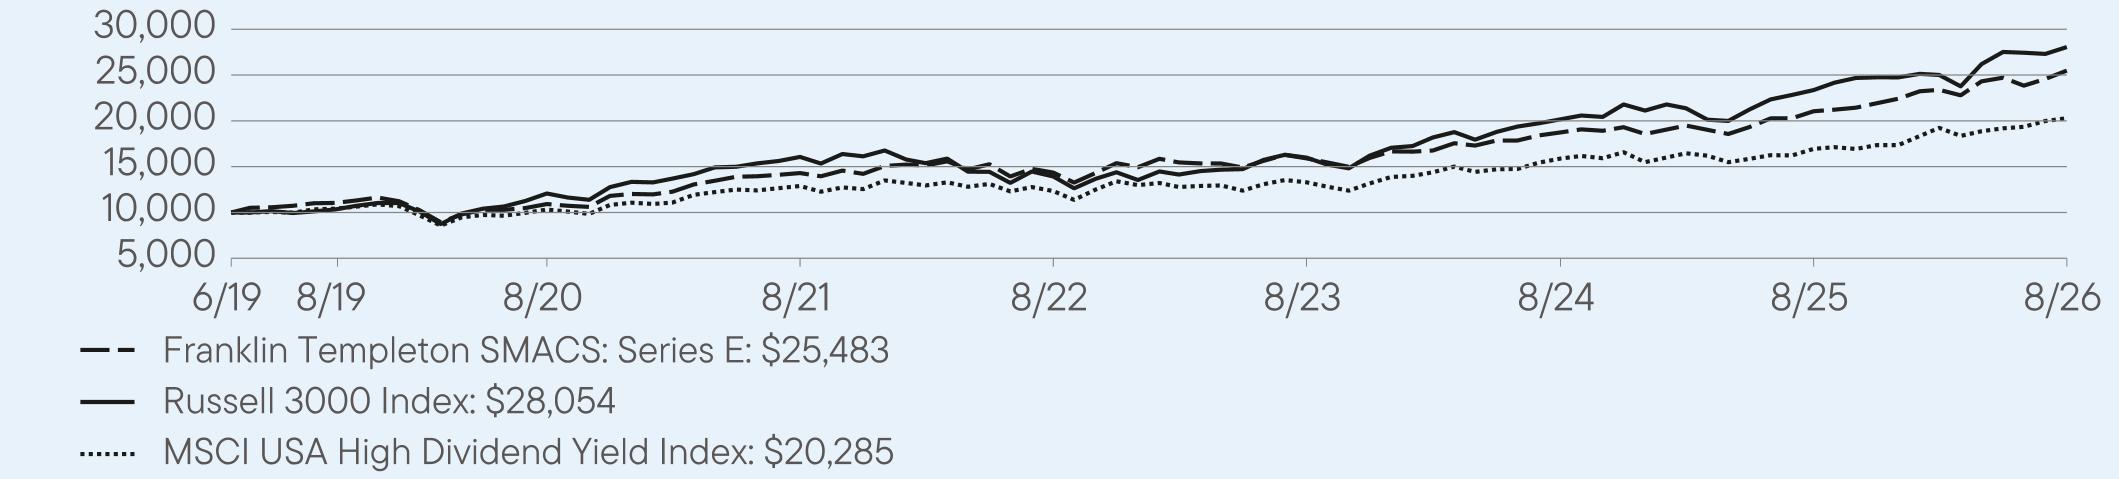
AVERAGE ANNUAL TOTAL RETURNS (%) Period Ended August 31, 2026
|
|
1 Year
|
5 Year
|
Since Inception
(6/3/2019) |
|
Franklin Templeton SMACS: Series E
|
21.07
|
12.25
|
13.78
|
|
Russell 3000 Index
|
20.10
|
11.80
|
16.42
|
|
MSCI USA High Dividend Yield Index
|
19.72
|
9.49
|
11.09
|
For current month-end performance, please call Franklin Templeton at (800) DIAL BEN/342-5236 or visit
https://www.franklintempleton.com/investments/options/mutual-funds.
https://www.franklintempleton.com/investments/options/mutual-funds.
Important data provider notices and terms available at www.franklintempletondatasources.com.
KEY FUND STATISTICS (as of August 31, 2026)
|
Total Net Assets
|
$692,470,284
|
|
Total Number of Portfolio Holdings
|
104
|
|
Total Management Fee Paid
|
$0
|
|
Portfolio Turnover Rate
|
131.33%
|
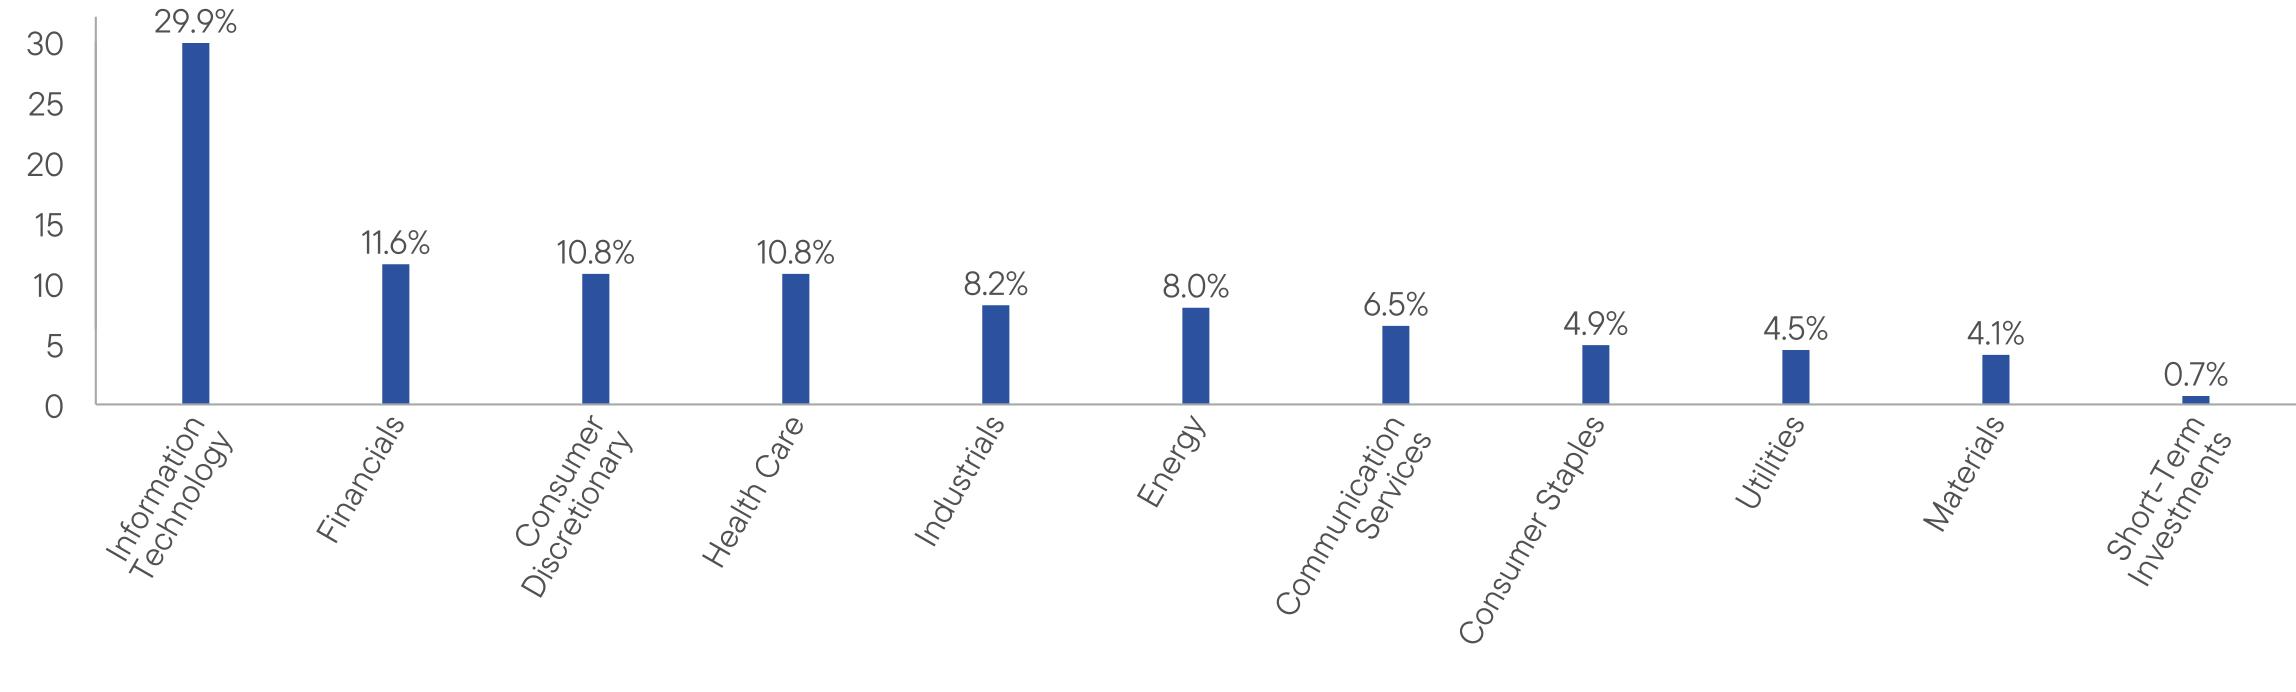
WHAT DID THE FUND INVEST IN? (as of August 31, 2026)
Portfolio Composition* (% of Total Investments)
WHAT WERE THE FUND COSTS FOR THE LAST YEAR? (based on a hypothetical $10,000 investment)
|
Fund Name
|
Costs of a $10,000 investment
|
Costs paid as a percentage of a $10,000 investment*
|
|
Franklin Templeton SMACS: Series H1
|
$0
|
0.00%
|
HOW DID THE FUND PERFORM LAST YEAR AND WHAT AFFECTED ITS PERFORMANCE?
For the twelve months ended August 31, 2026, Franklin Templeton SMACS: Series H returned 7.74%. The Fund compares its performance to the Bloomberg Municipal Bond Index, which returned 4.12% for the same period.
PERFORMANCE HIGHLIGHTS
|
Top contributors to performance:
|
|
|
↑
|
Security selection within bonds with no external credit rating
|
|
↑
|
Overweight exposure to bonds with 20 years to maturity
|
|
↑
|
Security selection within BBB rated bonds
|
|
Top detractors from performance:
|
|
|
↓
|
Overweight exposure to bonds with 10 years to maturity
|
|
↓
|
Security selection within AAA rated bonds
|
|
↓
|
Overweight exposure to bonds with 30 years to maturity
|
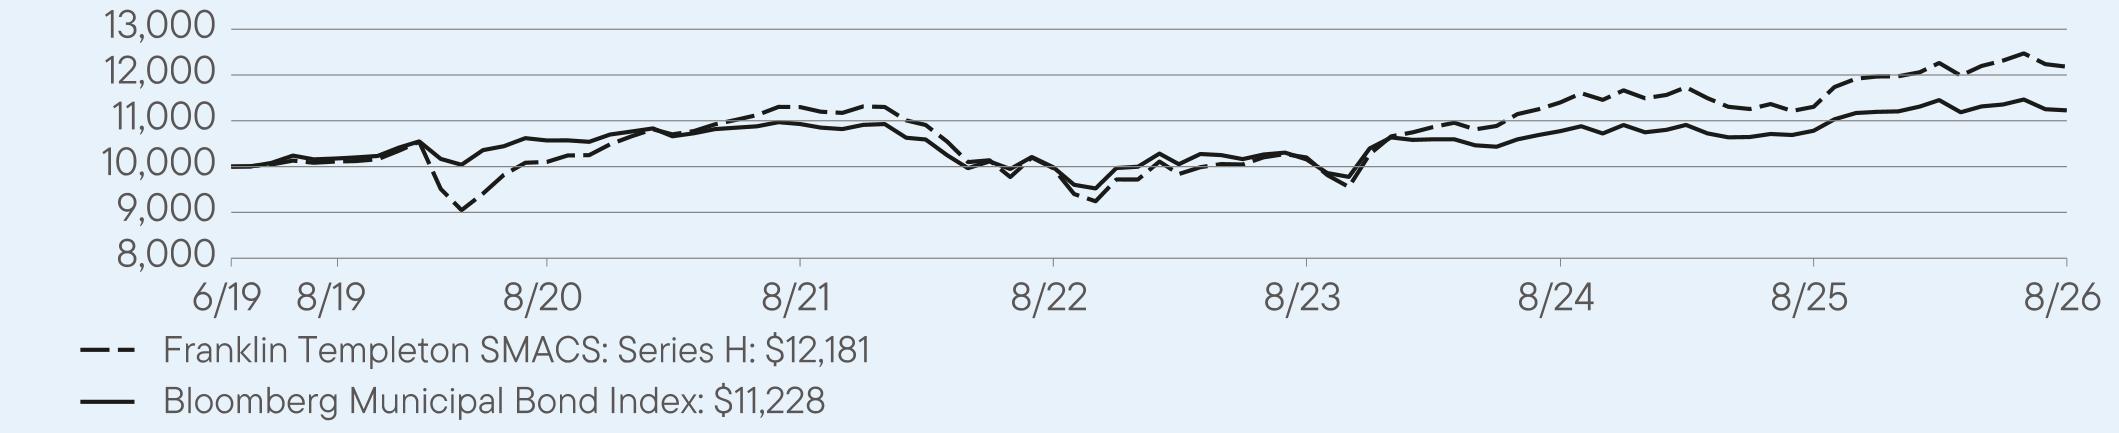
AVERAGE ANNUAL TOTAL RETURNS (%) Period Ended August 31, 2026
|
|
1 Year
|
5 Year
|
Since Inception
(6/3/2019) |
|
Franklin Templeton SMACS: Series H
|
7.74
|
1.51
|
2.76
|
|
Bloomberg Municipal Bond Index
|
4.12
|
0.54
|
1.65
|
For current month-end performance, please call Franklin Templeton at (800) DIAL BEN/342-5236 or visit
https://www.franklintempleton.com/investments/options/mutual-funds.
https://www.franklintempleton.com/investments/options/mutual-funds.
Important data provider notices and terms available at www.franklintempletondatasources.com.
KEY FUND STATISTICS (as of August 31, 2026)
|
Total Net Assets
|
$47,536,029
|
|
Total Number of Portfolio Holdings
|
272
|
|
Total Management Fee Paid
|
$0
|
|
Portfolio Turnover Rate
|
22.45%
|
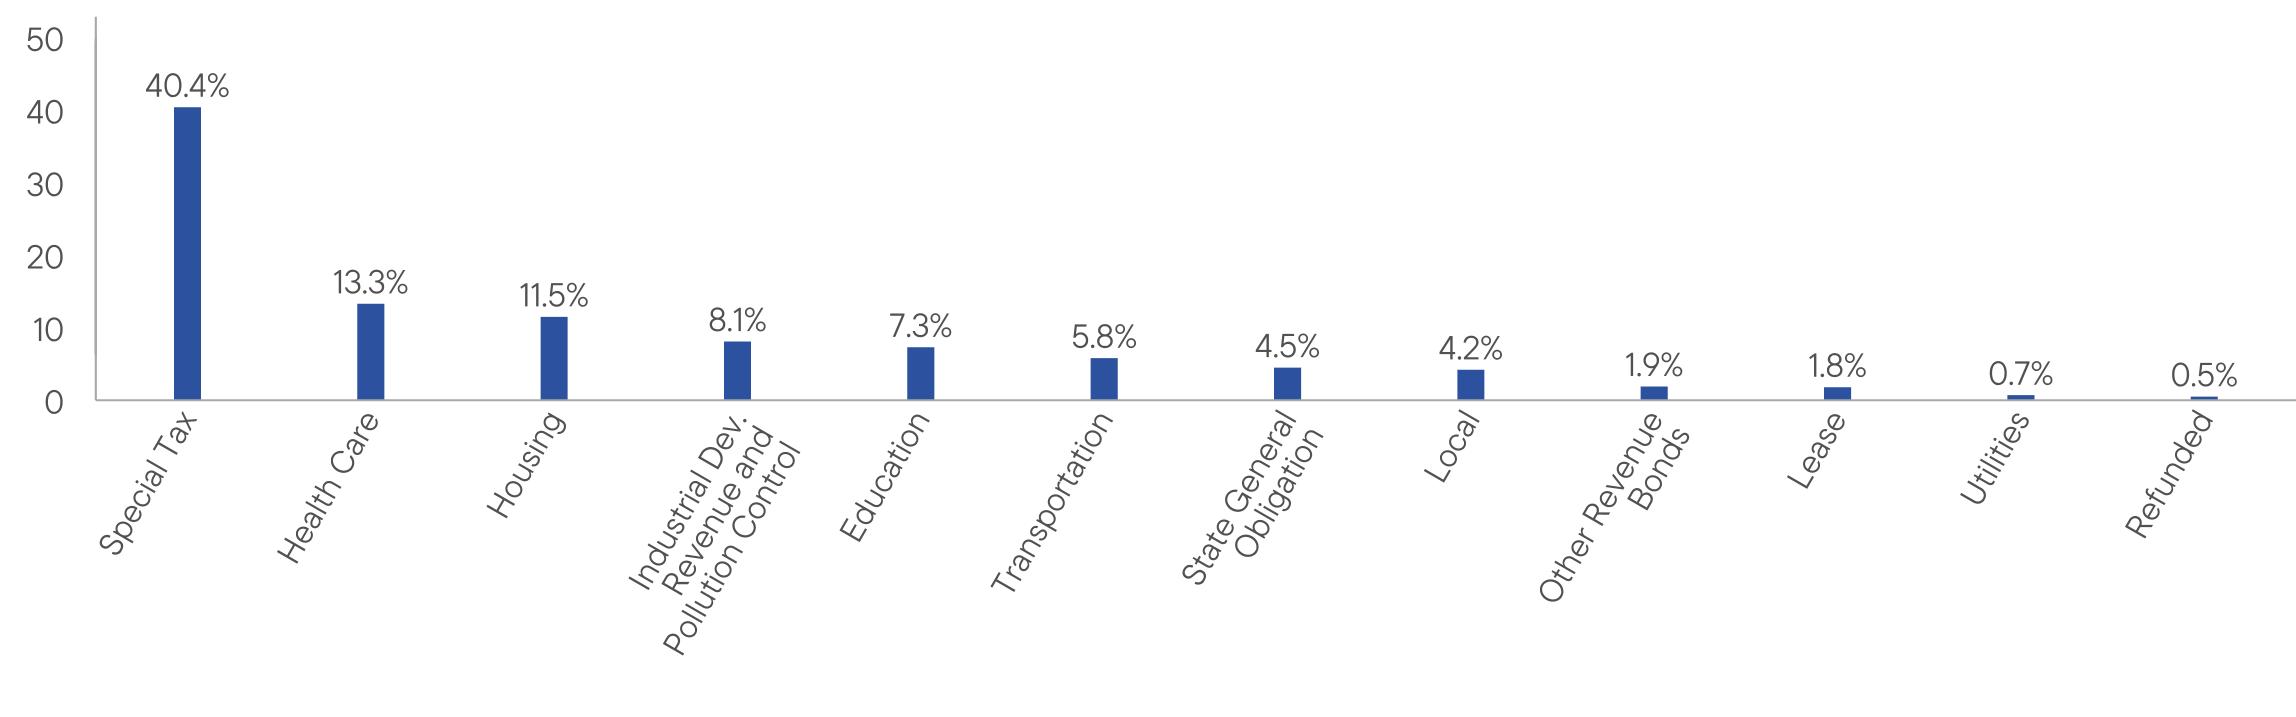
WHAT DID THE FUND INVEST IN? (as of August 31, 2026)
Portfolio Composition* (% of Total Investments)
WHAT WERE THE FUND COSTS FOR THE LAST YEAR? (based on a hypothetical $10,000 investment)
|
Fund Name
|
Costs of a $10,000 investment
|
Costs paid as a percentage of a $10,000 investment*
|
|
Franklin Templeton SMACS: Series I1
|
$0
|
0.00%
|
HOW DID THE FUND PERFORM LAST YEAR AND WHAT AFFECTED ITS PERFORMANCE?
For the twelve months ended August 31, 2026, Franklin Templeton SMACS: Series I returned 7.76%. The Fund compares its performance to the Bloomberg High Yield Very Liquid Index and the 50% Bloomberg High Yield Very Liquid Index and 50% Bloomberg U.S. Corporate Index, which returned 5.11% and 3.52%, respectively, for the same period.
PERFORMANCE HIGHLIGHTS
|
Top contributors to performance:
|
|
|
↑
|
Returns were driven by the health care and energy sectors, in addition to securitized products.
|
|
↑
|
Community Health Systems and Organon & Co. led returns within health care, while Venture Global Partners II contributed within energy.
|
|
↑
|
Relative performance benefited from selection and an overweight allocation to the health care sector. Security selection among information technology and energy companies also assisted returns.
|
|
Top detractors from performance:
|
|
|
↓
|
No sectors meaningfully detracted from absolute returns.
|
|
↓
|
FMC and Ardagh hindered returns within materials. Mauser Packaging Solutions also detracted from performance within industrials.
|
|
↓
|
Overweight exposure to securitized products weakened relative results, as did selection among the utilities and consumer discretionary sectors.
|
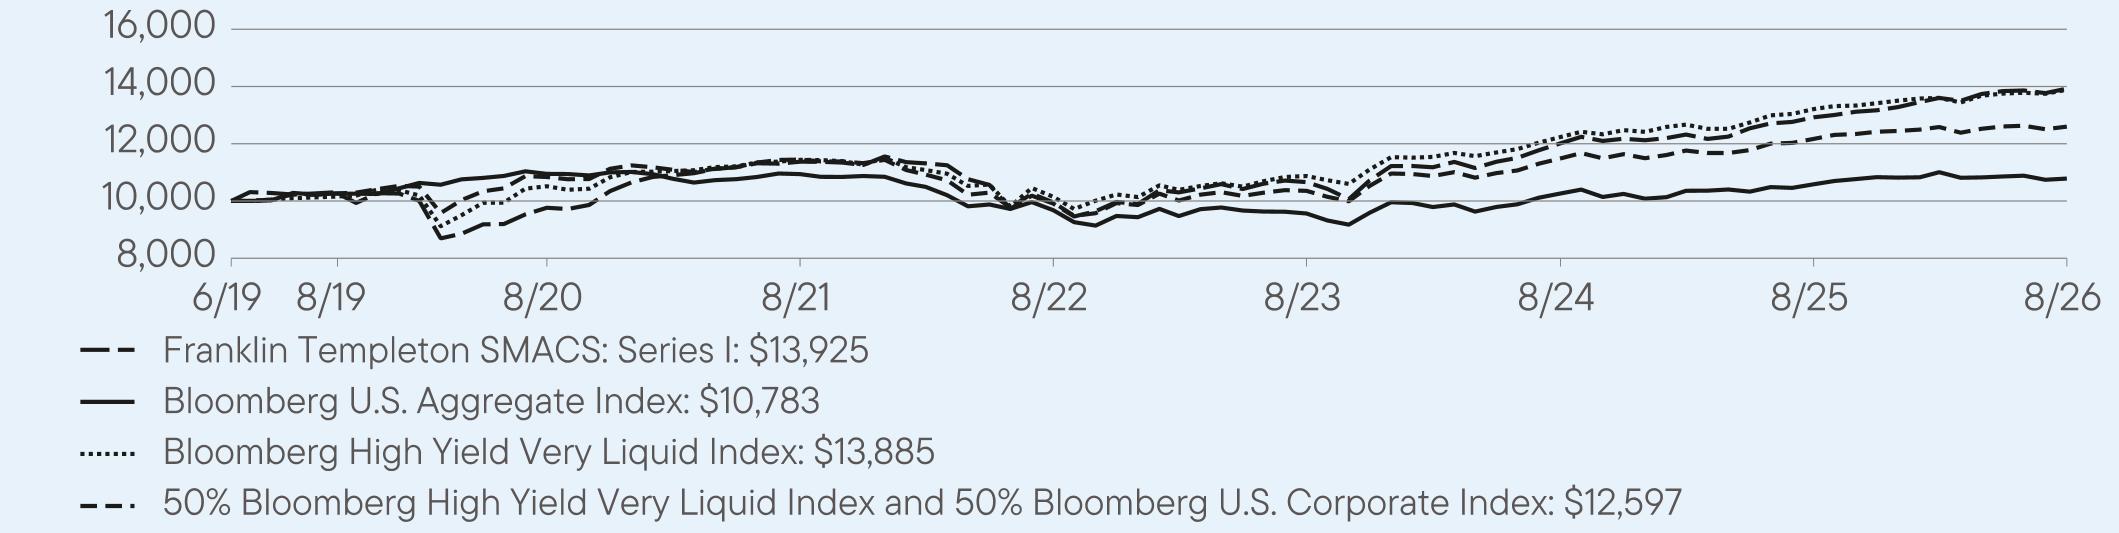
AVERAGE ANNUAL TOTAL RETURNS (%) Period Ended August 31, 2026
|
|
1 Year
|
5 Year
|
Since Inception
(6/3/2019) |
|
Franklin Templeton SMACS: Series I
|
7.76
|
4.13
|
4.68
|
|
Bloomberg U.S. Aggregate Index
|
1.89
|
-0.29
|
1.18
|
|
Bloomberg High Yield Very Liquid Index
|
5.11
|
3.96
|
5.02
|
|
50% Bloomberg High Yield Very Liquid Index and 50% Bloomberg U.S. Corporate Index
|
3.52
|
1.93
|
3.57
|
For current month-end performance, please call Franklin Templeton at (800) DIAL BEN/342-5236 or visit
https://www.franklintempleton.com/investments/options/mutual-funds.
https://www.franklintempleton.com/investments/options/mutual-funds.
Important data provider notices and terms available at www.franklintempletondatasources.com.
KEY FUND STATISTICS (as of August 31, 2026)
|
Total Net Assets
|
$989,611,101
|
|
Total Number of Portfolio Holdings
|
191
|
|
Total Management Fee Paid
|
$0
|
|
Portfolio Turnover Rate
|
33.18%
|
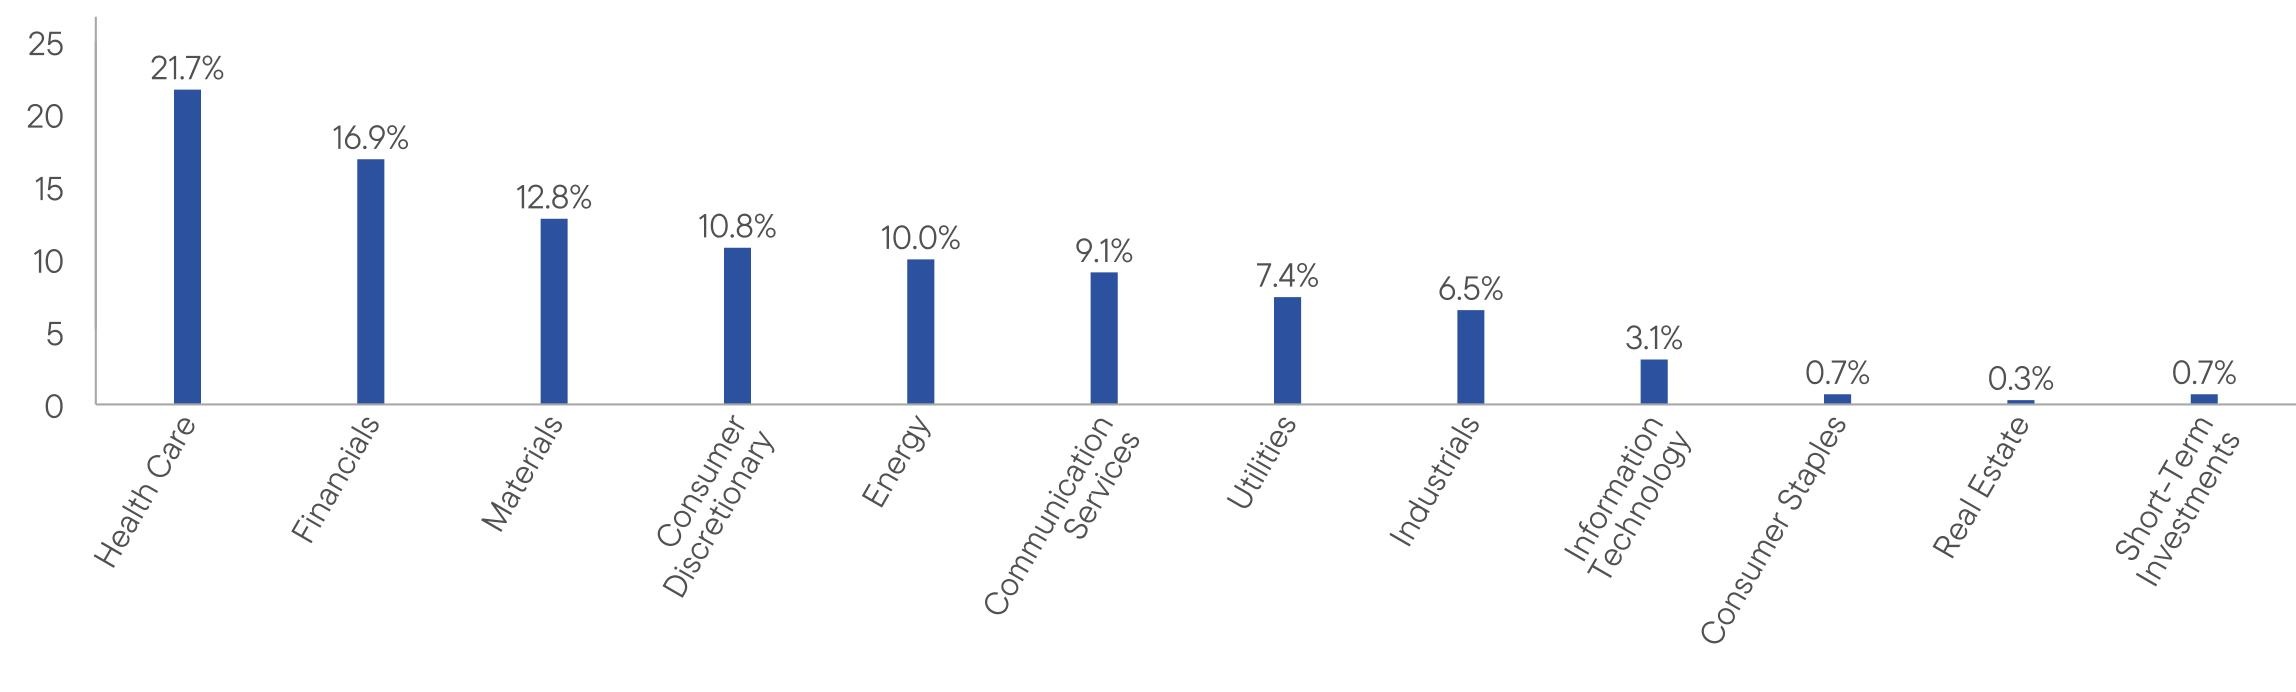
WHAT DID THE FUND INVEST IN? (as of August 31, 2026)
Portfolio Composition* (% of Total Investments)
| [1] |
|
||
| [2] |
|
||
| [3] |
|
||
| [4] |
|
||
| [5] |
|
||
| [6] |
|
||
| [7] |
|
||
| [8] |
|
||
| [9] |
|
||
| [10] |
|
||
| [11] |
|
||
| [12] |
|