The bar chart and performance table that follow provide some indication of the risks and variability of investing in the Equity Fund by showing the changes in the Fund’s performance from year-to-year for the last ten calendar years, and by showing how the Fund’s average annual total returns for 1, 5 and 10 years compare with those of a broad measure of market performance. Prior to October 28, 2020, the Fund offered Class I Shares identified by TICKER: CALEX. On October 28, 2020, all existing Class I Shares of the Fund were converted into the current class of shares of the Fund identified by TICKER: DIVHX (previously named Class II Shares). After October 28, 2020 Class I Shares were no longer offered by the Fund. The bar chart and performance table show changes in the year-to-year performance of shares of the Equity Fund and include the historical performance of Class I Shares. The current share class of the Fund (TICKER: DIVHX) would have substantially similar returns to the Class I Shares because the shares are invested in the same portfolio of securities and the annual returns would differ only to the extent that the classes do not have the same expenses.
The Equity Fund’s performance in the past is not necessarily an indication of how the Fund will perform in the future. Updated performance information, current to the most recent month end, is available by calling 1-888-CUTLER4 (1-888-288-5374).
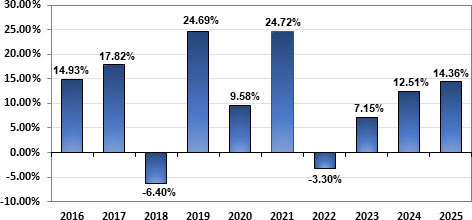
The Equity Fund’s 2026 year-to-date total return through September 30, 2026 is 9.49%.
During the periods shown in the bar chart, the highest quarterly return was 14.44% during the quarter ended December 31, 2022 and the lowest quarterly return was -19.42% during the quarter ended March 31, 2020.
After-tax returns are calculated using the historical highest individual federal marginal income tax rates and do not reflect the impact of state and local taxes. Actual after-tax returns depend on an investor’s tax situation and may differ from those shown. After-tax returns shown are not relevant to investors who hold their fund shares through tax-deferred arrangements, such as 401(k) plans or individual retirement accounts (IRAs). Return After Taxes on Distributions and Sale of Fund Shares may be higher than other returns for the same period due to a tax benefit of realizing a capital loss on the sale of Fund shares.
| 1 Year | 5 Years | 10 Years | |
| Equity Fund | |||
| Return Before Taxes | 14.36% | 10.71% | 11.16% |
| Return After Taxes on Distributions | 12.93% | 9.29% | 9.90% |
| Return
After Taxes on Distributions and Sale of Fund Shares |
9.52% | 8.31% | 8.95% |
| Standard
& Poor’s 500 Index (S&P 500® Index)(1) (reflects no deduction for fees, expenses or taxes) |
17.88% | 14.42% | 14.82% |
| Standard
& Poor’s 500 Value Index (S&P 500® Value Index)(2) (reflects no deduction for fees, expenses or taxes) |
13.19% | 12.96% | 11.73% |
| (1) | The S&P 500® Index is a market capitalization weighted index of 500 large U.S. companies chosen for market size, liquidity and industry group representation and includes reinvested dividends. The index is unmanaged and is widely used as a barometer of U.S. stock market performance. An investor cannot invest in an index and its returns are not indicative of the performance of any specific investment. |
| (2) | The S&P 500® Value Index measures value stocks using three factors: the ratios of book value, earnings, and sales to price. Constituents are drawn from the S&P 500® Index. The index is unmanaged. An investor cannot invest in an index and its returns are not indicative of the performance of any specific investment. |